
UMAMI-USD (Umami Finance) Technical & Rank Outlook — Neutral Stance (18-Feb-2026)
Umami Finance (UMAMI-USD) currently screens as Neutral across the KGNAI ranking framework, with technical confirmation also clustering near flat. In a universe of 800 crypto instruments, the daily rank #350 suggests mid-pack positioning rather than clear leadership or laggard status. Trend context leans softer: the close vs MA50 is Bearish and MA50 vs MA200 is Bearish, while momentum is conflicted—RSI(14) at 20.73 flags stress conditions even as MACD histogram 0.0099 hints at a modest turn attempt. Volatility remains notable with Bollinger Bandwidth at 0.5399, making level discipline more important than narrative. The key decision zone is defined by support ~0.4733 and resistance ~1.0644, with broader market/sector news sentiment reading as Neutral (avg 0.018).
- Rank stance (Short / Mid / Long): Neutral / Neutral / Neutral (daily #350, weekly #444, 3-month #494 out of 800)
- Technical confluence: Neutral (18-signal confluence -0.056; overall technical score -0.001)
- Key levels: Support ~ 0.4733 | Resistance ~ 1.0644
- News sentiment bias: Neutral (avg 0.018; 6% positive / 88% neutral / 6% negative)
- Confirmation / invalidation: Break above 1.0644 with volume supports continuation; close below 0.4733 elevates deterioration risk
What KGNAI Measures
KGNAI ranks instruments by relative positioning across large universes, emphasizing how a ticker behaves versus peers rather than in isolation. Technical confluence evaluates whether independent signals align, helping distinguish coherent trends from mixed, regime-dependent behavior. Ranking changes are monitored for persistence to reduce sensitivity to one-off moves.
How to Read This Report
- Ranks are comparative (not absolute forecasts) across the stated universe size.
- Confluence summarizes agreement across multiple signals (RSI, MACD, Bollinger Bands, volume-flow proxies).
- Support/resistance levels act as decision zones where risk management is typically most actionable.
- Sentiment provides contextual bias and can diverge from price/technicals without resolving immediately.
1) KGNAI AI Analysis
Region: CRYPTO
Total universe size: 800 ranked instruments
- Daily rank: #350 out of 800 — Neutral
- Weekly rank: #444 out of 800 — Neutral
- Monthly rank: #364 out of 800 — Neutral
- 3-Monthly rank: #494 out of 800 — Neutral
UMAMI-USD sits in the middle portion of the ranked crypto universe, with the daily rank #350 and monthly rank #364 pointing to broadly consistent short-to-intermediate positioning. The weaker weekly rank #444 and 3-month rank #494 imply that, over longer sampling windows, the asset has not exhibited the steadier “favorable behavior” characteristics typically associated with upper-quartile cohorts.
The practical implication is a profile where edge is limited unless other layers (trend, momentum, levels, participation) begin to align. In KGNAI framing, a Neutral rank is less a directional call and more a statement that the instrument is not currently separating itself from the broader distribution of outcomes in the 800-name universe. That interpretation is reinforced by the later blended technical read (overall -0.001, Neutral), which does not provide strong confirmation to override the ranking layer.
From a regime perspective, the dispersion between #350 (daily) and #494 (3-month) is meaningful: it suggests recent stabilization relative to a softer longer-run backdrop. Neutral labels across short-, mid-, and long-term views reduce the probability that a single horizon is carrying the entire thesis.
Term view: Short-term: Neutral. Mid-term: Neutral. Long-term: Neutral.
Want the full universe and complete rank tables? Unlock full access on KGNAI: https://www.kgnai.com/pricing
2) Price & trend overview
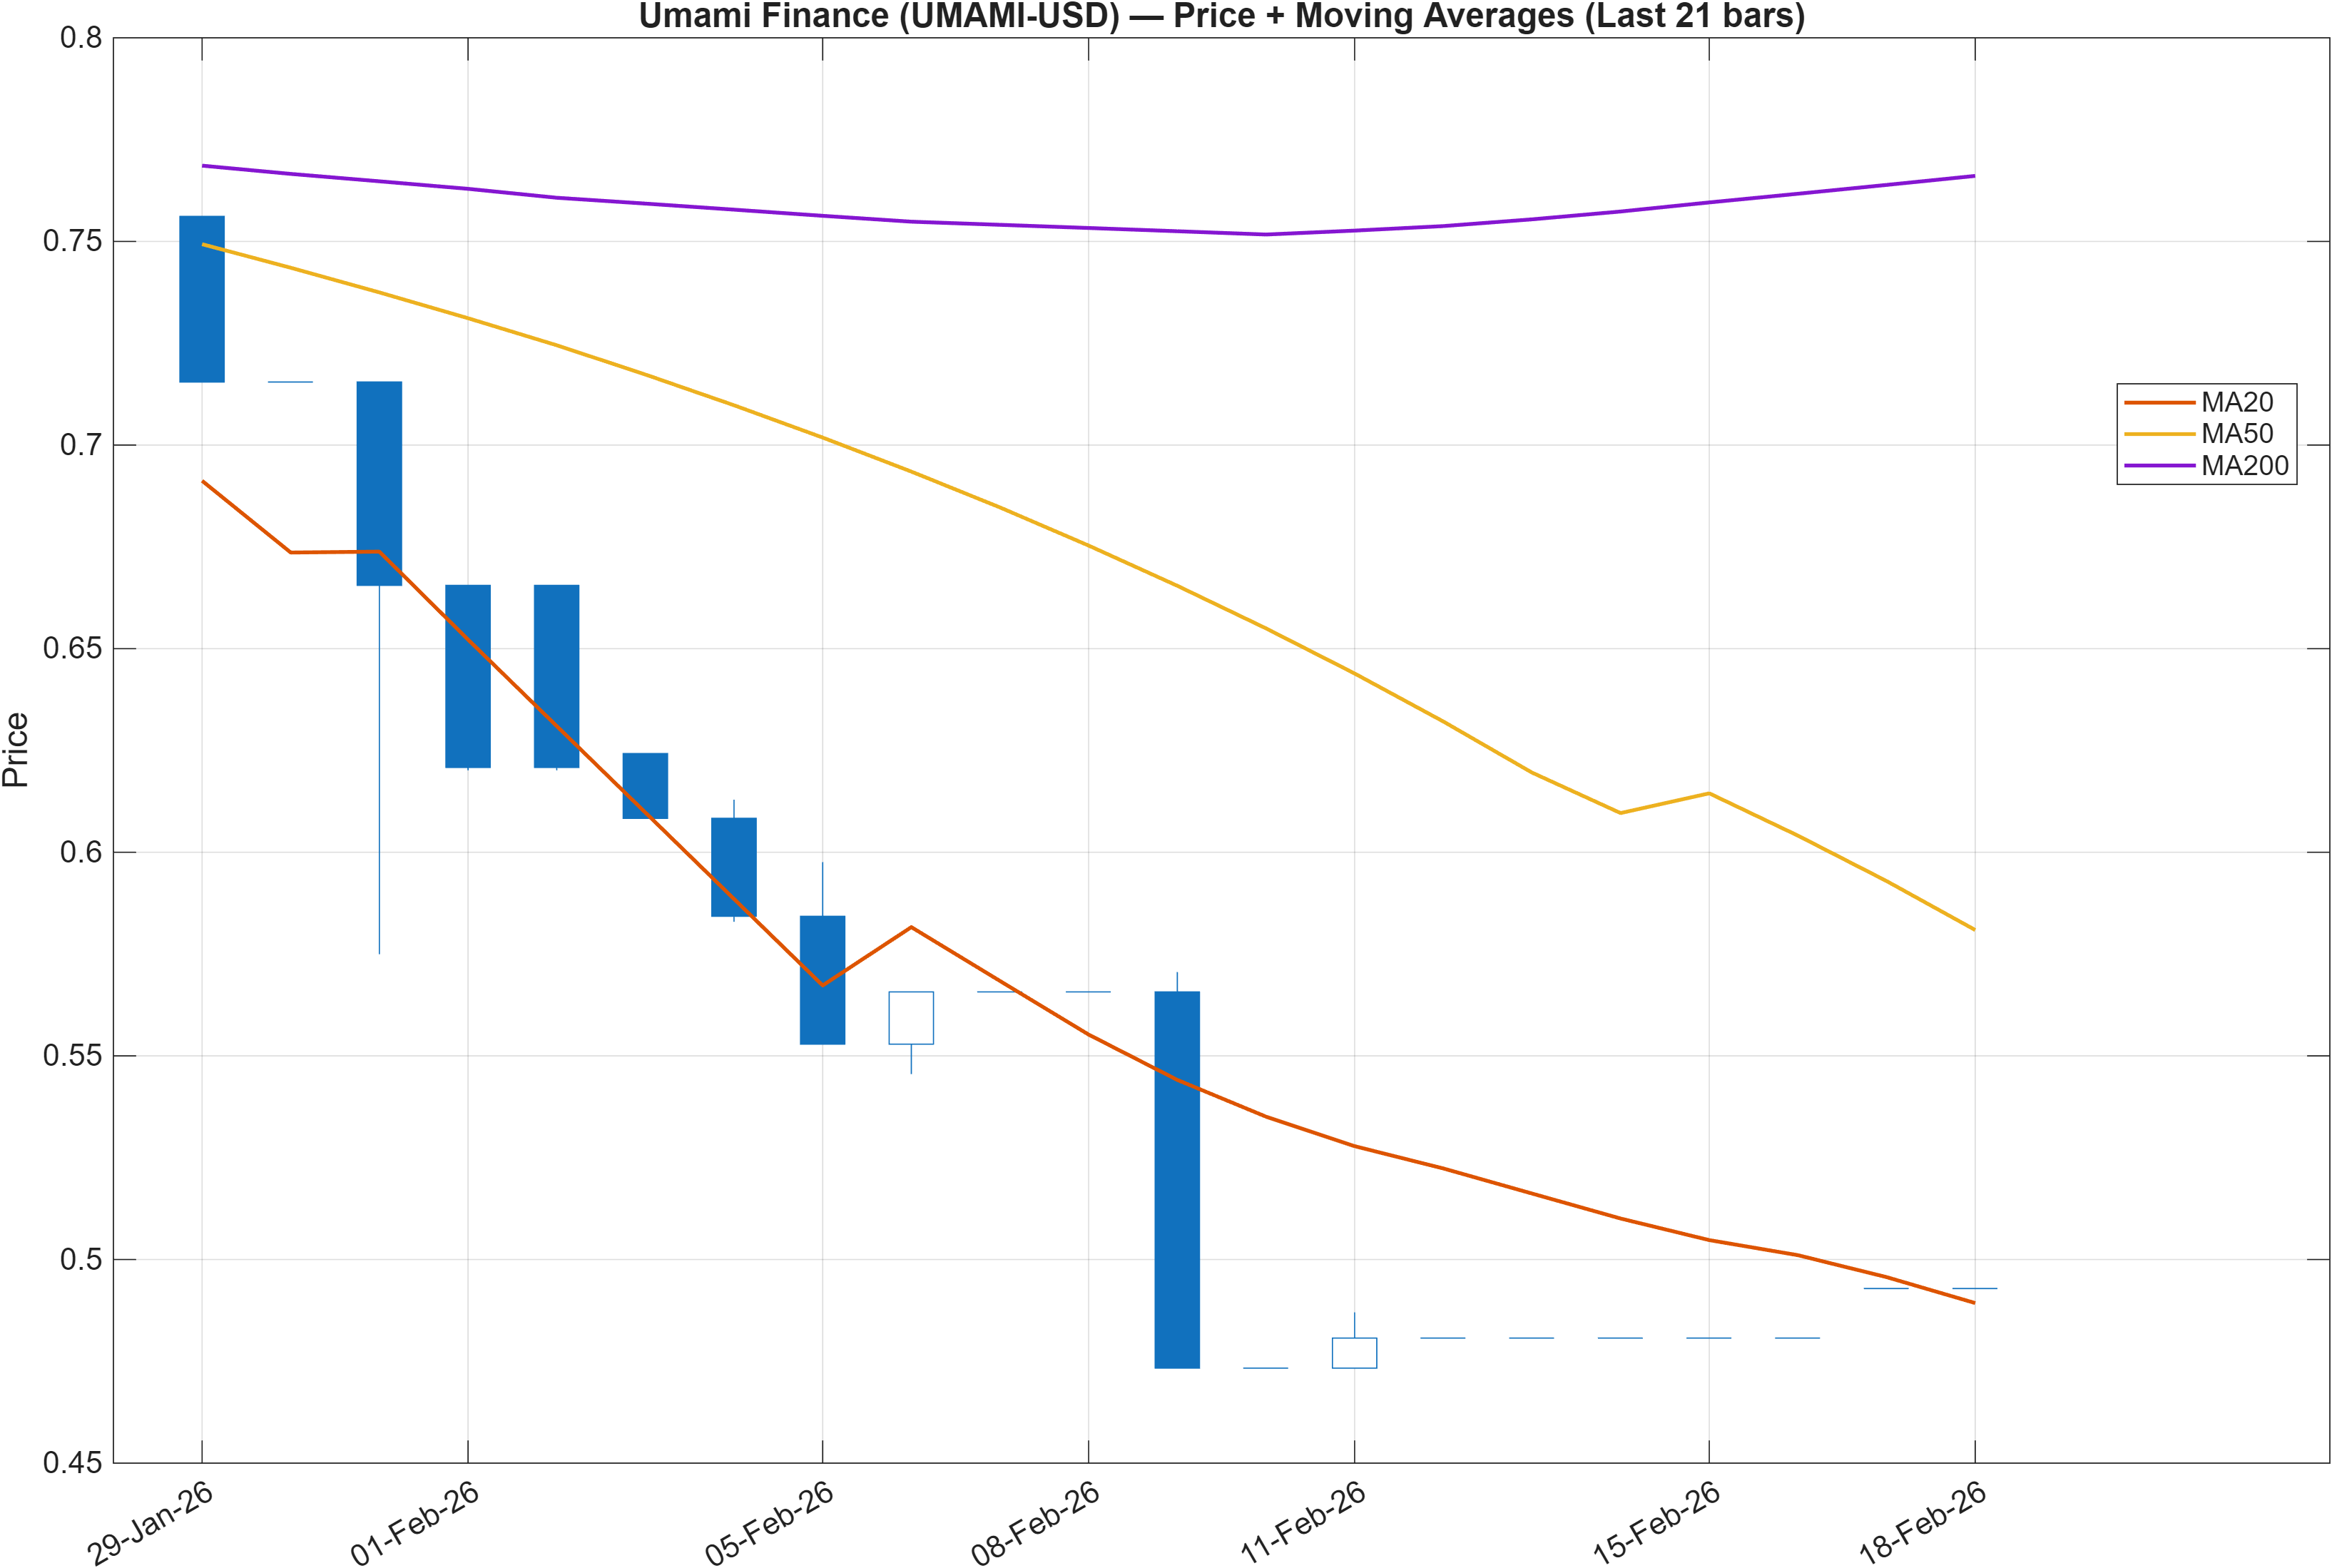
Interpretation: Close vs MA50 = Bearish, MA50 vs MA200 = Bearish.
The trend layer is presently tilted to the downside: the close vs MA50 is Bearish, and the MA50 vs MA200 is Bearish. In combination, this usually characterizes a market where rallies face overhead supply and where medium-term trend structure remains compressed beneath longer-term trend reference points.
What keeps the assessment from turning outright Bearish is the broader cross-check with the ranking layer—daily rank #350 is not consistent with the weakest tail of the universe—and the mixed momentum read (MACD histogram slightly positive at 0.0099, discussed below). That mix can occur when a downtrend is still dominant but incremental selling pressure is no longer accelerating at the same rate.
Trend-following frameworks typically seek either (a) price reclaiming the MA50 while MA50 begins to flatten/turn, or (b) a cleaner basing process near a major level. Here, the nearest anchored “decision” references remain the support ~0.4733 and resistance ~1.0644. Until price action and participation begin to confirm one side, the more defensible framing is a Neutral trend posture with bearish tilt, rather than a directional conclusion.
3) Momentum & volatility dashboard
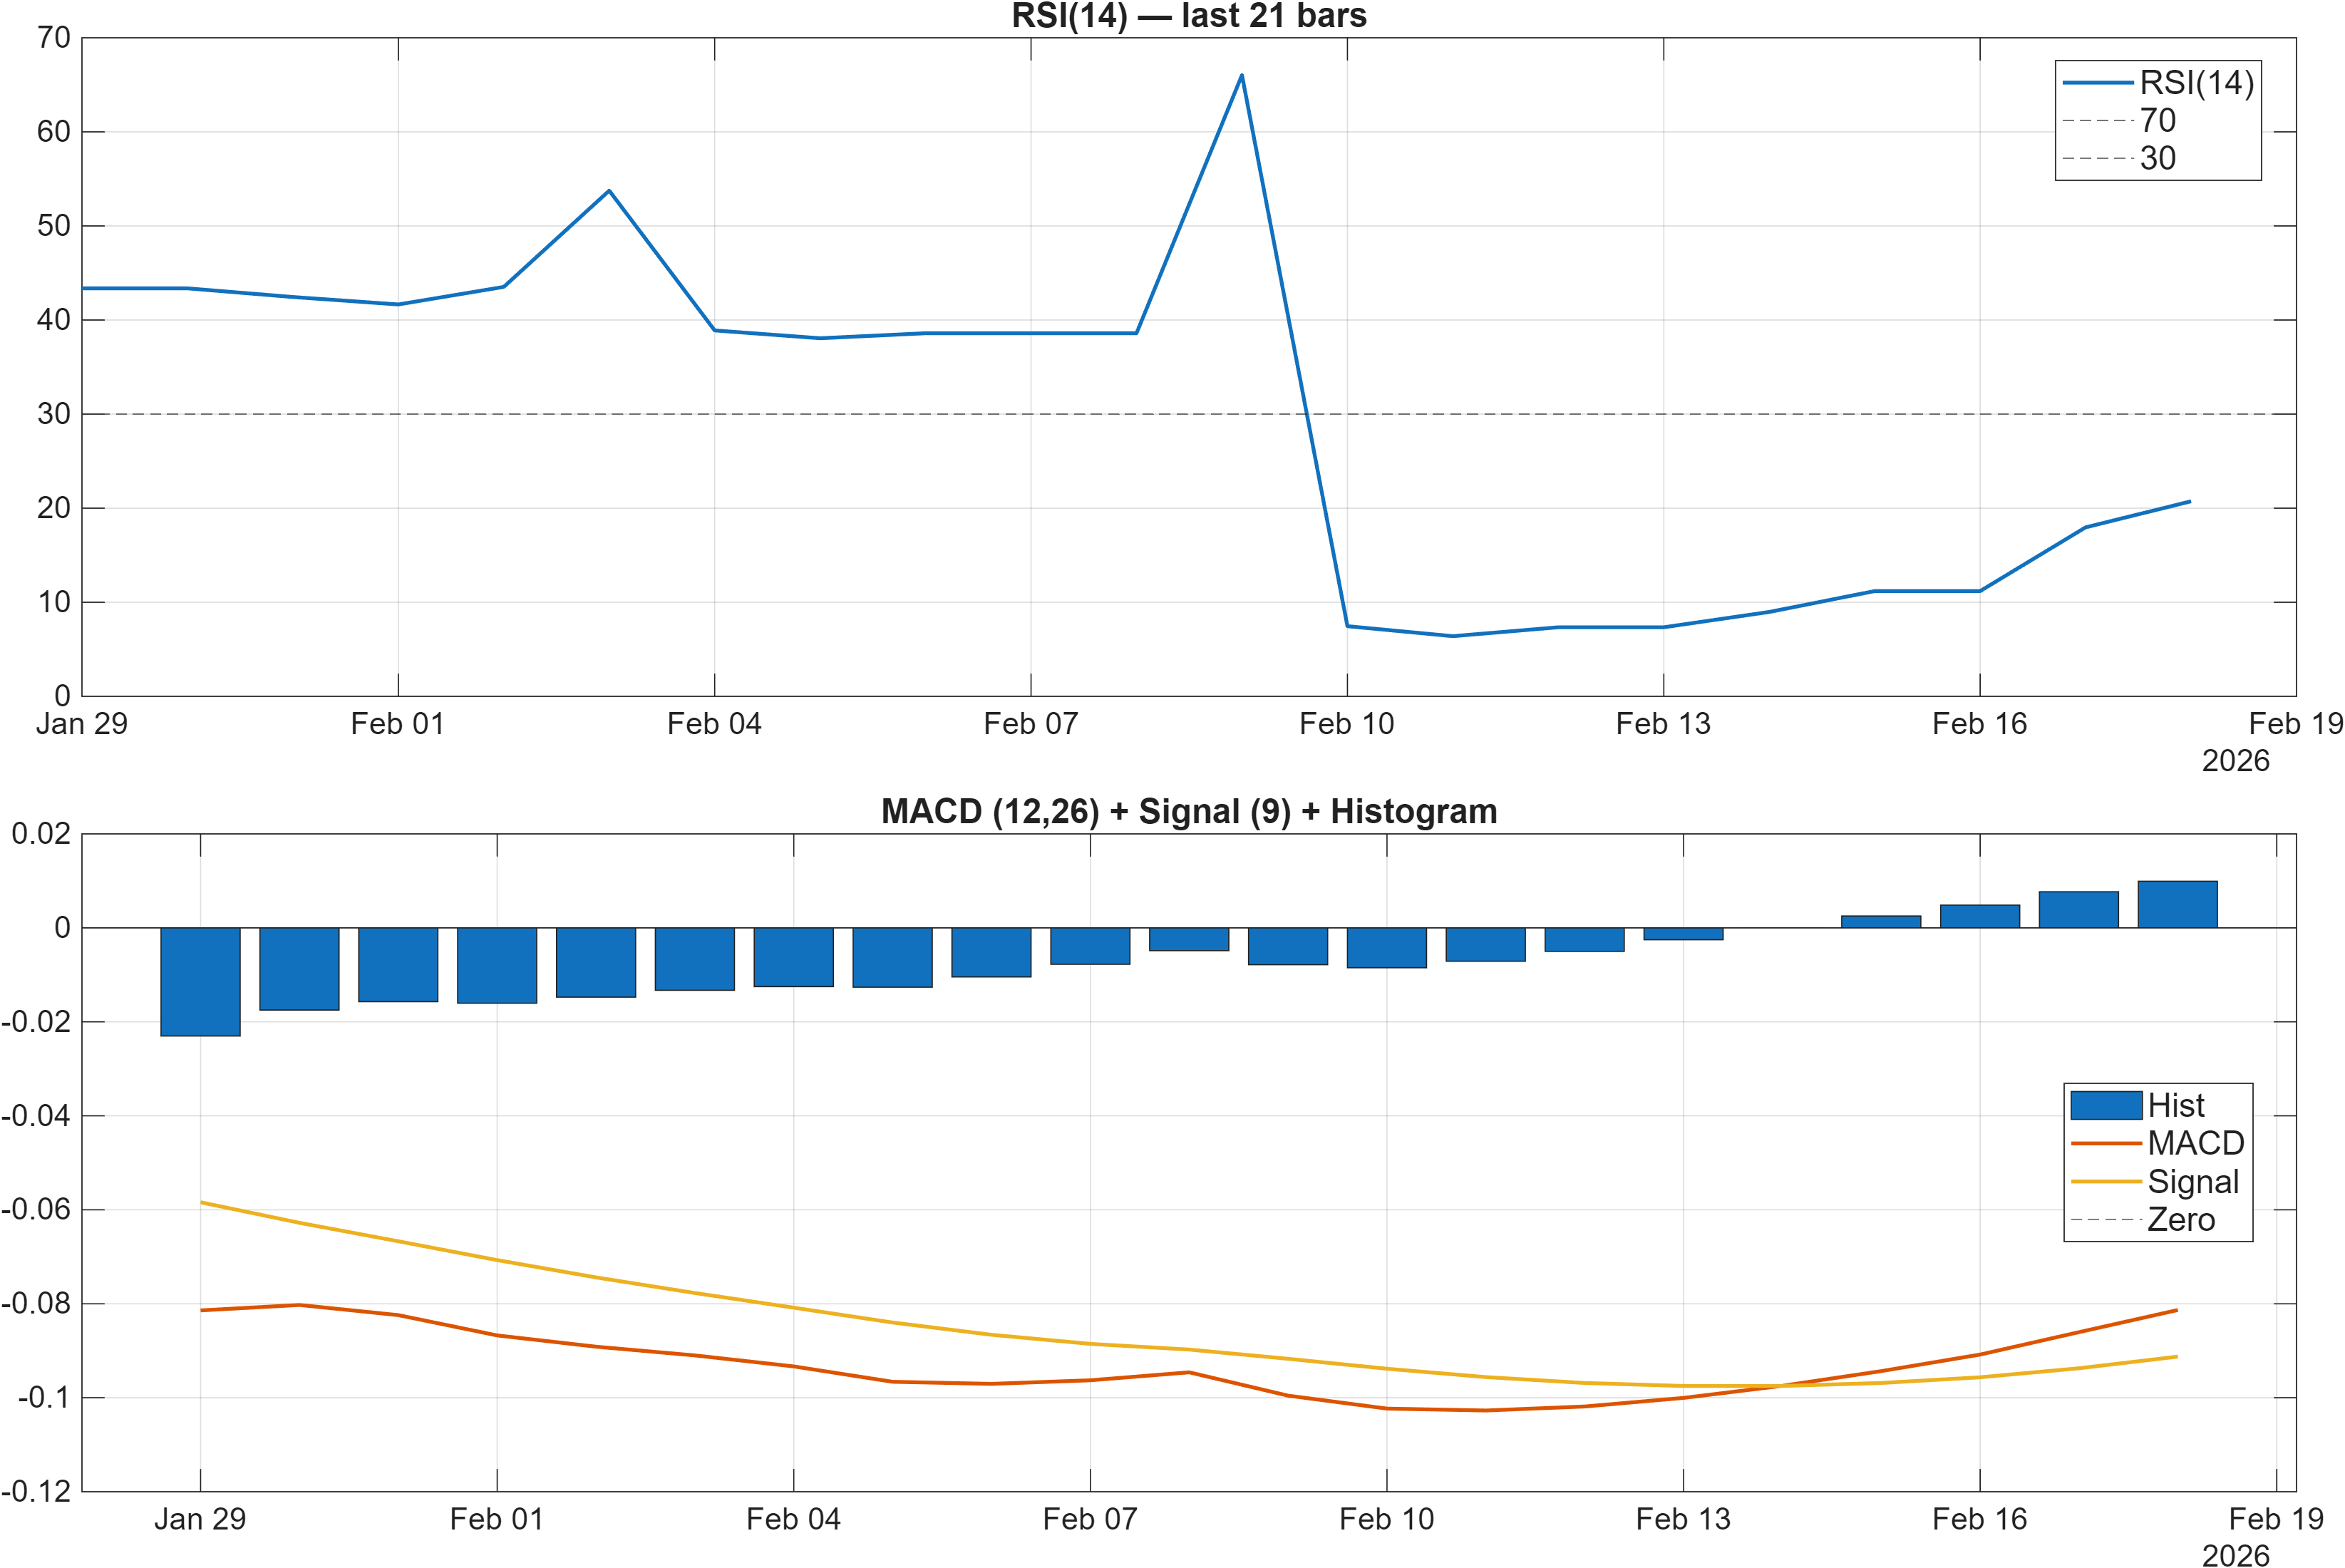
Interpretation: RSI bias = Bearish, MACD hist = 0.0099.
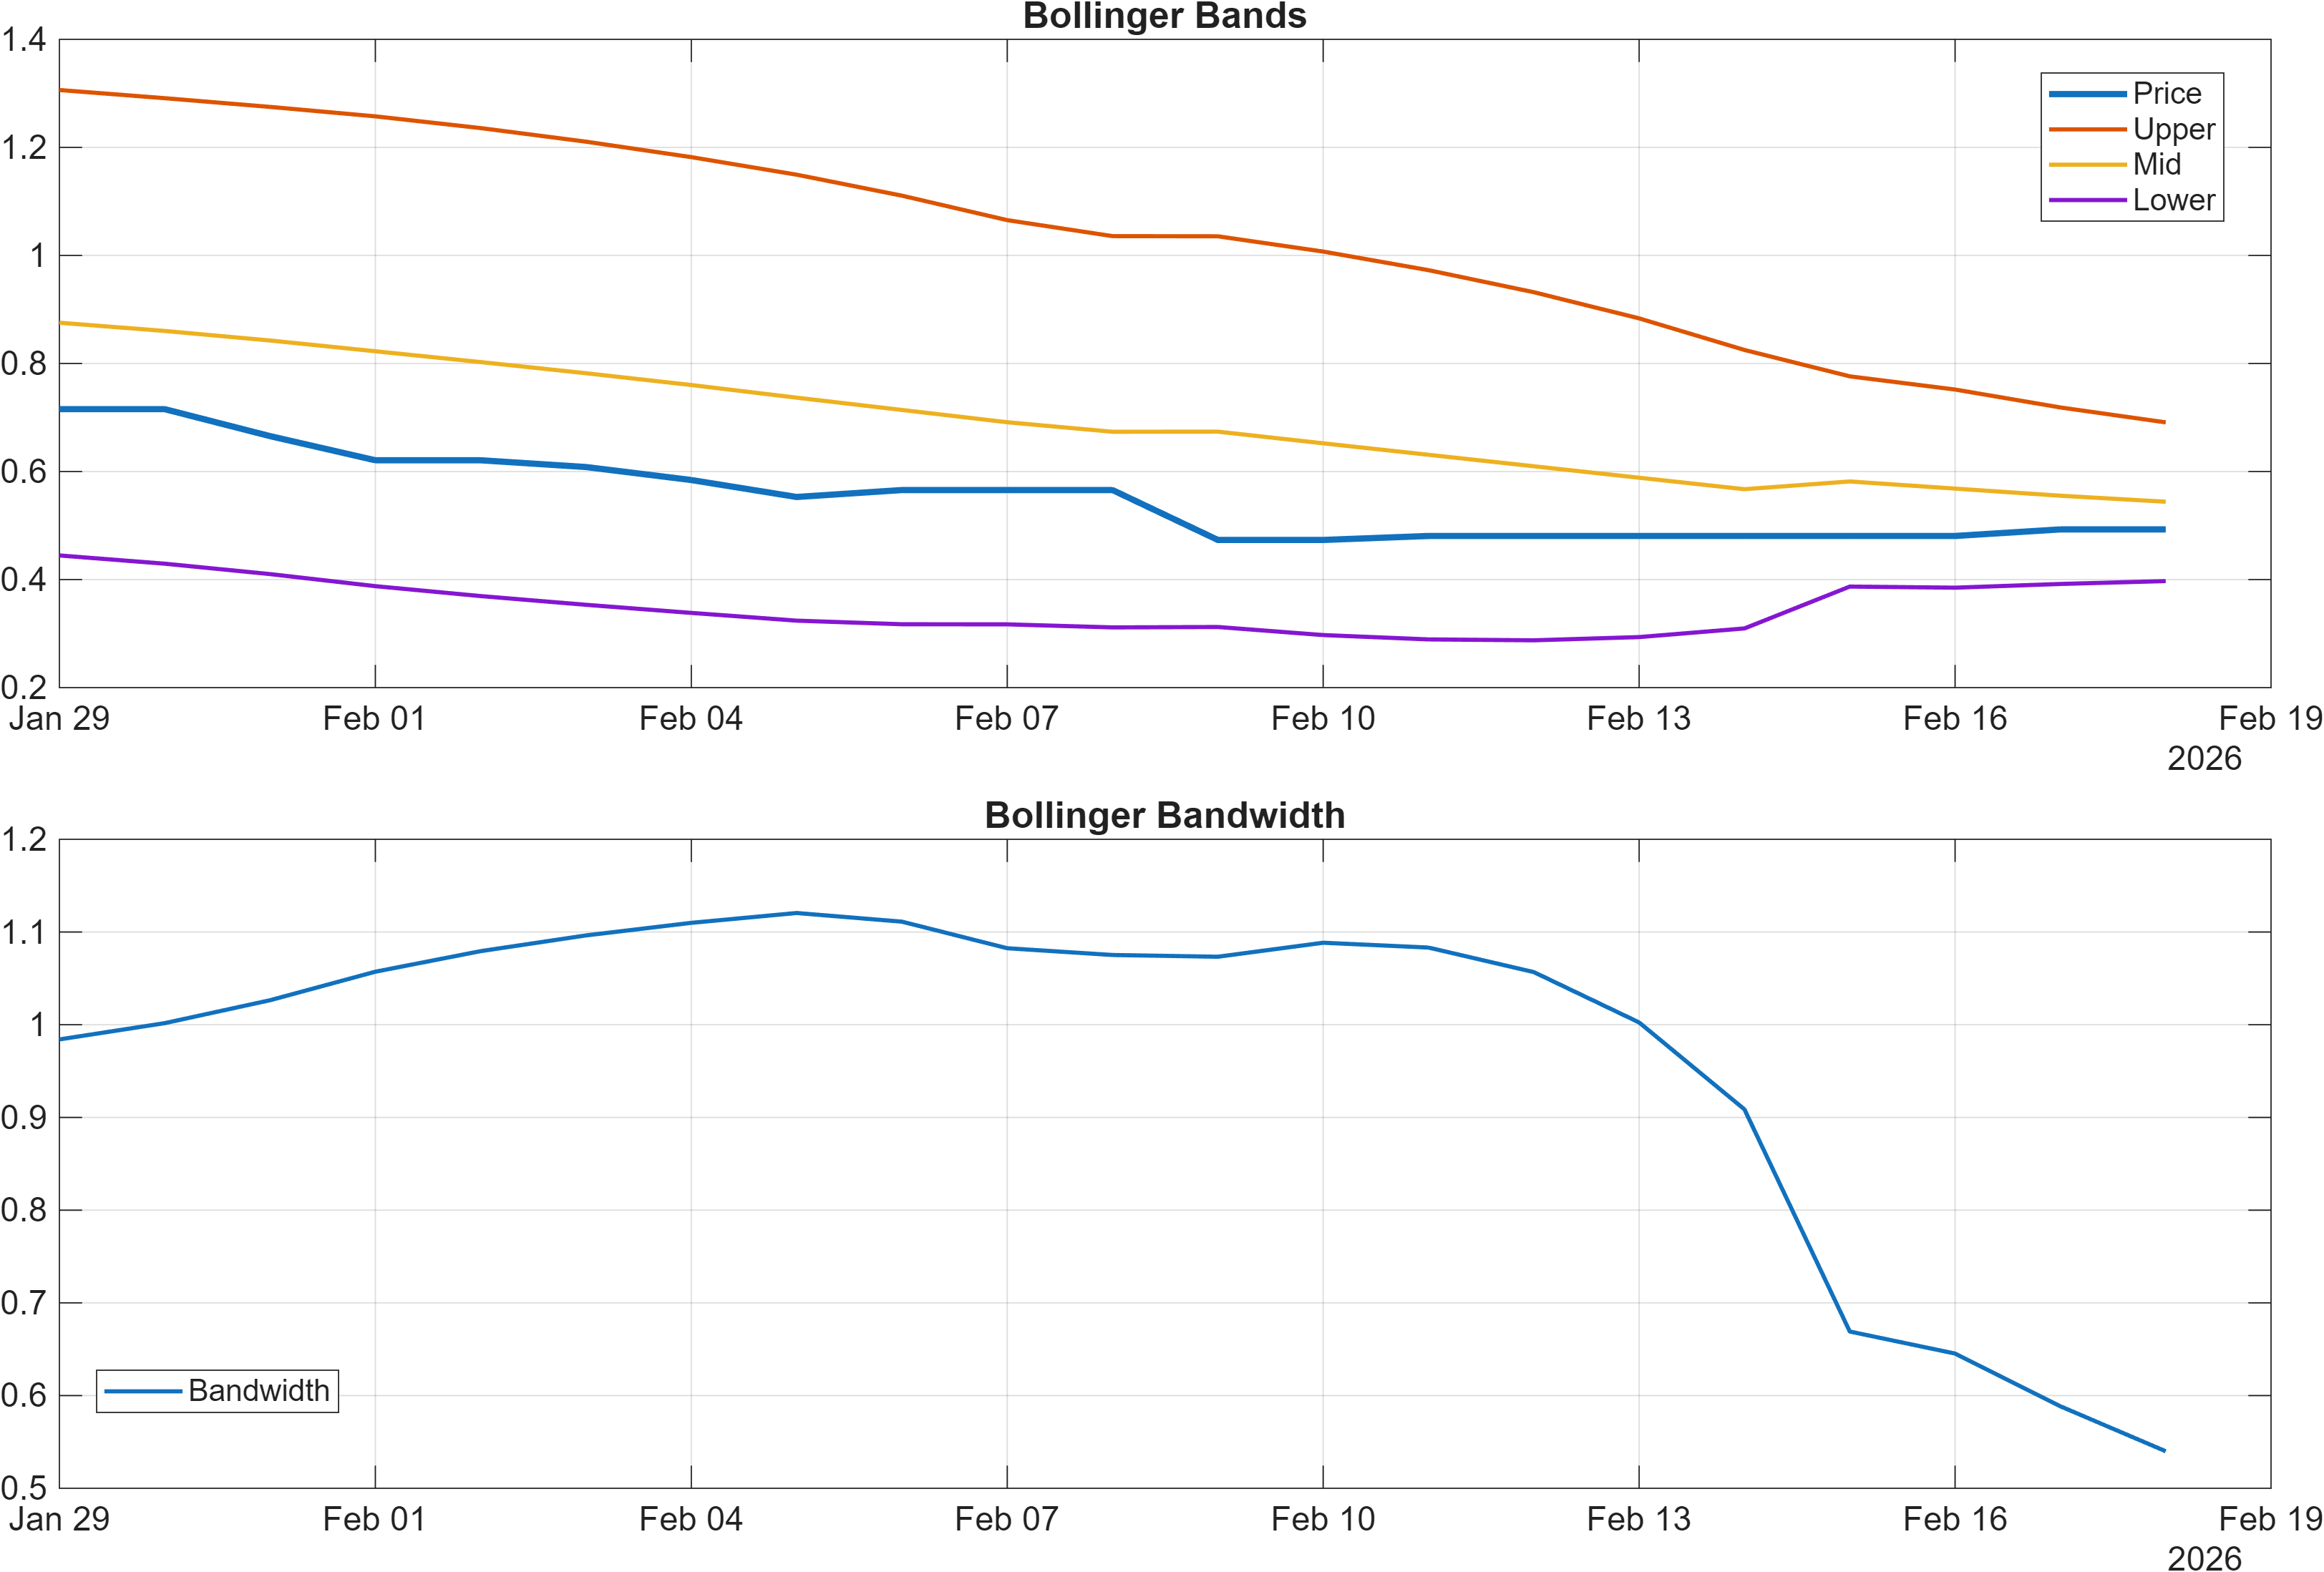
Interpretation: Bandwidth (volatility regime) latest = 0.5399.
Momentum readings are not synchronized. On one hand, RSI(14) at 20.73 is flagged as Bearish and sits in a stress zone that often coincides with persistent downside pressure rather than stable mean reversion. On the other hand, MACD histogram at 0.0099 is marginally positive, a configuration that can emerge during early stabilization attempts—even while broader trend remains bearish (close below MA50).
The volatility context matters because signal reliability changes as regimes shift. With Bollinger Bandwidth at 0.5399, the market is not presenting as a low-volatility grind; instead, it implies wider dispersion of outcomes around key levels. In such environments, whipsaws are more common, and isolated oscillator readings can flip quickly without altering the larger structure.
A useful way to reconcile the dashboard is to treat it as a “compression vs. confirmation” check: if MACD improvement persists while RSI recovers from 20.73 and price begins to challenge the 1.0644 resistance zone, the probability of a regime transition increases. Conversely, if RSI remains pinned and volatility stays elevated, the small positive MACD histogram may represent only a brief pause within a still-weak tape.
4) Support / Resistance zones
Support ~ 0.4733 | Resistance ~ 1.0644
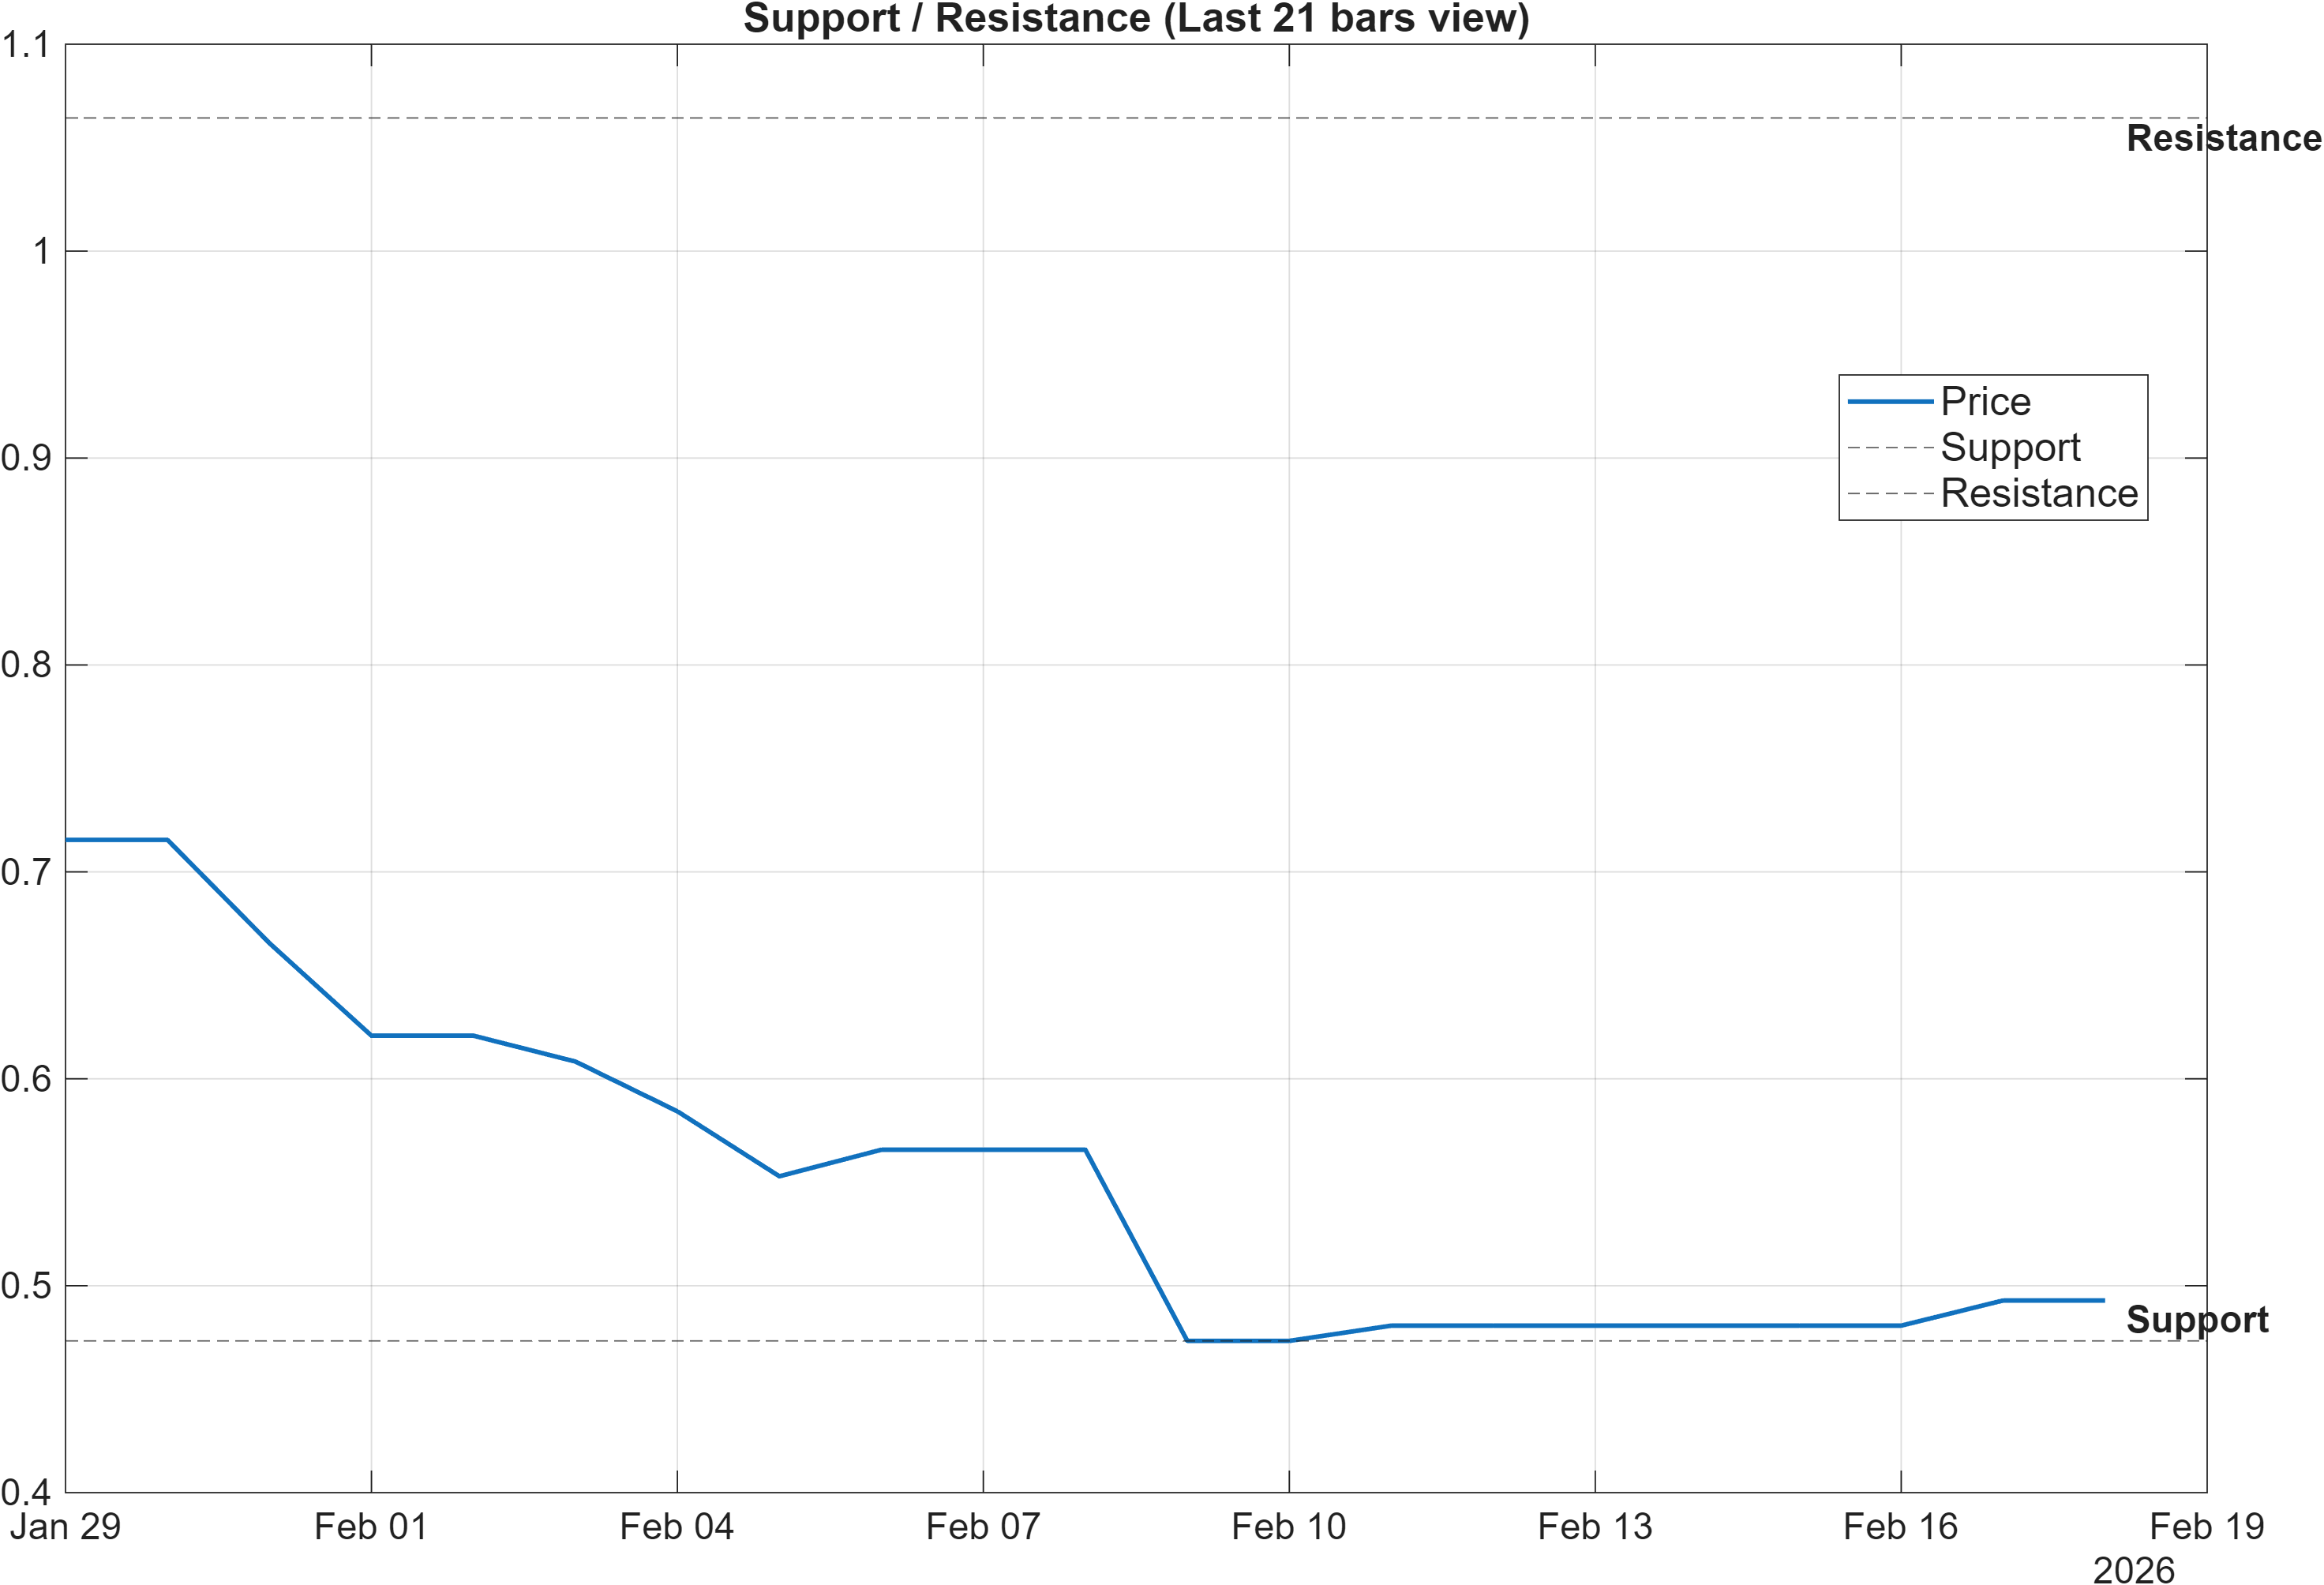
Scenario view: Break above resistance with volume → continuation. Close below support → signal deterioration risk.
The price map is currently defined by a wide band between support ~0.4733 and resistance ~1.0644. With trend metrics leaning bearish (close vs MA50 Bearish; MA50 vs MA200 Bearish) and volatility elevated (bandwidth 0.5399), these levels function less like “targets” and more like decision zones where confirmation is required.
A sustained move above 1.0644 is framed as a continuation trigger only if supported by volume. That condition matters because several participation/volume-flow proxies in the signal set are Neutral or not available; without evidence of broad participation, breakouts can fade. Conversely, a close below 0.4733 would increase deterioration risk, aligning with the existing bearish-leaning momentum cluster (RSI bias Bearish; ROC(20) Bearish in the signal table).
Because the distance between 0.4733 and 1.0644 is large, traders and risk managers often look for intermediate confirmation from momentum. Here, the slight positive MACD histogram 0.0099 is the “best” early improvement signal, but it remains too small on its own to overrule the downside trend structure. In practice, the level framework argues for patience: let the market prove which side of the range it intends to defend, rather than forcing a directional interpretation out of a Neutral backdrop.
5) Quant Technical Dashboard (18 Signals)
KGNAI AI Technical Analysis Score (Deep Reinforcement Learning): Rank #350 out of 800 (Rank 1 represents the strongest technical positioning and a higher probability of favorable price behavior. As ranks increase toward the maximum, the probability of favorable outcomes weakens and bearish positioning becomes more dominant.) | Label: Neutral | Score: 0.125
18-Signal Technical Confluence Score: -0.056 (Neutral)
Overall Technical Score (18-signal confluence + DRL rank blend): -0.001 (Neutral)
Note: The blended score reflects signal strength weighted against broader AI technical ranking, which may temporarily diverge.
Blended technical score breakdown: -0.001 (Neutral | Bull 3 / Bear 4 / Neutral 11)
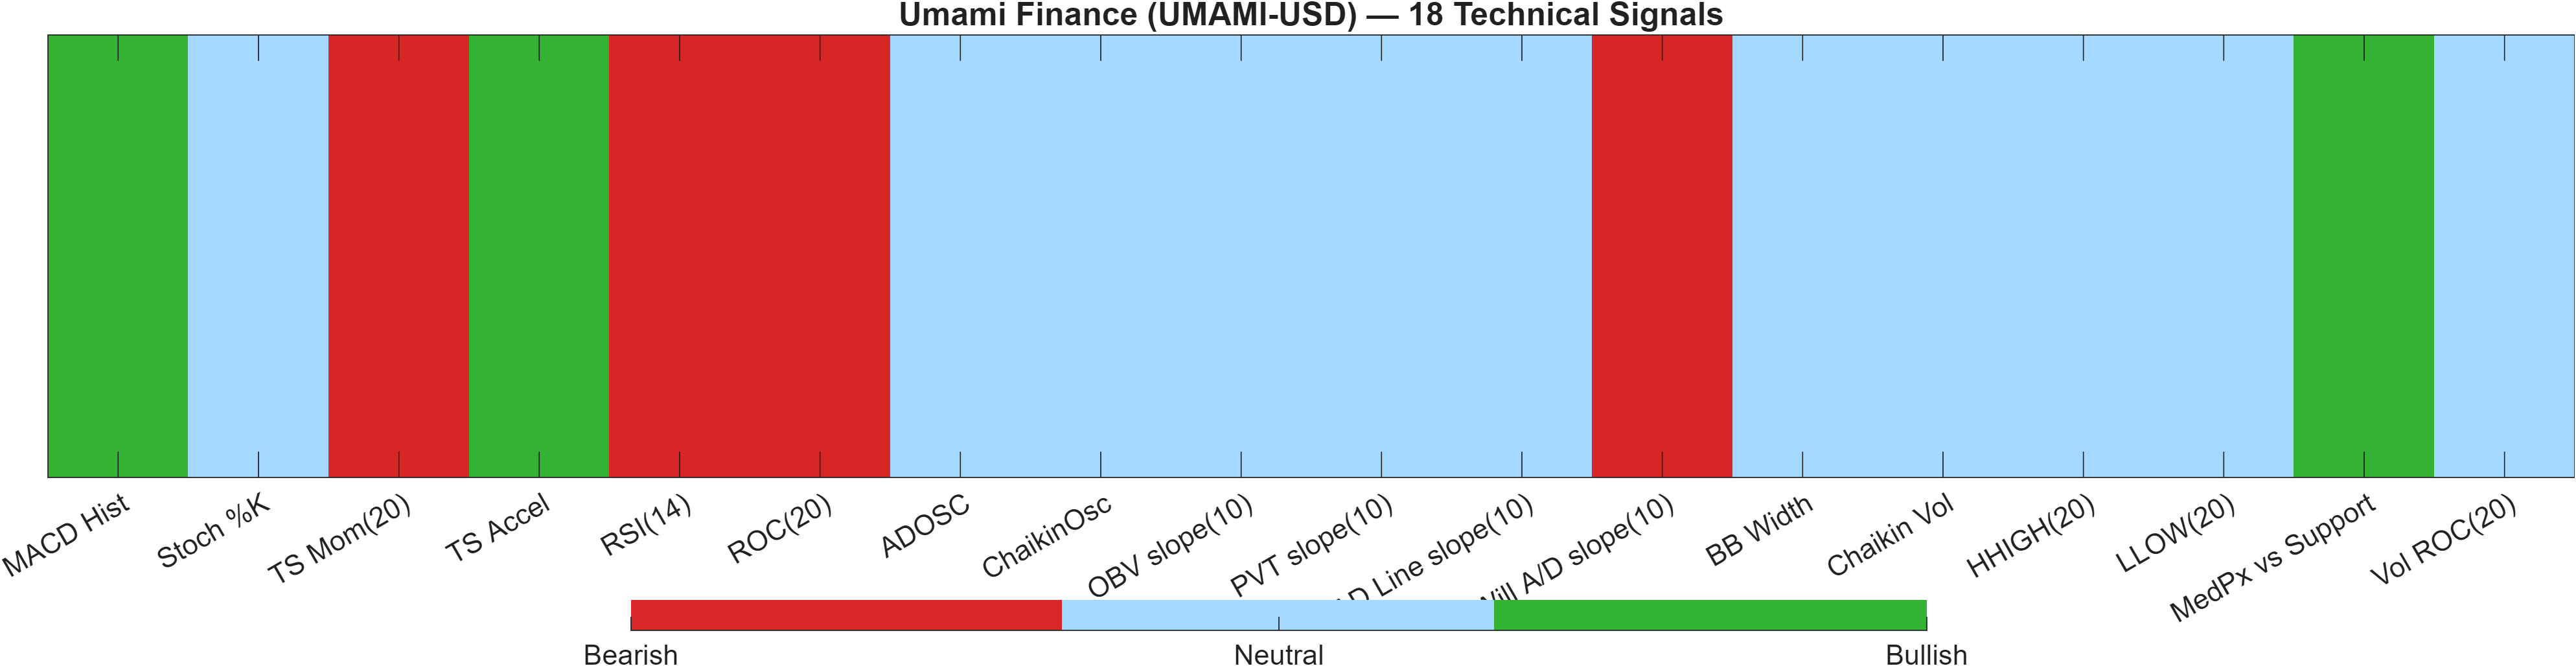
Signal table (Bull/Bear/Neutral)
| Indicator | Value | Signal |
|---|---|---|
| MACD Hist | 0.009919 | Bullish |
| Stoch %K | 20.09 | Neutral |
| TS Mom(20) | -0.2226 | Bearish |
| TS Accel | 0.08115 | Bullish |
| RSI(14) | 20.73 | Bearish |
| ROC(20) | -31.11 | Bearish |
| ADOSC | — | Neutral |
| ChaikinOsc | — | Neutral |
| OBV slope(10) | 0 | Neutral |
| PVT slope(10) | 0 | Neutral |
| AD Line slope(10) | — | Neutral |
| Will A/D slope(10) | -0.07772 | Bearish |
| BB Width | 0.5399 | Neutral |
| Chaikin Vol | -82.51 | Neutral |
| HHIGH(20) | 0.7155 | Neutral |
| LLOW(20) | 0.4733 | Neutral |
| MedPx vs Support | 0.01954 | Bullish |
| Vol ROC(20) | — | Neutral |
Interpretation: Indicator-level signals form the base confluence, which is then adjusted using a separate AI-driven technical ranking model. The final technical score summarizes this combined view.
The dashboard characterizes UMAMI-USD as a high-neutrality tape: 11 of 18 signals are Neutral, with only 3 Bull versus 4 Bear. That distribution aligns with the aggregate readings—18-signal confluence -0.056 (Neutral) and blended overall technical score -0.001 (Neutral)—and supports the idea that current conditions are not offering strong, one-direction agreement.
Where the bears have more influence is in downside momentum and drawdown measures: RSI(14) 20.73, ROC(20) -31.11, and TS Mom(20) -0.2226 are each marked Bearish, consistent with a market that has recently been under pressure. The bullish cluster is narrower and more “early-cycle” in character, including MACD histogram 0.009919, TS Accel 0.08115, and MedPx vs Support 0.01954. That mix can occur when selling pressure decelerates near a recognized level without producing a confirmed trend reversal.
The DRL technical layer places the asset at rank #350 with a score 0.125, reinforcing mid-pack technical positioning across the 800-instrument universe. For positioning discipline, this is typically interpreted as “wait for evidence”: either breadth improves (more Bull signals) or price/volume validates the 1.0644 breakout scenario.
6) News sentiment + extractive gist
Note: Instrument-specific news matches were not found, so the digest includes broader market/sector headlines. Links are provided for verification.
Sentiment score (avg): 0.018 | Positive: 6% | Neutral: 88% | Negative: 6%
KGNAI AI News Sentiment Score (normalized -1 to +1): Not available (as of —) | Label: Not available | Overall news score: 0.02
Positive Developments
Recent coverage across major financial outlets indicates a cautiously constructive tone around broader crypto risk appetite, with recurring discussion of conditions that can improve flow into large-cap digital assets and spill into higher-beta tokens. In that context, neutral-to-positive macro framing (including ongoing attention on digital currency policy discussions) can serve as a background tailwind for sentiment even when a specific instrument lacks dedicated coverage. For UMAMI-USD, this matters primarily as a contextual input: the news mix is not strongly positive (only 6% positive), but it is also not warning-heavy. With the average sentiment at 0.018 and an overall news score of 0.02, the environment reads as modestly supportive for stabilization attempts—particularly if technical conditions begin to confirm (e.g., MACD histogram 0.0099 holding positive) and price respects 0.4733.
Neutral / Mixed Developments
The dominant feature of the digest is its neutrality: 88% of items are classified Neutral, consistent with a market narrative that is informational rather than catalytic. With instrument-specific matches not found, the signal should be treated as broad-sector temperature rather than a driver of UMAMI-USD idiosyncratic repricing. The “Not available” status for the normalized KGNAI AI News Sentiment Score reinforces that limitation. In practical analytical terms, this type of news backdrop often amplifies the role of technical levels: when headlines are not decisive, markets tend to respond more cleanly to support/resistance, moving averages, and volatility regime cues (here, bandwidth 0.5399). As long as neutrality dominates, expect sentiment to function mainly as a light bias rather than a forcing mechanism.
Negative / Risk Signals
Risk items in the broader market news flow appear focused on regulatory and market-structure disputes rather than token-specific fundamentals. Even when not directly linked to UMAMI-USD, such themes can tighten liquidity conditions and increase the probability of sharp, discontinuous moves—especially in markets already exhibiting elevated volatility (bandwidth 0.5399). The negative share is small (6%), but in crypto, risk framing can propagate quickly across assets with weaker trend structure. Given that UMAMI-USD remains Bearish on trend filters (close vs MA50; MA50 vs MA200) and exhibits stressed momentum (RSI 20.73), a risk-sensitive tape could make it harder for price to reclaim 1.0644 without stronger participation. In this setup, the most actionable risk control remains the 0.4733 support threshold.
- What to monitor next: Whether sentiment stays mostly Neutral (near 0.018) as price tests 0.4733 or approaches 1.0644.
- What to monitor next: Any shift from regulatory/process headlines toward risk-off framing that could affect liquidity in smaller tokens.
- What to monitor next: Confirmation from price/volume behavior if a move through 1.0644 begins.
Sources referenced: Reuters, Bloomberg, Yahoo Finance, MarketWatch, Investing.com
Snapshot: AI Rank (Short–Mid–Long): Neutral (Neutral–Neutral–Neutral) · Technical Confluence: Neutral · Key Levels: Support ~0.47 | Resistance ~1.06 · News Sentiment: Neutral
7) Sources
Source links were provided in the draft data; per publication format, they are not reproduced here.
You may also like: How KGNAI AI ranks instruments across global markets
Disclaimer: KGNAI provides AI-generated analytics and educational market commentary only. This is not financial advice. Markets involve risk. Always do your own research.