
FLIP-USD (Chainflip) — 22-May-2026 Technical Alignment Holds a Bullish Bias, With Key Levels in Focus
Chainflip (FLIP-USD) enters 22-May-2026 with an unusually strong cross-sectional position inside KGNAI’s crypto universe, reinforced by broad technical agreement across momentum, trend, and participation measures. The daily rank #1 and weekly rank #7 (out of 800) point to near-term relative strength, while the monthly rank #20 keeps the medium-term regime constructive. On the technical layer, the blended view remains positive: the 18-signal confluence score is 0.667 and the overall technical score is 0.728, both labeled bullish, with only a single bearish flag within the signal set. Volatility is present but not extreme, with Bollinger Band width at 0.1931. The most actionable structure is the defined decision range: support ~0.1964 and resistance ~0.2320. News sentiment, as provided, is neutral, suggesting price/technical evidence is currently doing most of the directional work.
- Rank stance (Short/Mid/Long): Bullish / Bullish / Bullish (daily #1, weekly #7, monthly #20; 3-month #135 remains bullish but less dominant).
- Technical confluence: Bullish (overall technical score 0.728; Bull 13 / Bear 1 / Neutral 4).
- Key levels: Support ~0.1964 | Resistance ~0.2320.
- News sentiment bias: Neutral (avg score 0.000; 100% neutral in provided digest).
- Confirmation / invalidation: Continuation is better supported on a break above 0.2320 with volume; deterioration risk increases on closes below 0.1964.
KGNAI evaluates assets using large cross-sectional datasets built from millions of structured data points. Inputs incorporate fundamental metrics, technical structures, and systematically processed news sentiment. Statistical models, machine learning, and AI frameworks are used to assess relative positioning, signal alignment, and probabilistic behavior across broad universes.
- Ranks are comparative across the tracked universe, not absolute price targets.
- Confluence reflects alignment among independent signal groups.
- Support/resistance levels are probabilistic decision zones, not guarantees.
- Sentiment provides contextual bias within the broader analytical framework.
1) KGNAI AI Analysis
Region: CRYPTO
Total universe size: 800 ranked instruments
- Daily rank: #1 out of 800 — Bullish
- Weekly rank: #7 out of 800 — Bullish
- Monthly rank: #20 out of 800 — Bullish
- 3-Monthly rank: #135 out of 800 — Bullish
Cross-sectional strength vs persistence risk
FLIP-USD sits at the top of the monitored crypto universe on the daily rank (#1/800), placing it effectively in the highest relative-strength cohort. The weekly rank (#7/800) supports the view that the move is not purely a one-session anomaly; it remains within the top percentile band over a broader lookback. The monthly rank (#20/800) extends that constructive posture into the medium horizon, indicating that the asset is still scoring well under KGNAI’s multi-factor tests rather than relying on a single favorable input.
The nuance appears in the 3-month rank (#135/800): still labeled bullish, but no longer in the same top-tier cluster as the short and intermediate windows. In regime terms, that profile is consistent with a market that has improved quickly in the near term while the longer-window signal remains more conservative. That gap is not automatically bearish, but it tends to increase sensitivity to confirmation from price structure and liquidity/volume behavior.
From a positioning standpoint, this is best treated as a high-conviction short-horizon setup that still benefits from ongoing validation. If the technical layer continues to agree (as it does in the current dashboard), the rank stack suggests the path of least resistance remains constructive; if technical breadth narrows, the longer-window rank provides context for how quickly the model could de-risk.
Term view: Short-term: Bullish. Mid-term: Bullish. Long-term: Bullish.
2) Price & trend overview
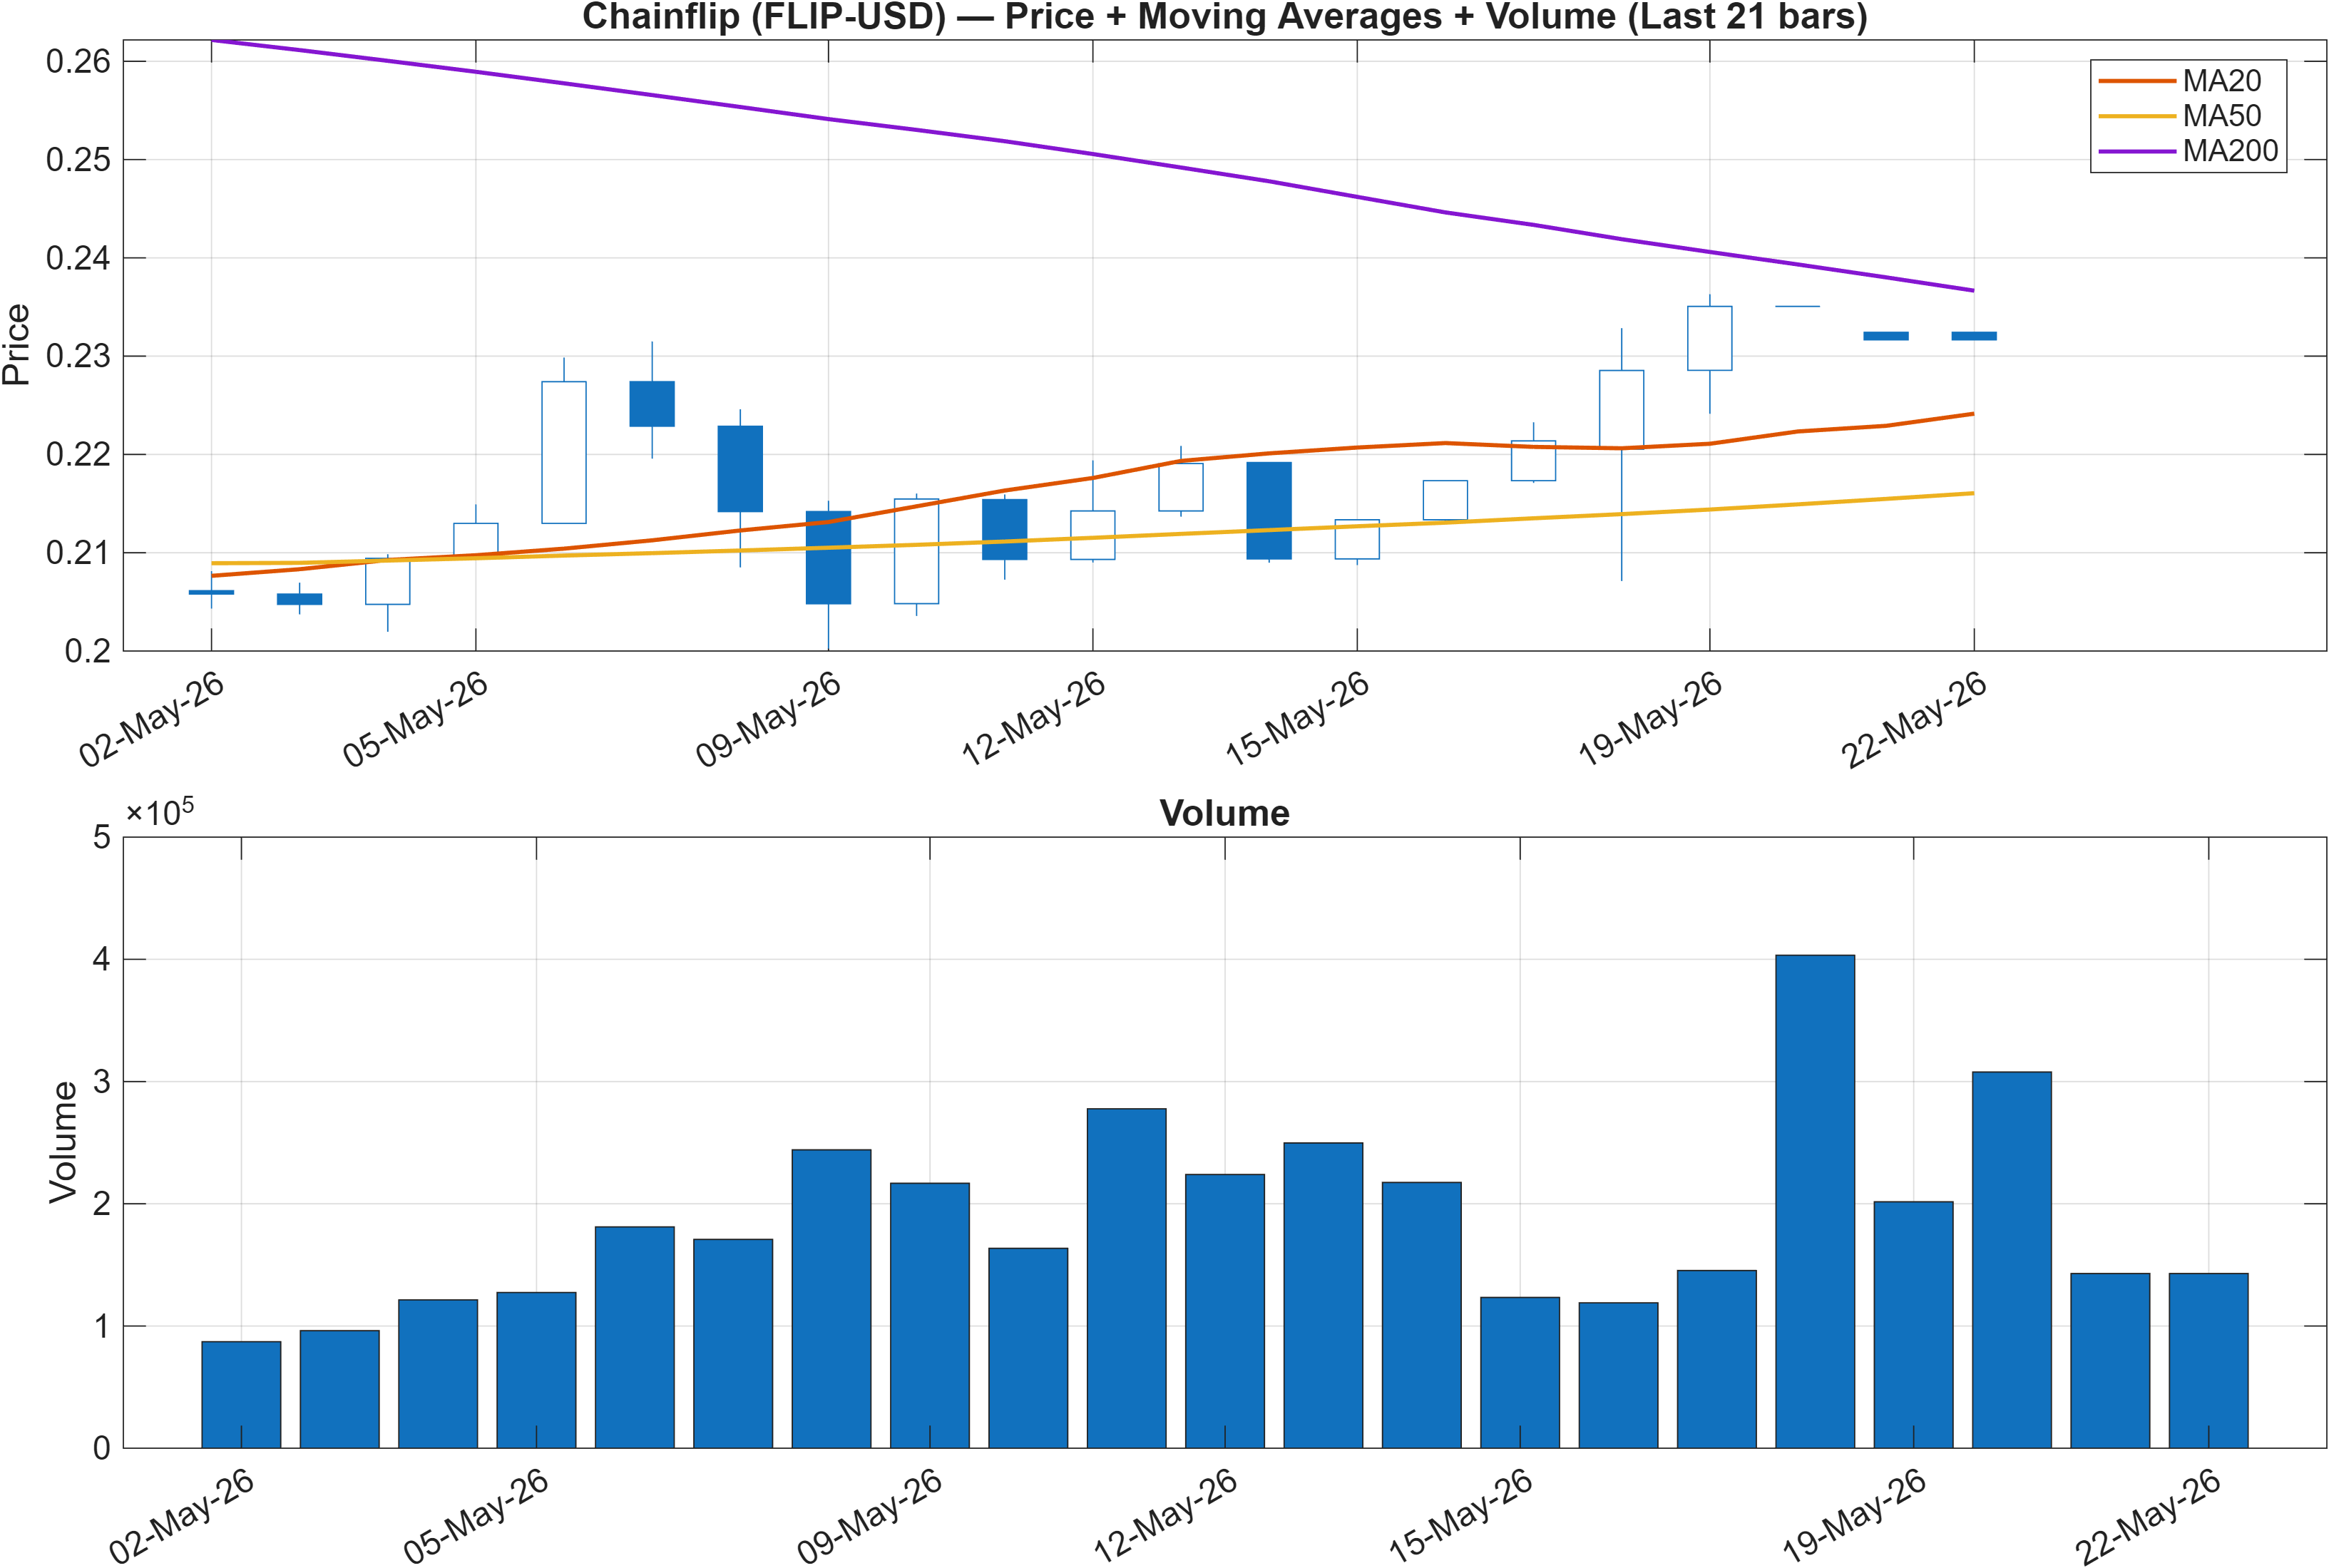
Interpretation: Close vs MA50 = Bullish, MA50 vs MA200 = Bearish.
Trend alignment: bullish near-term slope vs longer-term drag
The trend message is mixed by design: price closing above the MA50 is bullish, yet MA50 below MA200 is bearish. That configuration is often read as a transition phase—near-term participation has improved enough to reclaim intermediate trend support, but the longer-duration trend still reflects earlier weakness. This matters because trend transitions can either evolve into durable reversals or fail back into the prior regime if follow-through stalls.
In this context, the ranking stack (daily #1 and weekly #7) argues that near-term follow-through pressure is currently present. However, the longer-term moving-average relationship implies the market still has overhead work to do before the broader trend structure fully confirms. This is where level behavior becomes decisive: the resistance zone at 0.2320 functions as a practical checkpoint for whether the move is becoming structurally accepted, while support at 0.1964 frames where the reclaimed trend may start to fail.
Treat the moving-average divergence less as a contradiction and more as a map of timing: short-cycle buyers appear to have control, but longer-cycle sellers may still influence rallies until additional base-building occurs. If trend strength persists, the MA relationships typically converge over time; if it fades, the same divergence can amplify downside sensitivity on pullbacks.
3) Momentum & volatility dashboard
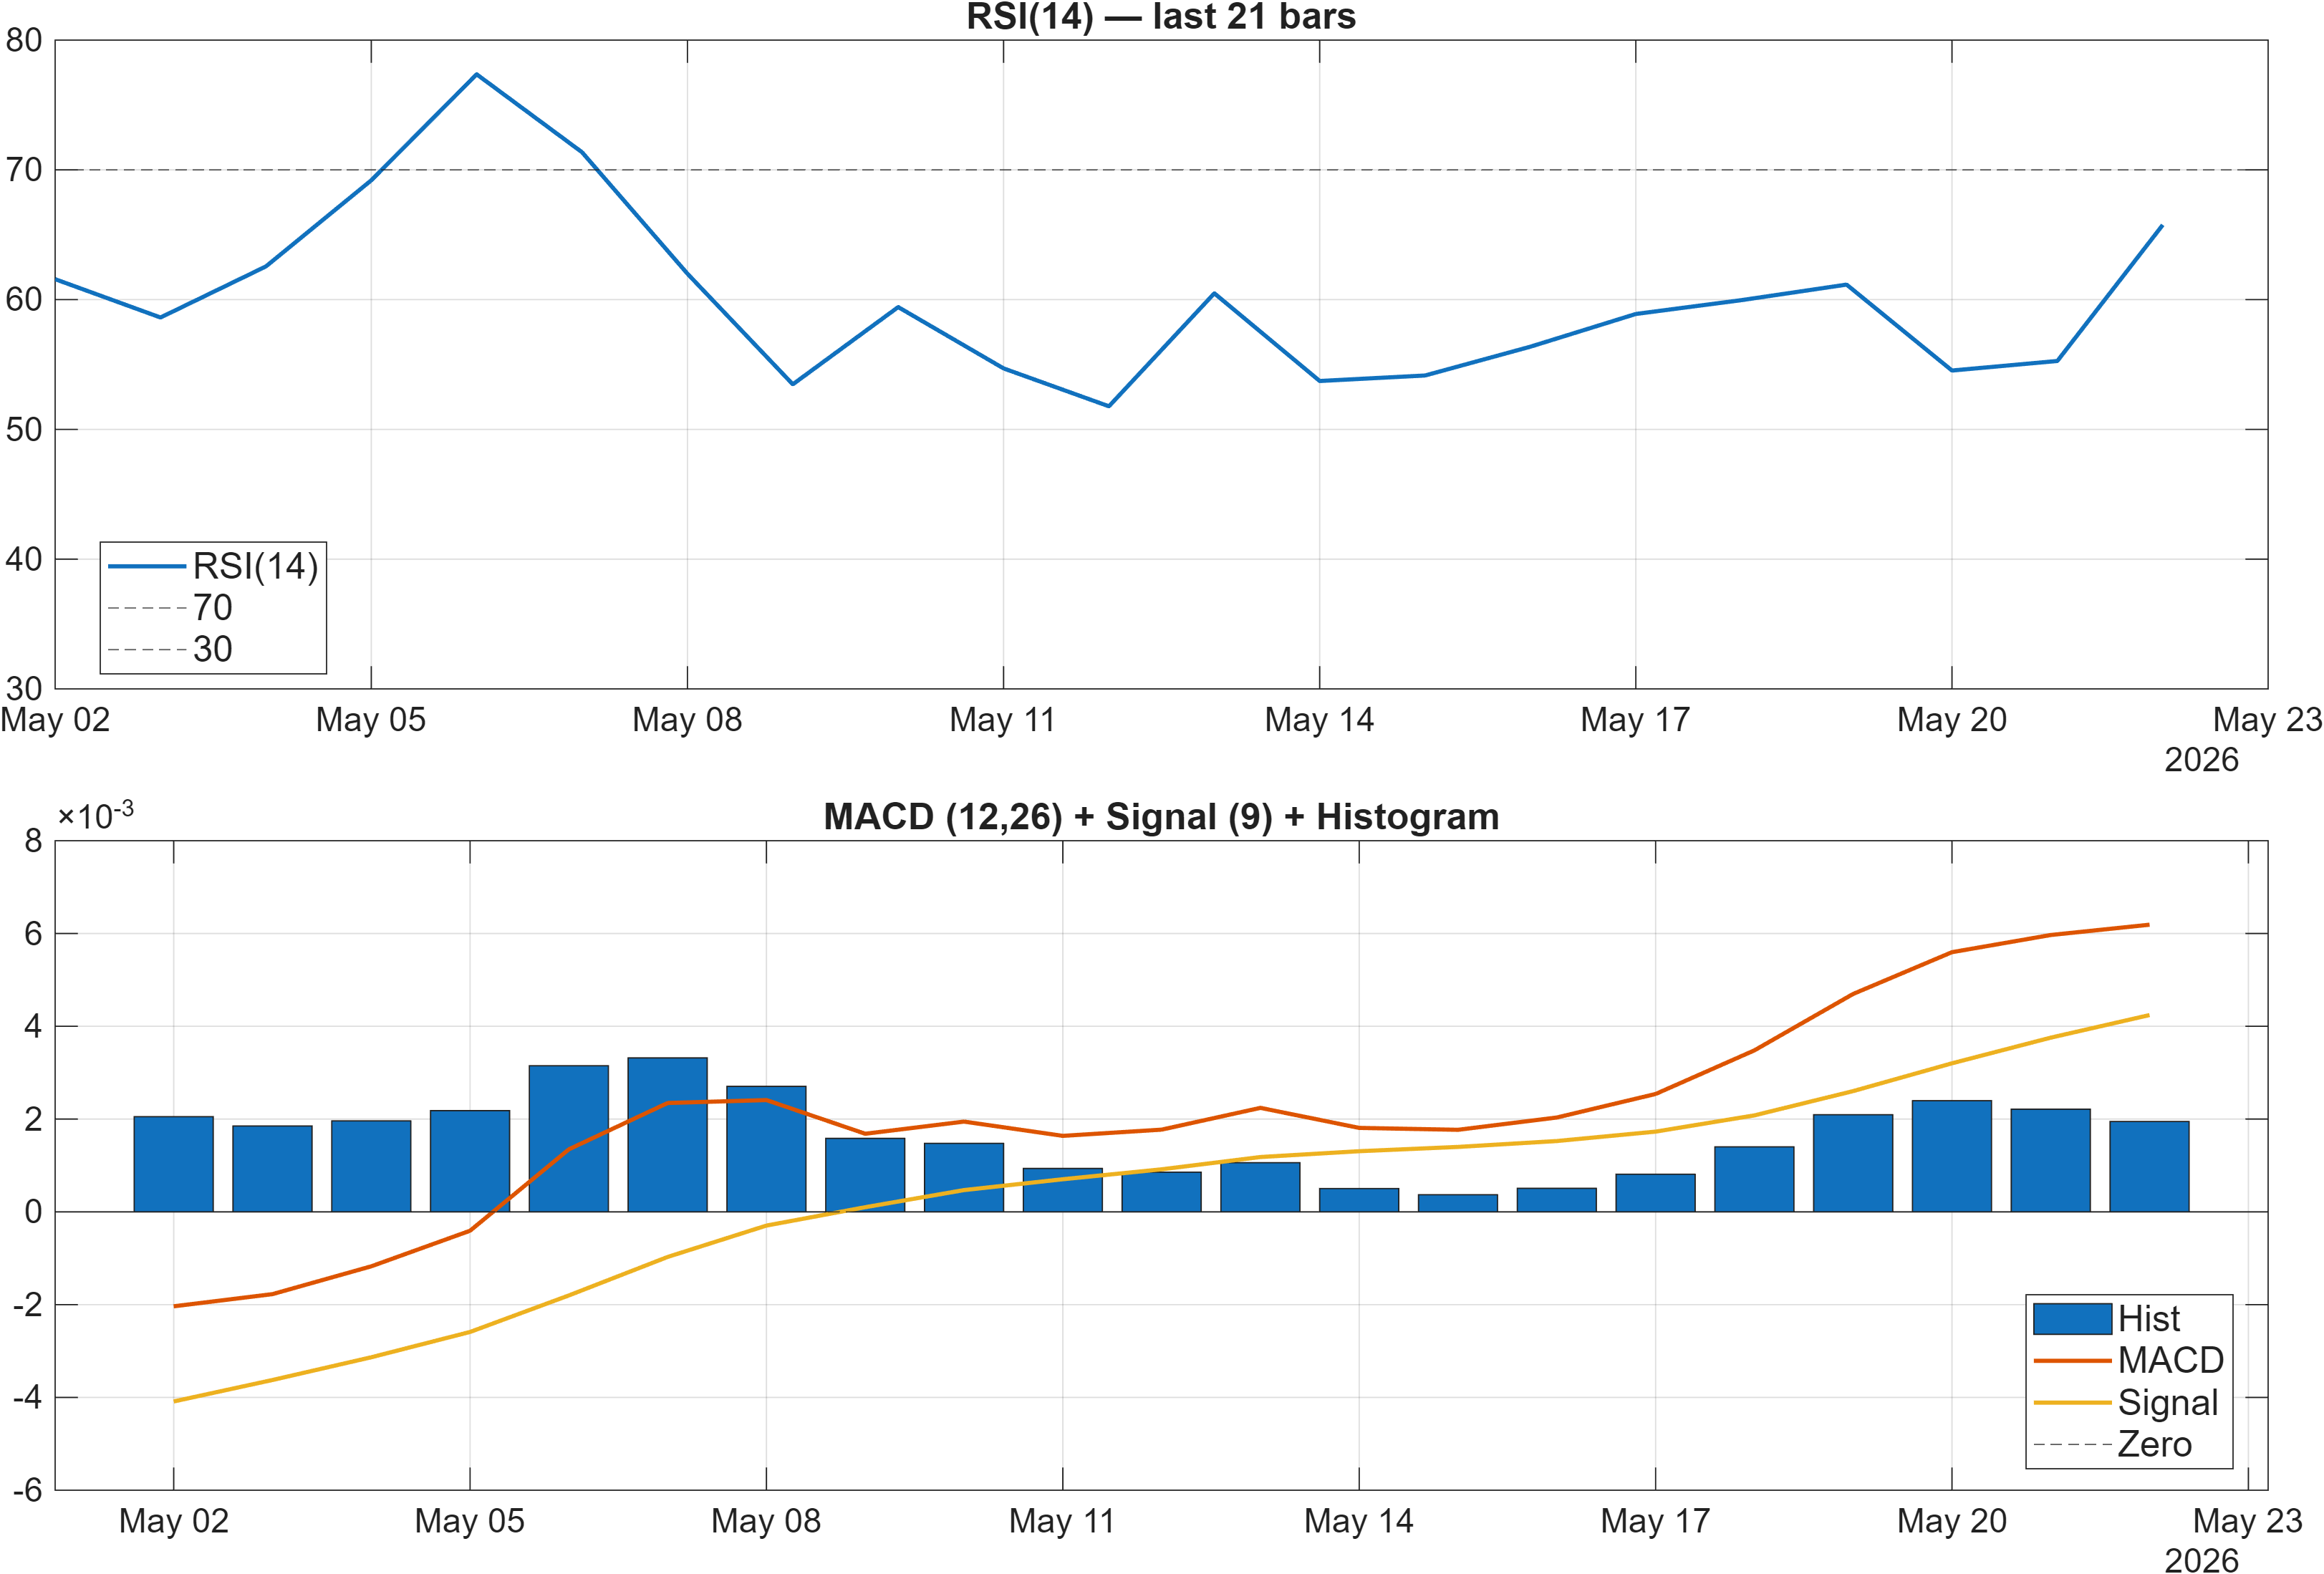
Interpretation: RSI bias = Bullish, MACD hist = 0.0019.
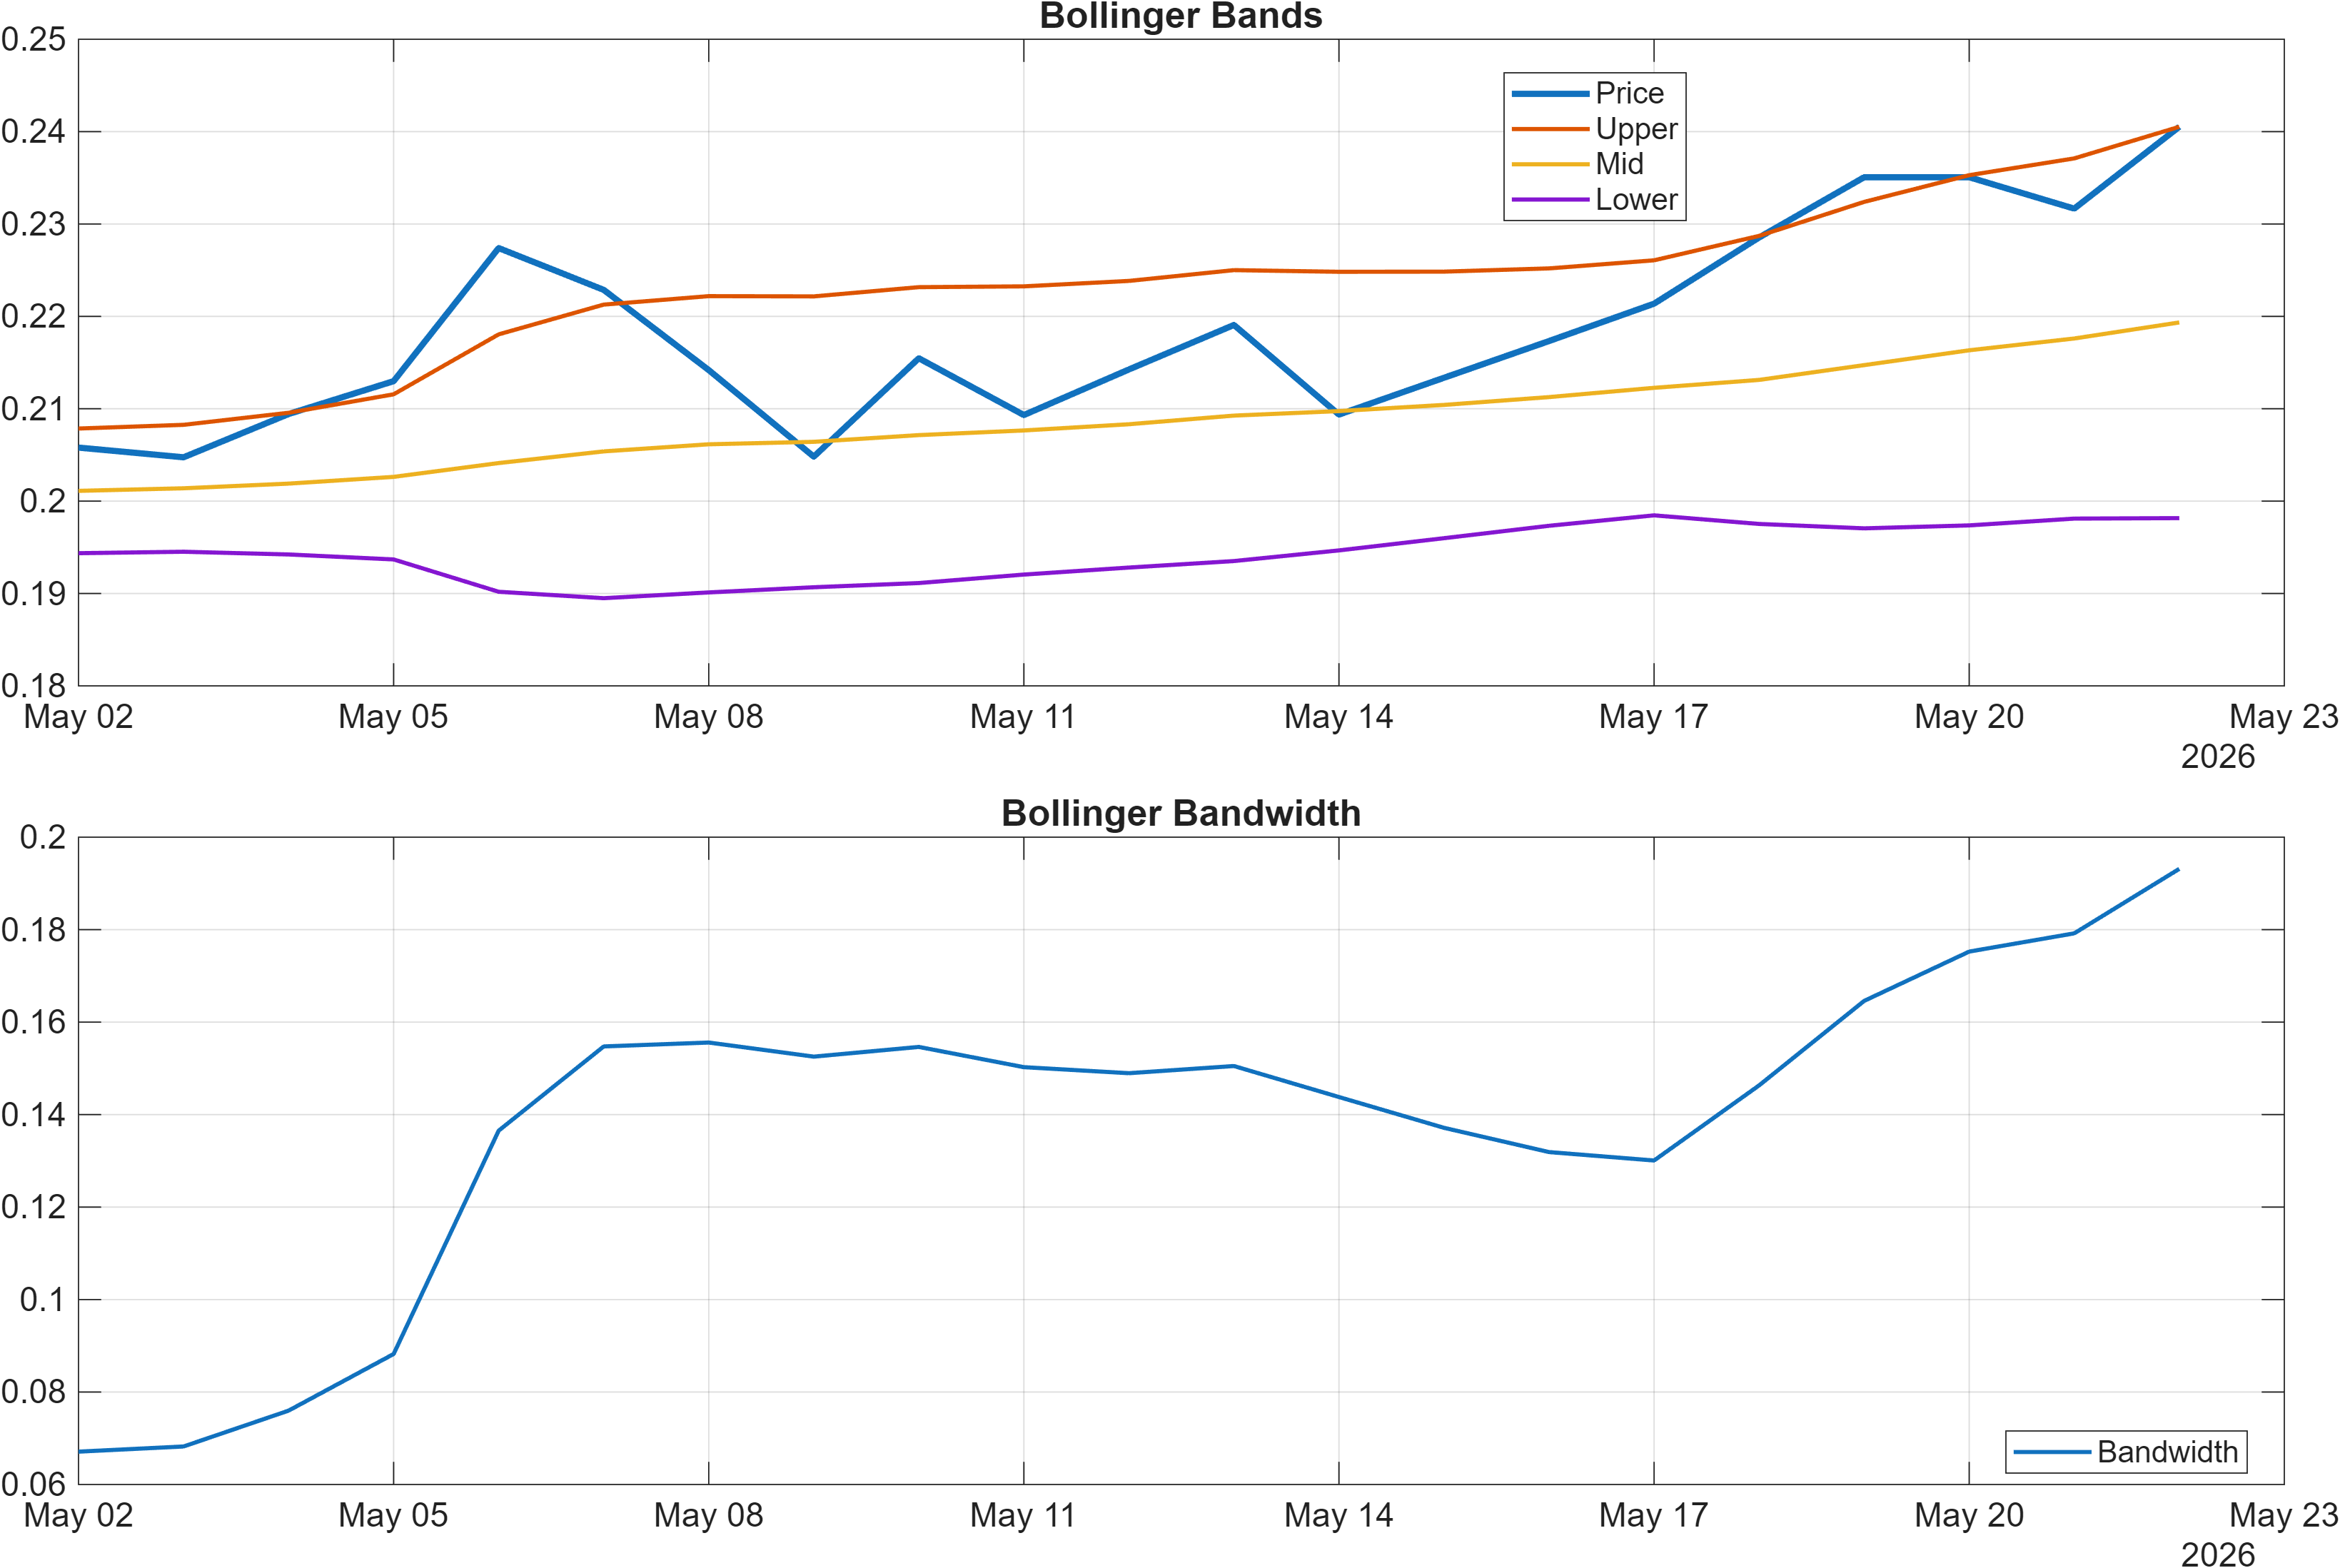
Interpretation: Bandwidth (volatility regime) latest = 0.1931.
Momentum breadth remains constructive; volatility is active but interpretable
Momentum readings lean supportive rather than stretched. The dashboard notes RSI bias = bullish, and the underlying RSI(14) in the signal table sits at 65.76, which is consistent with positive momentum without necessarily implying an extreme condition on its own. The MACD histogram at 0.0019 adds a second, independent confirmation: momentum is positive at the margin, which helps explain why short-horizon ranks are so strong.
Volatility, measured through Bollinger dynamics, is not negligible. The latest BB Width is 0.1931, flagged as neutral in the signal table, which is useful because it frames volatility as a regime descriptor rather than a directional call. With bandwidth not registering as an explicit bullish tailwind, trend continuation has to be earned via sustained demand rather than relying on a volatility expansion impulse alone.
A key tension sits between momentum strength and overbought-style oscillators: Stoch %K at 84.1 is the lone bearish signal in the 18-indicator set. When this occurs alongside bullish RSI and positive MACD, it often suggests a market that is advancing but may be prone to short, sharp pullbacks that reset the oscillator without breaking the broader structure. In practice, that makes the support zone around 0.1964 the more informative reference for whether momentum is merely cooling or actually failing.
4) Support / Resistance zones
Support ~ 0.1964 | Resistance ~ 0.2320
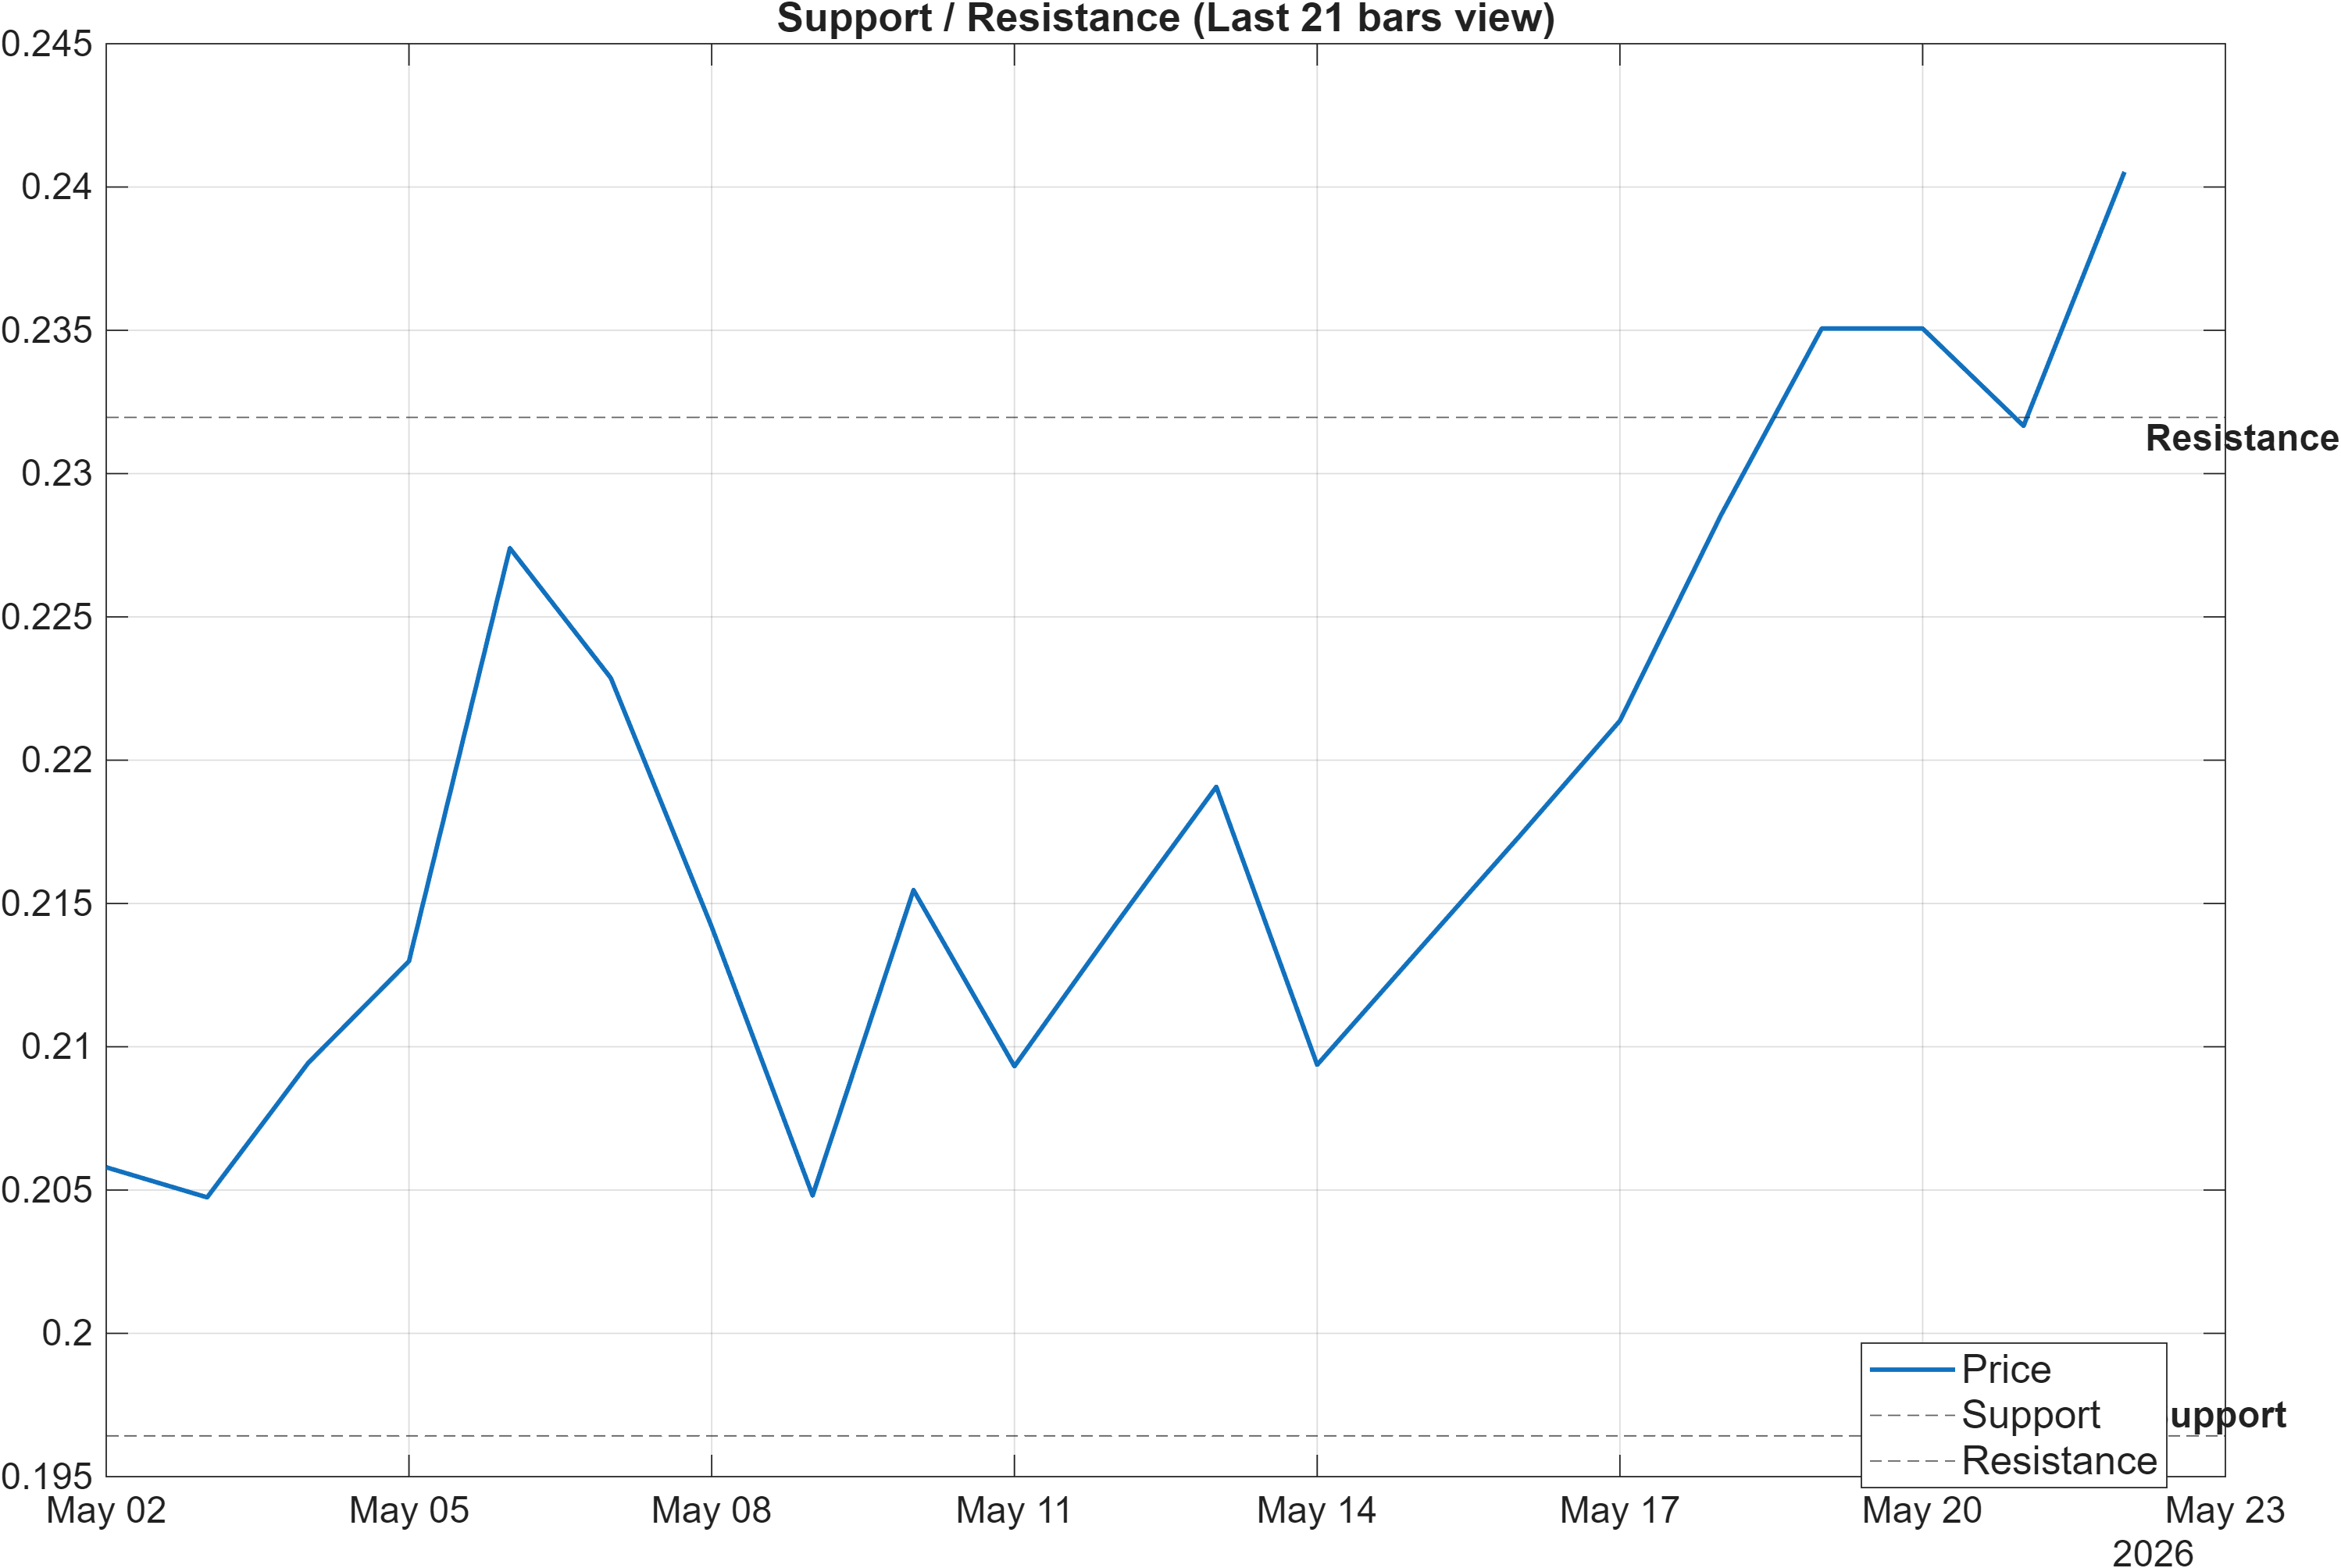
Scenario view: Break above resistance with volume → continuation. Close below support → signal deterioration risk.
Decision zones: where trend confirmation becomes measurable
The current structure is defined by a relatively tight, actionable range: support ~0.1964 and resistance ~0.2320. With the broader technical package bullish (overall technical score 0.728) but the moving-average backdrop still mixed (MA50 vs MA200 bearish), these levels function as objective checkpoints for whether the market is transitioning into a more durable uptrend or remaining a tactical rally.
Upside confirmation is explicitly framed as a break above 0.2320 with volume. That condition matters because the signal set contains multiple participation/flow positives—e.g., Vol ROC(20) at 48.65 is bullish and suggests activity has been accelerating. When breaks occur without participation, they are statistically more prone to reversal; when they occur with expanding activity, they more often evolve into continuation structures.
On the downside, the report flags that a close below 0.1964 increases deterioration risk. This is consistent with the idea that a strong short-term rank (daily #1) can degrade quickly if price loses the most recent structural shelf. Notably, the signal table includes LLOW(20) at 0.2002 and HHIGH(20) at 0.2363 as neutral reference points; together they bracket a recent 20-period range that sits near the published support/resistance levels, reinforcing their relevance as regime boundaries rather than arbitrary lines.
5) Quant Technical Dashboard (18 Signals)
KGNAI AI Technical Analysis Score (Deep Reinforcement Learning): Rank #51 out of 800 (Rank 1 represents the strongest technical positioning and a higher probability of favorable price behavior. As ranks increase toward the maximum, the probability of favorable outcomes weakens and bearish positioning becomes more dominant.) | Label: Bullish | Score: 0.873
18-Signal Technical Confluence Score: 0.667 (Bullish)
Overall Technical Score (18-signal confluence + DRL rank blend): 0.728 (Bullish)
Note: The blended score reflects signal strength weighted against broader AI technical ranking, which may temporarily diverge.
Blended technical score breakdown: 0.728 (Bullish | Bull 13 / Bear 1 / Neutral 4)
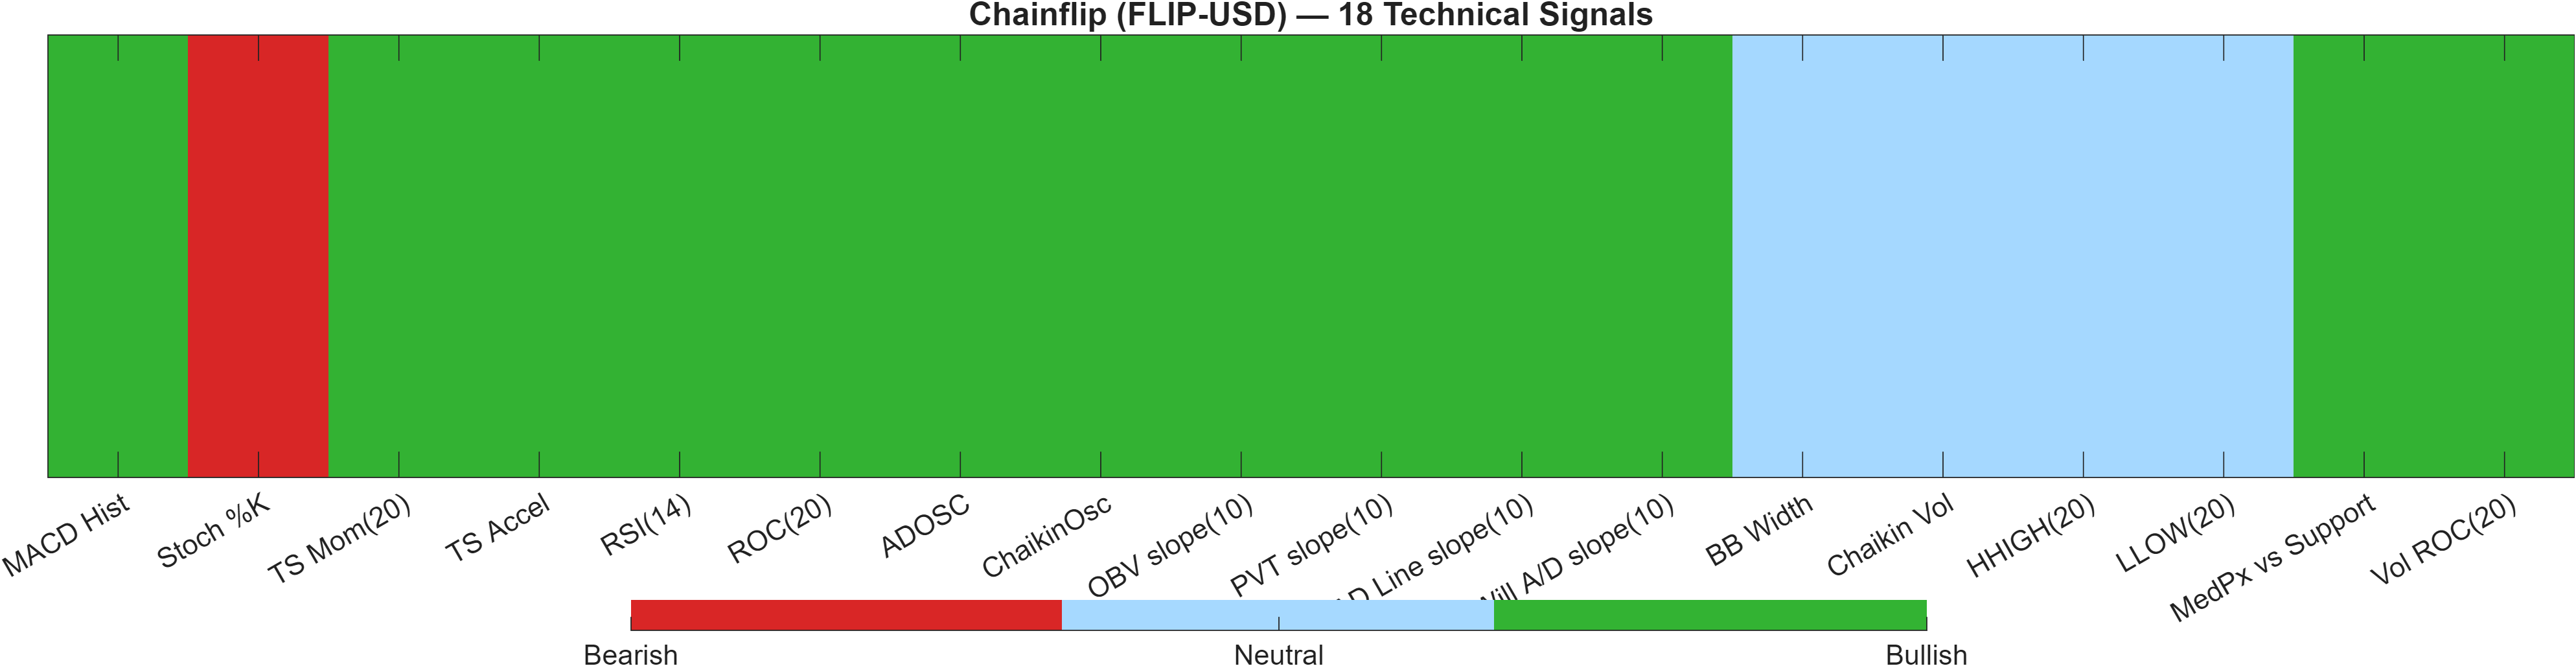
Signal table (Bull/Bear/Neutral)
| Indicator | Value | Signal |
|---|---|---|
| MACD Hist | 0.001948 | Bullish |
| Stoch %K | 84.1 | Bearish |
| TS Mom(20) | 0.02692 | Bullish |
| TS Accel | 0.02149 | Bullish |
| RSI(14) | 65.76 | Bullish |
| ROC(20) | 17.48 | Bullish |
| ADOSC | 3.258 | Bullish |
| ChaikinOsc | 1.312e+05 | Bullish |
| OBV slope(10) | 8.82e+05 | Bullish |
| PVT slope(10) | 2e+04 | Bullish |
| AD Line slope(10) | 3.992e+05 | Bullish |
| Will A/D slope(10) | 0.03742 | Bullish |
| BB Width | 0.1931 | Neutral |
| Chaikin Vol | -36.09 | Neutral |
| HHIGH(20) | 0.2363 | Neutral |
| LLOW(20) | 0.2002 | Neutral |
| MedPx vs Support | 0.0356 | Bullish |
| Vol ROC(20) | 48.65 | Bullish |
Interpretation: Indicator-level signals form the base confluence, which is then adjusted using a separate AI-driven technical ranking model. The final technical score summarizes this combined view.
Confluence quality: participation-led bullishness with one overbought-style exception
The technical picture is notable for breadth. The DRL technical rank #51/800 (score 0.873) sits in the upper tier of the universe, while the confluence layer remains bullish at 0.667. Importantly, the blend is not narrowly won: 13 bullish signals against 1 bearish and 4 neutral implies that multiple independent families are pointing in the same direction.
The bullish signals skew toward momentum and participation. Beyond the positive MACD histogram (0.001948), the dashboard shows constructive rate-of-change (ROC(20) 17.48) and volume acceleration (Vol ROC(20) 48.65). Meanwhile, accumulation/distribution-style measures are also positive (e.g., ADOSC 3.258), a combination that tends to be more robust than price-only strength because it suggests the move is being validated by flow-sensitive metrics.
The sole bearish indicator, Stoch %K at 84.1, reads more like a timing constraint than a broad rejection. Against that, the neutral cluster—such as BB Width 0.1931 and the 20-period range markers—implies the market may be rotating between trend-following and consolidation without breaking the bullish regime. The cleanest technical test remains whether price can convert the resistance zone (0.2320) into acceptance while holding above 0.1964.
6) News sentiment + extractive gist
Sentiment score (avg): 0.000 | Positive: 0% | Neutral: 100% | Negative: 0%
KGNAI AI News Sentiment Score (normalized -1 to +1): Not available (as of —) | Label: Not available | Overall news score: 0.00
Positive Developments
Recent coverage across major financial outlets has leaned more toward macro framing than FLIP-specific catalysts, which can still be constructive for high-beta crypto assets when it clarifies the set of market drivers traders are watching. In the provided digest, the classification mix is 0% positive and 100% neutral with an average sentiment score of 0.000, indicating that the information flow is not currently reinforcing or undermining the price action in a directional way. For FLIP-USD, that places greater emphasis on the internally observed market structure—such as the bullish rank stack and the technical breadth—rather than on narrative momentum. Where the news backdrop can be supportive is by making the “rules of the game” explicit: if macro policy expectations remain the dominant lens, then intraday and weekly price behavior may increasingly react to shifts in risk conditions. In that environment, cleaner technical levels like 0.2320 and 0.1964 often become more actionable decision points.
Neutral / Mixed Developments
The news signal is effectively flat: the digest shows neutral at 100% with no positive or negative skew, and the normalized KGNAI news sentiment score is Not available in the provided data. This combination suggests the current report should be read as a technically led assessment rather than a sentiment-driven thesis. Neutral sentiment can be beneficial insofar as it reduces the probability that the market is reacting to a single, crowded narrative. However, it also means that confirmation likely needs to come from price/volume behavior—particularly around the defined resistance and support zones—rather than expecting external headlines to provide directional follow-through. Given the strong daily and weekly ranks, the neutral sentiment backdrop can be interpreted as “no additional tailwind required,” but also “no cushion” if technical conditions begin to deteriorate.
Negative / Risk Signals
The primary risk signal from the news layer is not negative sentiment per se—since negative is 0% in the provided classification—but rather the emphasis on macro tightening expectations in the broader crypto discourse. When markets price a more restrictive rate path, high-volatility assets can experience sharper air pockets, which can stress support levels even when internal technical indicators remain constructive. With volatility already active (bandwidth 0.1931), the sensitivity to regime shifts can increase, especially if short-term momentum is also flirting with “hot” oscillator territory (the dashboard’s Stoch %K 84.1 bearish flag). In practical terms, that keeps 0.1964 as the key risk-defined reference: a loss of that level would be consistent with a broader risk-off impulse overriding the otherwise bullish technical breadth.
- Whether price acceptance improves above 0.2320 alongside participation (e.g., the bullish Vol ROC(20) 48.65).
- Whether pullbacks remain orderly above 0.1964, consistent with the current bullish rank stack (daily #1, weekly #7).
- Whether momentum breadth stays intact as oscillators cool (RSI(14) 65.76 vs Stoch %K 84.1).
Sources referenced: Reuters, Bloomberg, Yahoo Finance, MarketWatch, Investing.com
7) Sources
Not available in the provided data.
You may also like: How KGNAI AI ranks instruments across global markets
Disclaimer: KGNAI provides AI-generated analytics and educational market commentary only. This is not financial advice. Markets involve risk. Always do your own research.