
PIXEL29335-USD (Pixels) — 20-May-2026 Technical & Sentiment Read: Neutral Ranks with Bearish Confluence
PIXEL29335-USD (Pixels) is currently positioned with neutral cross-sectional ranks across the tracked crypto universe, while the signal-level technical stack leans bearish. As of 20-May-2026, the daily, weekly, and monthly ranks sit in the lower portion of the 800-instrument universe, suggesting the asset is not screening as a relative leader within KGNAI’s probability-based framework. At the same time, momentum measures point to downside pressure: RSI(14) at 28.86 and a negative MACD histogram imply weak trend impulse even as volatility remains a live variable, with Bollinger Band width at 0.3361. From a market-structure standpoint, the focus tightens around the nearest decision levels—support ~0.0066 and resistance ~0.0091—where confirmation (breakout with volume) or invalidation (loss of support) can resolve the next directional phase.
- Rank stance: Short / Mid / Long = Neutral (Daily #621, Weekly #619, Monthly #618 out of 800).
- Technical confluence: Bearish (18-signal confluence -0.444; blended score -0.350).
- Key levels: Support ~0.0066 | Resistance ~0.0091.
- News sentiment bias: Slightly negative-to-neutral (avg -0.060; 6% positive / 69% neutral / 25% negative).
- Confirmation / invalidation: A volume-backed break above 0.0091 improves continuation odds; a close below 0.0066 increases deterioration risk.
KGNAI evaluates assets using large cross-sectional datasets built from millions of structured data points. Inputs incorporate fundamental metrics, technical structures, and systematically processed news sentiment. Statistical models, machine learning, and AI frameworks are used to assess relative positioning, signal alignment, and probabilistic behavior across broad universes.
- Ranks are comparative across the tracked universe, not absolute price targets.
- Confluence reflects alignment among independent signal groups.
- Support/resistance levels are probabilistic decision zones, not guarantees.
- Sentiment provides contextual bias within the broader analytical framework.
KGNAI Signal + Technical Snapshot + News Sentiment Digest
As of: 20-May-2026
Ticker: PIXEL29335-USD
1) KGNAI AI Analysis
Region: CRYPTO
Total universe size: 800 ranked instruments
- Daily rank: #621 out of 800 — Neutral
- Weekly rank: #619 out of 800 — Neutral
- Monthly rank: #618 out of 800 — Neutral
- 3-Monthly rank: Not available for this horizon — Not available
Cross-sectional positioning: neutral label, weaker relative placement
The rank labels are Neutral across daily (#621), weekly (#619), and monthly (#618), but the numeric placement sits in the lower end of the 800-instrument universe. In KGNAI’s framework, this matters because ranking is used as a probabilistic filter: the asset is not currently screening as a relative “leader” when compared to peers under the same tests and normalization.
This creates a useful distinction between label and relative standing. A neutral label does not imply balance between upside and downside drivers; it often indicates that signals are not cleanly aligned into a high-conviction regime. Here, the consistency of ranks across horizons (621/619/618) suggests the market’s relative assessment is stable rather than rapidly improving or deteriorating.
Horizon coverage is also incomplete: the 3-Monthly rank is not available for this horizon (Not available in the provided data). That reduces visibility on whether the current weaker placement is a short-lived dislocation or part of a broader regime. In that context, the technical layer (Sections 2–5) becomes the primary decision-support lens—particularly around whether bearish signals are intensifying or beginning to mean-revert.
Term view: Short-term: Neutral. Mid-term: Neutral. Long-term: Neutral.
Want the full universe and complete rank tables? Unlock full access on KGNAI: https://www.kgnai.com/pricing
2) Price & trend overview
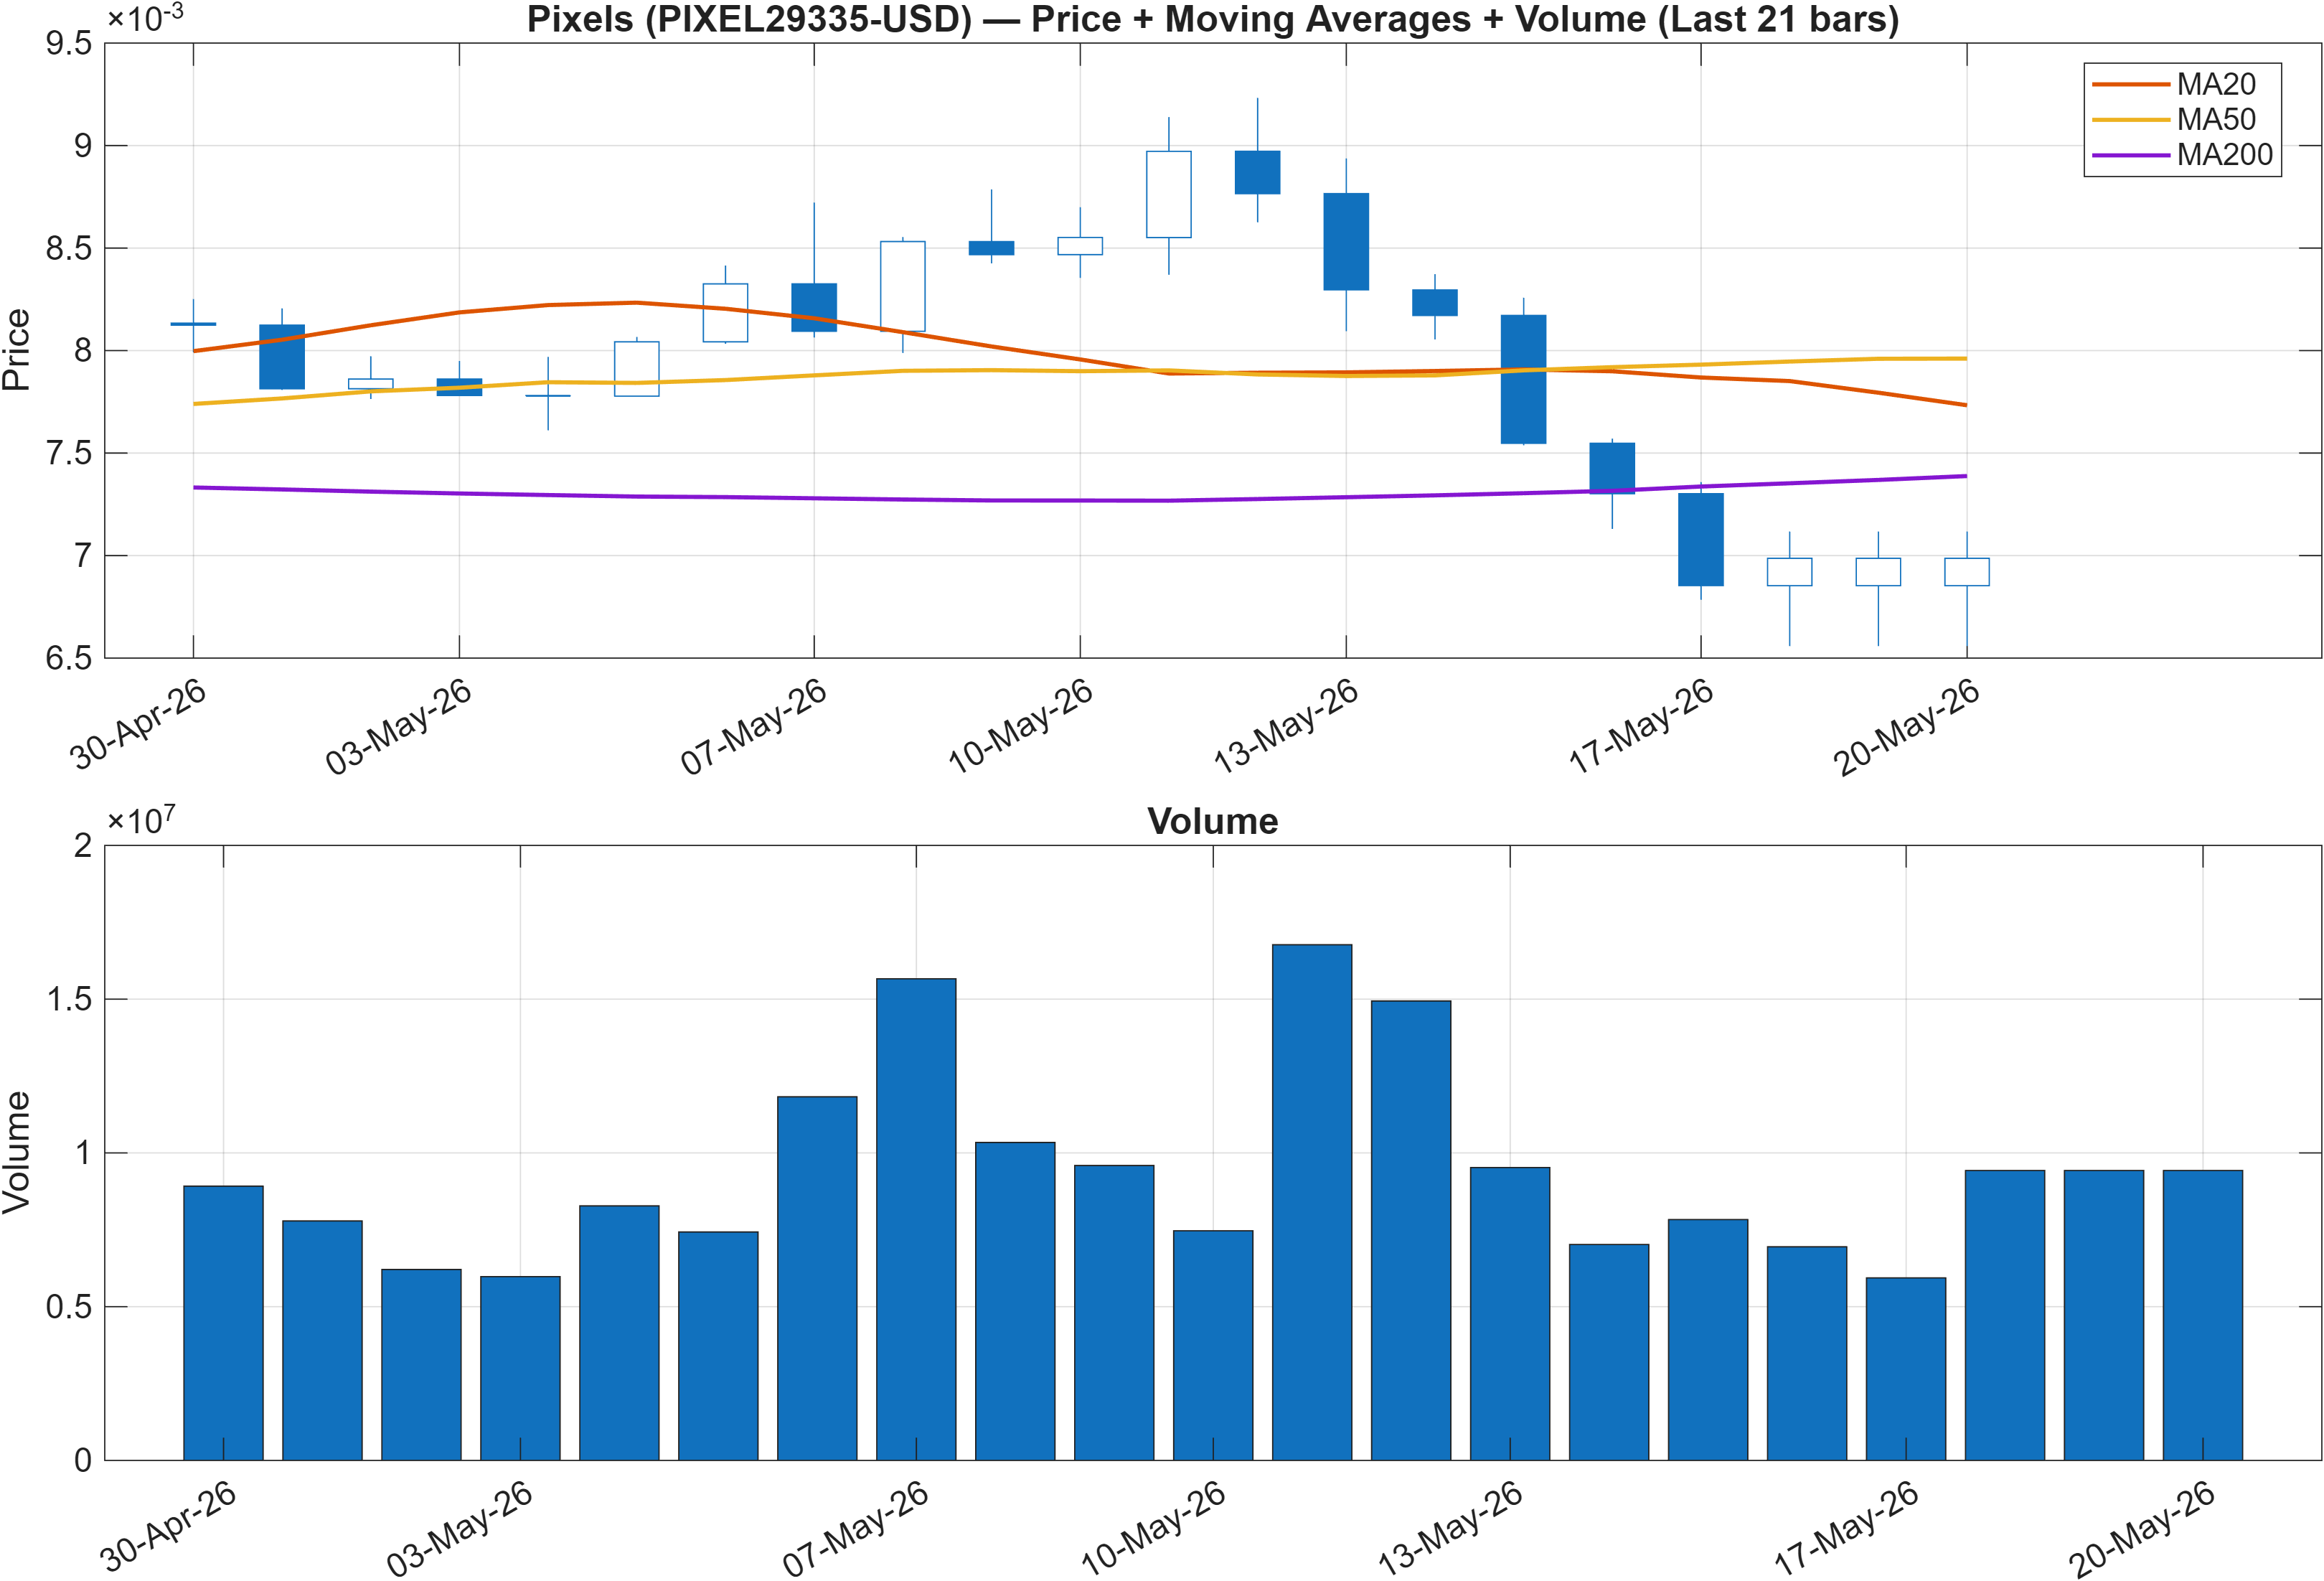
Moving-average structure: mixed regime with weaker spot positioning
The trend read is explicitly mixed: Close vs MA50 = Bearish, while MA50 vs MA200 = Bullish. This combination often reflects a market that previously built a constructive longer-run structure (MA50 above MA200) but is currently trading with weakness relative to the intermediate trend (close below MA50).
Practically, this is a regime-transition setup rather than a clean trend-following environment. If price remains below the MA50 while the MA50 stays above the MA200, the tape can oscillate between mean-reversion rallies and renewed sell pressure. The next confirmation typically comes from whether price can reclaim the MA50 and hold, or whether continued pressure begins to pull the MA50 lower—eventually challenging the MA200 relationship.
This mixed trend state aligns with the broader profile: ranks are neutral yet numerically weak (daily #621 out of 800), and momentum (Section 3) is depressed with RSI(14) at 28.86. When the spot is below MA50 while RSI is deeply weak, the market can become sensitive to short covering and liquidity pulses; however, that is different from establishing a durable trend.
For risk framing, treat the moving averages as structure and the nearby levels (support 0.0066 / resistance 0.0091) as decision zones. A break above resistance with supportive volume would be a stronger “structure repair” signal than a small bounce that fails under the MA50.
Interpretation: Close vs MA50 = Bearish, MA50 vs MA200 = Bullish.
3) Momentum & volatility dashboard
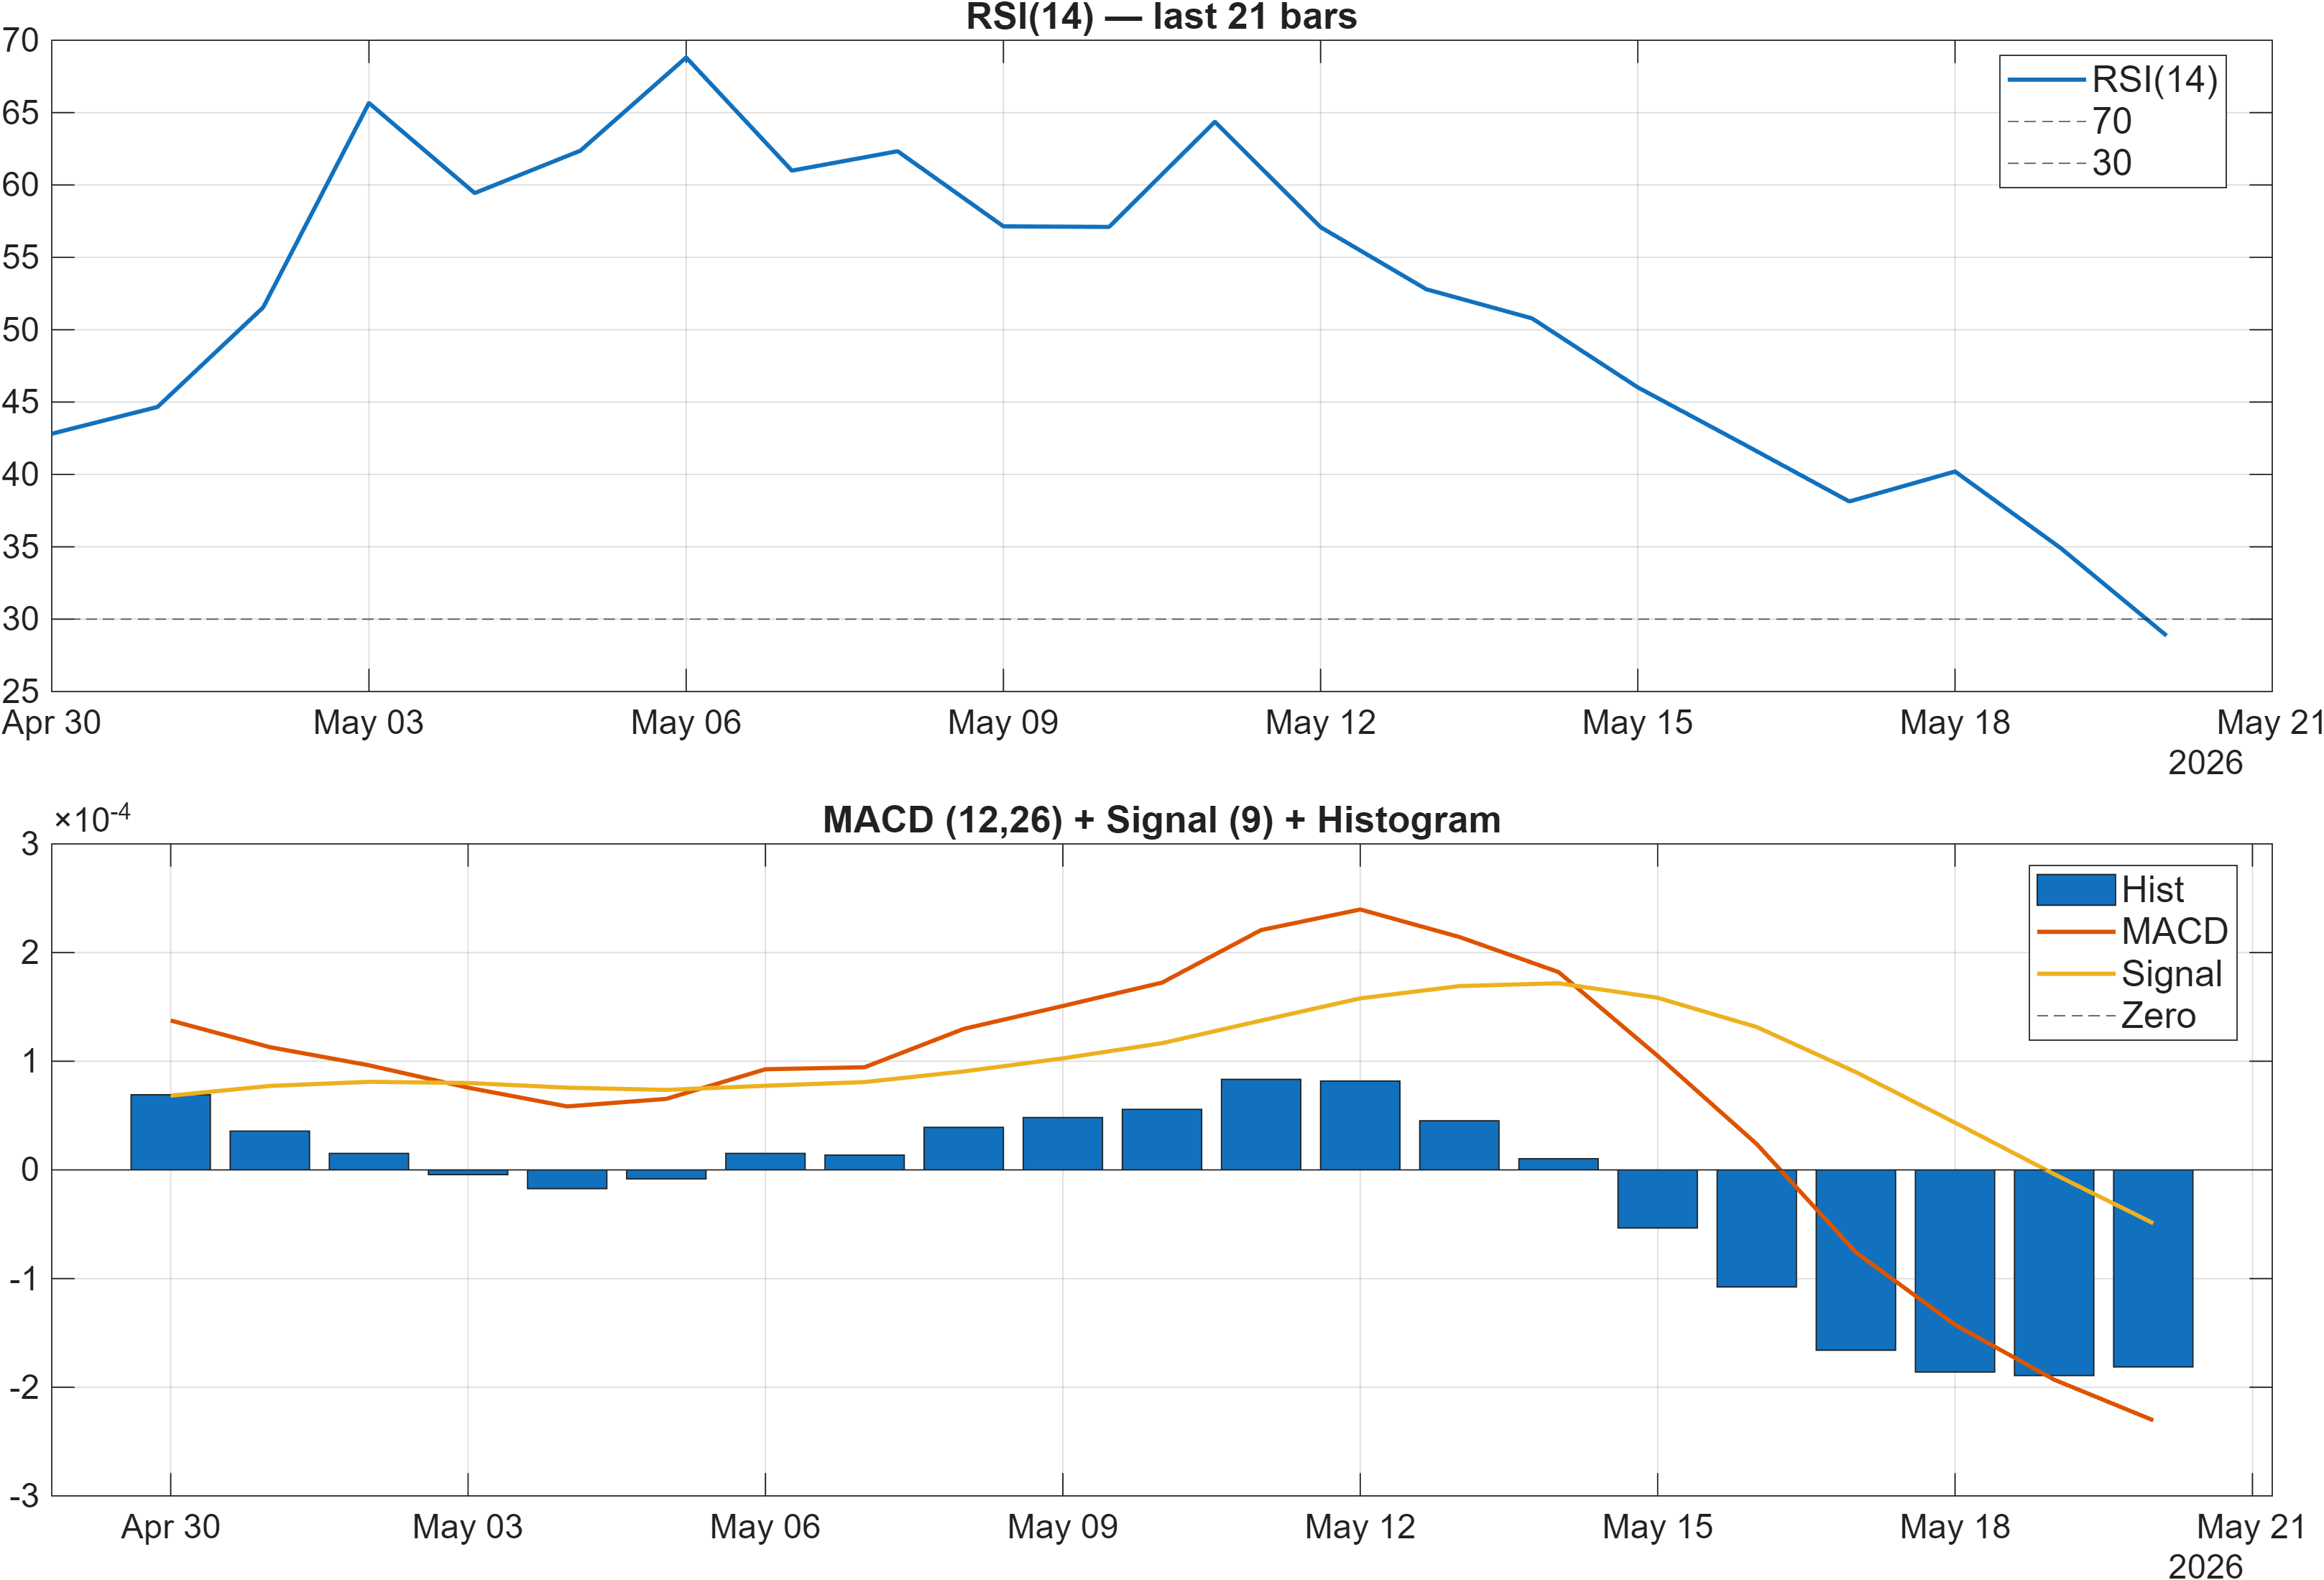
Interpretation: RSI bias = Bearish, MACD hist = -0.0002.
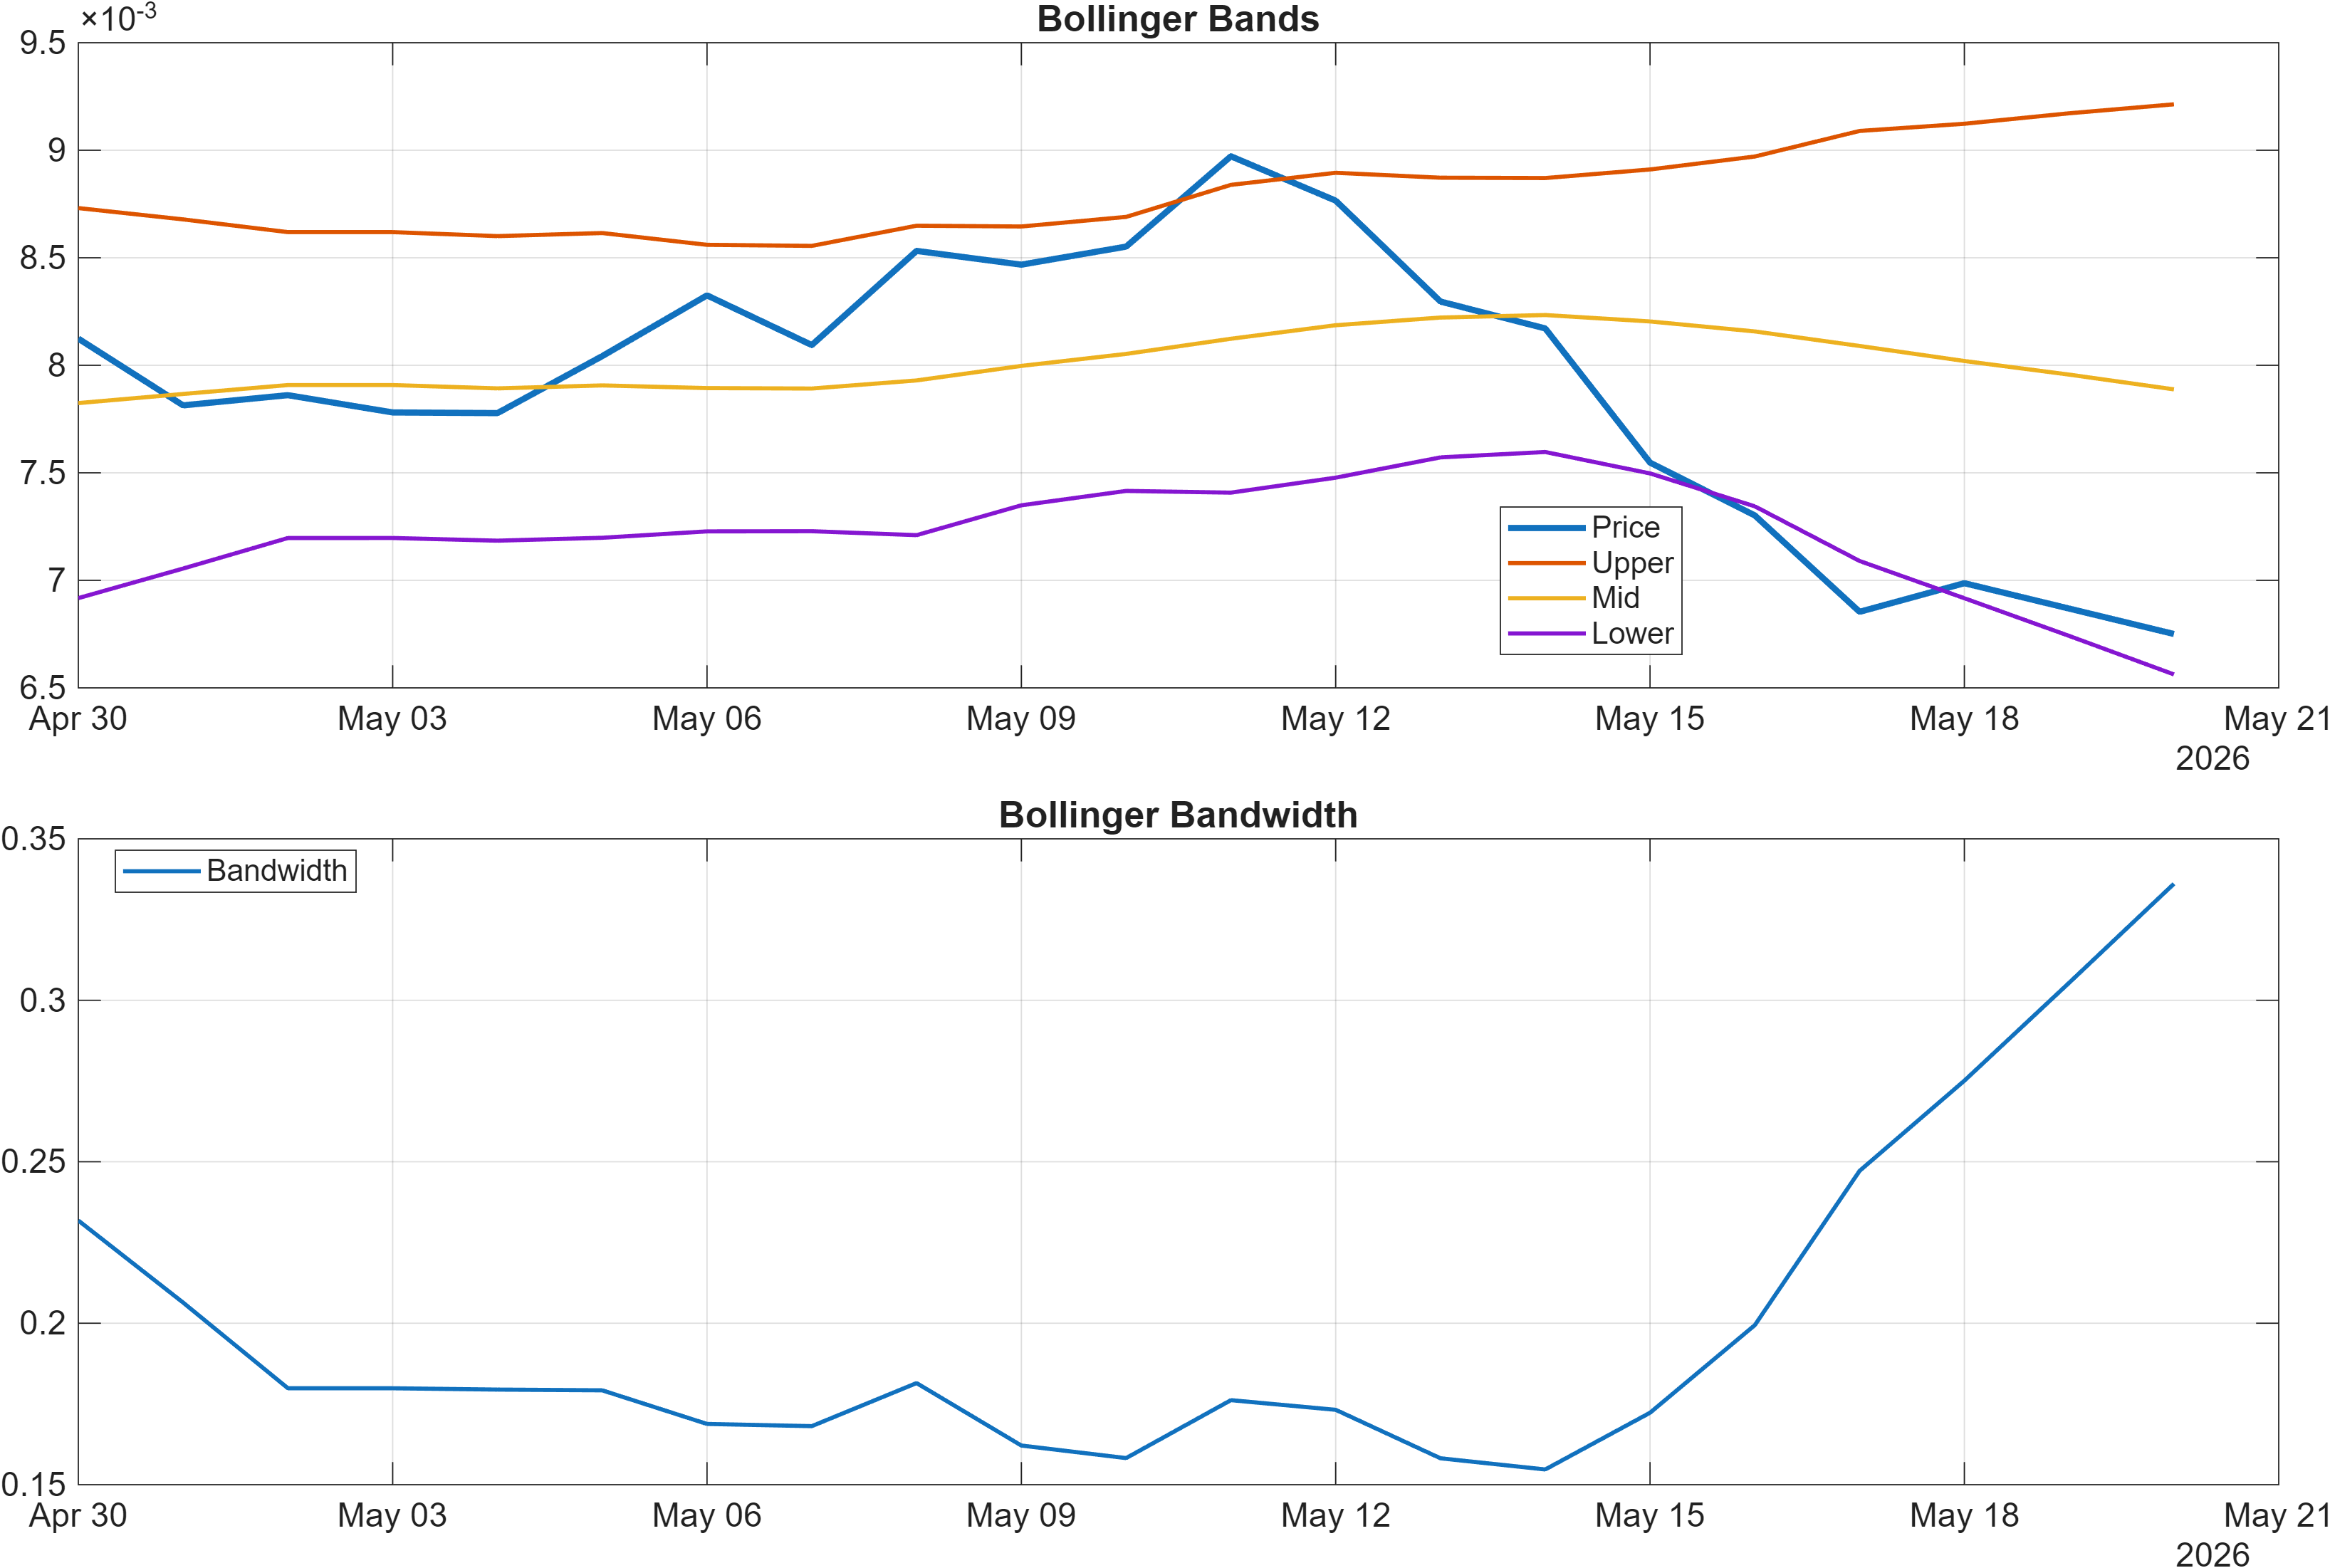
Interpretation: Bandwidth (volatility regime) latest = 0.3361.
Momentum compression vs downside impulse
Momentum is currently skewed to the downside. The RSI(14) reading of 28.86 sits in a deeply weak zone, consistent with the stated RSI bias = Bearish. At the same time, the MACD histogram remains negative (displayed as -0.0002, with the signal table showing -0.0001813), which supports the view that downside pressure has not fully resolved.
Volatility conditions are less binary. Bollinger Band width at 0.3361 points to an active volatility regime rather than an ultra-compressed market. In practice, that tends to widen the distribution of outcomes: rallies can occur, but they may be less orderly, and adverse moves can accelerate quickly if liquidity thins.
The key analytical question is whether the current weakness represents exhaustion (a market stretched to the downside that is prone to mean reversion) or trend persistence (a continuation phase). With RSI below 30 and MACD still negative, the setup often requires a confirmation layer—for example, improving momentum while price reclaims structure (MA50) or a decisive push through resistance (0.0091).
Until such confirmation appears, the combination of weak RSI and negative MACD supports maintaining a cautious interpretation: momentum is negative, and volatility is sufficient to make timing error bars meaningful—particularly for short-horizon participants.
4) Support / Resistance zones
Support ~ 0.0066 | Resistance ~ 0.0091
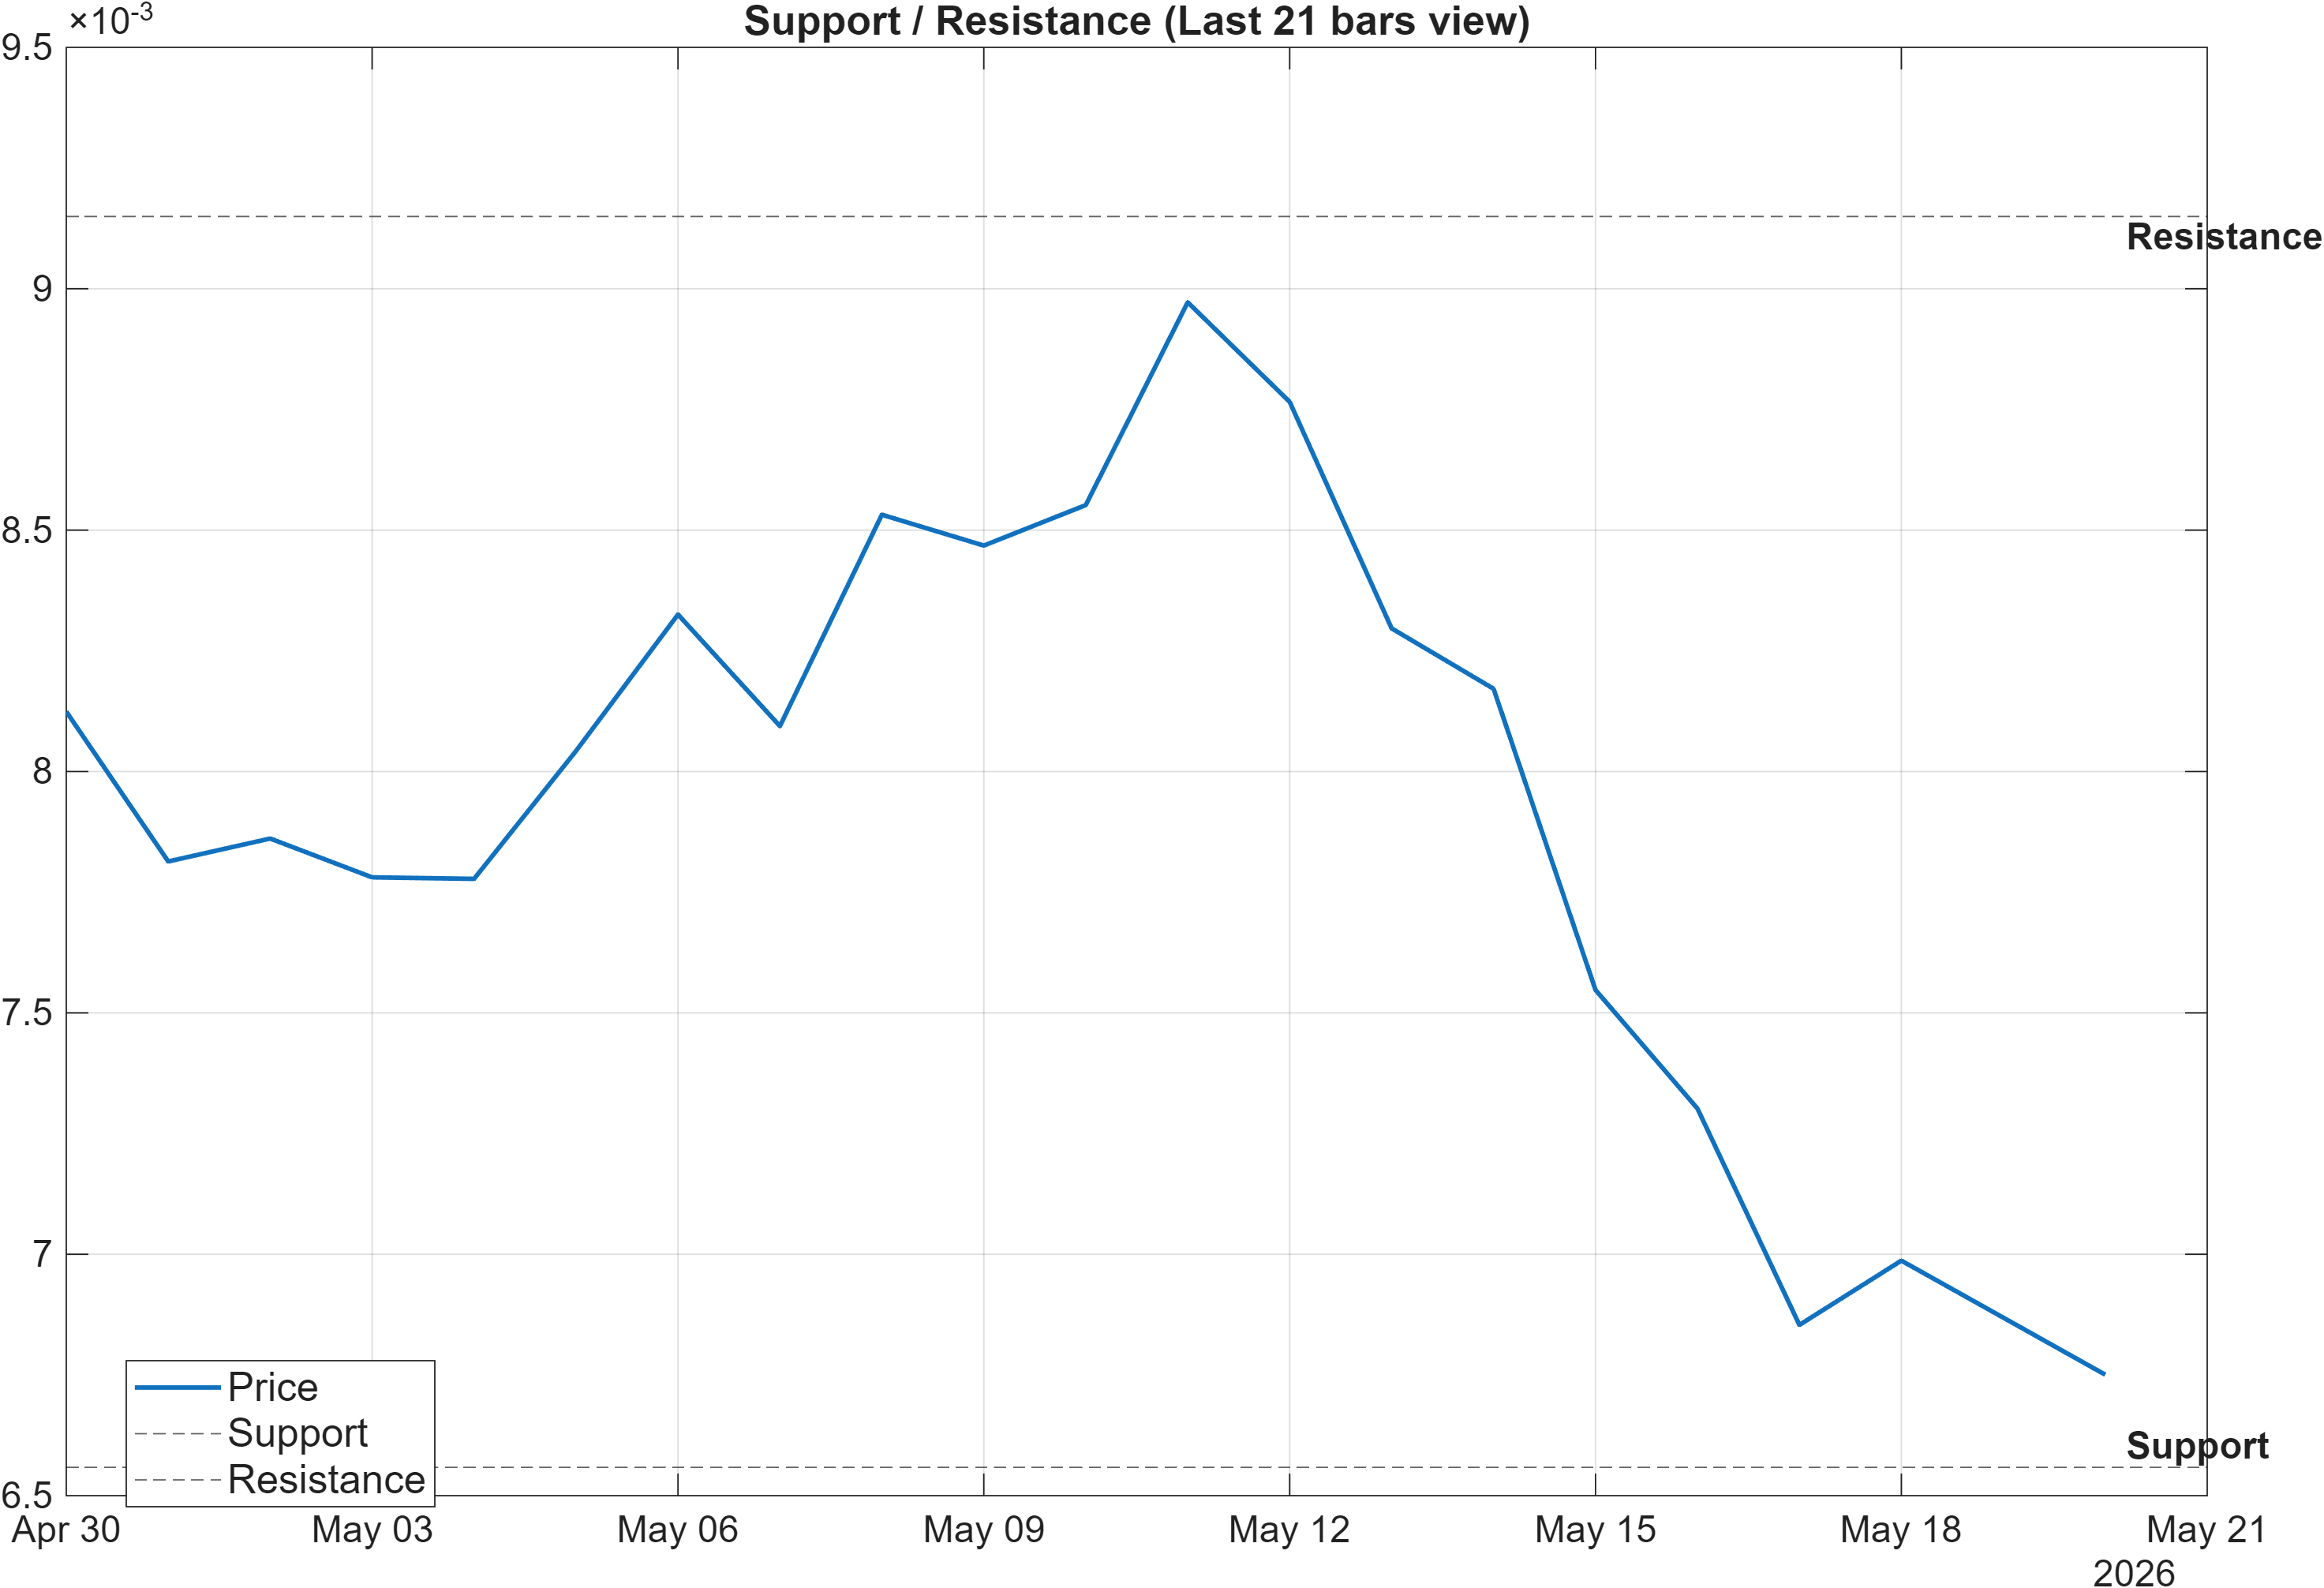
Scenario view: Break above resistance with volume → continuation. Close below support → signal deterioration risk.
Decision zones: confirmation beats anticipation
The current map is relatively clean: support ~0.0066 and resistance ~0.0091 define the nearest probabilistic boundaries. Given bearish momentum (RSI(14) 28.86; MACD histogram negative), support becomes the level that matters most for risk containment. A close below 0.0066 would align deterioration in structure with already-weak momentum, increasing the likelihood that bearish signals remain dominant.
Resistance serves a different function: it is less about “upside potential” and more about state change. A break above 0.0091 with volume would move price beyond the nearest supply zone, improving the odds that downside impulse is transitioning into stabilization or continuation to higher bands. Without that break, rebounds can remain tactical and subject to reversal—especially in an environment where the broader technical confluence score is negative (Section 5).
Notably, the 20-period range markers embedded in the signal table are consistent with these zones: HHIGH(20) at 0.009233 sits near the stated resistance, and LLOW(20) at 0.006559 sits near the stated support. That proximity increases the relevance of the levels because multiple independent constructions are clustering around the same area.
With volatility bandwidth at 0.3361, intraday probes through levels are possible; the scenario language rightly emphasizes break/close confirmation rather than momentary prints.
5) Quant Technical Dashboard (18 Signals)
KGNAI AI Technical Analysis Score (Deep Reinforcement Learning): Rank #452 out of 800 (Rank 1 represents the strongest technical positioning and a higher probability of favorable price behavior. As ranks increase toward the maximum, the probability of favorable outcomes weakens and bearish positioning becomes more dominant.) | Label: Neutral | Score: -0.130
18-Signal Technical Confluence Score: -0.444 (Bearish)
Overall Technical Score (18-signal confluence + DRL rank blend): -0.350 (Bearish)
Note: The blended score reflects signal strength weighted against broader AI technical ranking, which may temporarily diverge.
Blended technical score breakdown: -0.350 (Bearish | Bull 4 / Bear 12 / Neutral 2)
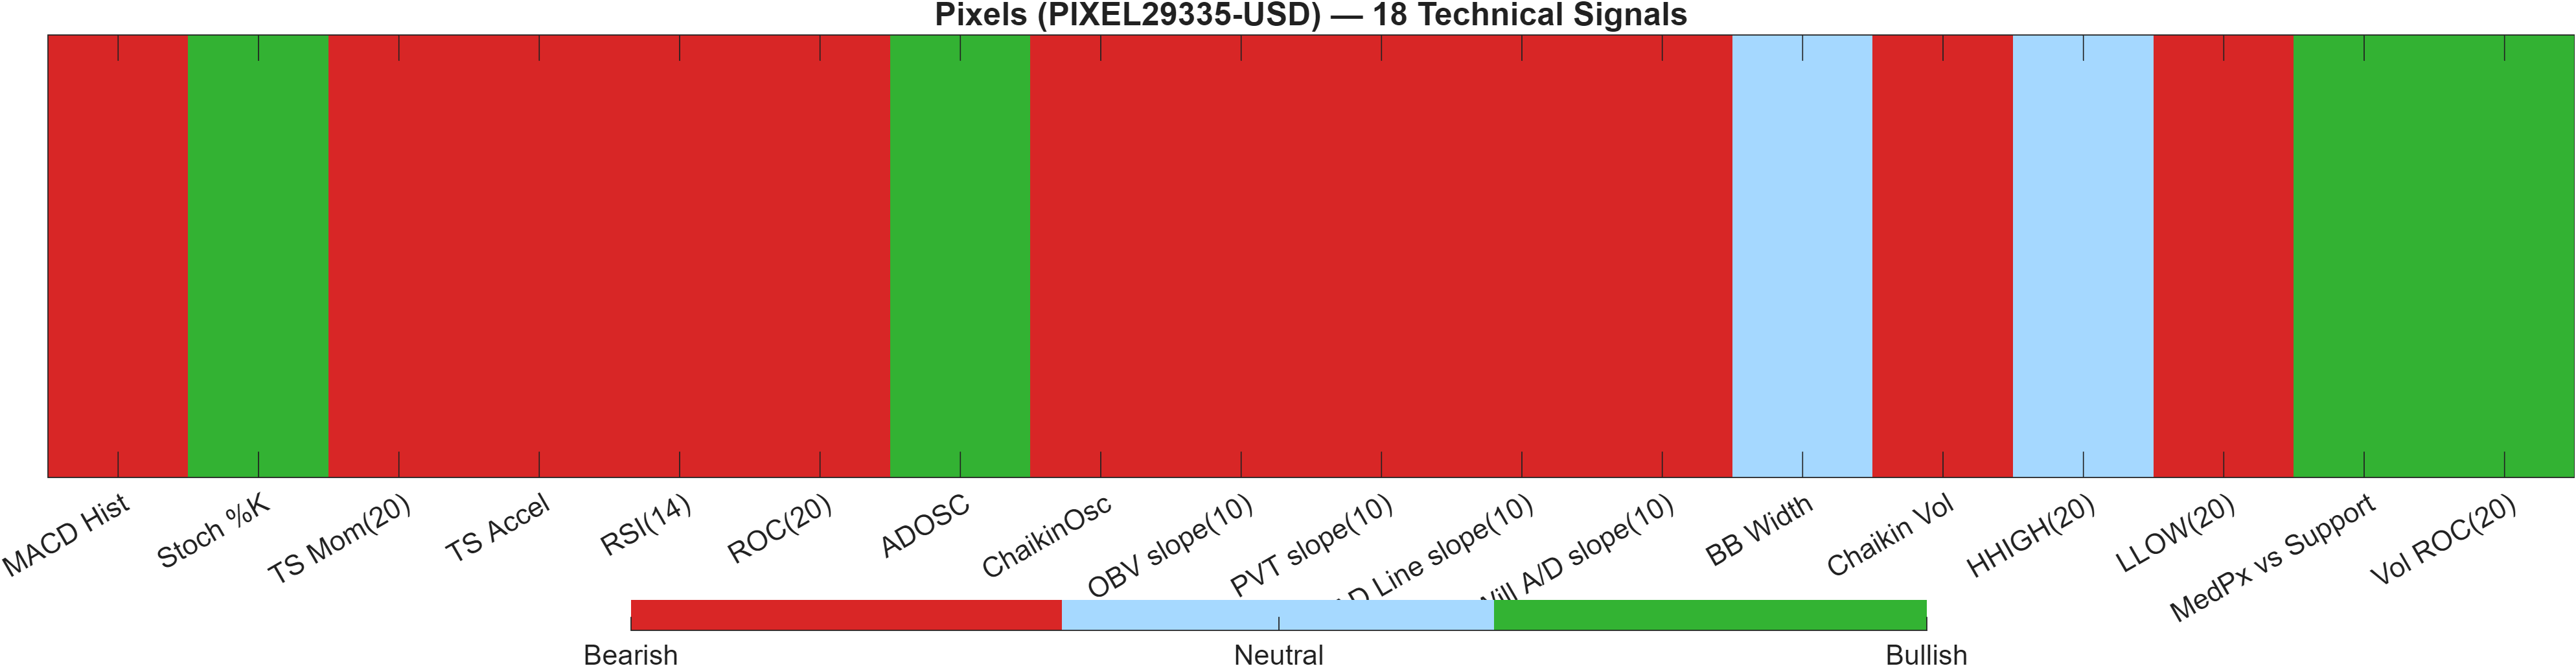
Alignment vs divergence: neutral AI rank, bearish signal stack
The technical dashboard shows a clear internal tension. The Deep Reinforcement Learning (DRL) technical rank is #452 out of 800 with a Neutral label (score -0.130), yet the multi-indicator layer is materially negative: 18-signal confluence at -0.444 and overall blended technical score at -0.350, both marked Bearish.
This kind of divergence often occurs when a broader pattern-recognition model is less pessimistic than the immediate indicator suite, or when signals are early in a potential turn but have not confirmed. Here, the breadth of bearish signals is notable: the breakdown indicates Bear 12 versus Bull 4 (with 2 neutral). That breadth reduces the probability that the bearish read is simply “one indicator being noisy.”
Within the indicator set, momentum and rate-of-change are consistent with weakness: RSI(14) 28.86, ROC(20) -13.61, and negative trend dynamics (e.g., TS Mom(20) -0.0008269) reinforce a downside impulse narrative. A smaller set of bullish flags—such as Stoch %K 16.01 and Vol ROC(20) 21.08—can be interpreted as “oversold + activity,” which sometimes appears near inflection attempts, but does not by itself reverse a bearish stack.
Signal table (Bull/Bear/Neutral)
| Indicator | Value | Signal |
|---|---|---|
| MACD Hist | -0.0001813 | Bearish |
| Stoch %K | 16.01 | Bullish |
| TS Mom(20) | -0.0008269 | Bearish |
| TS Accel | -0.001607 | Bearish |
| RSI(14) | 28.86 | Bearish |
| ROC(20) | -13.61 | Bearish |
| ADOSC | 61.97 | Bullish |
| ChaikinOsc | -7.094e+05 | Bearish |
| OBV slope(10) | -2.601e+07 | Bearish |
| PVT slope(10) | -1.141e+06 | Bearish |
| AD Line slope(10) | -3.973e+06 | Bearish |
| Will A/D slope(10) | -0.001763 | Bearish |
| BB Width | 0.3361 | Neutral |
| Chaikin Vol | 13.94 | Bearish |
| HHIGH(20) | 0.009233 | Neutral |
| LLOW(20) | 0.006559 | Bearish |
| MedPx vs Support | 0.0002793 | Bullish |
| Vol ROC(20) | 21.08 | Bullish |
Interpretation: Indicator-level signals form the base confluence, which is then adjusted using a separate AI-driven technical ranking model. The final technical score summarizes this combined view.
6) News sentiment + extractive gist
Note: Instrument-specific news matches were not found, so the digest includes broader market/sector headlines. Links are provided for verification.
Sentiment score (avg): -0.060 | Positive: 6% | Neutral: 69% | Negative: 25%
KGNAI AI News Sentiment Score (normalized -1 to +1): Not available (as of —) | Label: Not available | Overall news score: -0.06
Positive Developments
Recent coverage across major financial outlets indicates selective optimism in the broader crypto ecosystem, particularly where infrastructure and market plumbing intersect with new demand pockets. One recurring theme is the idea that energy-intensive crypto segments can become strategically relevant in adjacent compute markets, framing parts of the sector as potential capacity providers rather than purely speculative venues. Another constructive thread is continued experimentation around market design—new contract formats and expanded participation mechanisms—which can support liquidity formation over time. Against PIXEL29335-USD’s bearish technical posture (overall technical score -0.350), this constructive backdrop does not function as a bullish signal on its own, but it can help explain why sentiment is not decisively negative despite weak momentum (RSI(14) 28.86). Net: the positive tone is structural and thematic, not instrument-specific, and therefore works mainly as a contextual tailwind rather than a direct catalyst.
Neutral / Mixed Developments
The neutral portion of the news flow reads as policy-and-market-structure “process” rather than direction. Ongoing discussions around oversight, chartering, and regulatory communication tend to arrive as incremental updates, which can stabilize expectations for institutional participants but also extend timelines for clarity. This matches the sentiment distribution—69% neutral—and is consistent with an environment where headline risk exists without an immediate resolution. For PIXEL29335-USD, the key implication is that market participants may stay anchored to technical levels (support ~0.0066; resistance ~0.0091) while waiting for broader signals. In mixed regimes like the current one—close below MA50 yet MA50 above MA200—neutral macro/sector updates can amplify range trading behavior rather than produce sustained trend-following moves.
Negative / Risk Signals
Risk-oriented coverage across major financial outlets has emphasized operational stress and fragility in certain corners of the crypto landscape, alongside renewed focus on fraud, compliance pressure, and forced business model adjustments. Separate from operational headlines, market structure commentary has also highlighted how quickly downside hedging and crowded positioning can dominate price action when benchmarks undergo sharp drawdowns. For PIXEL29335-USD, this matters because the technical layer already reflects a fragile state: bearish confluence (-0.444), negative MACD histogram, and a deeply weak RSI reading. When broader sector risk tone is present, marginal sellers can become more active near support, increasing the importance of close-based confirmation at ~0.0066. This does not guarantee a breakdown; it raises the sensitivity of the tape to negative spillovers while the asset remains technically stressed.
- Whether sentiment stays near -0.060 or shifts alongside volatility (BB Width 0.3361).
- Any cluster of sector risk stories coinciding with a test of 0.0066 support.
- Coverage tone changes if price action begins confirming above 0.0091 resistance with volume.
Sources referenced: Reuters, Bloomberg, Yahoo Finance, MarketWatch, Investing.com
7) Sources
Not available in the provided data.
You may also like: How KGNAI AI ranks instruments across global markets
Disclaimer: KGNAI provides AI-generated analytics and educational market commentary only. This is not financial advice. Markets involve risk. Always do your own research.