
POOLX-USD (Poolz Finance) Technical Outlook — 06-May-2026 | No Directional Commitment
Poolz Finance (POOLX-USD) currently screens as neutral across time horizons in KGNAI’s cross-sectional crypto universe, with ranks sitting in the lower-to-mid tiers of the 800-instrument set (Daily #591, Weekly #461, Monthly #617). Price structure is challenged by a bearish moving-average stack (close below MA50 and MA50 below MA200), while momentum is not decisively skewed: RSI(14) is 48.16 (neutral) and MACD histogram remains slightly positive at 0.0004. Volatility conditions appear contained, with Bollinger Bandwidth at 0.0855, implying a regime that may be prone to either slow mean-reversion or a sudden expansion if levels break. Tactically, the market is framed by support near 0.0870 and resistance near 0.1140, with news sentiment data showing a mild positive tilt (avg 0.063) but predominantly neutral coverage.
- Rank stance (Short / Mid / Long): Neutral / Neutral / Neutral (Daily #591; Weekly #461; Monthly #617 out of 800)
- Technical confluence: Neutral (18-signal confluence 0.222; overall technical score 0.128; DRL rank #437)
- Key levels: Support ~ 0.0870 | Resistance ~ 0.1140
- News sentiment bias: Neutral (avg 0.063; 19% positive / 75% neutral / 6% negative)
- Confirmation / invalidation: A sustained hold above 0.1140 with volume would improve continuation odds; a close below 0.0870 increases deterioration risk.
KGNAI evaluates assets using large cross-sectional datasets built from millions of structured data points. Inputs incorporate fundamental metrics, technical structures, and systematically processed news sentiment. Statistical models, machine learning, and AI frameworks are used to assess relative positioning, signal alignment, and probabilistic behavior across broad universes.
- Ranks are comparative across the tracked universe, not absolute price targets.
- Confluence reflects alignment among independent signal groups.
- Support/resistance levels are probabilistic decision zones, not guarantees.
- Sentiment provides contextual bias within the broader analytical framework.
1) KGNAI AI Analysis
Region: CRYPTO
Total universe size: 800 ranked instruments
- Daily rank: #591 out of 800 — Neutral
- Weekly rank: #461 out of 800 — Neutral
- Monthly rank: #617 out of 800 — Neutral
- 3-Monthly rank: Not available for this horizon — Not available
POOLX-USD is not currently screening as a leadership asset within KGNAI’s 800-instrument crypto universe. The Daily rank of #591 and Monthly rank of #617 position it in the lower portion of the distribution, while the Weekly rank of #461 is comparatively less weak—still neutral, but closer to the middle of the set. This configuration often reflects a market that is not consistently rewarded across horizons: shorter windows may be responding to intermittent stabilization, while the monthly window continues to reflect a heavier overhang from prior trend conditions.
The stated term view is Neutral across short-, mid-, and long-term lenses, which is consistent with a cross-sectional read that lacks decisive relative strength or decisive breakdown pressure. Importantly, the 3-month rank is not available in the provided data, limiting confirmation on whether the weekly improvement is part of a broader regime turn or simply short-lived dispersion.
From a portfolio-construction perspective, this rank profile tends to behave as a selection-risk zone: performance is more sensitive to entry quality, liquidity conditions, and whether technical structure can convert neutral signals into persistence. In this state, the next analytical step is to test whether the technical stack (moving averages, momentum, volatility) confirms the neutral rank stance—or argues for hidden skew.
Term view: Short-term: Neutral. Mid-term: Neutral. Long-term: Neutral.
Want the full universe and complete rank tables? Unlock full access on KGNAI: https://www.kgnai.com/pricing
2) Price & trend overview
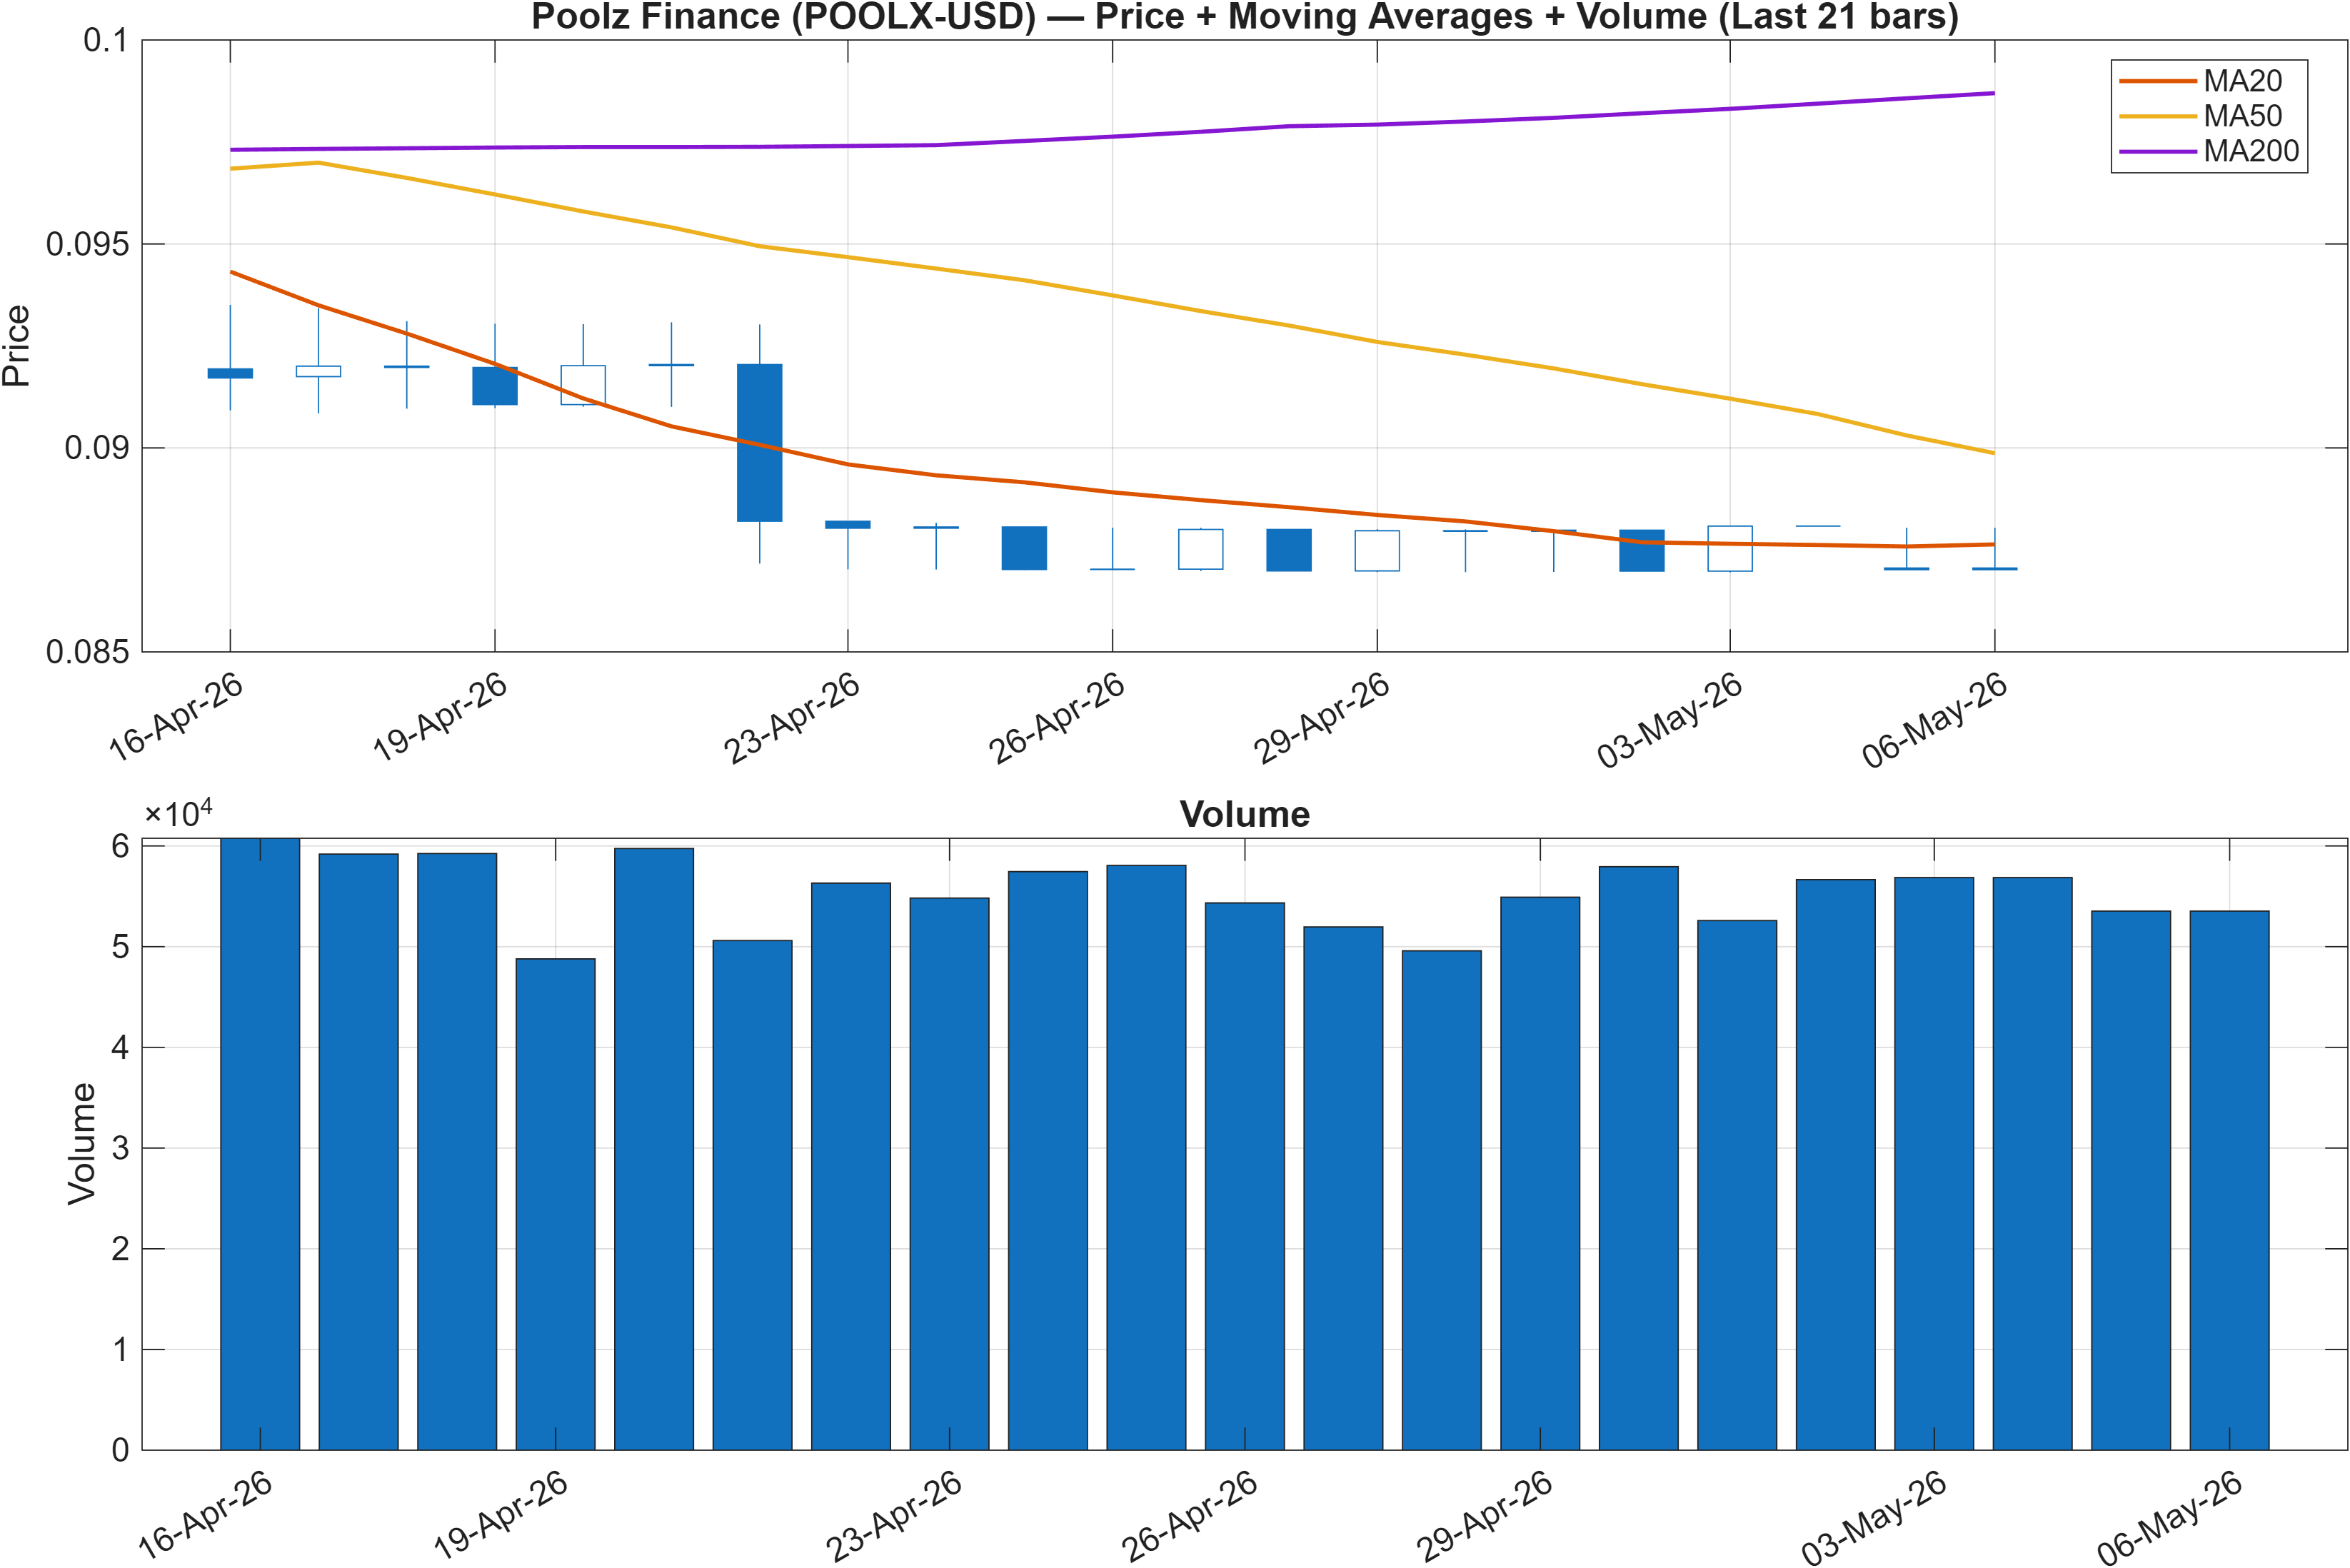
The trend read is currently constrained by a clear bearish moving-average configuration: the close sits below MA50, and MA50 remains below MA200. This alignment typically signals that, even if short-term rebounds appear, they may be occurring within a broader downtrend framework unless price can reclaim intermediate trend measures and hold them.
That said, the broader report stance remains “no directional commitment,” which suggests that the market may be in a phase where trend structure is bearish but follow-through is not sufficiently persistent to justify a fully bearish multi-horizon posture. This is consistent with the rank mix (Weekly #461 versus Monthly #617): the weekly horizon is not strong, but it is less weak than the monthly horizon, hinting at a potential stabilization attempt rather than clean continuation.
Practically, this kind of tape often produces range-bound behavior with intermittent squeezes—especially when volatility compresses (discussed later via Bollinger bandwidth at 0.0855). For trend validation, the most decision-relevant signals are whether price can recover key resistance (0.1140) and whether any recovery is accompanied by improving participation, rather than a drift that fails back into the range.
Interpretation: Close vs MA50 = Bearish, MA50 vs MA200 = Bearish.
3) Momentum & volatility dashboard
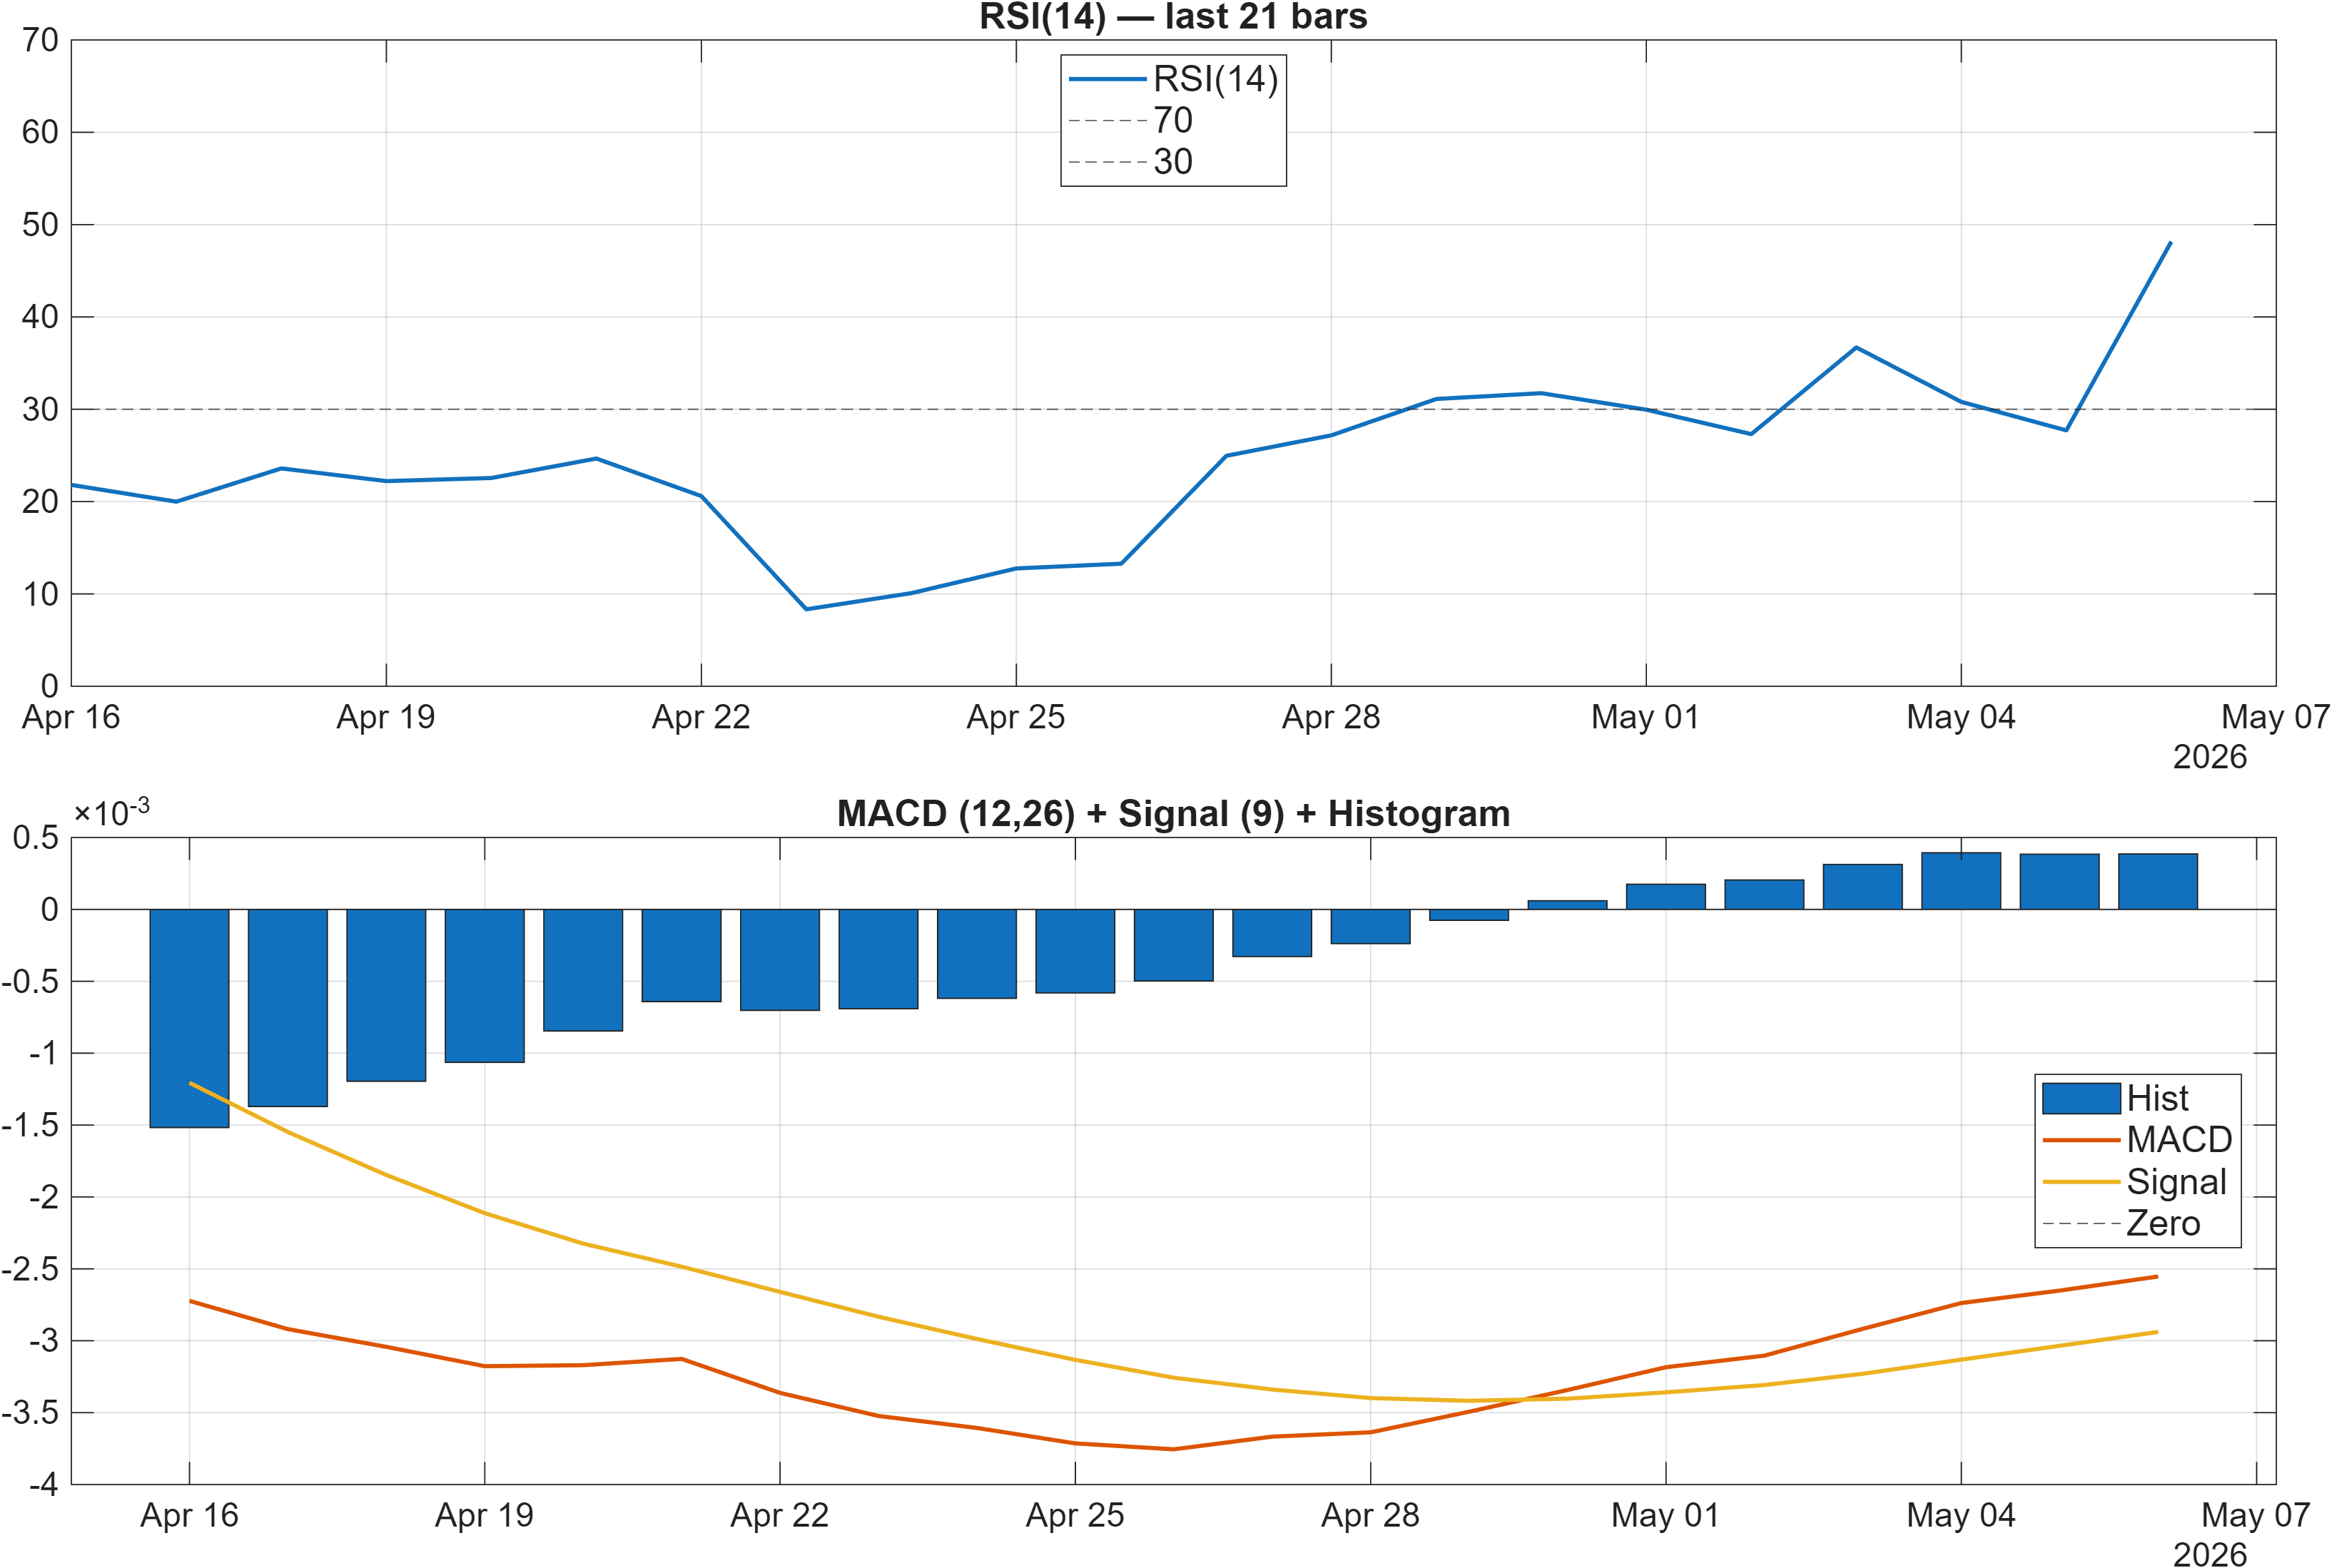
Momentum is best described as balanced but fragile. RSI(14) at 48.16 sits near the midpoint, consistent with the overall neutral classification and suggesting neither persistent buying pressure nor capitulation dynamics. When RSI hovers around this zone, directional edge typically comes from whether subsequent swings can build a sequence of higher lows (bullish) or lower highs (bearish).
MACD histogram is slightly positive at 0.0004 (and 0.0003857 in the signal table), which points to marginally improving short-term momentum. However, with the moving-average trend still bearish, a small positive histogram often reflects relief momentum rather than confirmed trend reversal—particularly if it does not expand meaningfully and if price remains capped under overhead structure.
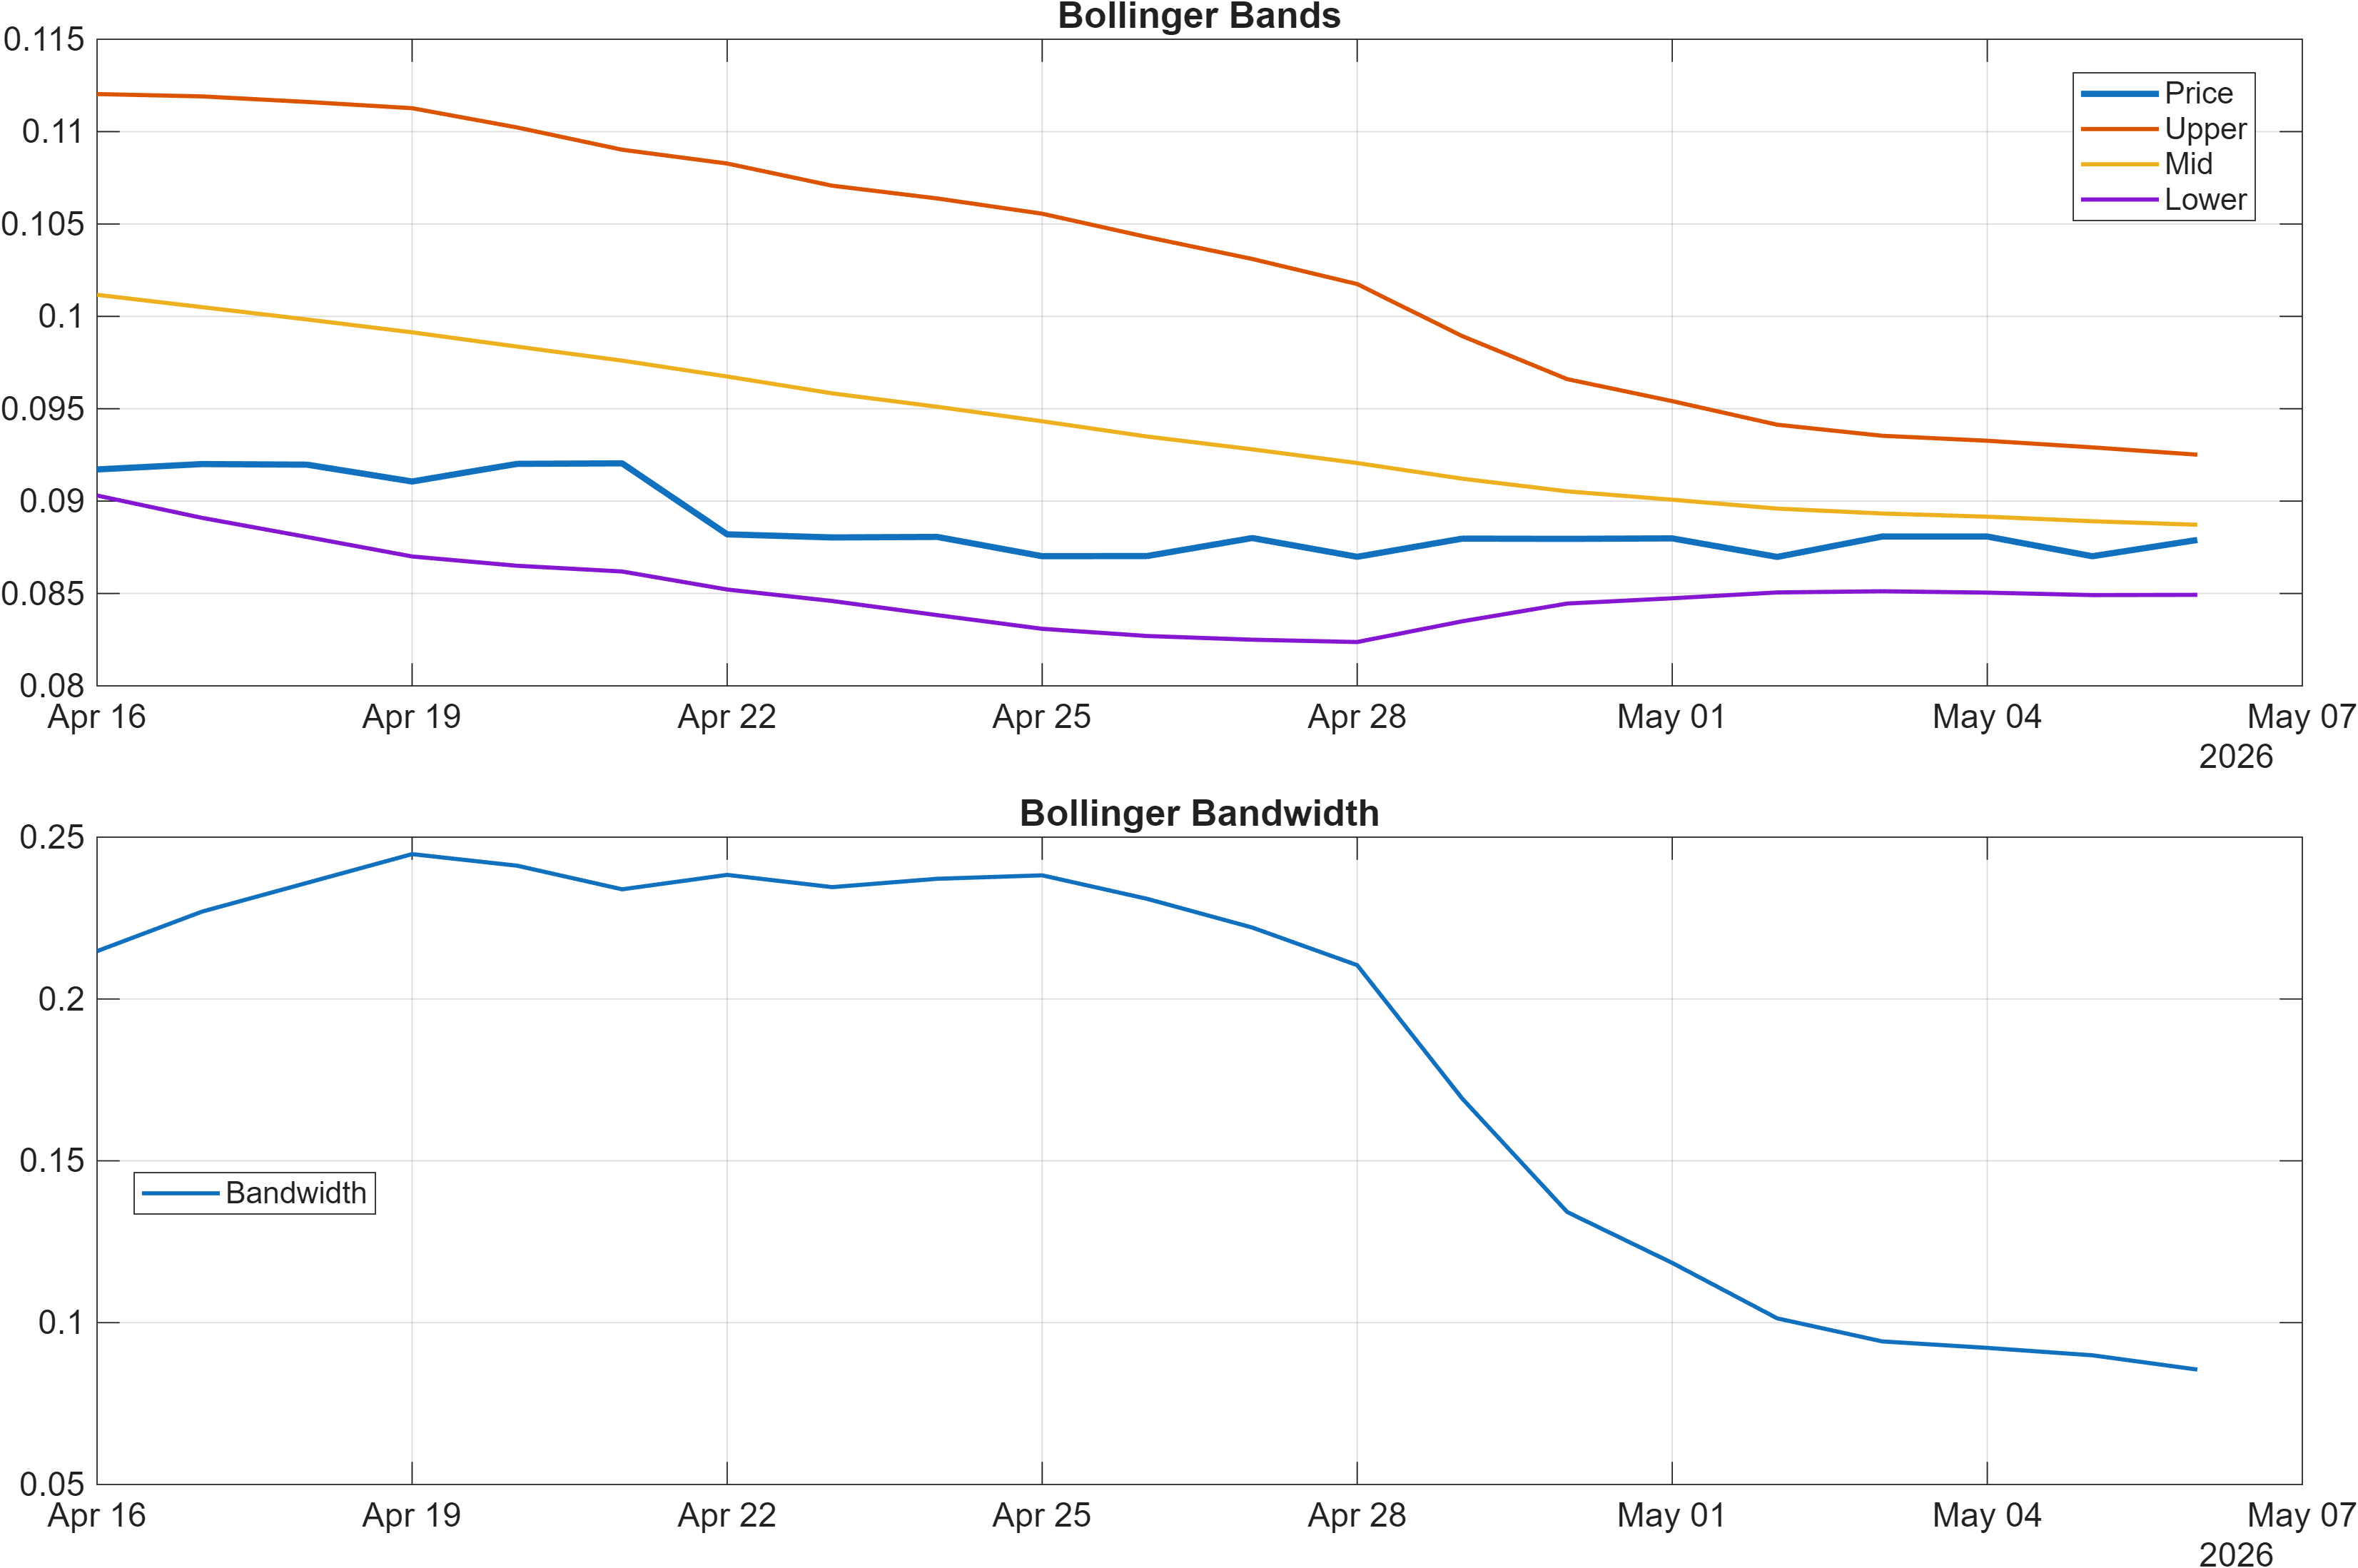
Volatility context adds an important constraint: Bollinger Bandwidth at 0.0855 indicates a relatively contained regime. In practice, compression can precede expansion, but direction is often resolved by which side of the structural range breaks first. This makes the nearby support/resistance framework (support 0.0870, resistance 0.1140) especially relevant: in low-to-moderate bandwidth conditions, breakout confirmation tends to require decisive closes and participation rather than intraday probes.
Interpretation: RSI bias = Neutral, MACD hist = 0.0004.
Interpretation: Bandwidth (volatility regime) latest = 0.0855.
4) Support / Resistance zones
Support ~ 0.0870 | Resistance ~ 0.1140
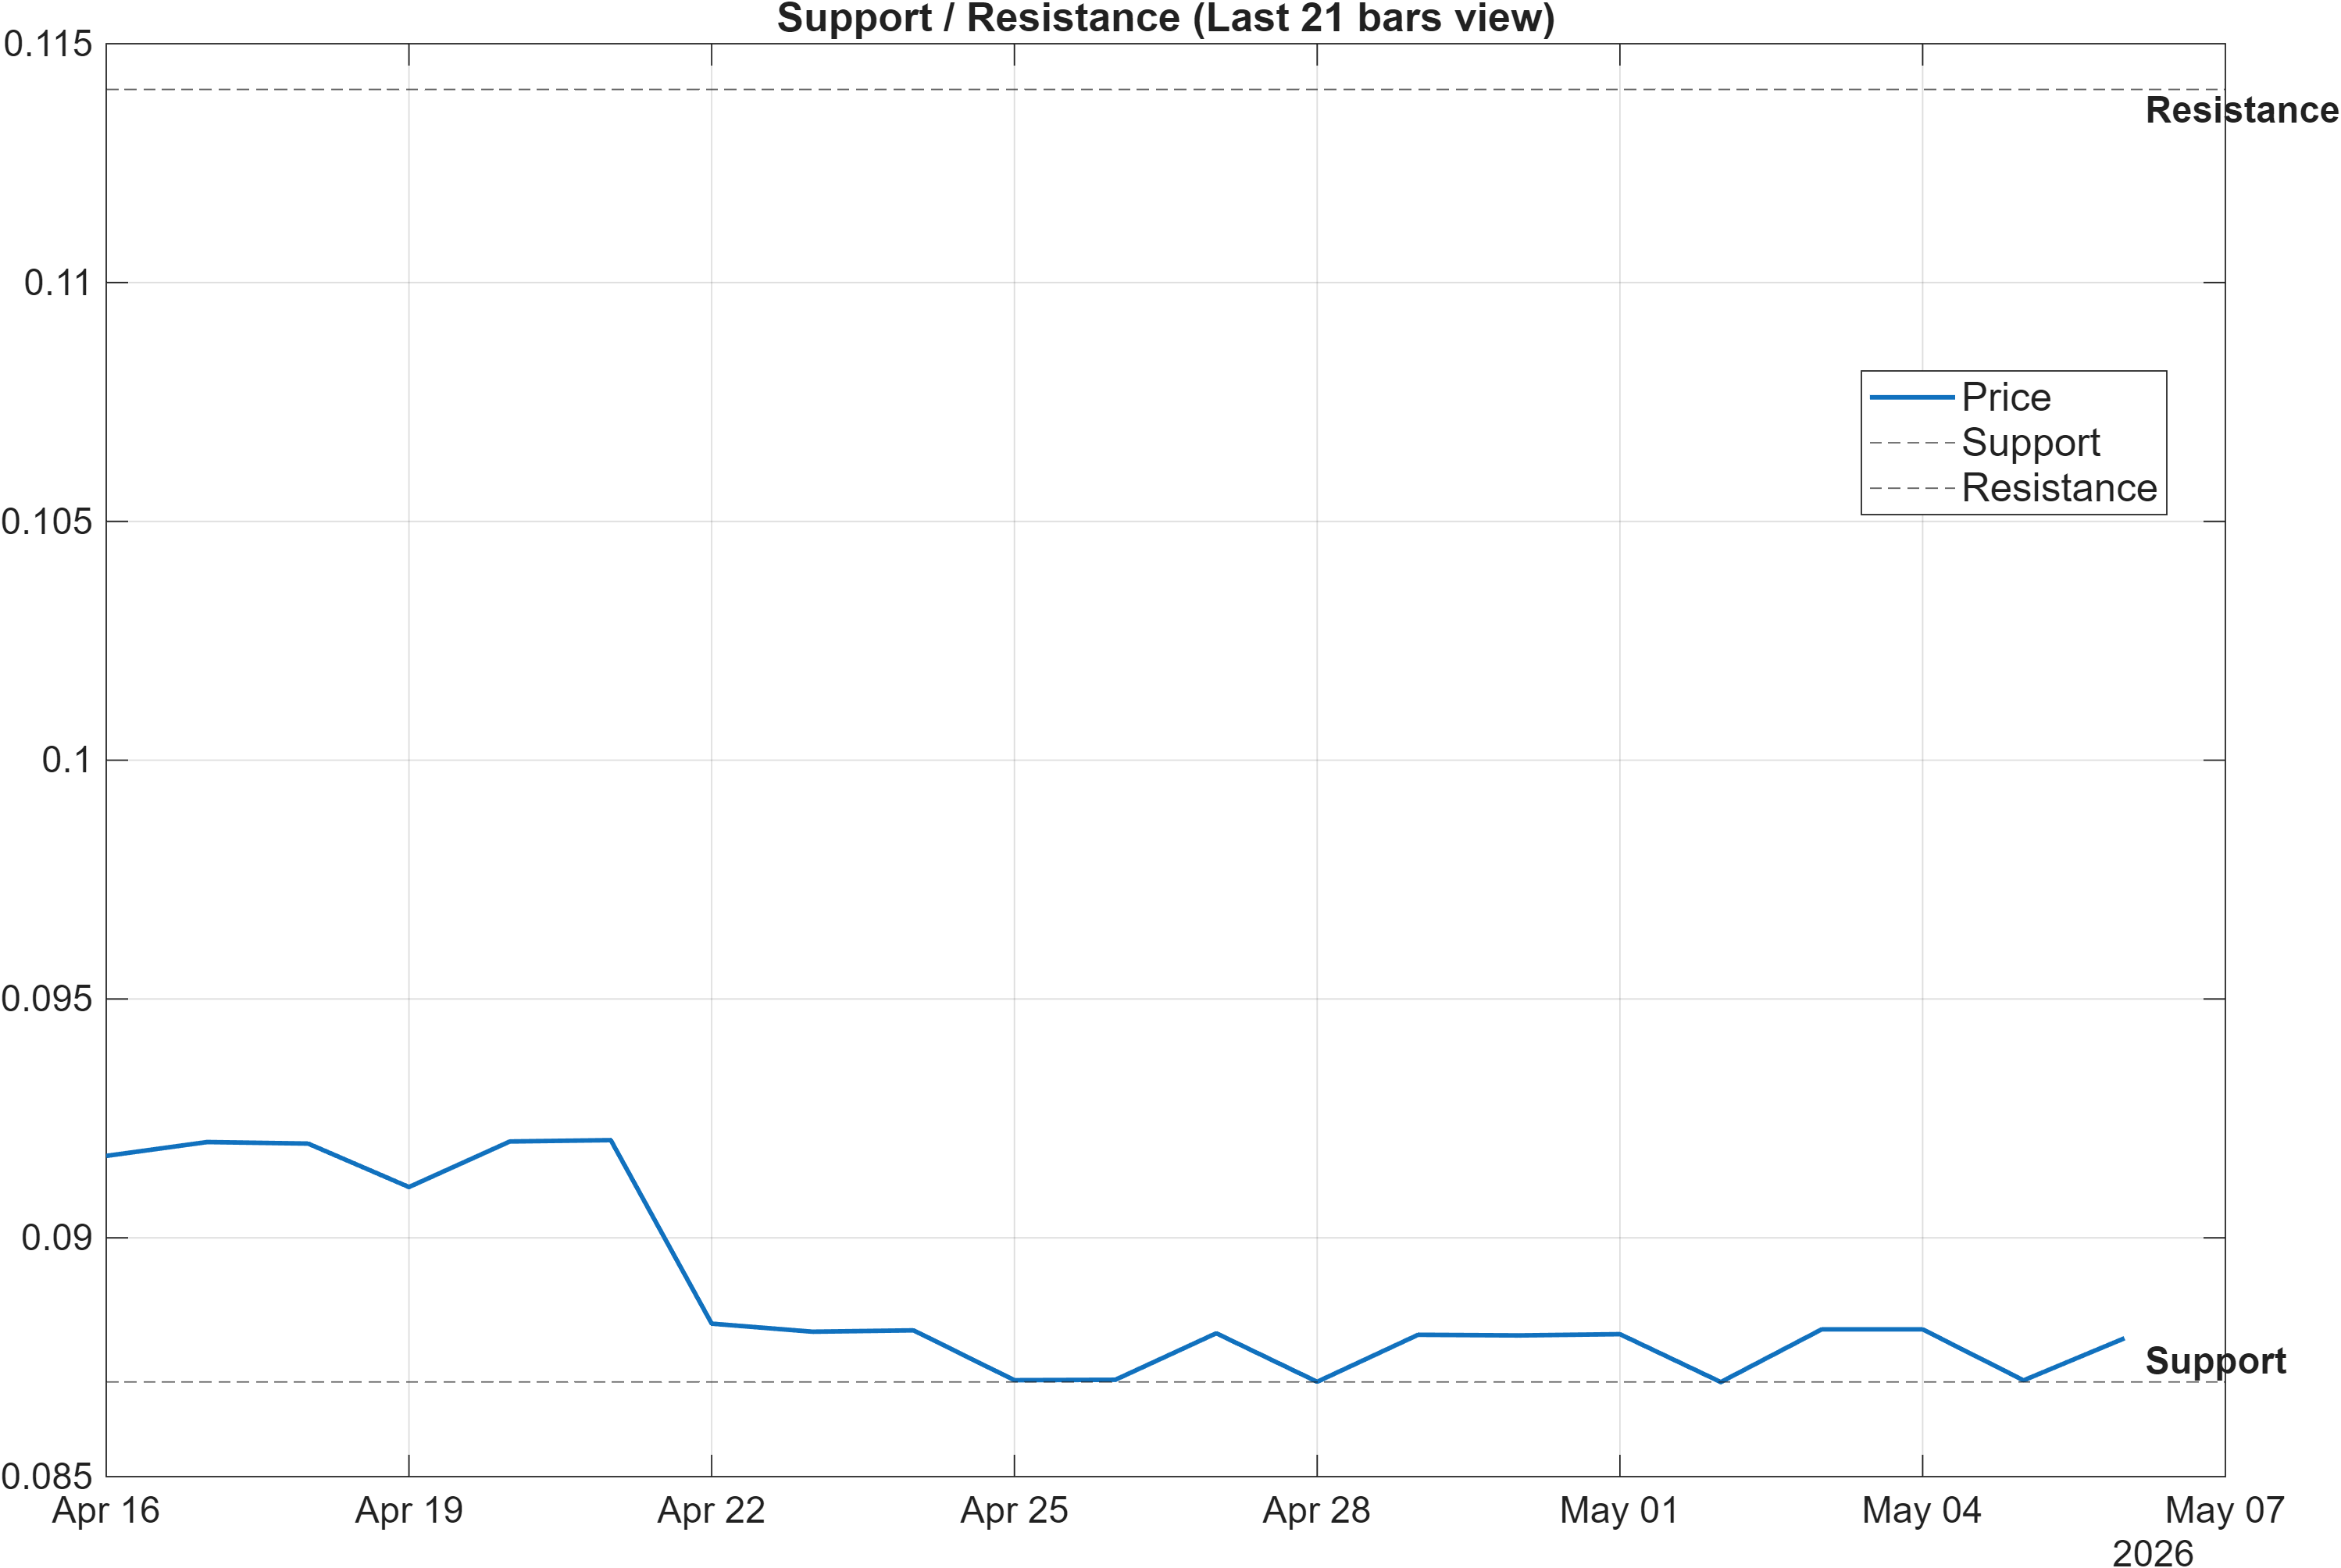
The current map is defined by a tight, decision-heavy corridor between 0.0870 support and 0.1140 resistance. With the broader trend structure still bearish (close below MA50 and MA50 below MA200), resistance acts not only as a ceiling but also as a potential regime test: a clean acceptance above 0.1140 would represent a meaningful change in how the market is pricing downside risk.
Support near 0.0870 is equally critical because several short-window signals suggest the market is attempting to stabilize while still vulnerable. For example, RSI(14) at 48.16 implies price is not oversold, meaning a break of support would be less likely to be “exhaustion-driven” and more likely to reflect renewed distribution. In that downside case, the “no directional commitment” stance can degrade quickly as cross-sectional ranks (Daily #591; Monthly #617) already sit in weaker territory.
In contained volatility (bandwidth 0.0855), false breaks are common. The highest-quality read typically comes from the combination of (1) location versus 0.0870/0.1140, and (2) whether volume/participation improves on the move, aligning with the scenario guidance that emphasizes breakout with volume.
Scenario view: Break above resistance with volume → continuation. Close below support → signal deterioration risk.
5) Quant Technical Dashboard (18 Signals)
KGNAI AI Technical Analysis Score (Deep Reinforcement Learning): Rank #437 out of 800 (Rank 1 represents the strongest technical positioning and a higher probability of favorable price behavior. As ranks increase toward the maximum, the probability of favorable outcomes weakens and bearish positioning becomes more dominant.) | Label: Neutral | Score: -0.093
18-Signal Technical Confluence Score: 0.222 (Neutral)
Overall Technical Score (18-signal confluence + DRL rank blend): 0.128 (Neutral)
Note: The blended score reflects signal strength weighted against broader AI technical ranking, which may temporarily diverge.
Blended technical score breakdown: 0.128 (Neutral | Bull 9 / Bear 5 / Neutral 4)
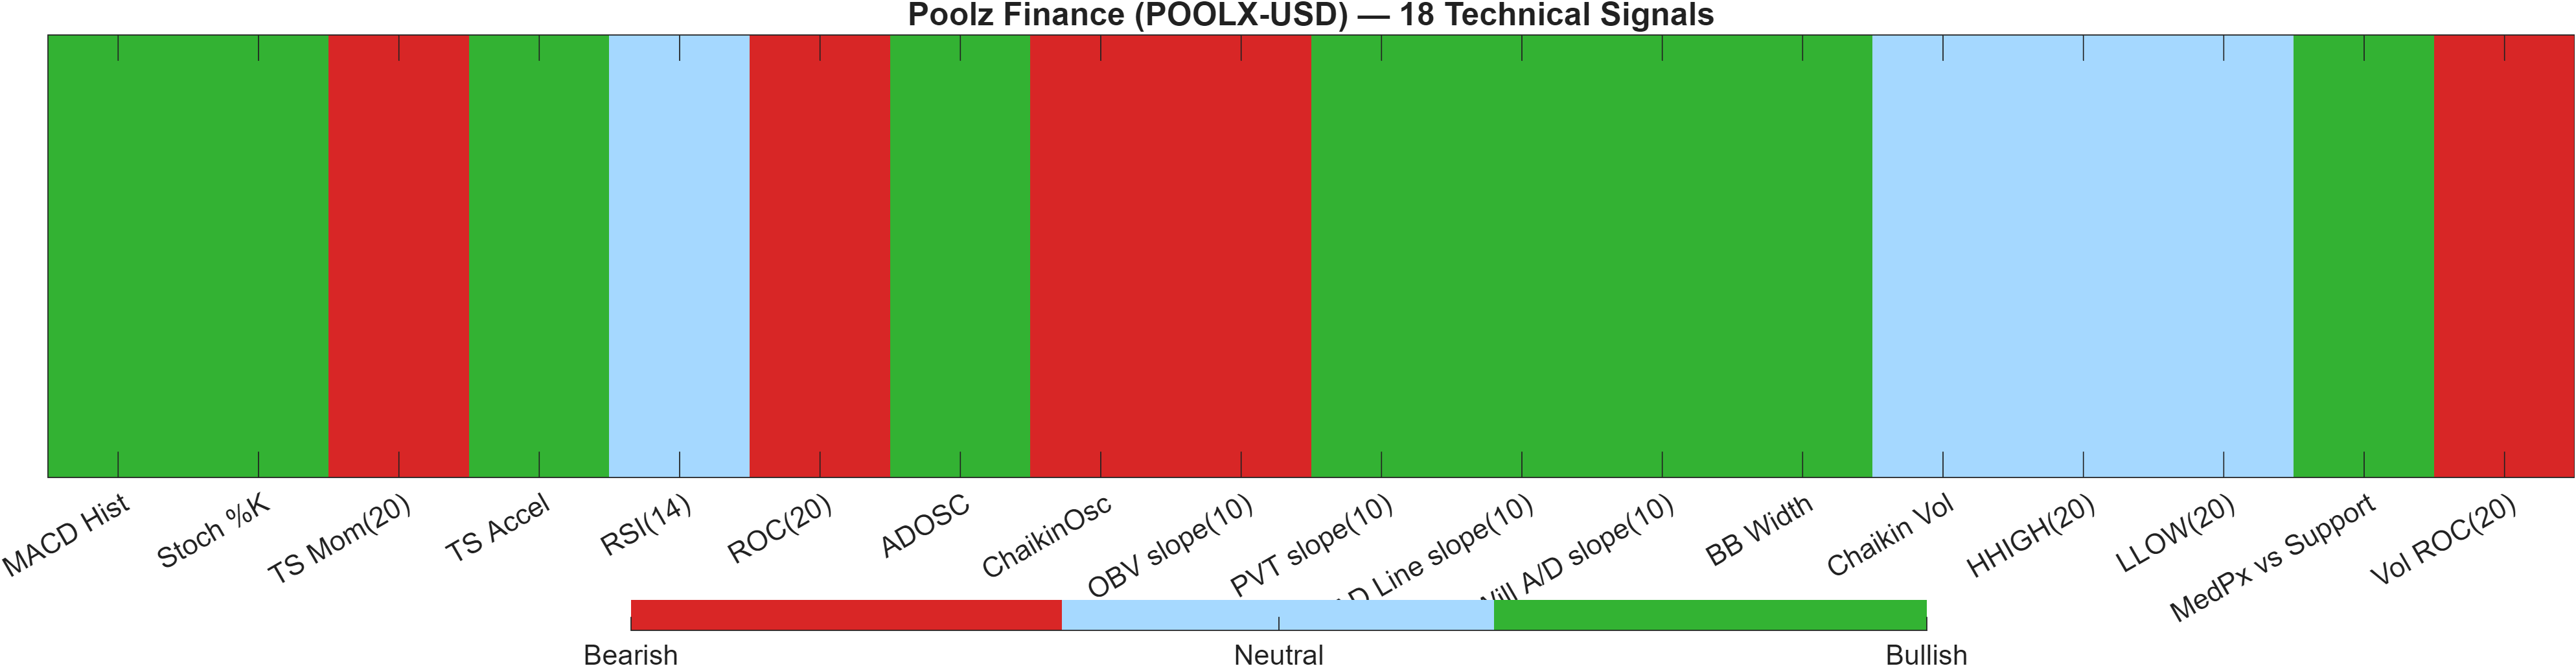
The technical dashboard is internally consistent with a neutral stance, but it is not “flat.” The 18-signal confluence score of 0.222 and the overall technical score of 0.128 both land neutral, yet the composition (Bull 9 / Bear 5 / Neutral 4) shows a slight bullish skew at the indicator level that is being tempered by the broader technical context.
That tempering is visible in the Deep Reinforcement Learning technical rank: #437 out of 800 with a score of -0.093 (neutral label). In other words, discrete indicators are flashing some stabilization/turn characteristics, but the model-weighted regime view is not confirming a strong favorable setup. This kind of divergence often appears when early-cycle oscillators turn up while trend measures remain unresolved.
Within the signal set, momentum and mean-reversion cues are mixed: MACD histogram is bullish (0.0003857) while ROC(20) is bearish (-4.465) and TS Mom(20) is bearish (-0.004989). Volatility/structure metrics are also informative: BB Width is bullish at 0.08551, consistent with a contained regime that can support reversals, but participation proxies are split (e.g., OBV slope(10) bearish at -1399 while PVT slope(10) bullish at 63.77). Net: the dashboard argues for conditional neutrality—a market that needs level confirmation (0.1140 or 0.0870) more than additional oscillator noise.
Signal table (Bull/Bear/Neutral)
| Indicator | Value | Signal |
|---|---|---|
| MACD Hist | 0.0003857 | Bullish |
| Stoch %K | 5.811 | Bullish |
| TS Mom(20) | -0.004989 | Bearish |
| TS Accel | 0.008333 | Bullish |
| RSI(14) | 48.16 | Neutral |
| ROC(20) | -4.465 | Bearish |
| ADOSC | 48.08 | Bullish |
| ChaikinOsc | -7224 | Bearish |
| OBV slope(10) | -1399 | Bearish |
| PVT slope(10) | 63.77 | Bullish |
| AD Line slope(10) | 4.666e+04 | Bullish |
| Will A/D slope(10) | 0.00102 | Bullish |
| BB Width | 0.08551 | Bullish |
| Chaikin Vol | -44.69 | Neutral |
| HHIGH(20) | 0.09343 | Neutral |
| LLOW(20) | 0.08695 | Neutral |
| MedPx vs Support | 0.000546 | Bullish |
| Vol ROC(20) | -9.565 | Bearish |
Interpretation: Indicator-level signals form the base confluence, which is then adjusted using a separate AI-driven technical ranking model. The final technical score summarizes this combined view.
6) News sentiment + extractive gist
Note: Instrument-specific news matches were not found, so the digest includes broader market/sector headlines. Links are provided for verification.
Sentiment score (avg): 0.063 | Positive: 19% | Neutral: 75% | Negative: 6%
KGNAI AI News Sentiment Score (normalized -1 to +1): Not available (as of —) | Label: Not available | Overall news score: 0.06
Positive Developments
Recent coverage across major financial outlets indicates a constructive backdrop driven primarily by large-cap crypto flows and broad market participation rather than POOLX-USD-specific catalysts. Narrative emphasis has leaned toward institutional demand dynamics and resilience in benchmark assets during profit-taking phases, which can indirectly support smaller tokens when risk appetite holds. This aligns with the news mix showing 19% positive items and a mildly positive average sentiment score of 0.063. In a neutral technical regime (overall technical score 0.128), constructive macro-crypto tone can matter most by improving follow-through on breakouts—particularly if volatility remains contained (bandwidth 0.0855) and capital rotates into higher beta segments. Even so, the balance of coverage suggests “supportive context” rather than a decisive tailwind, meaning price still needs to prove itself at key levels.
Neutral / Mixed Developments
The dominant feature of the news tape is its neutrality: 75% neutral items indicates informational coverage that does not consistently push risk-on or risk-off behavior. Themes have included market structure, policy process commentary, and sector adoption narratives that can change expectations without immediately changing positioning. For POOLX-USD, this type of background typically interacts with levels and liquidity: neutral news flow often coincides with range behavior, where support near 0.0870 and resistance near 0.1140 do more analytical work than headline momentum. This is also consistent with RSI(14) at 48.16, which reflects a market not stretched enough to force a directional move without an external catalyst or technical break.
Negative / Risk Signals
Risk coverage across major outlets continues to highlight operational and market-volatility sensitivities within the crypto ecosystem. Even with only 6% negative items, downside narratives can carry disproportionate impact when an asset’s trend structure is already challenged—here, the moving-average stack remains bearish (close below MA50 and MA50 below MA200). In addition, several participation/flow-adjacent signals lean cautious (for example, OBV slope(10) is bearish at -1399 and Vol ROC(20) is bearish at -9.565), which can amplify the effect of adverse sentiment if support is tested. The key risk is not “bad news” in isolation, but the possibility that negative context coincides with a close below 0.0870, converting a neutral regime into a more one-sided deterioration.
- What to monitor next: Whether sentiment stays mildly positive (avg 0.063) if price approaches 0.1140.
- What to monitor next: Any shift in the neutral-heavy mix (75%) toward higher negative share during support tests near 0.0870.
- What to monitor next: Confirmation of risk-on participation via improving volume/flow proxies alongside a breakout attempt.
Snapshot: AI Rank (Short–Mid–Long): Neutral (Neutral–Neutral–Neutral) · Technical Confluence: Neutral · Key Levels: Support ~0.09 | Resistance ~0.11 · News Sentiment: Neutral
Sources referenced: Reuters, Bloomberg, Yahoo Finance, MarketWatch, Investing.com
7) Sources
- Forward Industries, RockawayX back OnRe to build onchain reinsurance on Solana — https://cointelegraph.com/news/forward-industries-rockawayx-onre-solana-reinsurance?utm_source=rss_feed&utm_medium=rss&utm_campaign=rss_partner_inbound
- Ripple CEO says market structure bill not a ‘done deal,’ despite stablecoin compromise — https://cointelegraph.com/news/ripple-ceo-market-structure-progress-stablecoin-compromise?utm_source=rss_feed&utm_medium=rss&utm_campaign=rss_partner_inbound
- Prophet launches AI-powered prediction market with live $10,000 trading tranche — https://cointelegraph.com/press-releases/prophet-launches-ai-powered-prediction-market-with-live-10000-trading-tranche?utm_source=rss_feed&utm_medium=rss&utm_campaign=rss_partner_inbound
- Bitcoin short liquidations push BTC to multi-month highs: Is $90K next? — https://cointelegraph.com/markets/bitcoin-eyes-clear-path-to-90k-as-79b-shorts-unwind-since-february?utm_source=rss_feed&utm_medium=rss&utm_campaign=rss_partner_inbound
- Crypto PAC spends $500K in support of Indiana candidate ahead of primary — https://cointelegraph.com/news/crypto-pac-spending-indiana-candidate-primary?utm_source=rss_feed&utm_medium=rss&utm_campaign=rss_partner_inbound
- Tennessee Bankers Association names Stablecore as preferred digital asset provider — https://cointelegraph.com/news/tennessee-bankers-association-stablecore-digital-asset-provider?utm_source=rss_feed&utm_medium=rss&utm_campaign=rss_partner_inbound
- Crypto Fear and Greed Index turns neutral for first time since January: Is $100K BTC next? — https://cointelegraph.com/markets/crypto-fear-and-greed-flips-to-neutral-for-the-first-time-since-january?utm_source=rss_feed&utm_medium=rss&utm_campaign=rss_partner_inbound
- US prosecutors ask for leniency for ex-Celsius exec, citing cooperation — https://cointelegraph.com/news/us-prosecutors-recommendation-celsius-exec-sentencing?utm_source=rss_feed&utm_medium=rss&utm_campaign=rss_partner_inbound
You may also like: How KGNAI AI ranks instruments across global markets
Disclaimer: KGNAI provides AI-generated analytics and educational market commentary only. This is not financial advice. Markets involve risk. Always do your own research.