
LINK-USD (Chainlink) — 08-May-2026 Technical & Rank Review: Bullish Alignment, Neutral News Bias
Chainlink (LINK-USD) enters 08-May-2026 with a broadly constructive setup across KGNAI ranks and most technical factors, while news sentiment remains statistically neutral. In the cross-asset crypto universe (800 instruments), LINK-USD shows strongest relative positioning on the weekly and 3‑monthly horizons, with the daily rank also residing in the upper tier of the distribution. The technical layer reinforces this picture: the 18-signal confluence is Bullish, with momentum and participation measures largely supportive, while volatility remains controlled rather than explosive. At the same time, the DRL technical rank sits closer to the middle of the universe, creating a useful tension: near-term indicator alignment is positive, but the broader AI technical ranking is not as strong as the confluence alone would imply. Key decision zones are well-defined near support at 8.5035 and resistance at 9.8871, helping frame confirmation versus deterioration conditions.
- Rank stance: Short Bullish | Mid Bullish | Long Bullish
- Technical confluence: Bullish (18-signal score 0.722; blended 0.526) with a Neutral DRL rank (#373/800)
- Key levels: Support ~ 8.5035 | Resistance ~ 9.8871
- News sentiment bias: Neutral (avg sentiment 0.000; 100% neutral)
- Confirmation / invalidation: A sustained break above 9.8871 with volume supports continuation; a close below 8.5035 increases deterioration risk.
What KGNAI Measures
KGNAI evaluates assets using large cross-sectional datasets built from millions of structured data points. Inputs incorporate fundamental metrics, technical structures, and systematically processed news sentiment. Statistical models, machine learning, and AI frameworks are used to assess relative positioning, signal alignment, and probabilistic behavior across broad universes.
How to Read This Report
- Ranks are comparative across the tracked universe, not absolute price targets.
- Confluence reflects alignment among independent signal groups.
- Support/resistance levels are probabilistic decision zones, not guarantees.
- Sentiment provides contextual bias within the broader analytical framework.
1) KGNAI AI Analysis
Region: CRYPTO
Total universe size: 800 ranked instruments
- Daily rank: #59 out of 800 — Bullish
- Weekly rank: #14 out of 800 — Bullish
- Monthly rank: #134 out of 800 — Bullish
- 3-Monthly rank: #23 out of 800 — Bullish
The rank stack for LINK-USD is notable for consistency across horizons, with the strongest relative standing concentrated in the weekly and 3‑monthly windows. A weekly rank of #14 places LINK-USD in the top decile of the 800-instrument universe, suggesting its recent behavior has been among the more constructive within the crypto cohort. The 3‑monthly rank of #23 reinforces that this is not purely a short-lived impulse, while the daily rank of #59 remains firmly in the upper slice of the distribution—supportive, though less extreme than the weekly reading.
The monthly rank of #134 introduces a useful nuance: the longish intermediate window is still bullish, yet it trails the weekly/quarterly strength. In practical signal terms, that pattern often reflects a market transitioning from recovery to trend organization, where shorter-term tests improve faster than the broader rolling window fully “catches up.” Importantly, KGNAI frames ranks as relative probability positioning rather than deterministic direction; the key analytical takeaway is the alignment of bullish labels across daily, weekly, monthly, and 3‑monthly categories.
From a regime perspective, the combination of a very strong weekly rank alongside a less aggressive (but still bullish) monthly rank tends to be most credible when technical confirmation holds above decision zones—particularly with the nearby support at 8.5035 and resistance at 9.8871 acting as validation points for whether relative strength can persist.
Term view: Short-term: Bullish. Mid-term: Bullish. Long-term: Bullish.
Want the full universe and complete rank tables? Unlock full access on KGNAI: https://www.kgnai.com/pricing
2) Price & trend overview
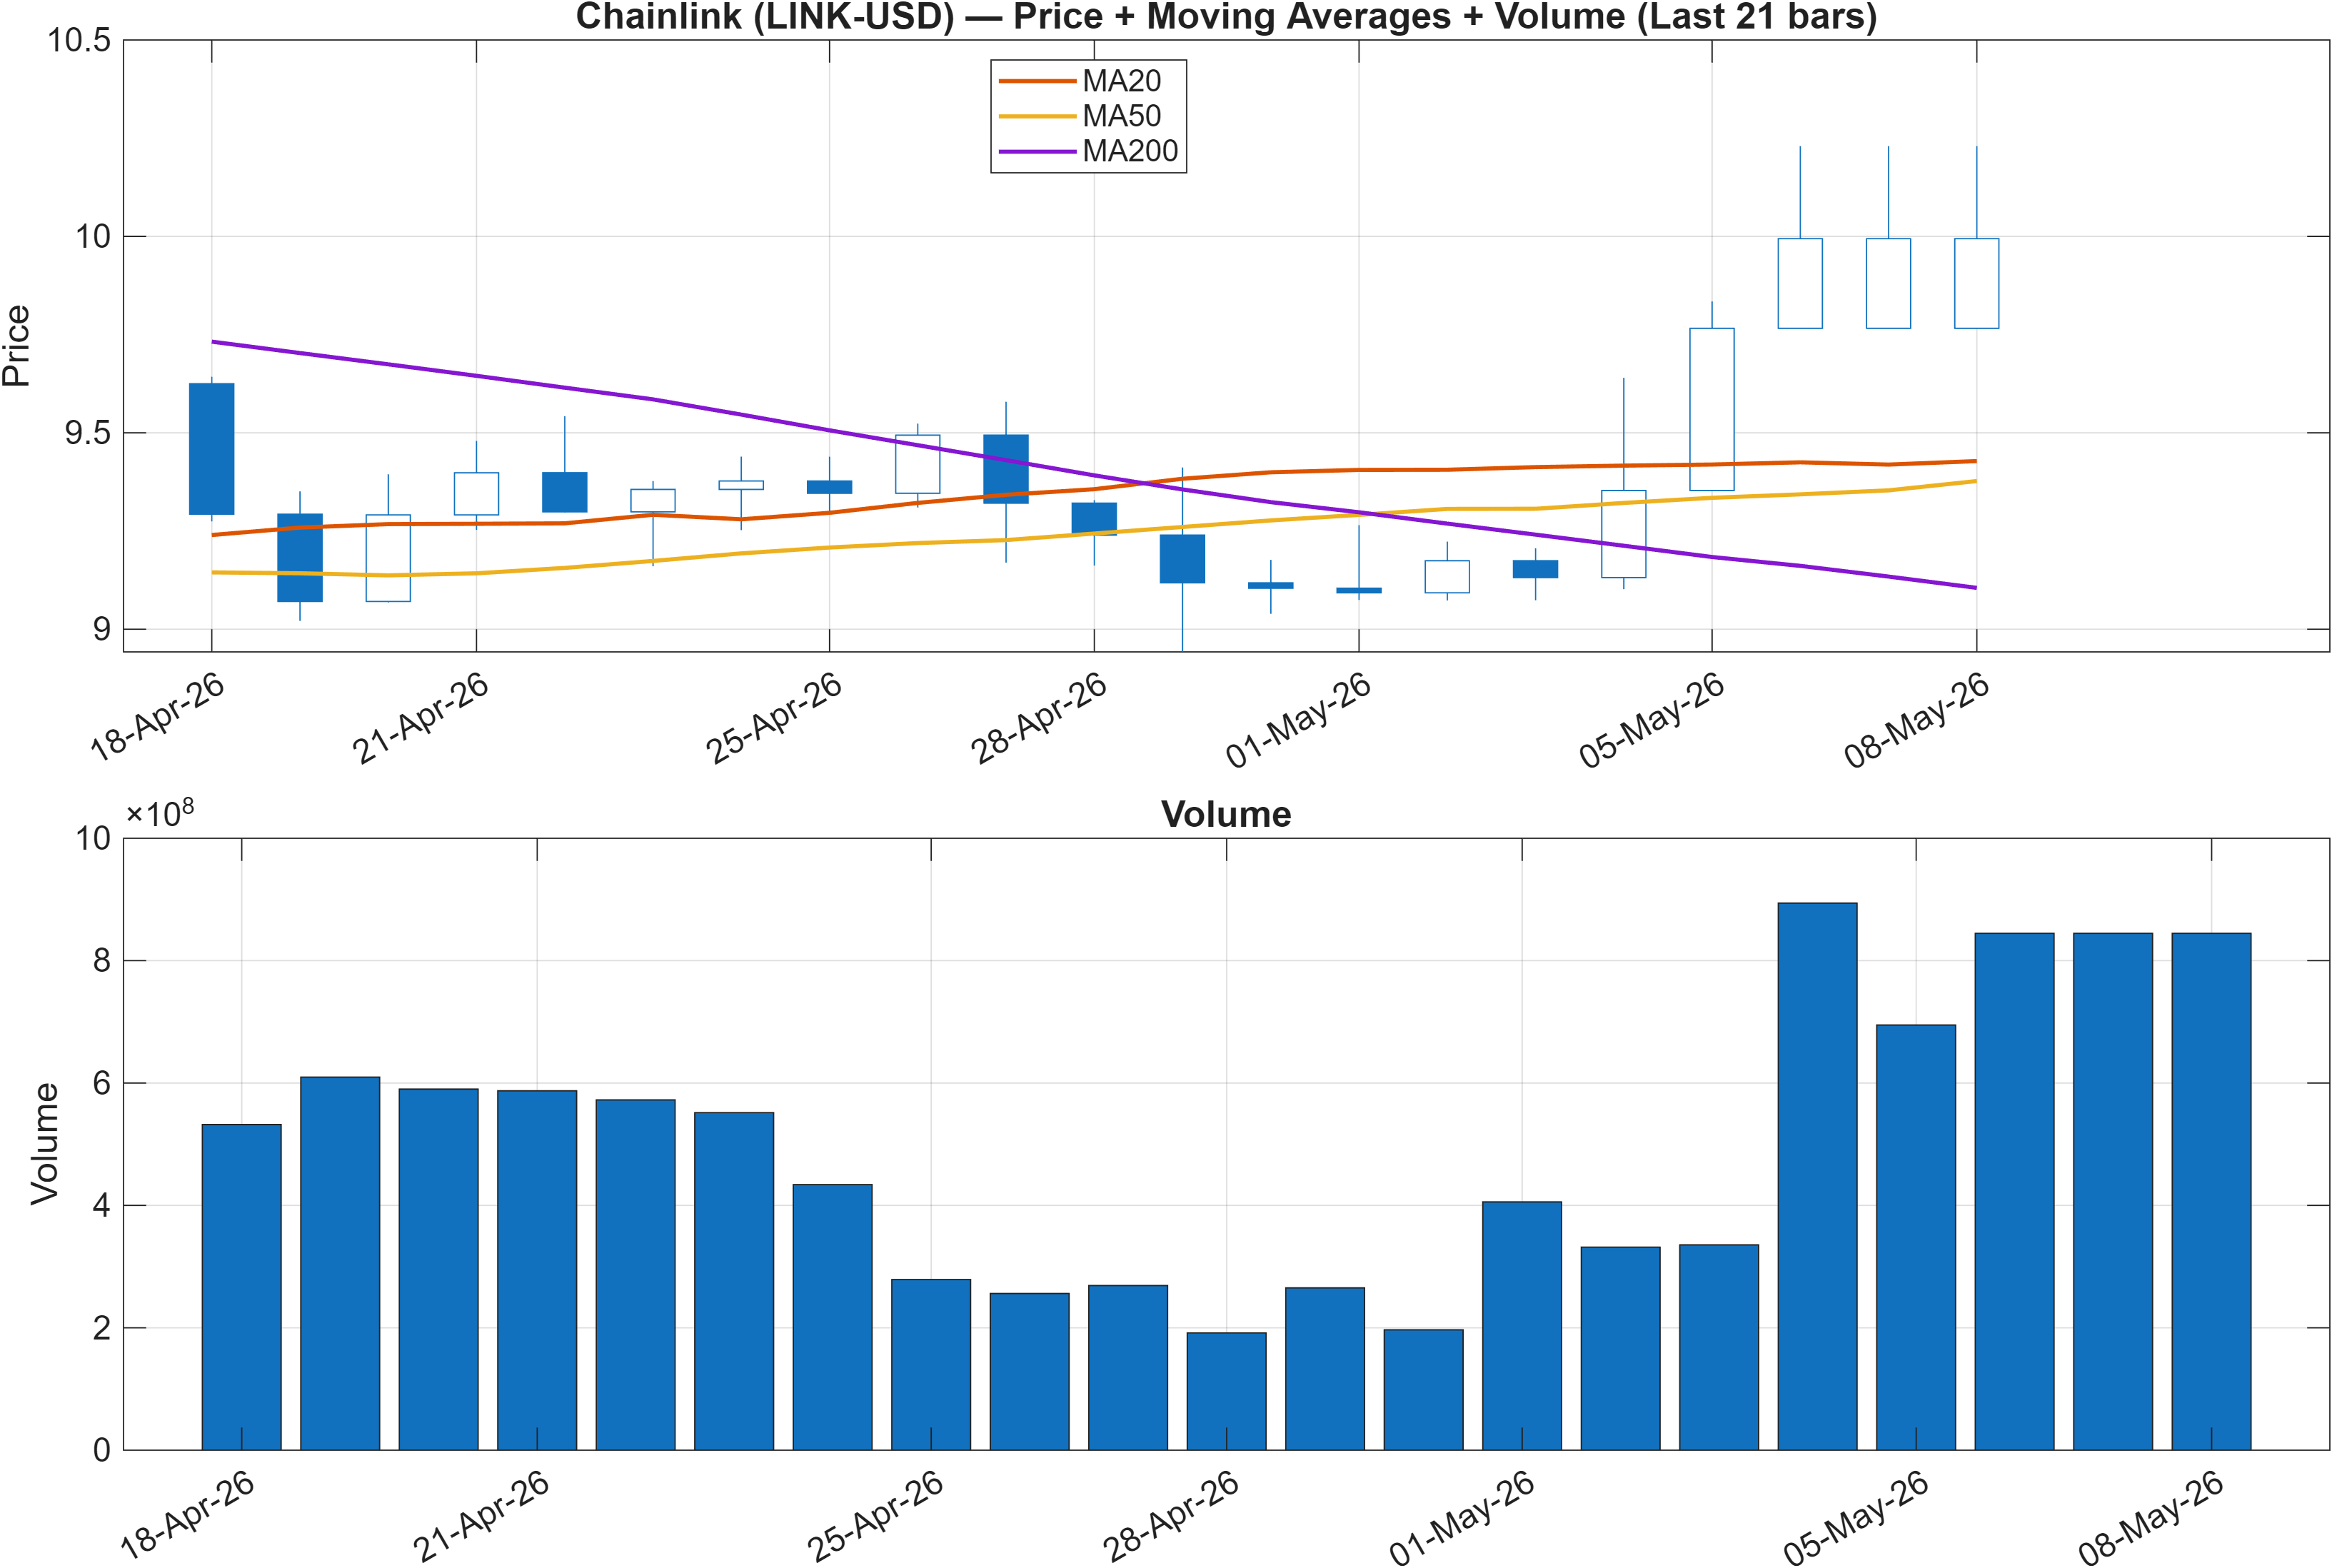
The trend read is defined by a two-layer moving-average alignment: price is above the MA50 and the MA50 is above the MA200, a configuration that typically corresponds to a constructive medium-term regime rather than a purely mean-reversion setup. That alignment fits the strong weekly and 3‑monthly ranks (#14 and #23) and suggests that relative strength is supported by trend structure rather than relying solely on short-lived volatility bursts.
A useful cross-check is the interaction between trend and nearby levels. With resistance identified at 9.8871, the market is close enough to a decision point that the trend can either extend (if participation confirms) or stall into range behavior (if buying pressure fades). The presence of well-defined support at 8.5035 helps quantify how much room exists before trend structure is meaningfully challenged; this matters because the daily rank (#59) is positive but not as extreme as the weekly reading, leaving some sensitivity to pullbacks without necessarily flipping the broader bias.
The current trend condition is better described as organized strength rather than speculative acceleration. That framing is consistent with the volatility dashboard showing a Bollinger bandwidth of 0.1192, which does not indicate a runaway expansion regime. In other words, the moving-average structure provides a supportive backbone, while the volatility profile suggests a market that may still require confirmation to transition from strength into sustained breakout behavior.
Interpretation: Close vs MA50 = Bullish, MA50 vs MA200 = Bullish.
3) Momentum & volatility dashboard
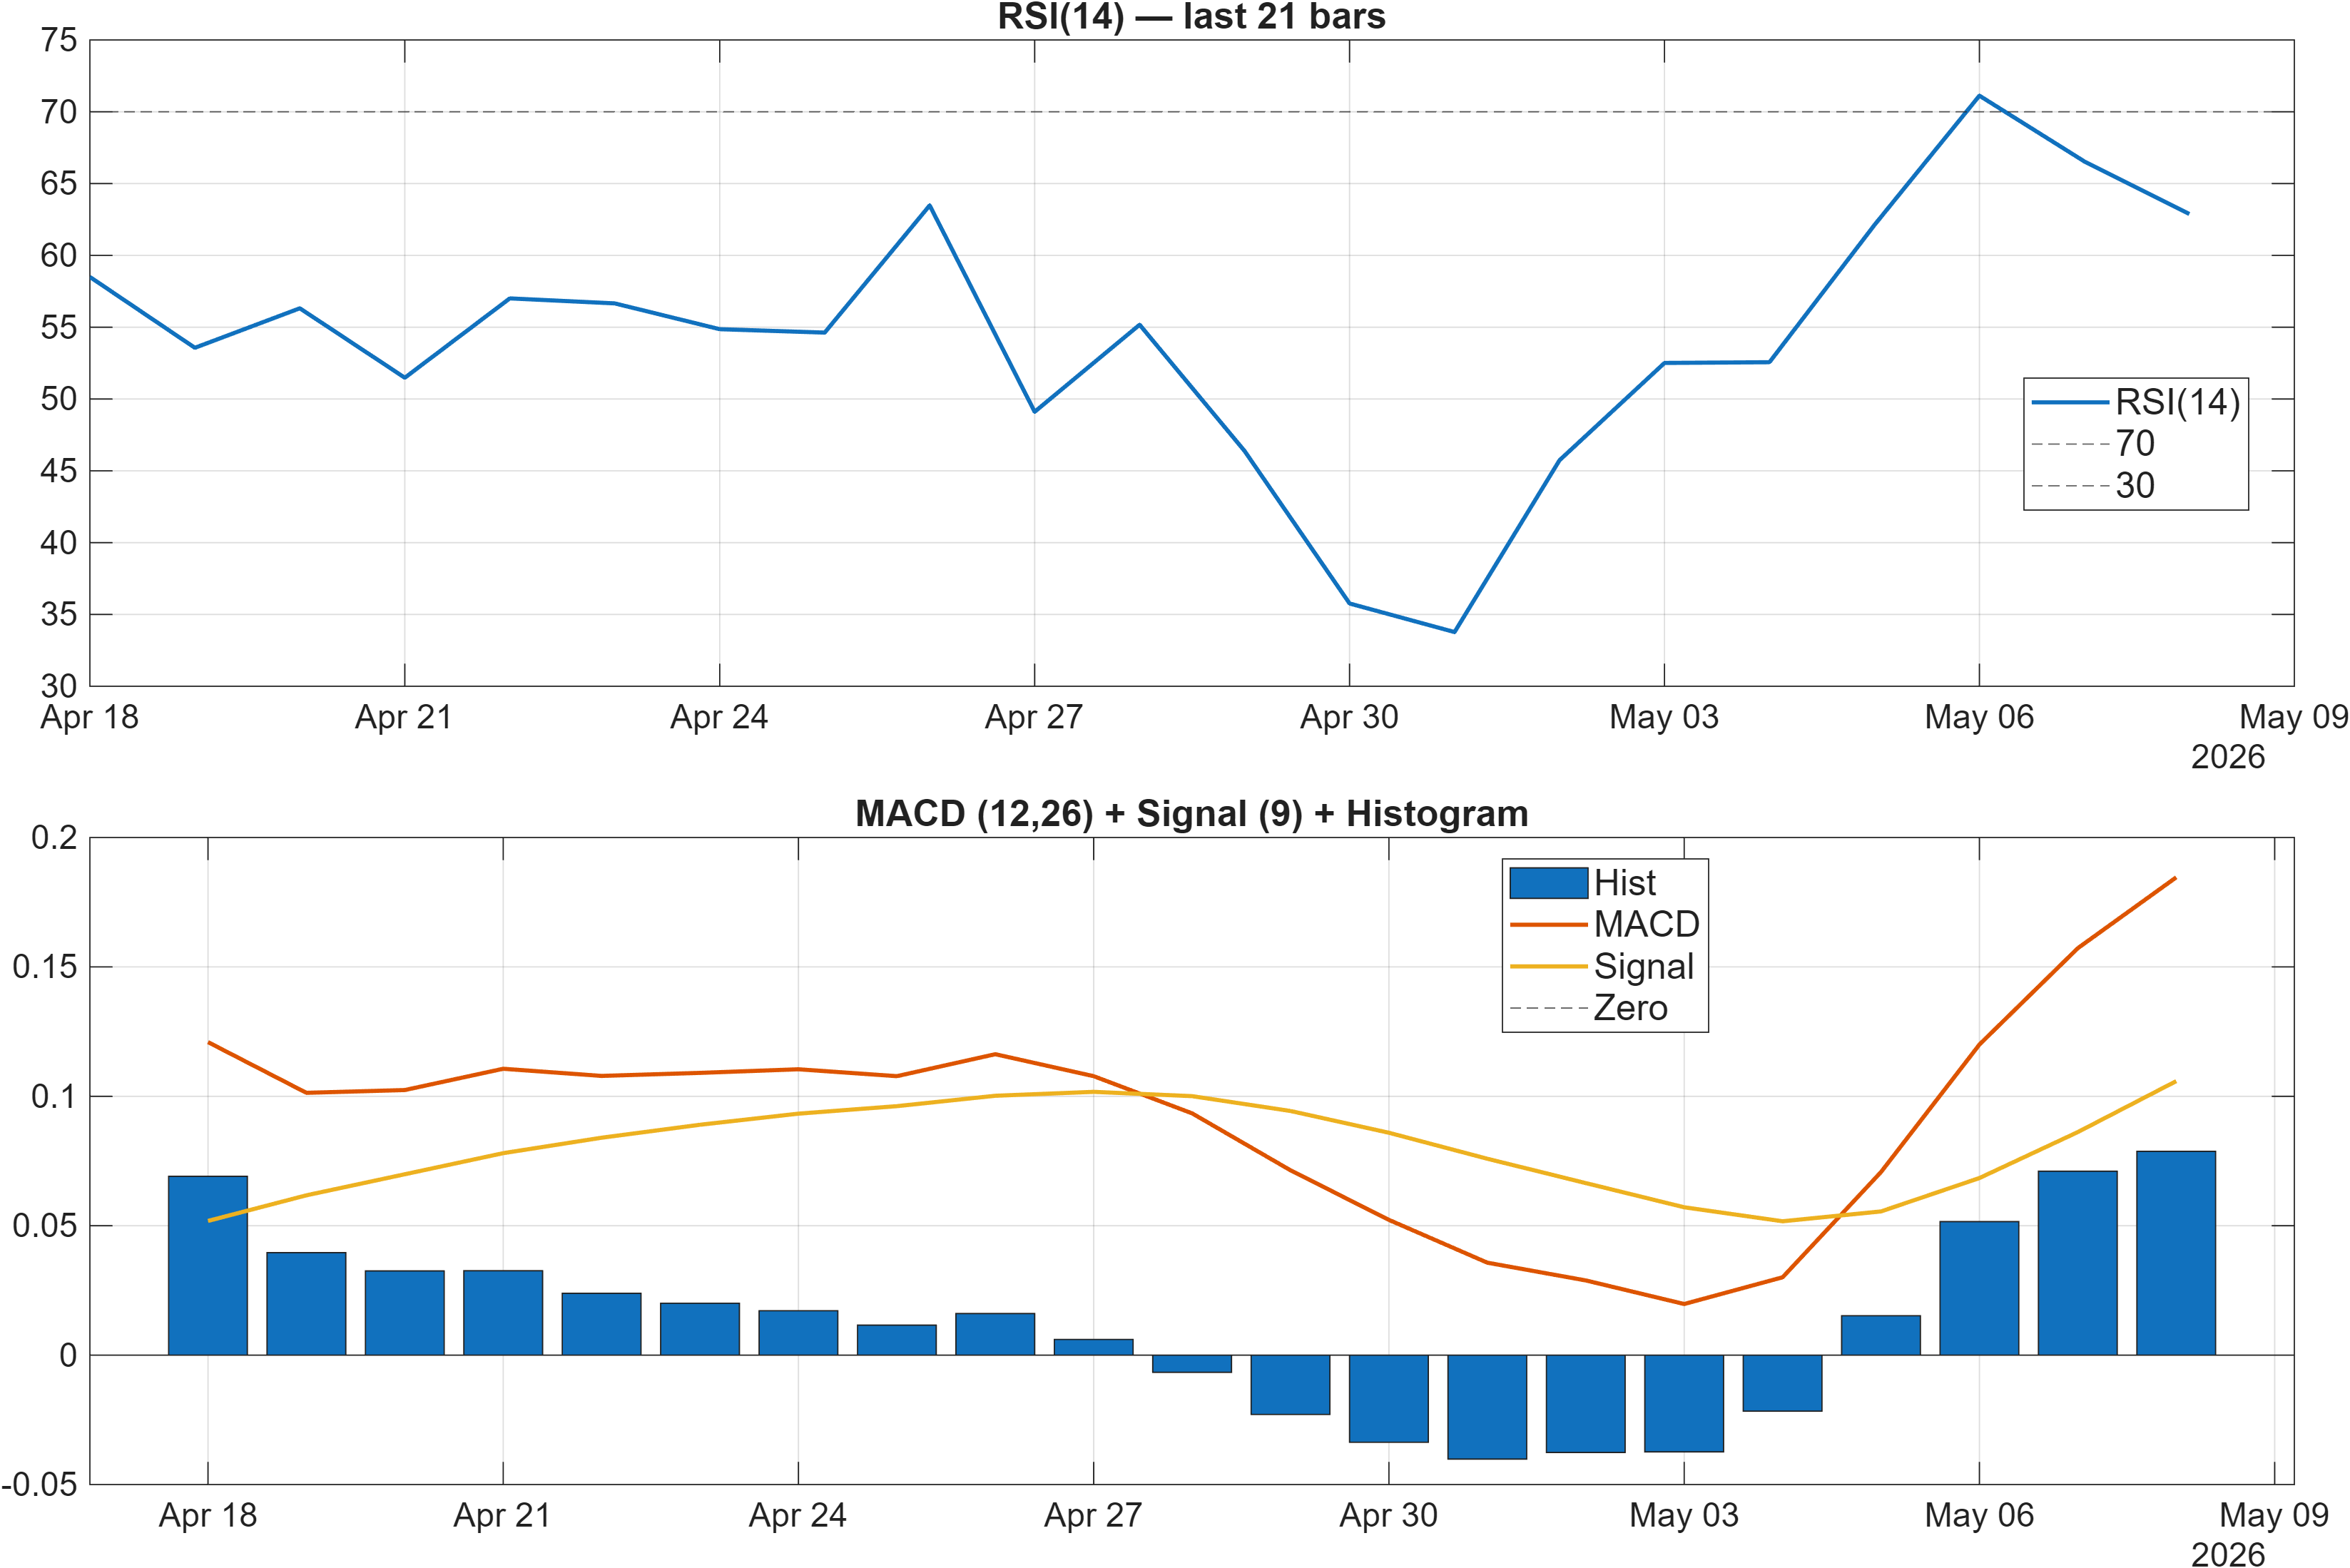
Momentum signals are broadly constructive, but the details suggest momentum without clear overheating. RSI(14) at 62.88 indicates bullish bias while remaining below the levels that often coincide with late-stage thrust conditions. This is reinforced by a positive MACD histogram (0.0787), which typically signals that upside momentum remains active rather than fading into a bearish divergence.
The main counterweight within the momentum cluster is Stoch %K at 81.7, flagged as bearish in the signal table, which can reflect short-term overbought pressure even when the broader trend is intact. This blend—RSI constructive, MACD supportive, stoch stretched—often corresponds to a regime where pullbacks are more likely to be structural tests than outright trend breaks, particularly when the moving-average alignment is already bullish.
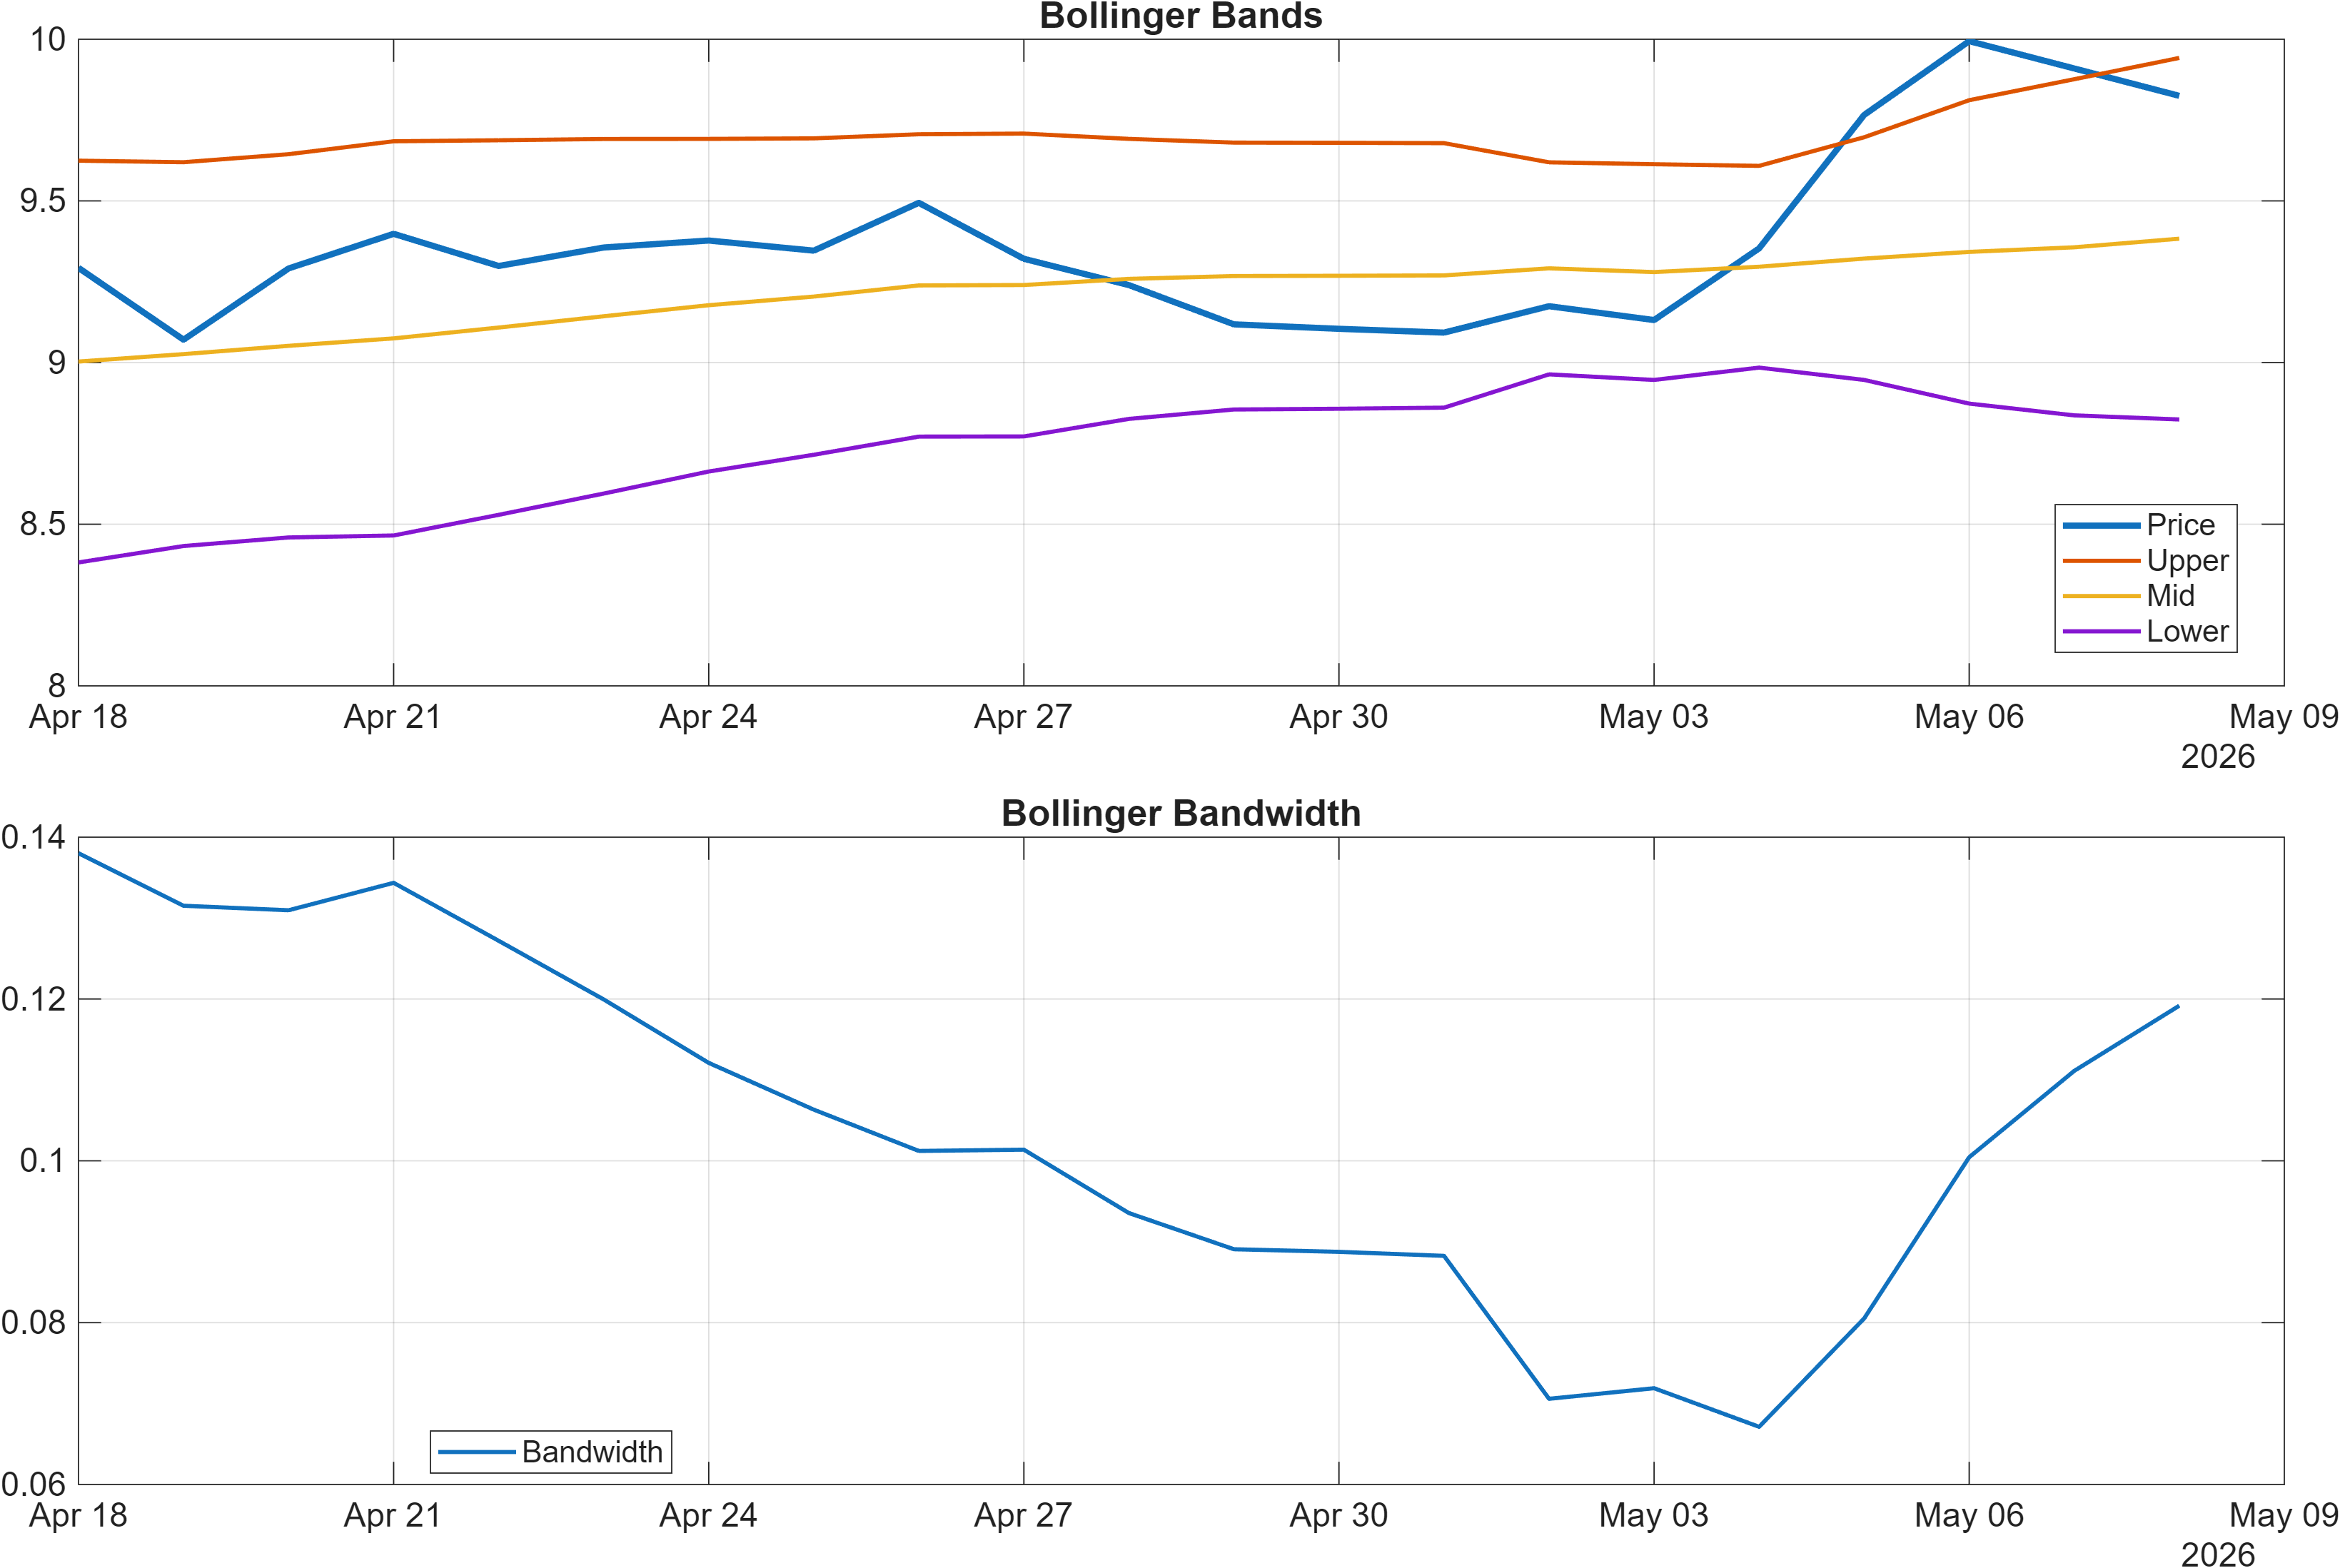
Volatility sits in a comparatively measured state, with Bollinger bandwidth at 0.1192. That level points to moderate expansion rather than a high-stress volatility spike. For traders and allocators, the interaction between moderate bandwidth and nearby resistance at 9.8871 is important: breakouts are generally more robust when volatility expands alongside them, whereas breakout attempts during muted expansion can be more prone to false starts.
Combined with strong cross-sectional ranks (notably weekly #14), the momentum/volatility dashboard argues for a bullish bias that still benefits from confirmation via volatility and volume behavior rather than relying solely on oscillator strength.
Interpretation: RSI bias = Bullish, MACD hist = 0.0787.
Interpretation: Bandwidth (volatility regime) latest = 0.1192.
4) Support / Resistance zones
Support ~ 8.5035 | Resistance ~ 9.8871
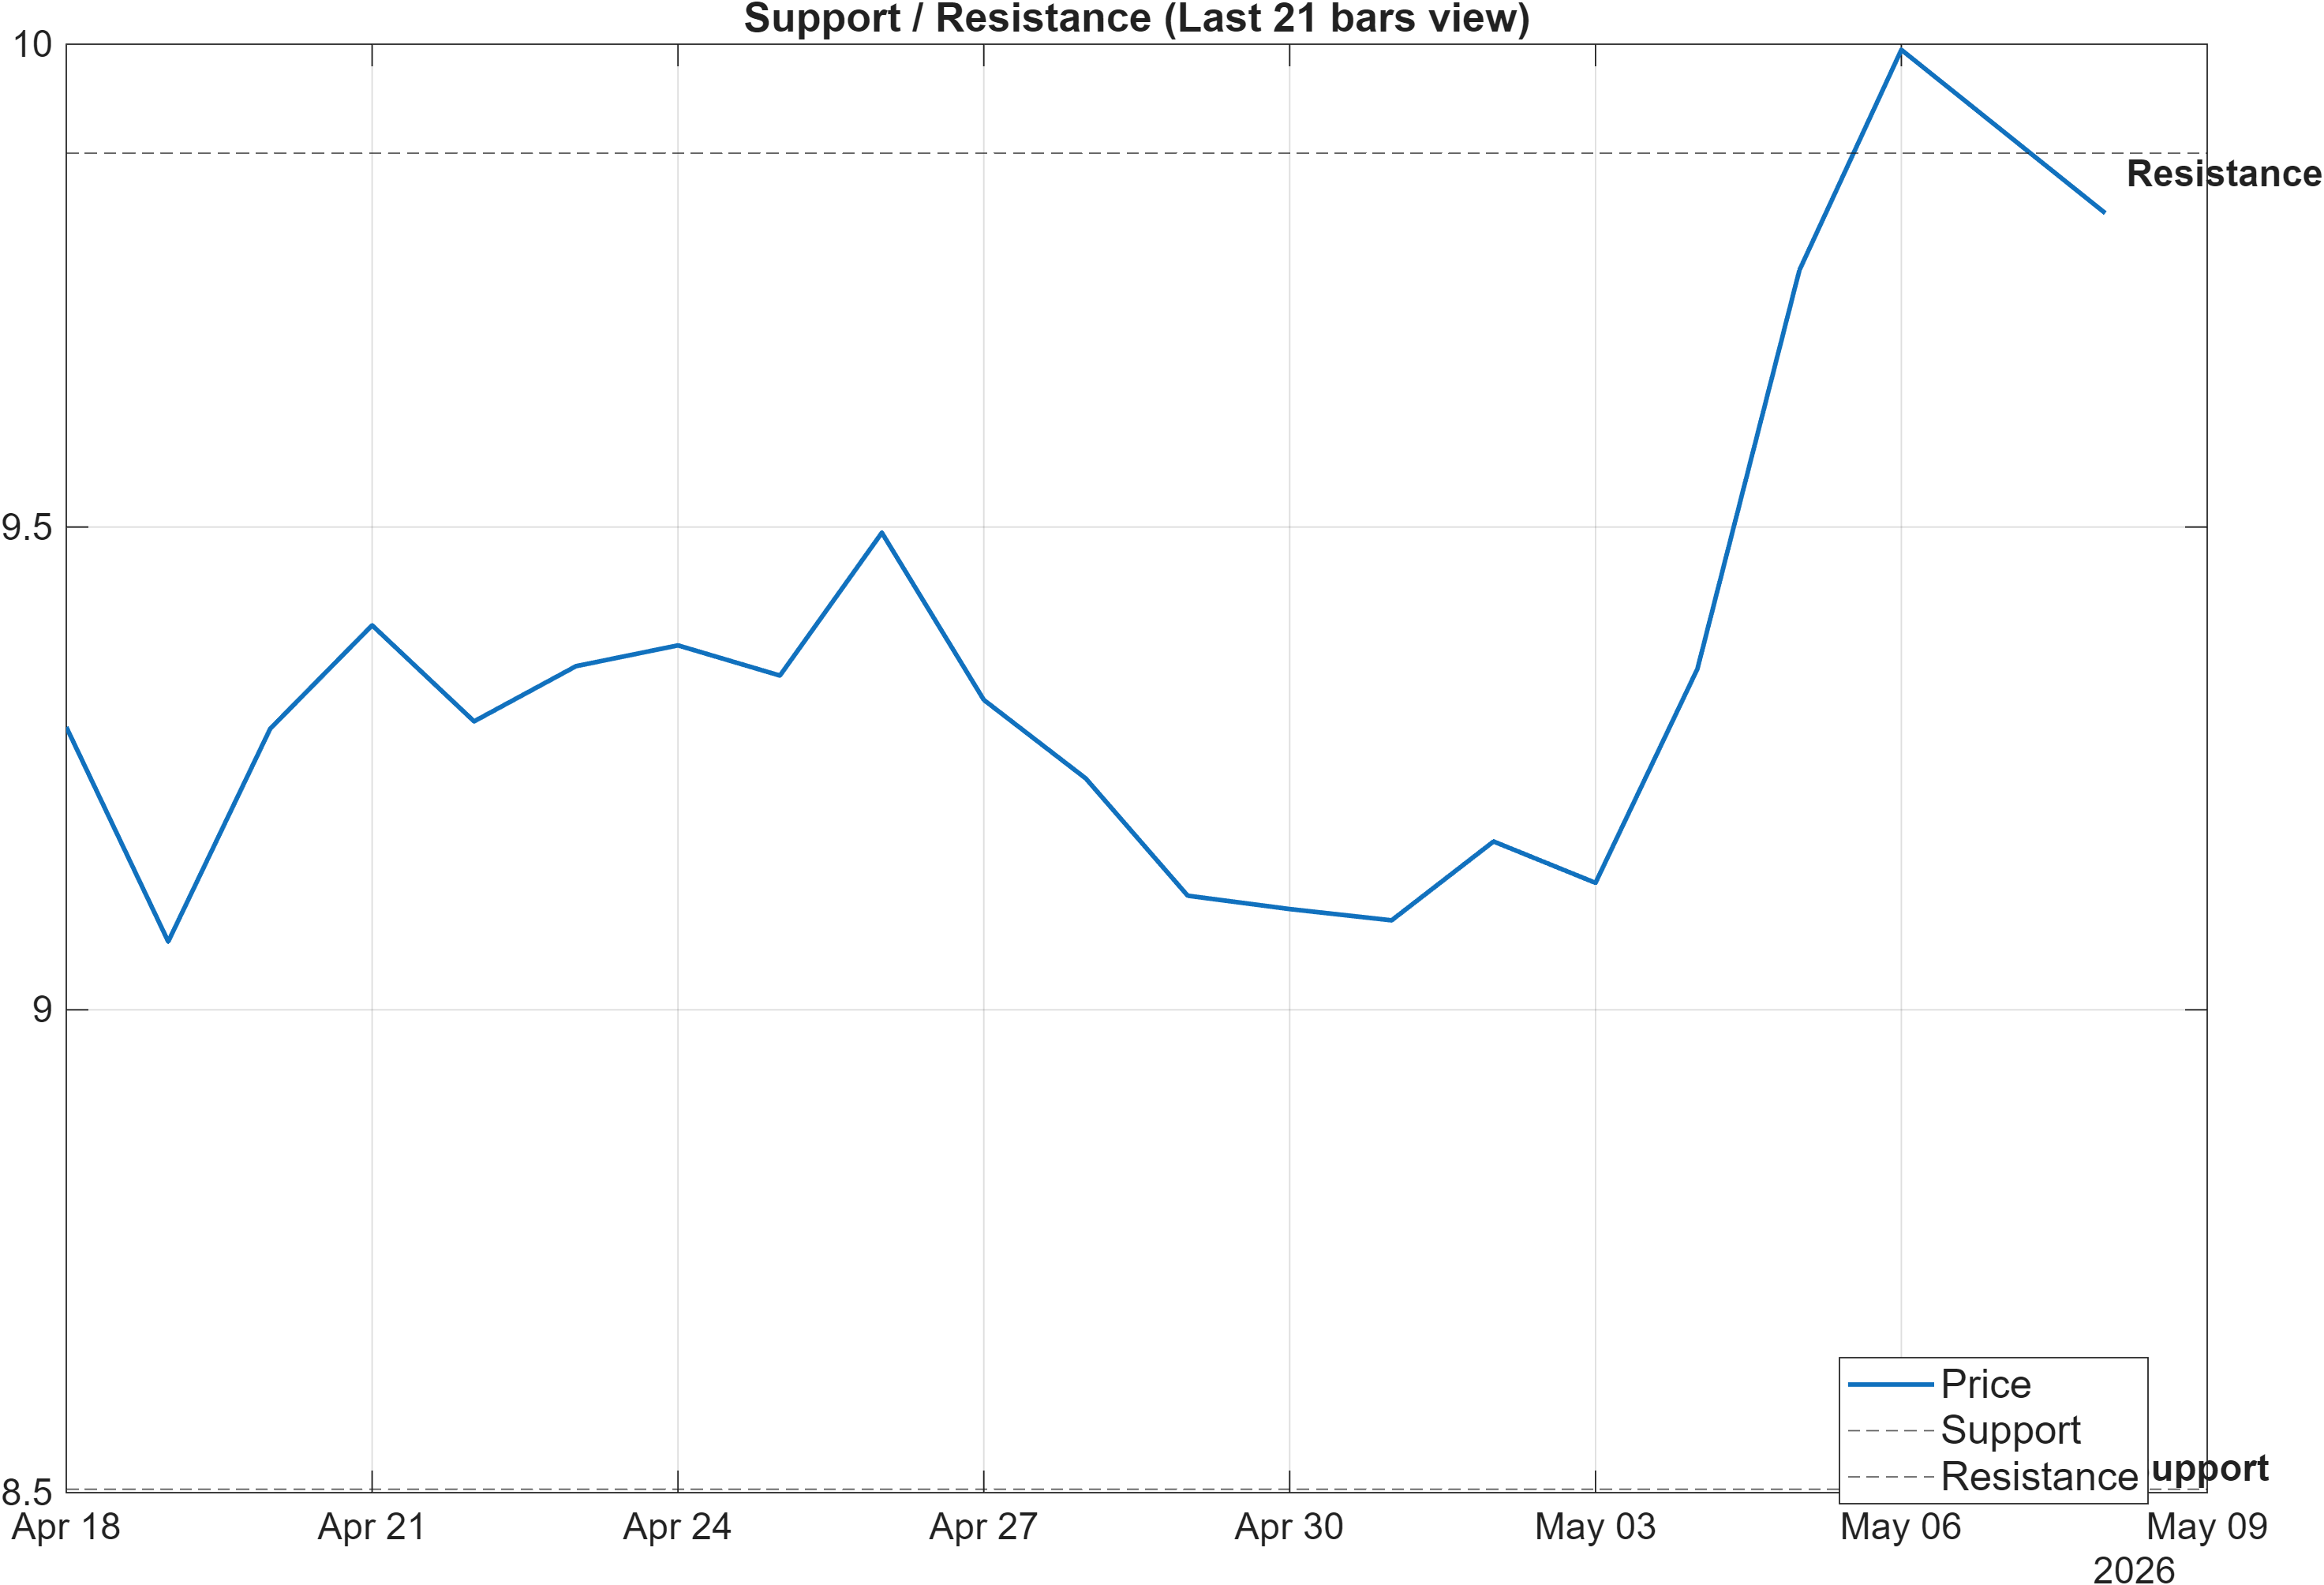
The current market structure is framed by a relatively tight decision corridor between support at 8.5035 and resistance at 9.8871. In this configuration, the technical question is less about identifying a distant objective and more about assessing whether price can accept above resistance (continuation regime) or whether it reverts toward support (range/regression risk).
This is where the broader signal stack becomes relevant. With RSI(14) at 62.88 and MACD histogram at 0.0787, momentum is presently consistent with the idea of resistance pressure being tested. However, Stoch %K at 81.7 being bearish adds a near-term caveat: the market may need either consolidation or a controlled pullback before it can attempt a higher-quality break. The presence of Bollinger bandwidth at 0.1192 also implies that volatility is not yet in a pronounced expansion state, so a resistance breach without accompanying activity could be less stable.
From a risk-control standpoint, support at 8.5035 is the more informative invalidation boundary for the current bullish stack. A close below that area would not automatically negate the strong cross-sectional ranks (weekly #14, 3‑monthly #23), but it would materially increase the odds that the market is shifting from trend continuation into a drawdown or consolidation regime—particularly if accompanied by weakening participation indicators.
Scenario view: Break above resistance with volume → continuation. Close below support → signal deterioration risk.
5) Quant Technical Dashboard (18 Signals)
KGNAI AI Technical Analysis Score (Deep Reinforcement Learning): Rank #373 out of 800 (Rank 1 represents the strongest technical positioning and a higher probability of favorable price behavior. As ranks increase toward the maximum, the probability of favorable outcomes weakens and bearish positioning becomes more dominant.) | Label: Neutral | Score: 0.068
18-Signal Technical Confluence Score: 0.722 (Bullish)
Overall Technical Score (18-signal confluence + DRL rank blend): 0.526 (Bullish)
Note: The blended score reflects signal strength weighted against broader AI technical ranking, which may temporarily diverge.
Blended technical score breakdown: 0.526 (Bullish | Bull 15 / Bear 2 / Neutral 1)
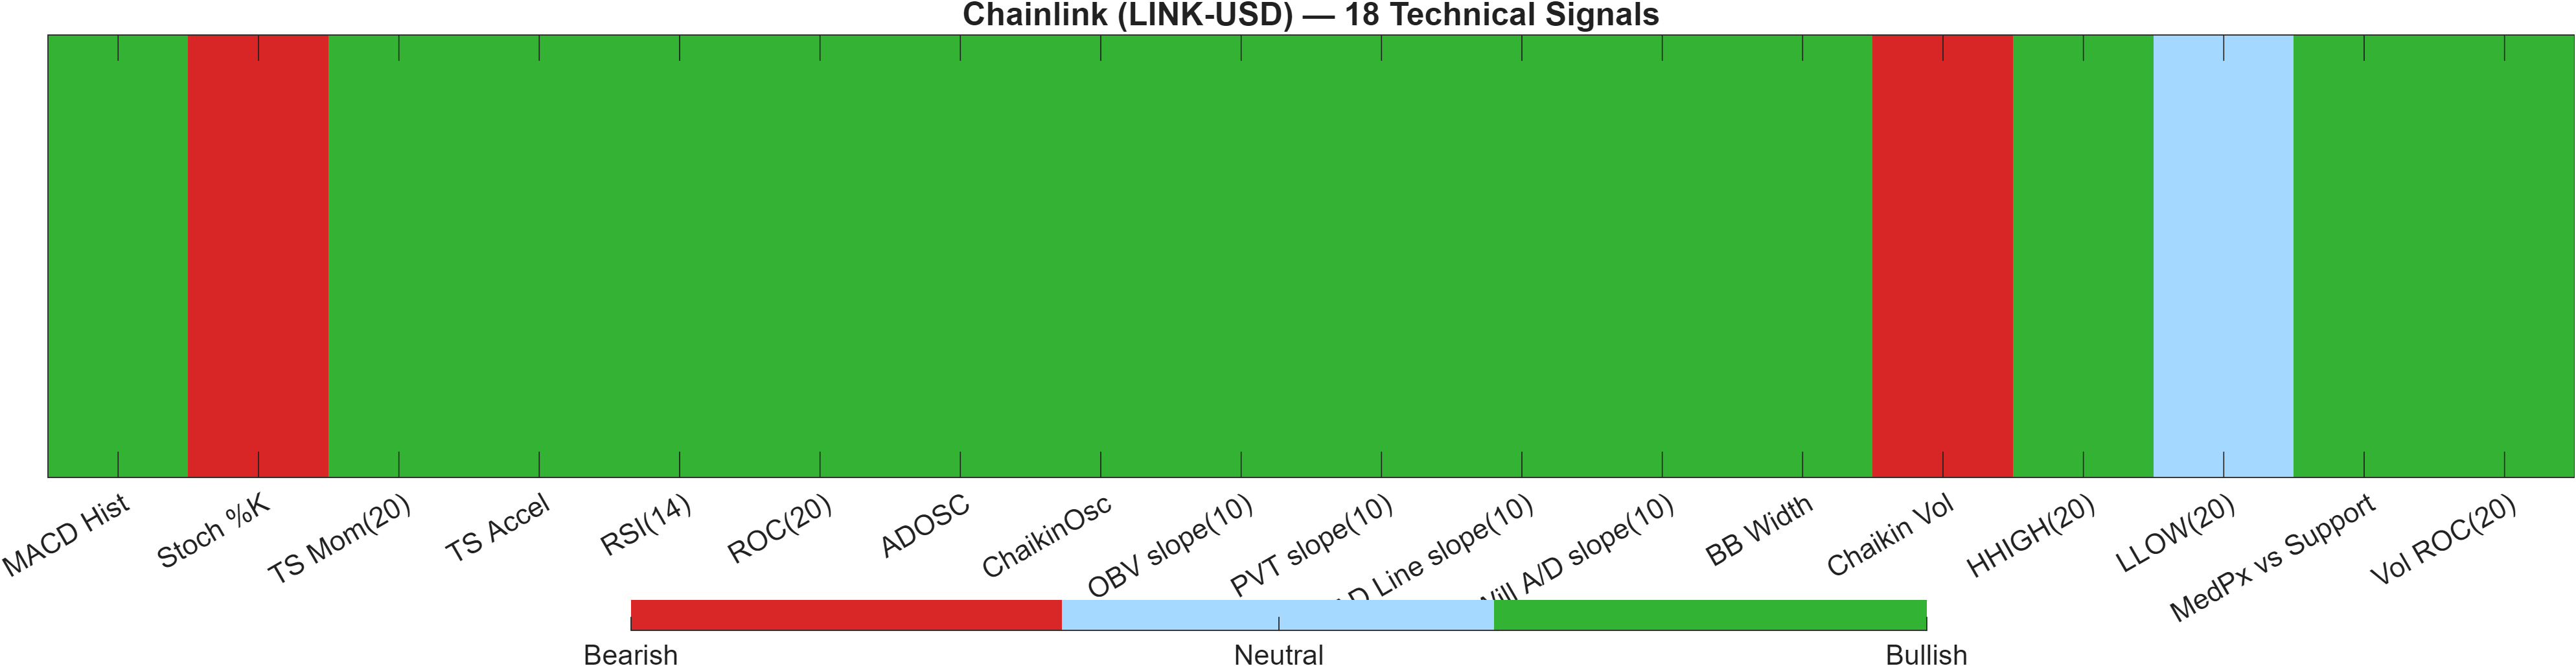
The technical stack shows a high confluence signal set (18-signal score 0.722, Bullish) alongside a more tempered AI technical rank (DRL rank #373/800, Neutral). This divergence is analytically useful: it suggests that the local indicator environment is supportive, but LINK-USD is not among the strongest technical profiles when benchmarked against the full universe under the DRL framework.
Internally, the heatmap balance (Bull 15 / Bear 2 / Neutral 1) indicates breadth across momentum and participation measures rather than reliance on a single indicator. For example, RSI(14) at 62.88 and MACD histogram at 0.07875 support a pro-trend bias, while accumulation-style measures are also constructive (e.g., ADOSC at 74.6). The bearish signals—such as Stoch %K at 81.7 and Chaikin Vol at 26.46—read more like short-term stretch / turnover warnings than a broad breakdown in trend integrity.
The blended score of 0.526 (Bullish) effectively discounts the strong confluence by the neutral DRL rank. In regime terms, that blend often corresponds to “positive but conditional” technical environments: constructive enough to maintain bullish bias, yet sensitive to confirmation around key structure (notably resistance at 9.8871) and any deterioration below 8.5035. This makes the levels section particularly actionable as a framework for whether the confluence persists or mean-reverts.
Signal table (Bull/Bear/Neutral)
| Indicator | Value | Signal |
|---|---|---|
| MACD Hist | 0.07875 | Bullish |
| Stoch %K | 81.7 | Bearish |
| TS Mom(20) | 0.9235 | Bullish |
| TS Accel | 0.6304 | Bullish |
| RSI(14) | 62.88 | Bullish |
| ROC(20) | 8.316 | Bullish |
| ADOSC | 74.6 | Bullish |
| ChaikinOsc | 1.042e+08 | Bullish |
| OBV slope(10) | 1.562e+09 | Bullish |
| PVT slope(10) | 6.921e+07 | Bullish |
| AD Line slope(10) | 6.658e+07 | Bullish |
| Will A/D slope(10) | 0.381 | Bullish |
| BB Width | 0.1192 | Bullish |
| Chaikin Vol | 26.46 | Bearish |
| HHIGH(20) | 10.23 | Bullish |
| LLOW(20) | 8.942 | Neutral |
| MedPx vs Support | 1.494 | Bullish |
| Vol ROC(20) | 38.53 | Bullish |
Interpretation: Indicator-level signals form the base confluence, which is then adjusted using a separate AI-driven technical ranking model. The final technical score summarizes this combined view.
6) News sentiment + extractive gist
Sentiment score (avg): 0.000 | Positive: 0% | Neutral: 100% | Negative: 0%
KGNAI AI News Sentiment Score (normalized -1 to +1): 0.00 (as of 2025-12-30) | Label: Neutral | Overall news score: 0.07
Positive Developments
Recent coverage across major financial outlets indicates constructive attention around ecosystem usage and integration themes connected to Chainlink. The tone is generally oriented toward infrastructure relevance—how oracle connectivity is being used within broader crypto plumbing—rather than near-term price speculation. While the provided sentiment distribution is mechanically neutral (avg 0.000, with 100% of items classified as neutral), the narrative mix still contains elements that market participants often interpret as constructive: adoption anecdotes, ecosystem mentions, and forward-looking positioning discussions that can support confidence during technical uptrends. This matters most when paired with the technical backdrop: with RSI(14) at 62.88 and a positive MACD histogram (0.0787), even “neutral-scored” coverage can function as a low-friction backdrop, reducing the probability that headlines alone disrupt an otherwise orderly tape.
Neutral / Mixed Developments
The dominant characteristic of the news set is absence of directional sentiment. KGNAI’s scoring shows a neutral label (0.00) and an overall news score of 0.07, which is consistent with informational, commentary-driven items rather than event shocks. In this environment, price action is more likely to be governed by technical structure and positioning. For LINK-USD, that places greater weight on the nearby technical reference points—resistance at 9.8871 and support at 8.5035—and on whether volatility expands beyond the current Bollinger bandwidth of 0.1192. Neutral news conditions can be beneficial for signal clarity: fewer headline-driven gaps typically make indicator follow-through (and failure) easier to interpret.
Negative / Risk Signals
With 0% negative sentiment in the provided distribution, risk signals are not coming from the news feed itself; they arise from how market structure could respond if conditions change. First, a neutral media backdrop can quickly become adverse if a single issue concentrates attention—making the current lack of negative sentiment more a snapshot than a guarantee. Second, the technical dashboard contains minor caution flags that can amplify downside sensitivity if sentiment turns: Stoch %K at 81.7 is already bearish (stretch risk), and the DRL technical rank is #373/800 (Neutral), implying the broader AI technical context is not exceptionally strong. If price were to lose 8.5035, the transition from “quiet neutral news” to “risk narrative” tends to happen faster in crypto, where volatility regimes can shift abruptly even from a bandwidth reading near 0.1192.
- Whether price can sustain acceptance above 9.8871 alongside rising participation.
- Any shift in sentiment distribution away from 100% neutral readings.
- Volatility expansion from Bollinger bandwidth 0.1192 during breakout or breakdown attempts.
Sources referenced: Reuters, Bloomberg, Yahoo Finance, MarketWatch, Investing.com
Snapshot: AI Rank (Short–Mid–Long): Bullish (Bullish–Bullish–Bullish) · Technical Confluence: Bullish · Key Levels: Support ~8.50 | Resistance ~9.89 · News Sentiment: Neutral
7) Sources
- Solv Protocol Will Dump LayerZero, Migrate $700M Tokenized Bitcoin Tech to Chainlink — https://decrypt.co/367154/solv-protocol-dump-layerzero-migrate-700m-tokenized-bitcoin-chainlink
- Where Will Chainlink (LINK) Be When the Next Bull Run Hits? - The Motley Fool — https://news.google.com/rss/articles/CBMikwFBVV95cUxOZWZ5bWdXZmtNSjJYYUxUTlgwcW01Z29uNU1rVkMzRUE5dTVGQ2RHSWg5dVhKaDFmcjBGMDQwVFVNUVRkZUlXNWZUWWNMSUpEVlM0eURETUs2Mjdzd3ZwcHBBT09uWUdXaFJHVW1zREZaQVhHZVNfT2VaSy1hU0tveUhEMUFyTmtRLVJpaWRpbmJPTlE?oc=5
- Solv Protocol Will Dump LayerZero, Migrate $700M Tokenized Bitcoin Tech to Chainlink - Decrypt — https://news.google.com/rss/articles/CBMimwFBVV95cUxPTHhwYmtrMXVOSHpwUXBpREF2SWNMNlFGcXczUkZxUDBncHFwb3RkUV9tRkFPS2wwYVVONEtzaXphc01ib1VKUWRSQzhHUUNpaEFzeGlBUjV6Y1Z3UVlHbDVQdVZRQUZSMmtLQ1BVTkxUY0EtRE1iTklOQWRJejM1Tk9lOGlHaTkzeHpEaWw4aHh5ekZFUnY1M0tVSQ?oc=5
You may also like: How KGNAI AI ranks instruments across global markets
Disclaimer: KGNAI provides AI-generated analytics and educational market commentary only. This is not financial advice. Markets involve risk. Always do your own research.