
RUNE-USD (THORChain) Technical & Sentiment Note — 10-May-2026 | Bullish ranks with neutral-model friction
THORChain (RUNE-USD) enters this snapshot with consistently strong KGNAI cross-sectional ranks across daily, weekly, monthly, and 3-month horizons, while technical diagnostics show a more nuanced profile: trend structure remains constructive, but momentum is elevated and volatility conditions are not uniformly supportive. On the signal layer, the 18-indicator confluence is Bullish at 0.556, and the blended technical score is also Bullish at 0.450. However, the separate deep reinforcement learning technical rank sits at #318 with a Neutral label, introducing measurable model divergence. Key levels frame the decision zone: support ~0.3864 and resistance ~0.5518. News sentiment remains broadly Neutral, with an average sentiment score of -0.071 and a normalized KGNAI sentiment score of 0.07, implying limited directional edge from the headline flow in this cut.
- Rank stance: Short / Mid / Long-term ranks remain Bullish (daily #25, weekly #44, monthly #31, 3-month #22 out of 800).
- Technical confluence: Overall Bullish (18-signal confluence 0.556; blended technical score 0.450) with Neutral DRL technical rank #318 as a key divergence.
- Key levels: Support ~0.3864 and Resistance ~0.5518 define the near-term regime boundary.
- News sentiment bias: Neutral (avg -0.071; normalized 0.07; 81% neutral share).
- Confirmation / invalidation: A break above 0.5518 with volume supports continuation; a close below 0.3864 increases deterioration risk.
KGNAI evaluates assets using large cross-sectional datasets built from millions of structured data points. Inputs incorporate fundamental metrics, technical structures, and systematically processed news sentiment. Statistical models, machine learning, and AI frameworks are used to assess relative positioning, signal alignment, and probabilistic behavior across broad universes.
- Ranks are comparative across the tracked universe, not absolute price targets.
- Confluence reflects alignment among independent signal groups.
- Support/resistance levels are probabilistic decision zones, not guarantees.
- Sentiment provides contextual bias within the broader analytical framework.
1) KGNAI AI Analysis
Region: CRYPTO
Total universe size: 800 ranked instruments
- Daily rank: #25 out of 800 — Bullish
- Weekly rank: #44 out of 800 — Bullish
- Monthly rank: #31 out of 800 — Bullish
- 3-Monthly rank: #22 out of 800 — Bullish
RUNE-USD screens in the upper decile of the 800-instrument universe across multiple horizons, with the daily rank at #25 and 3-month rank at #22 reinforcing persistence rather than a single-timeframe spike. The weekly rank of #44 remains in the same strength neighborhood, suggesting the signal is not confined to microstructure noise. In cross-sectional frameworks, this kind of multi-horizon clustering typically reflects broad agreement across independent tests rather than reliance on one indicator family.
The practical takeaway is less about forecasting and more about regime identification: a consistent “Bullish” term view (short, mid, and long) indicates that—relative to peers—RUNE-USD is currently exhibiting more favorable statistical behavior. That said, cross-sectional ranks can remain strong while price becomes tactically overextended, especially when momentum oscillators and volatility regimes begin to diverge. This is why the ranks here are best treated as a probabilistic filter before using levels and momentum diagnostics to refine timing.
As a positioning lens, the key risk is not that the ranks are weak—they are not—but that internal confirmation must come from price holding key zones and avoiding downside invalidation. In this report, the level-based guardrail is explicitly defined later: 0.3864 as support. If that zone fails on a closing basis, rank strength can lag reality because cross-sectional models often adjust after structural breaks.
KGNAI ranks each instrument across large universes using multiple proprietary AI tests and statistical models (millions of data points). Lower ranks generally indicate stronger probability of favorable performance behavior, while higher ranks indicate weaker probability and more bearish positioning.
Term view: Short-term: Bullish. Mid-term: Bullish. Long-term: Bullish.
Want the full universe and complete rank tables? Unlock full access on KGNAI: https://www.kgnai.com/pricing
2) Price & trend overview
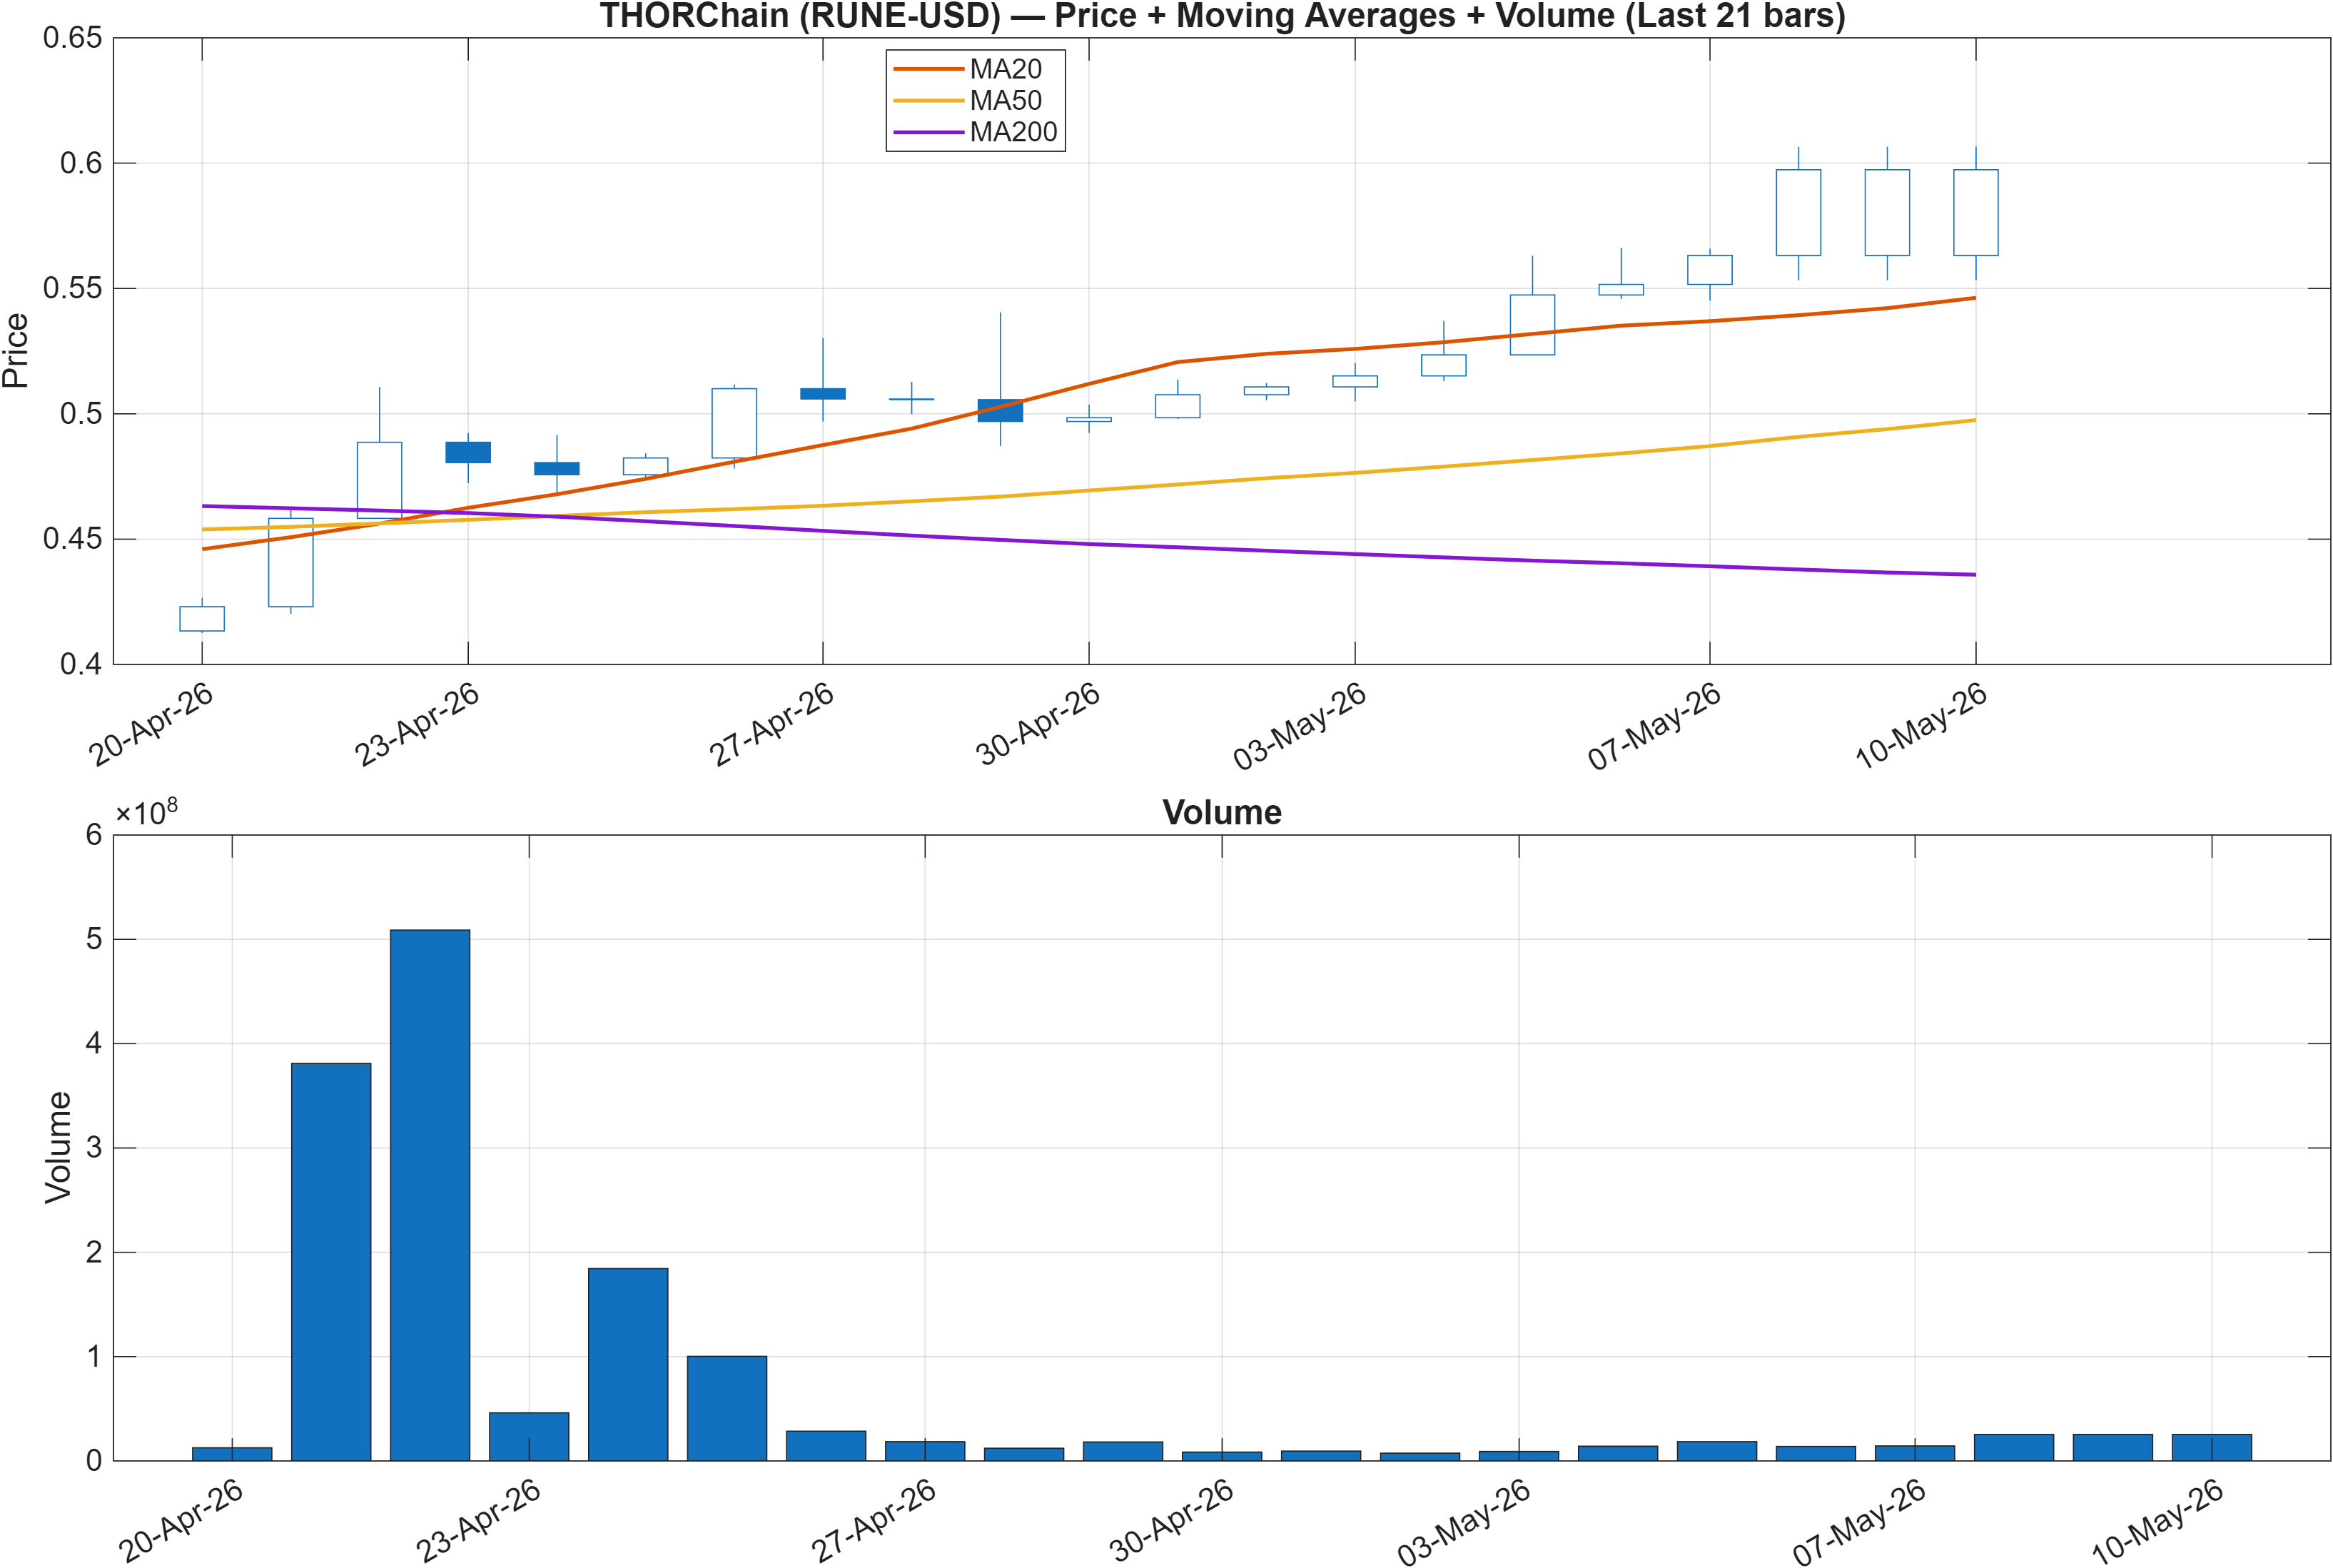
The primary trend read is constructive: close vs MA50 is Bullish and MA50 vs MA200 is Bullish. That combination typically characterizes a market in which intermediate momentum is aligned with longer-term trend direction—an important distinction versus reflex bounces that occur below key moving averages. In other words, the structure presented is more consistent with trend persistence than with a purely mean-reversion setup.
Where the analysis becomes more conditional is the “despite minor pullbacks” framing: pullbacks inside an uptrend can either be healthy rotation (resetting momentum without breaking structure) or early distribution (where trend measures lag while risk builds beneath the surface). For this report, the structural check is straightforward: the market remains in a constructive posture as long as it avoids a decisive breakdown toward the defined support zone at 0.3864.
This is also where cross-sectional strength and chart structure interact. With the daily rank at #25 out of 800, the market is being scored as strong versus peers; that typically has the highest analytical value when it coincides with an unambiguous moving-average stack. The caution is not trend direction, but trend maturity: later-stage trends can remain “Bullish” on MAs while momentum becomes stretched (a theme reinforced by RSI in the next section).
Interpretation: Close vs MA50 = Bullish, MA50 vs MA200 = Bullish.
3) Momentum & volatility dashboard
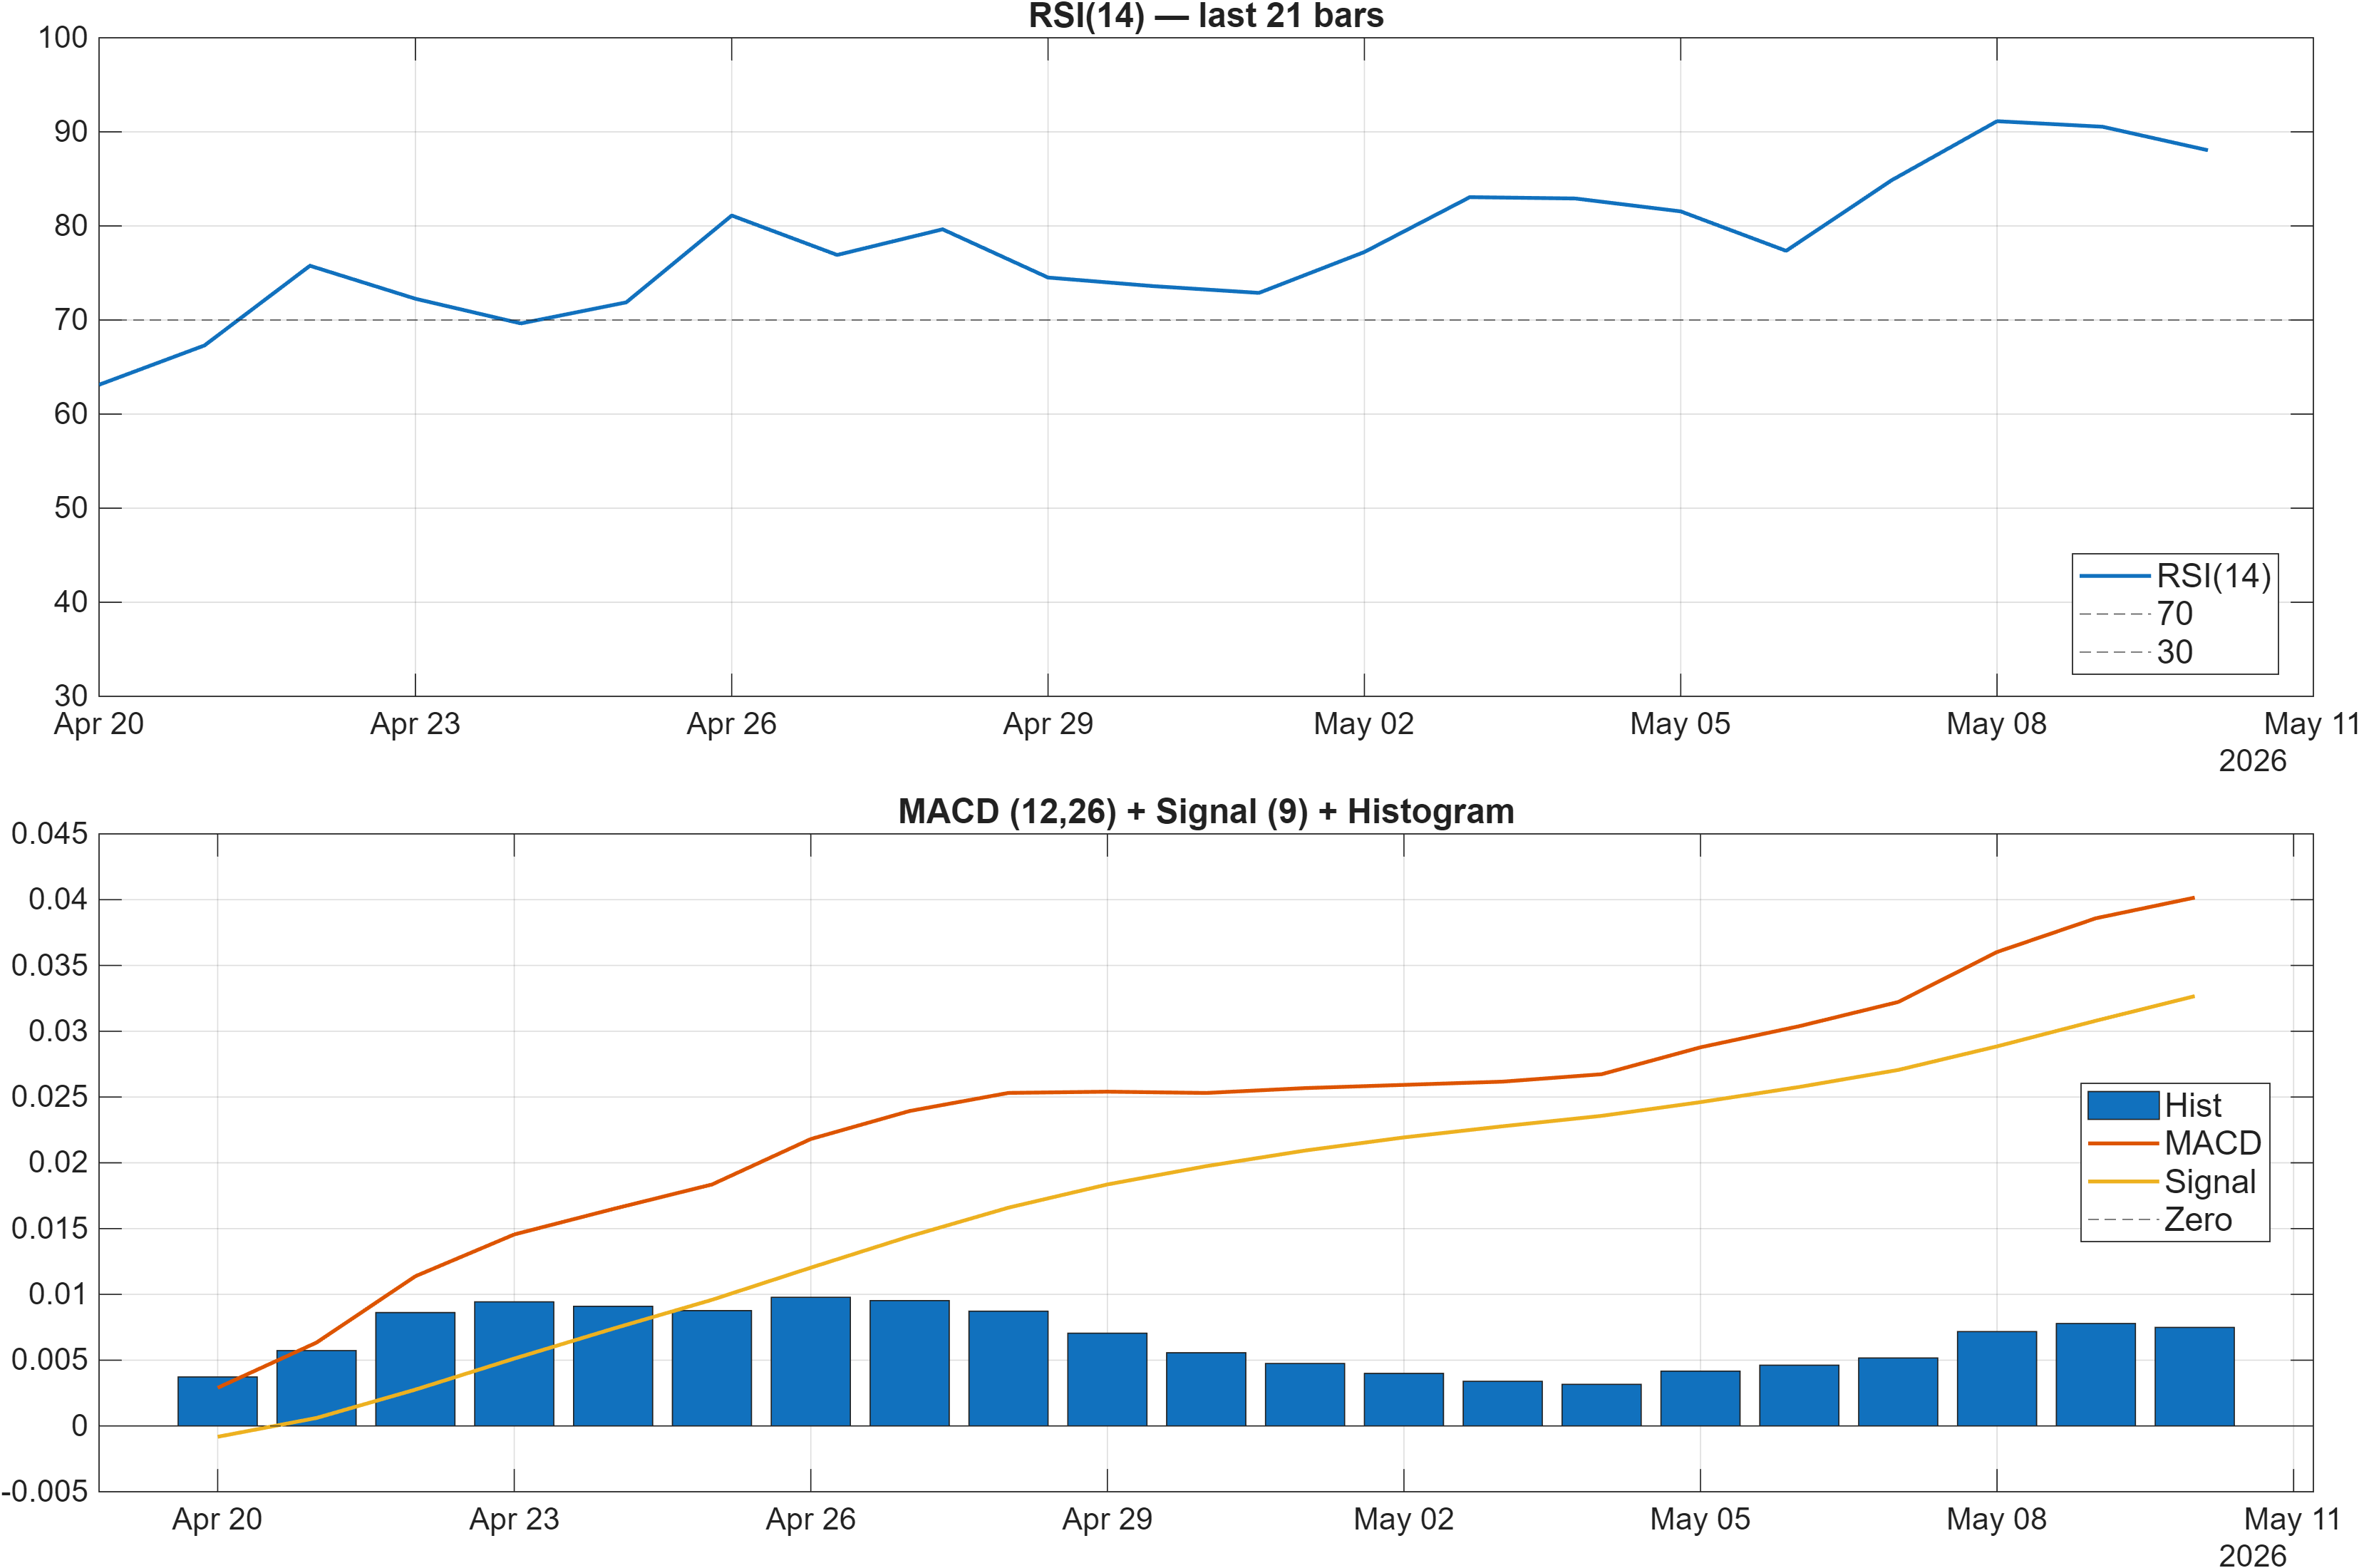
Momentum is positive, but it is also compressed into an overextended zone rather than a neutral “room-to-run” state. The dashboard interpretation flags RSI bias = Bullish, and the signal table prints RSI(14) at 88.04, which is consistent with strong upside pressure but also increases the probability of tactical cooling phases. In parallel, trend-following momentum remains constructive with MACD hist at 0.007488 (and a reported 0.0075 on the interpretation line), indicating positive impulse is still present.
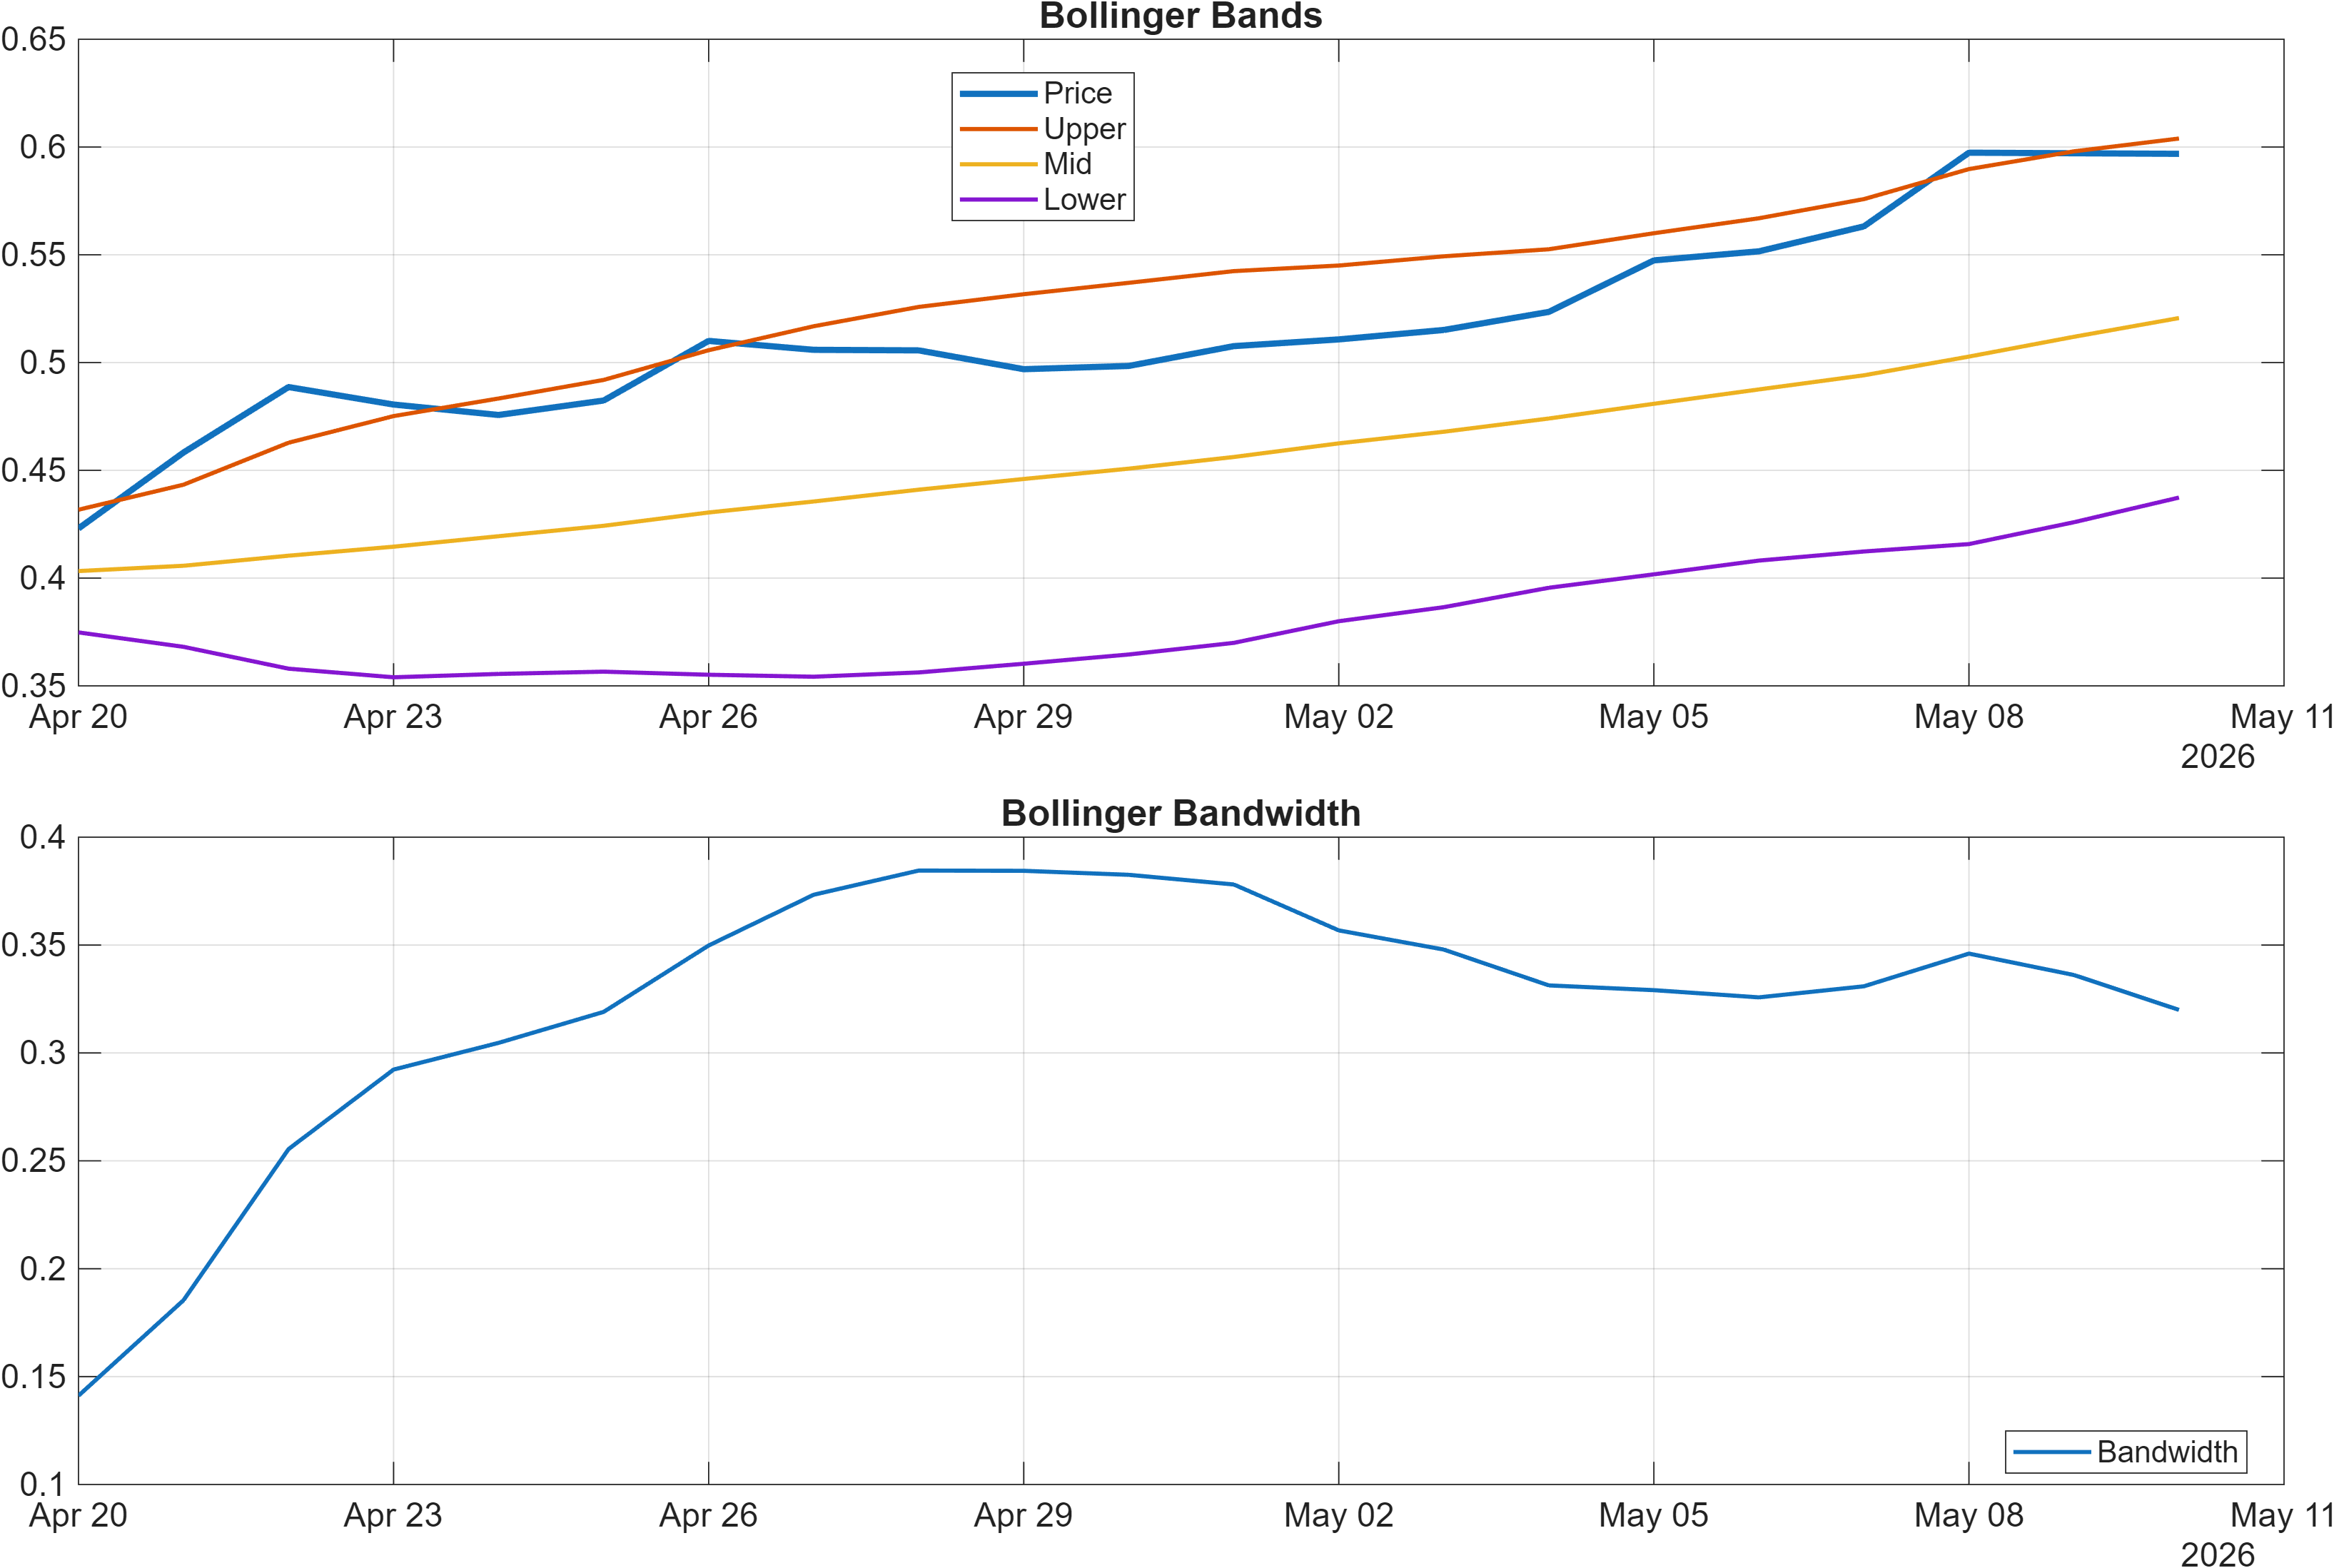
Volatility adds a second layer of context. Bollinger bandwidth’s latest reading is 0.3199, labeled Neutral in the signal table. Neutral bandwidth can mean volatility is neither expanding aggressively (often associated with breakout acceleration) nor contracting tightly (often associated with a pending volatility release). Practically, it argues for focusing on level-based confirmation rather than assuming a volatility tailwind.
The internal momentum mix also shows a potential short-term friction point: Stoch %K at 91.55 is marked Bearish, which can occur when a strong trend becomes crowded. That does not negate the broader Bullish profile, but it raises the importance of how price behaves near 0.5518 (resistance) versus whether it starts failing at progressively higher levels. The cleanest read is: positive momentum persists, yet the probability of near-term digestion is non-trivial given the elevated oscillator posture.
Interpretation: RSI bias = Bullish, MACD hist = 0.0075.
Interpretation: Bandwidth (volatility regime) latest = 0.3199.
4) Support / Resistance zones
Support ~ 0.3864 | Resistance ~ 0.5518
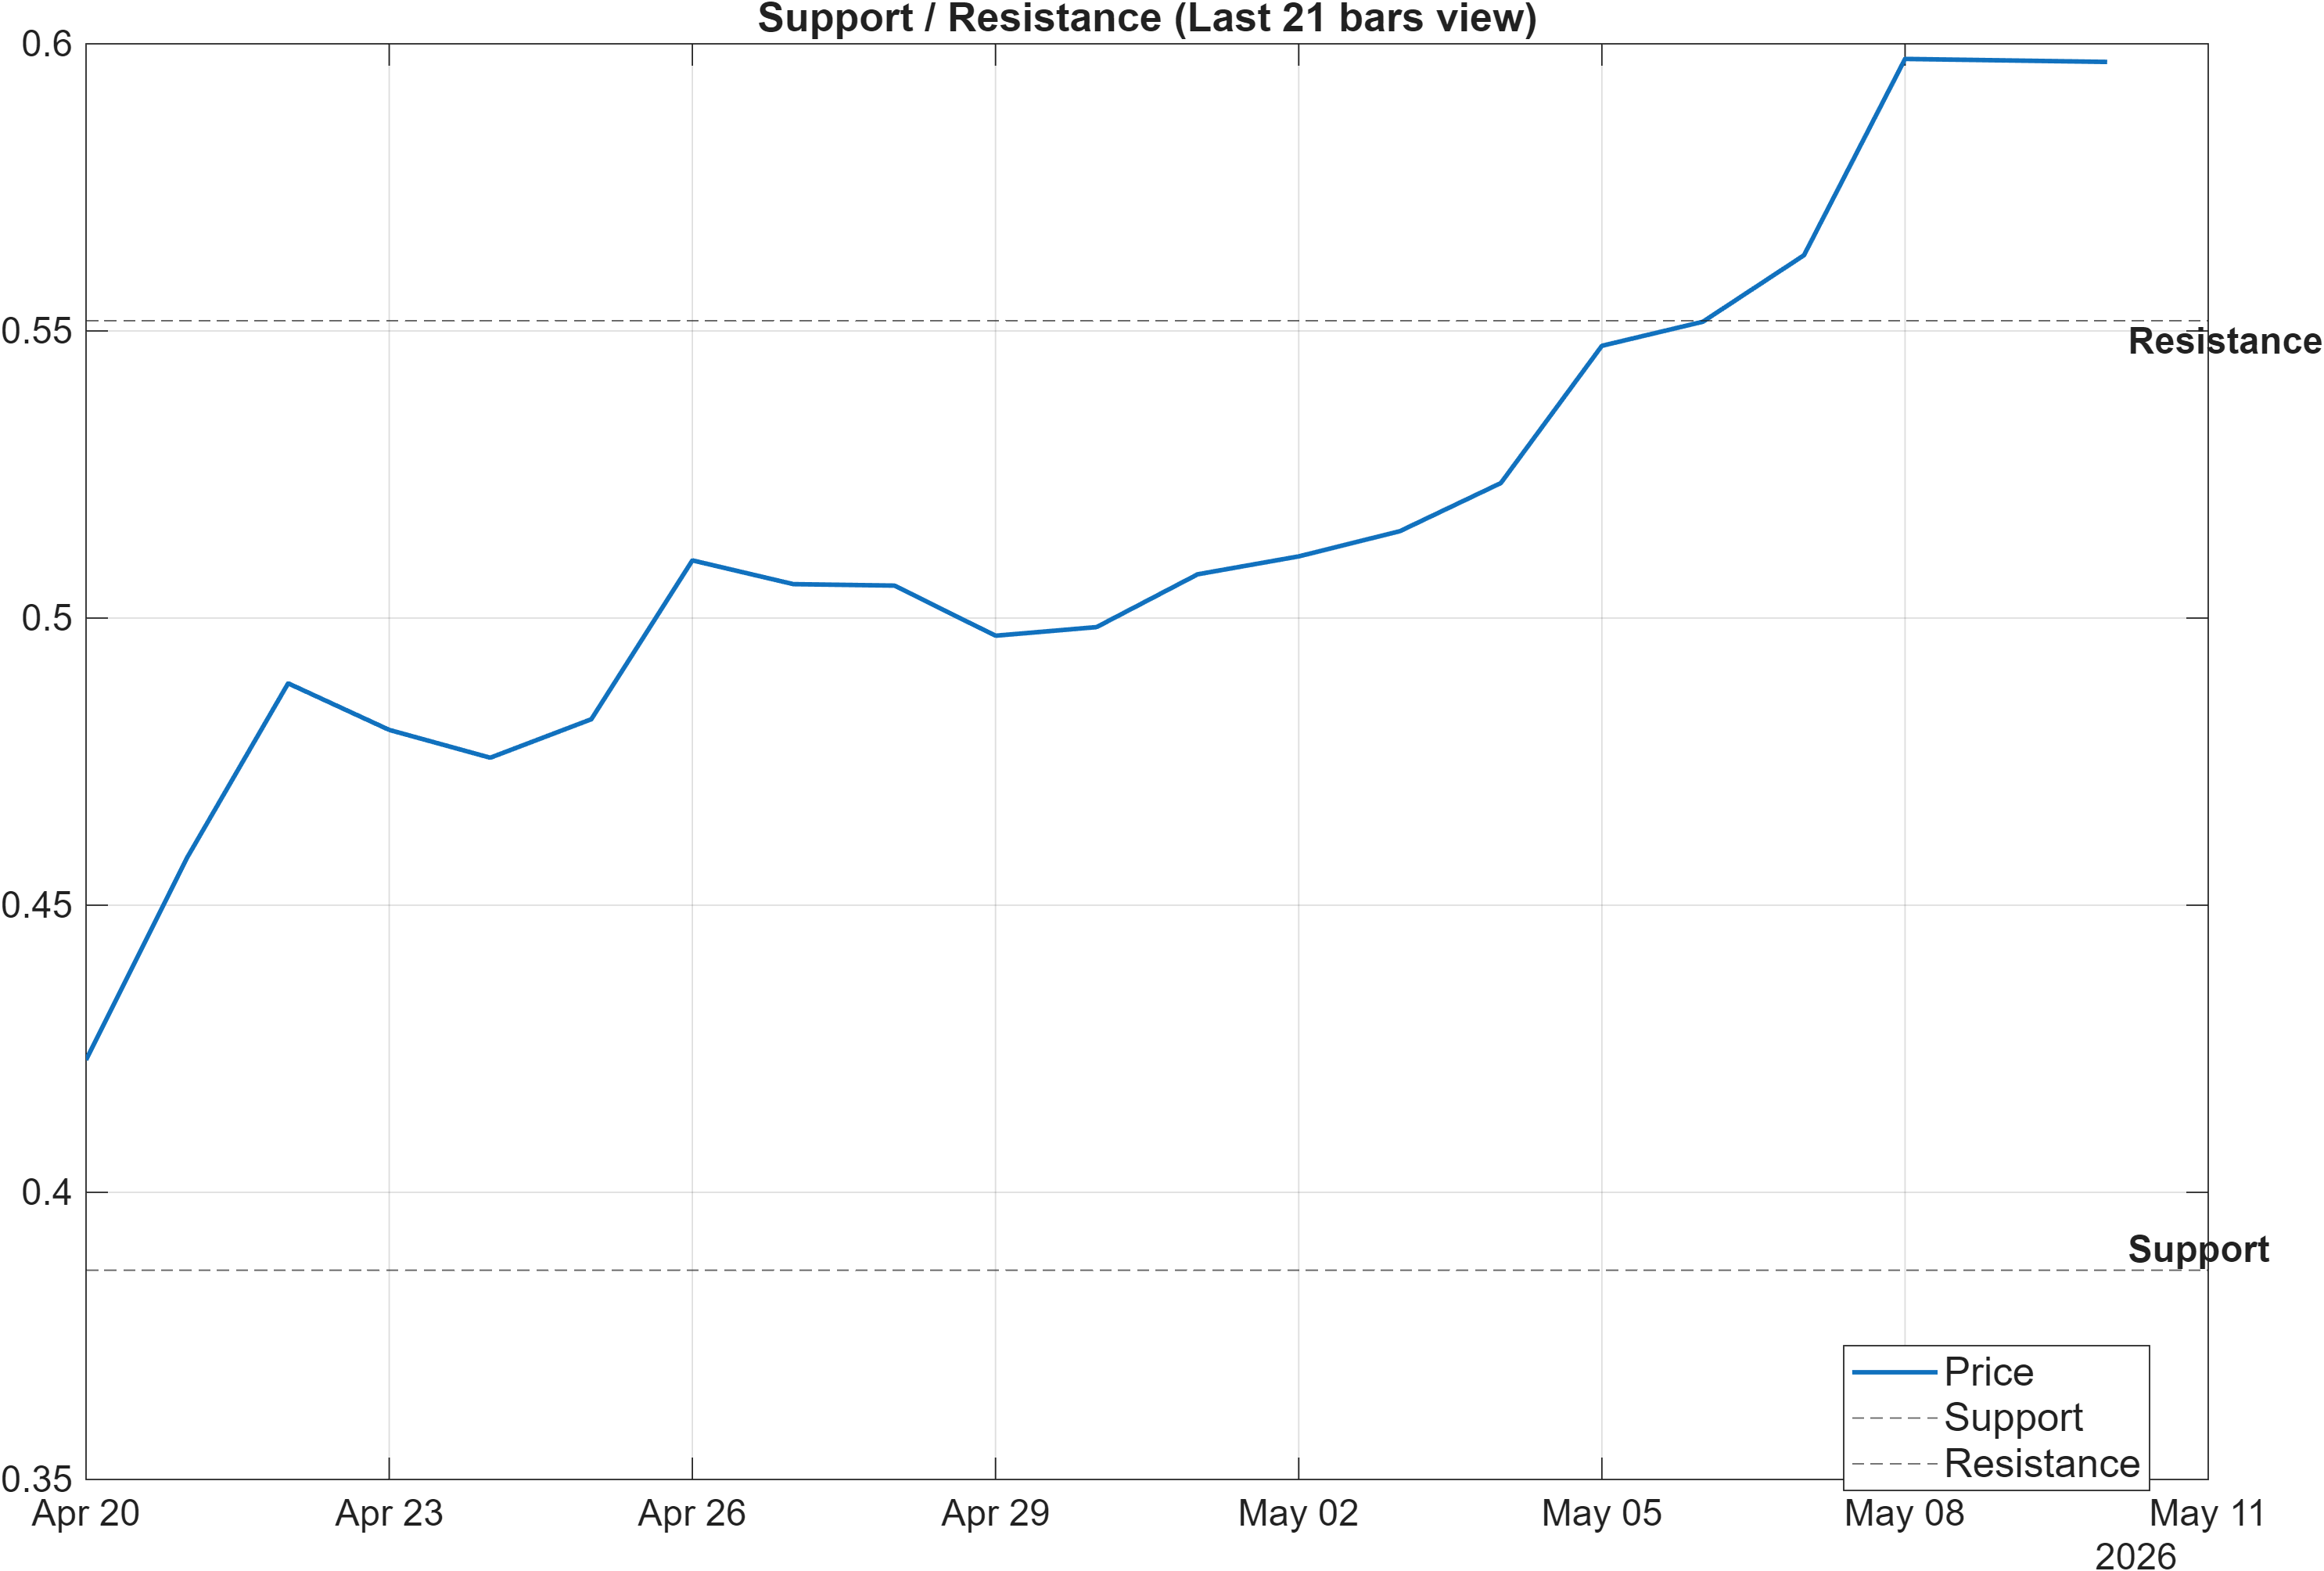
The level map is tight and actionable: 0.3864 is the key downside reference, while 0.5518 is the immediate upside boundary. In a market already showing trend alignment via moving averages (Bullish close vs MA50 and MA50 vs MA200), these zones function as probabilistic decision points for confirming continuation versus diagnosing early breakdown. The distance between the two levels is also relevant because it defines the current trading “box” within which momentum oscillators can cool without invalidating the broader trend posture.
With momentum readings stretched (notably RSI(14) at 88.04), resistance behavior becomes more informative than oscillator readings alone. A clean acceptance above 0.5518—particularly if consistent with the scenario language of a volume-supported break—would reduce the odds that the current strength is merely a late-stage push. Conversely, repeated failure near resistance while momentum remains elevated can create bearish divergence risk (price stops advancing while oscillators roll over).
On the downside, a close below 0.3864 is explicitly framed as deterioration risk. Importantly, this is the kind of event that can reconcile model disagreements: it would likely pull the otherwise Bullish cross-sectional ranks (daily #25, weekly #44) toward a weaker regime, while also validating the more cautious message implied by a Neutral AI technical rank later in the dashboard (#318). Until one of these boundaries is resolved, the highest-quality read is a trend-positive regime with defined invalidation rather than an unconditional continuation assumption.
Scenario view: Break above resistance with volume → continuation. Close below support → signal deterioration risk.
5) Quant Technical Dashboard (18 Signals)
KGNAI AI Technical Analysis Score (Deep Reinforcement Learning): Rank #318 out of 800 (Rank 1 represents the strongest technical positioning and a higher probability of favorable price behavior. As ranks increase toward the maximum, the probability of favorable outcomes weakens and bearish positioning becomes more dominant.) | Label: Neutral | Score: 0.205
18-Signal Technical Confluence Score: 0.556 (Bullish)
Overall Technical Score (18-signal confluence + DRL rank blend): 0.450 (Bullish)
Note: The blended score reflects signal strength weighted against broader AI technical ranking, which may temporarily diverge.
Blended technical score breakdown: 0.450 (Bullish | Bull 13 / Bear 3 / Neutral 2)
The most important analytical feature in this section is alignment versus divergence across model layers. At the indicator layer, confluence is clearly positive: 0.556 is labeled Bullish, and the heatmap summary indicates 13 Bull versus 3 Bear and 2 Neutral. That breadth matters because it reduces dependence on any single oscillator or volume metric.
However, the separate DRL technical rank is #318 out of 800 with a Neutral label and a score of 0.205. This is not a contradiction so much as a sign that the DRL framework may be penalizing features often associated with late-stage moves—such as elevated momentum or unstable volume dynamics—even while the classic indicator ensemble remains supportive. The blended result (0.450, Bullish) sits between these two layers, effectively acknowledging strength while discounting it for model-identified friction.
The signal table provides a coherent explanation for why both messages can coexist. Momentum is strong (e.g., ROC(20) at 30.24 and positive MACD hist), but there are tactical cautions: Vol ROC(20) at -93.33 is Bearish and Chaikin Vol at 54.07 is Bearish, suggesting volume/volatility behavior is not uniformly confirming. In that context, the dashboard is best read as: trend and momentum are favorable, but the highest-confidence continuation case likely requires level confirmation (resistance clearance) rather than relying on already-extended oscillators.
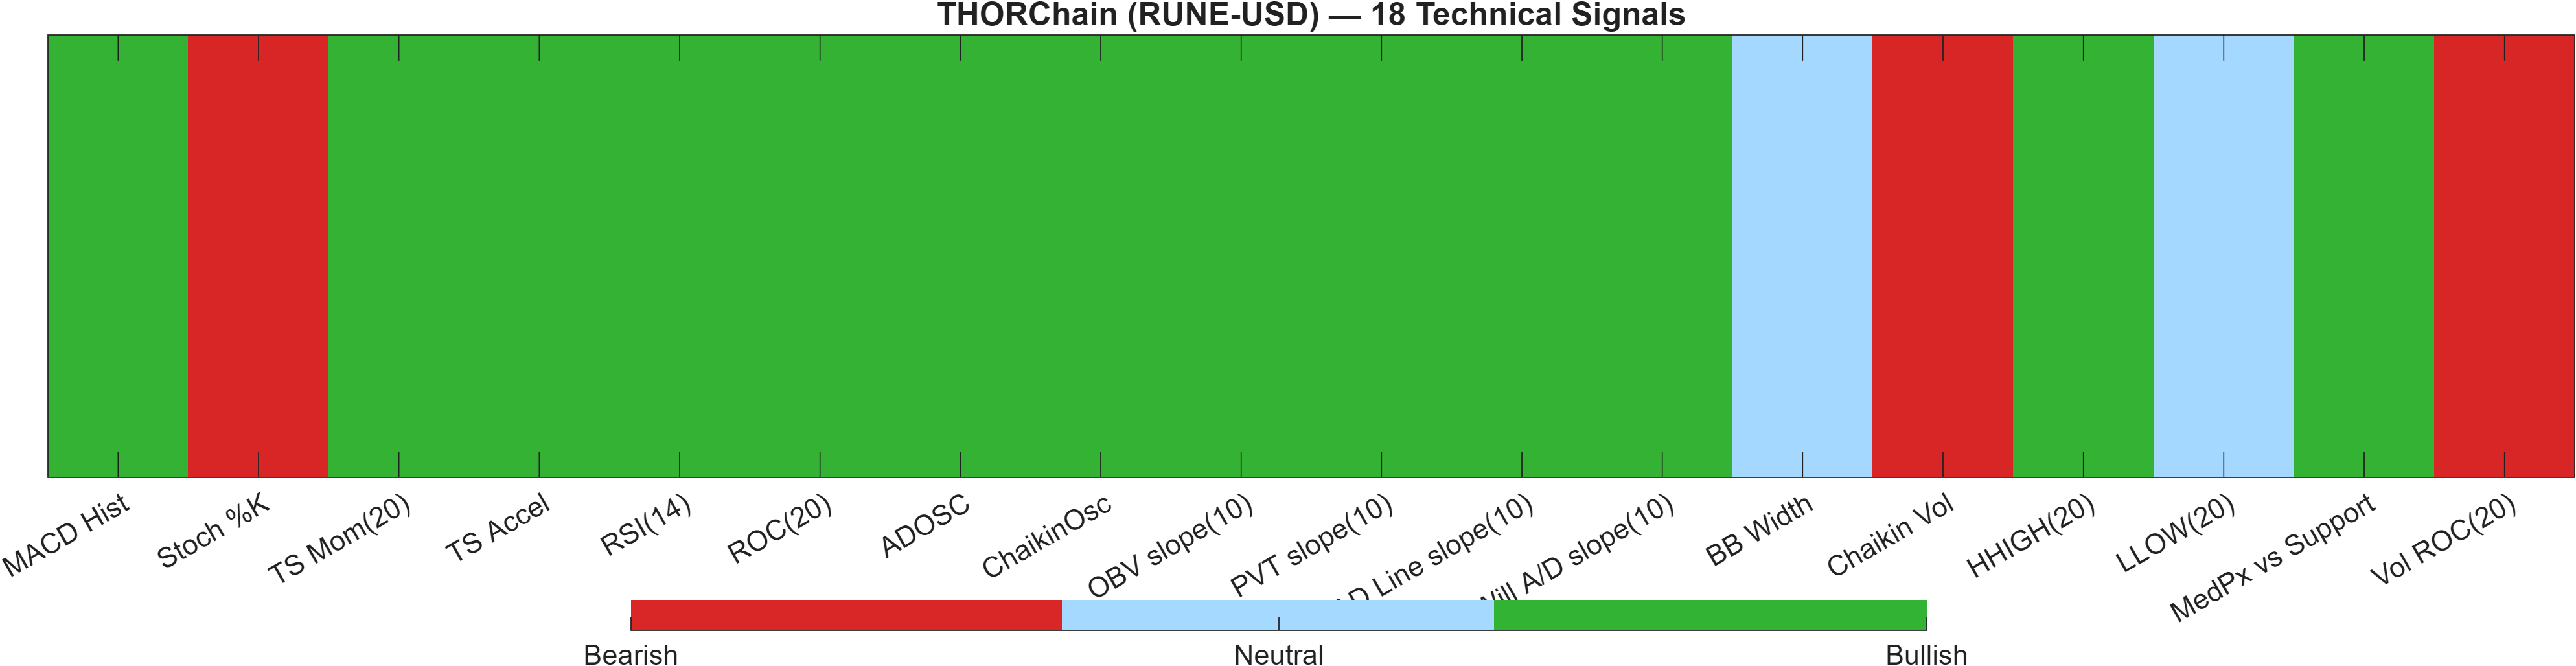
Signal table (Bull/Bear/Neutral)
| Indicator | Value | Signal |
|---|---|---|
| MACD Hist | 0.007488 | Bullish |
| Stoch %K | 91.55 | Bearish |
| TS Mom(20) | 0.1391 | Bullish |
| TS Accel | 0.07613 | Bullish |
| RSI(14) | 88.04 | Bullish |
| ROC(20) | 30.24 | Bullish |
| ADOSC | 82.09 | Bullish |
| ChaikinOsc | 3.047e+07 | Bullish |
| OBV slope(10) | 1.122e+08 | Bullish |
| PVT slope(10) | 3.323e+06 | Bullish |
| AD Line slope(10) | 6.593e+07 | Bullish |
| Will A/D slope(10) | 0.1275 | Bullish |
| BB Width | 0.3199 | Neutral |
| Chaikin Vol | 54.07 | Bearish |
| HHIGH(20) | 0.6065 | Bullish |
| LLOW(20) | 0.4201 | Neutral |
| MedPx vs Support | 0.1935 | Bullish |
| Vol ROC(20) | -93.33 | Bearish |
Interpretation: Indicator-level signals form the base confluence, which is then adjusted using a separate AI-driven technical ranking model. The final technical score summarizes this combined view.
6) News sentiment + extractive gist
Recent coverage across major financial outlets indicates a backdrop that is more contextual than instrument-specific for this snapshot. The dataset notes that instrument-specific matches were not found, so the digest reflects broader crypto and sector narratives rather than RUNE-USD-only catalysts. Quantitatively, the tone stays restrained: the average sentiment score is -0.071, with 81% neutral items and 19% negative, while the normalized KGNAI news sentiment score reads 0.07 with a Neutral label and overall news score of 0.11. This combination implies a modestly balanced bias rather than a strong directional push from headlines.
Positive Developments
The constructive component in the news flow is primarily industry-level: coverage points to continued infrastructure and policy discussion across the crypto ecosystem, which can support risk appetite at the margin even when it does not map one-to-one onto a single asset. In this context, a Neutral normalized sentiment score of 0.07 is best interpreted as “not an overhang,” rather than as a clear tailwind. For RUNE-USD, that matters because the technical posture is already favorable on several dimensions (18-signal confluence 0.556; ranks in the upper decile such as daily #25). When sentiment is not actively adverse, technical drivers and level reactions tend to play a larger role in near-term price discovery.
Neutral / Mixed Developments
The dominant share of neutral coverage (81%) suggests an information-heavy tape rather than a catalyst-heavy tape. That can coincide with choppier, range-defined trading where resistance/support levels carry higher signaling value. In such a regime, the most useful integration is to treat sentiment as a context filter: it does not currently argue strongly for either risk-on acceleration or risk-off repricing. With Bollinger bandwidth at 0.3199 (Neutral) and a key resistance at 0.5518, a neutral news backdrop tends to shift attention back to execution quality—breaks that fail, or breaks that hold—rather than expecting headlines to resolve the range.
Negative / Risk Signals
The risk tone is present but not dominant: 19% of items are negative and the average sentiment score of -0.071 keeps the aggregate slightly below flat. In practical terms, this is consistent with a market where adverse narratives exist, but they are not saturating the flow. For a technically extended asset (RSI(14) 88.04), even modest negative bias can matter if it coincides with weakening confirmations—particularly if price begins rejecting 0.5518 or if downside pressure pushes toward 0.3864. The risk framing here is therefore conditional: sentiment is not outright bearish, but it is sufficiently mixed that price-level validation remains the primary arbiter of whether strength persists or fades.
- Whether price action can sustain acceptance above 0.5518 alongside improving volume confirmation.
- Whether elevated momentum (RSI(14) 88.04) cools without breaking the 0.3864 support zone.
- Whether volume/volatility warnings (Vol ROC(20) -93.33; bandwidth 0.3199) stabilize as trend continues.
Sources referenced: Reuters, Bloomberg, Yahoo Finance, MarketWatch, Investing.com
Snapshot: AI Rank (Short–Mid–Long): Bullish (Bullish–Bullish–Bullish) · Technical Confluence: Bullish · Key Levels: Support ~0.39 | Resistance ~0.55 · News Sentiment: Neutral
7) Sources
Instrument-level news URLs are not reproduced in this article format. Not available in the provided data.
You may also like: How KGNAI AI ranks instruments across global markets
Disclaimer: KGNAI provides AI-generated analytics and educational market commentary only. This is not financial advice. Markets involve risk. Always do your own research.