
METIS-USD (MetisDAO) — 26-Apr-2026 Technicals Show Bullish Confluence with Short-Term Rank Drag
METIS-USD screens as a time-horizon split setup: KGNAI’s cross-universe ranks are Neutral in the daily and weekly windows, while the monthly and 3-month ranks move into a Bullish tier. That profile typically reflects an asset where the broader regime has improved, but nearer-term behavior remains sensitive to confirmation. Technically, the 18-signal dashboard is Bullish (confluence score 0.444), yet the blended technical view moderates to Neutral (overall 0.110) due to a weaker AI technical rank (#668 of 800). Momentum inputs are constructive—RSI(14) at 58.96 and MACD histogram 0.0144—while volatility sits in an active band (bandwidth 0.4370). Key decision levels remain anchored at support ~2.7813 and resistance ~3.7772, with news sentiment broadly Neutral (avg 0.031).
- Rank stance (Short / Mid / Long): Short-term Neutral | Mid-term Bullish | Long-term Bullish
- Technical confluence label: Bullish (18-signal score 0.444; blended overall 0.110 = Neutral)
- Key levels: Support ~2.7813 | Resistance ~3.7772
- News sentiment bias: Neutral (avg 0.031; 94% Neutral; 6% Positive; 0% Negative)
- Confirmation / invalidation condition: Continuation risk-on improves on a break above 3.7772 with volume; deterioration risk increases on a close below 2.7813.
KGNAI evaluates assets using large cross-sectional datasets built from millions of structured data points. Inputs incorporate fundamental metrics, technical structures, and systematically processed news sentiment. Statistical models, machine learning, and AI frameworks are used to assess relative positioning, signal alignment, and probabilistic behavior across broad universes.
- Ranks are comparative across the tracked universe, not absolute price targets.
- Confluence reflects alignment among independent signal groups.
- Support/resistance levels are probabilistic decision zones, not guarantees.
- Sentiment provides contextual bias within the broader analytical framework.
1) KGNAI AI Analysis
Region: CRYPTO
Total universe size: 800 ranked instruments
- Daily rank: #566 out of 800 — Neutral
- Weekly rank: #543 out of 800 — Neutral
- Monthly rank: #20 out of 800 — Bullish
- 3-Monthly rank: #28 out of 800 — Bullish
METIS-USD’s rank stack signals a regime improvement that is not yet uniformly expressed across timeframes. The monthly rank at #20 and 3-month rank at #28 place the asset in the top decile of the 800-instrument universe—an allocation-friendly profile in relative terms. By contrast, the daily #566 and weekly #543 sit in the lower third, consistent with shorter-horizon noise, mean-reversion pressure, or a consolidation phase after a stronger swing.
This divergence matters because cross-sectional ranking systems often penalize assets when near-term participation or trend persistence is uneven, even if the medium-term structure remains constructive. In practice, the combination of Neutral short-term with Bullish mid/long-term typically increases the importance of confirmation levels and signal persistence rather than one-off improvements. The framework also emphasizes invalidation: a favorable longer-horizon rank does not override near-term breakdown risk if price action loses key structural levels.
The most actionable inference is that METIS-USD currently behaves like a market with positive longer-window positioning but tighter execution constraints for short-horizon traders. Monitoring whether the short-term ranks begin to compress upward toward the monthly/3-month profile is often more informative than interpreting any single day’s movement in isolation. If that convergence fails to occur, the long-tilt may remain valid while entries become more dependent on volatility and liquidity conditions.
2) Price & trend overview
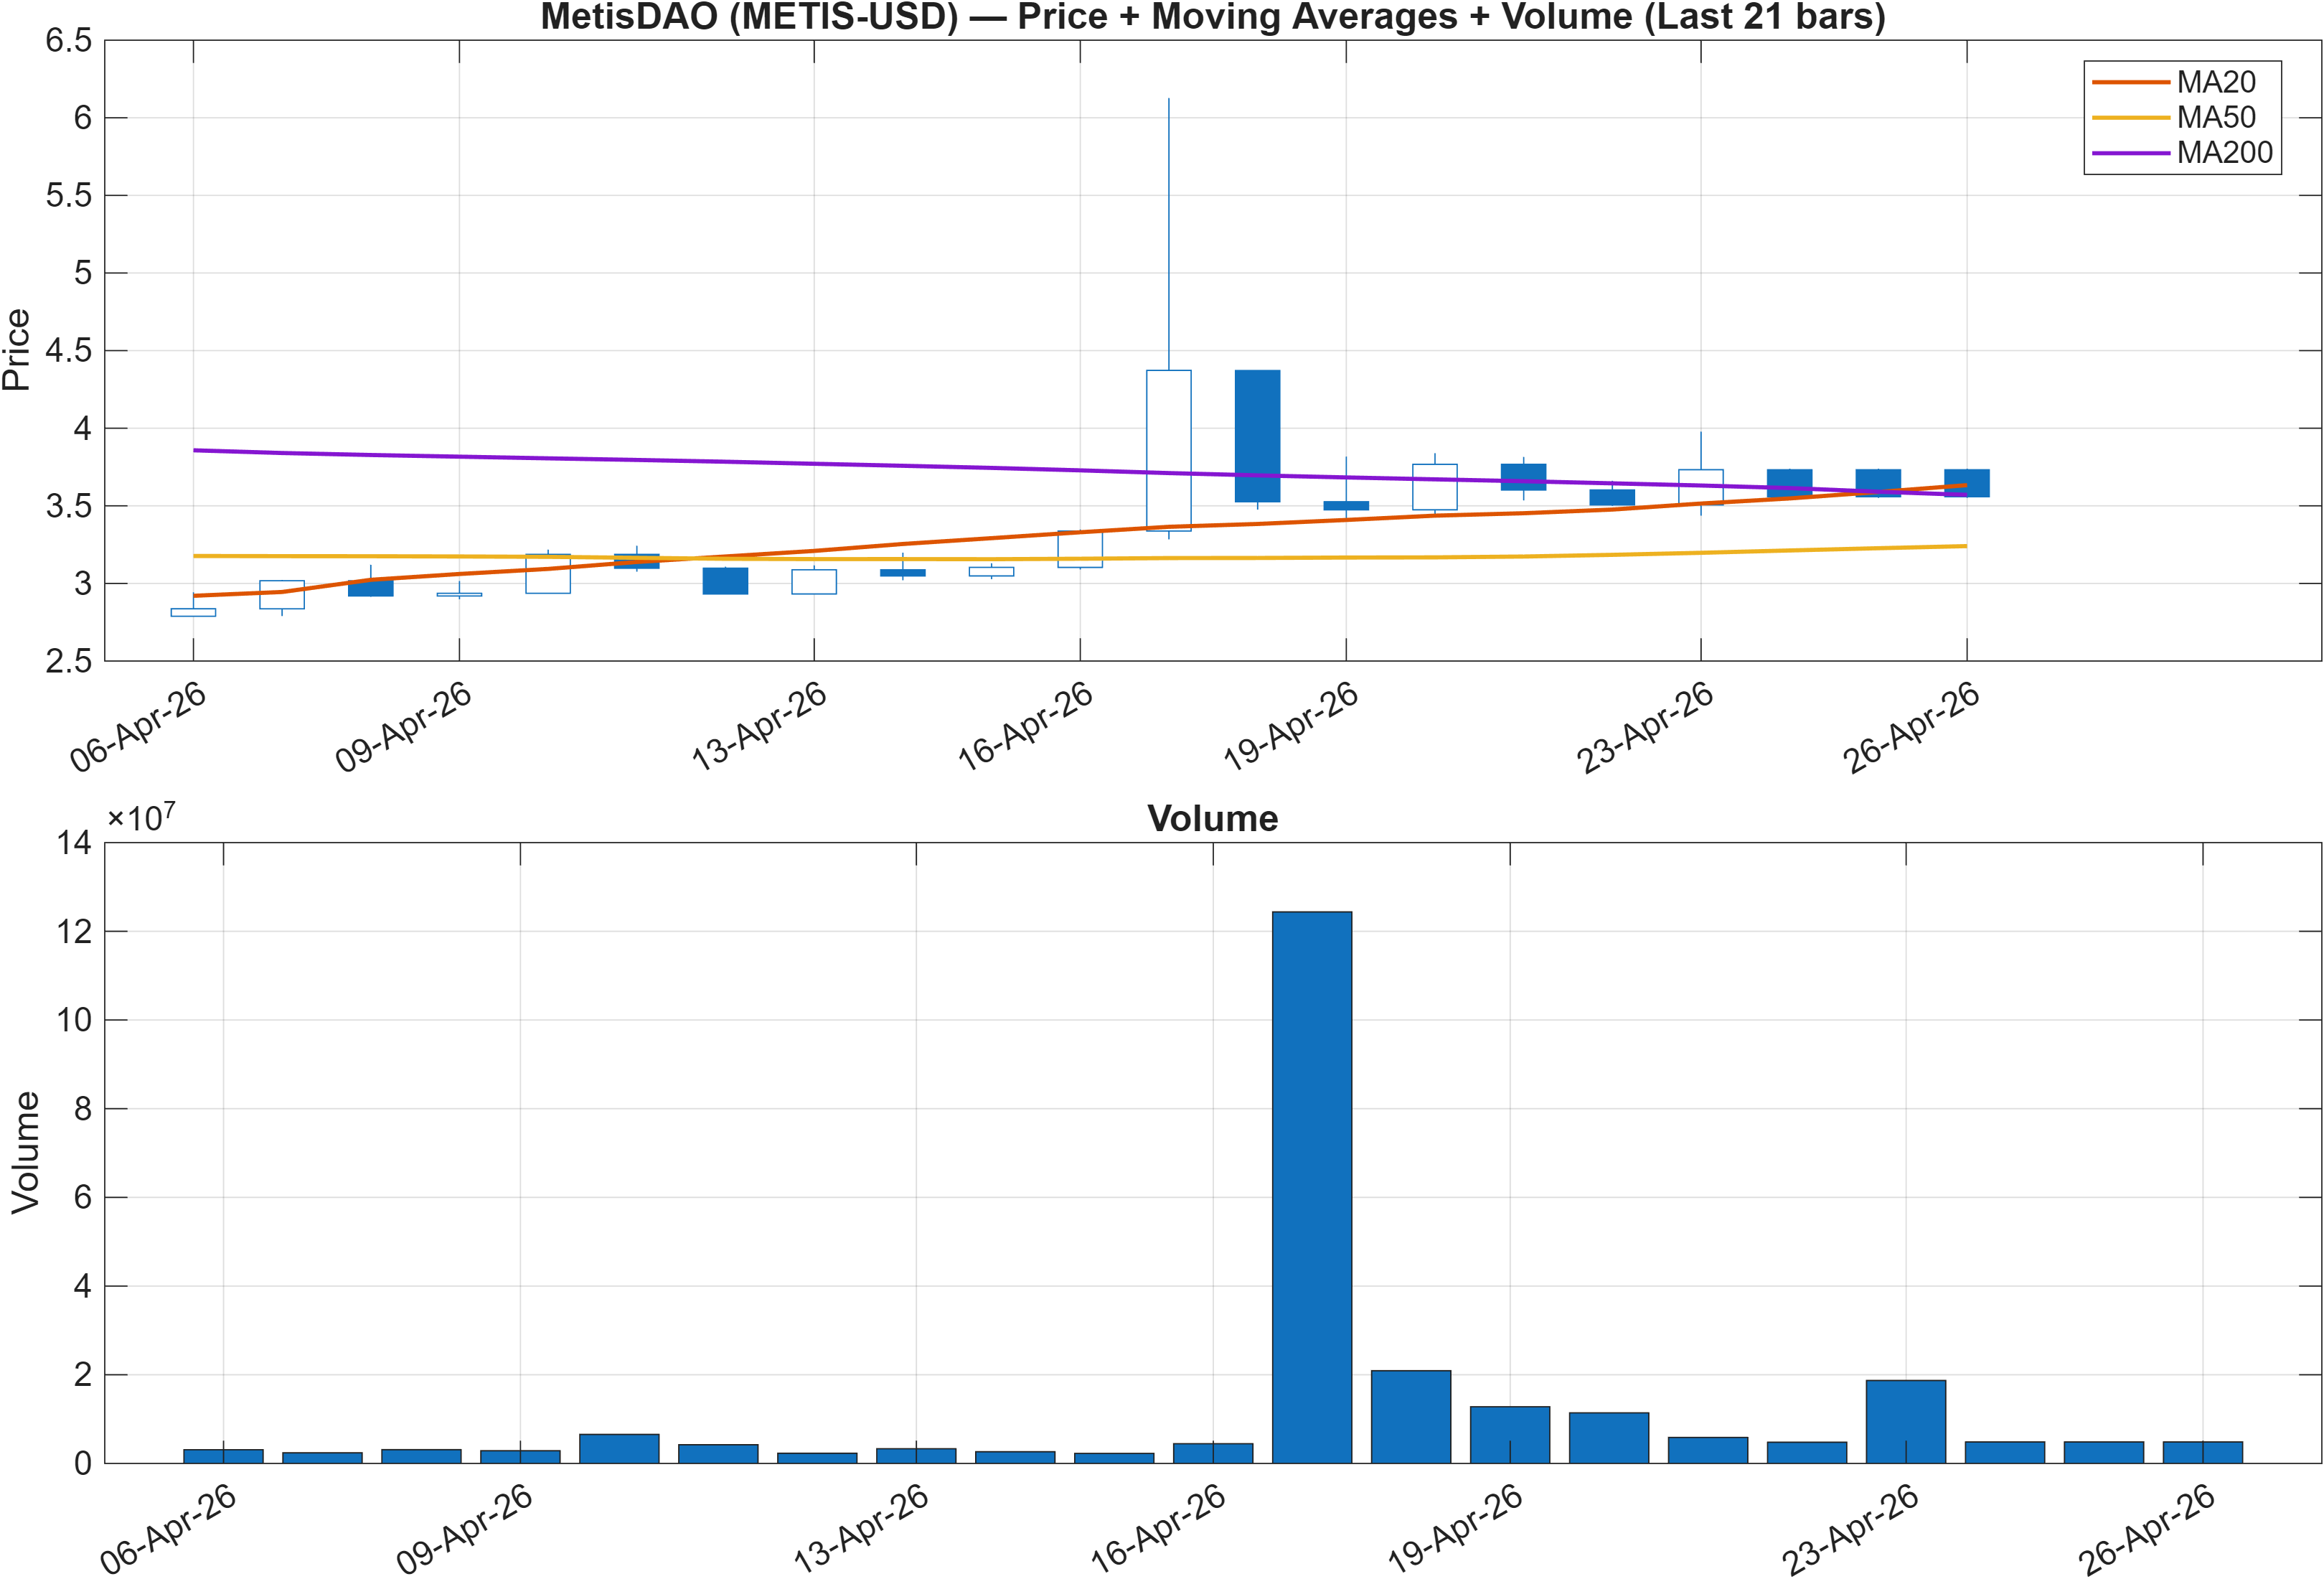
Interpretation: Close vs MA50 = Bullish, MA50 vs MA200 = Bearish.
The trend read is best described as near-term strength inside a broader mixed regime. The signal “close vs MA50 = Bullish” indicates that price is currently holding above the intermediate trend proxy, which tends to support dip-buying behavior and reduces the probability of immediate trend failure. However, “MA50 vs MA200 = Bearish” implies the longer moving-average stack has not fully flipped, a common feature of assets transitioning out of a prior drawdown or basing phase.
This mixed moving-average configuration often produces two-speed price action: rallies can extend while above the MA50, but follow-through may be interrupted by overhead supply associated with the slower trend. That fits with the rank split observed earlier—longer-horizon strength (monthly #20, 3-month #28) alongside weaker short-horizon rankings (daily #566, weekly #543).
From a market-structure perspective, the key question is whether trend improvement is persistent enough to pull the MA50/MA200 relationship toward neutralization over time, or whether the bullish close-vs-MA50 condition degrades into a short-lived bounce. The decision framework therefore leans on confirmation at the nearby resistance zone (3.7772) and invalidation at support (2.7813) rather than assuming continuity from the moving averages alone.
3) Momentum & volatility dashboard
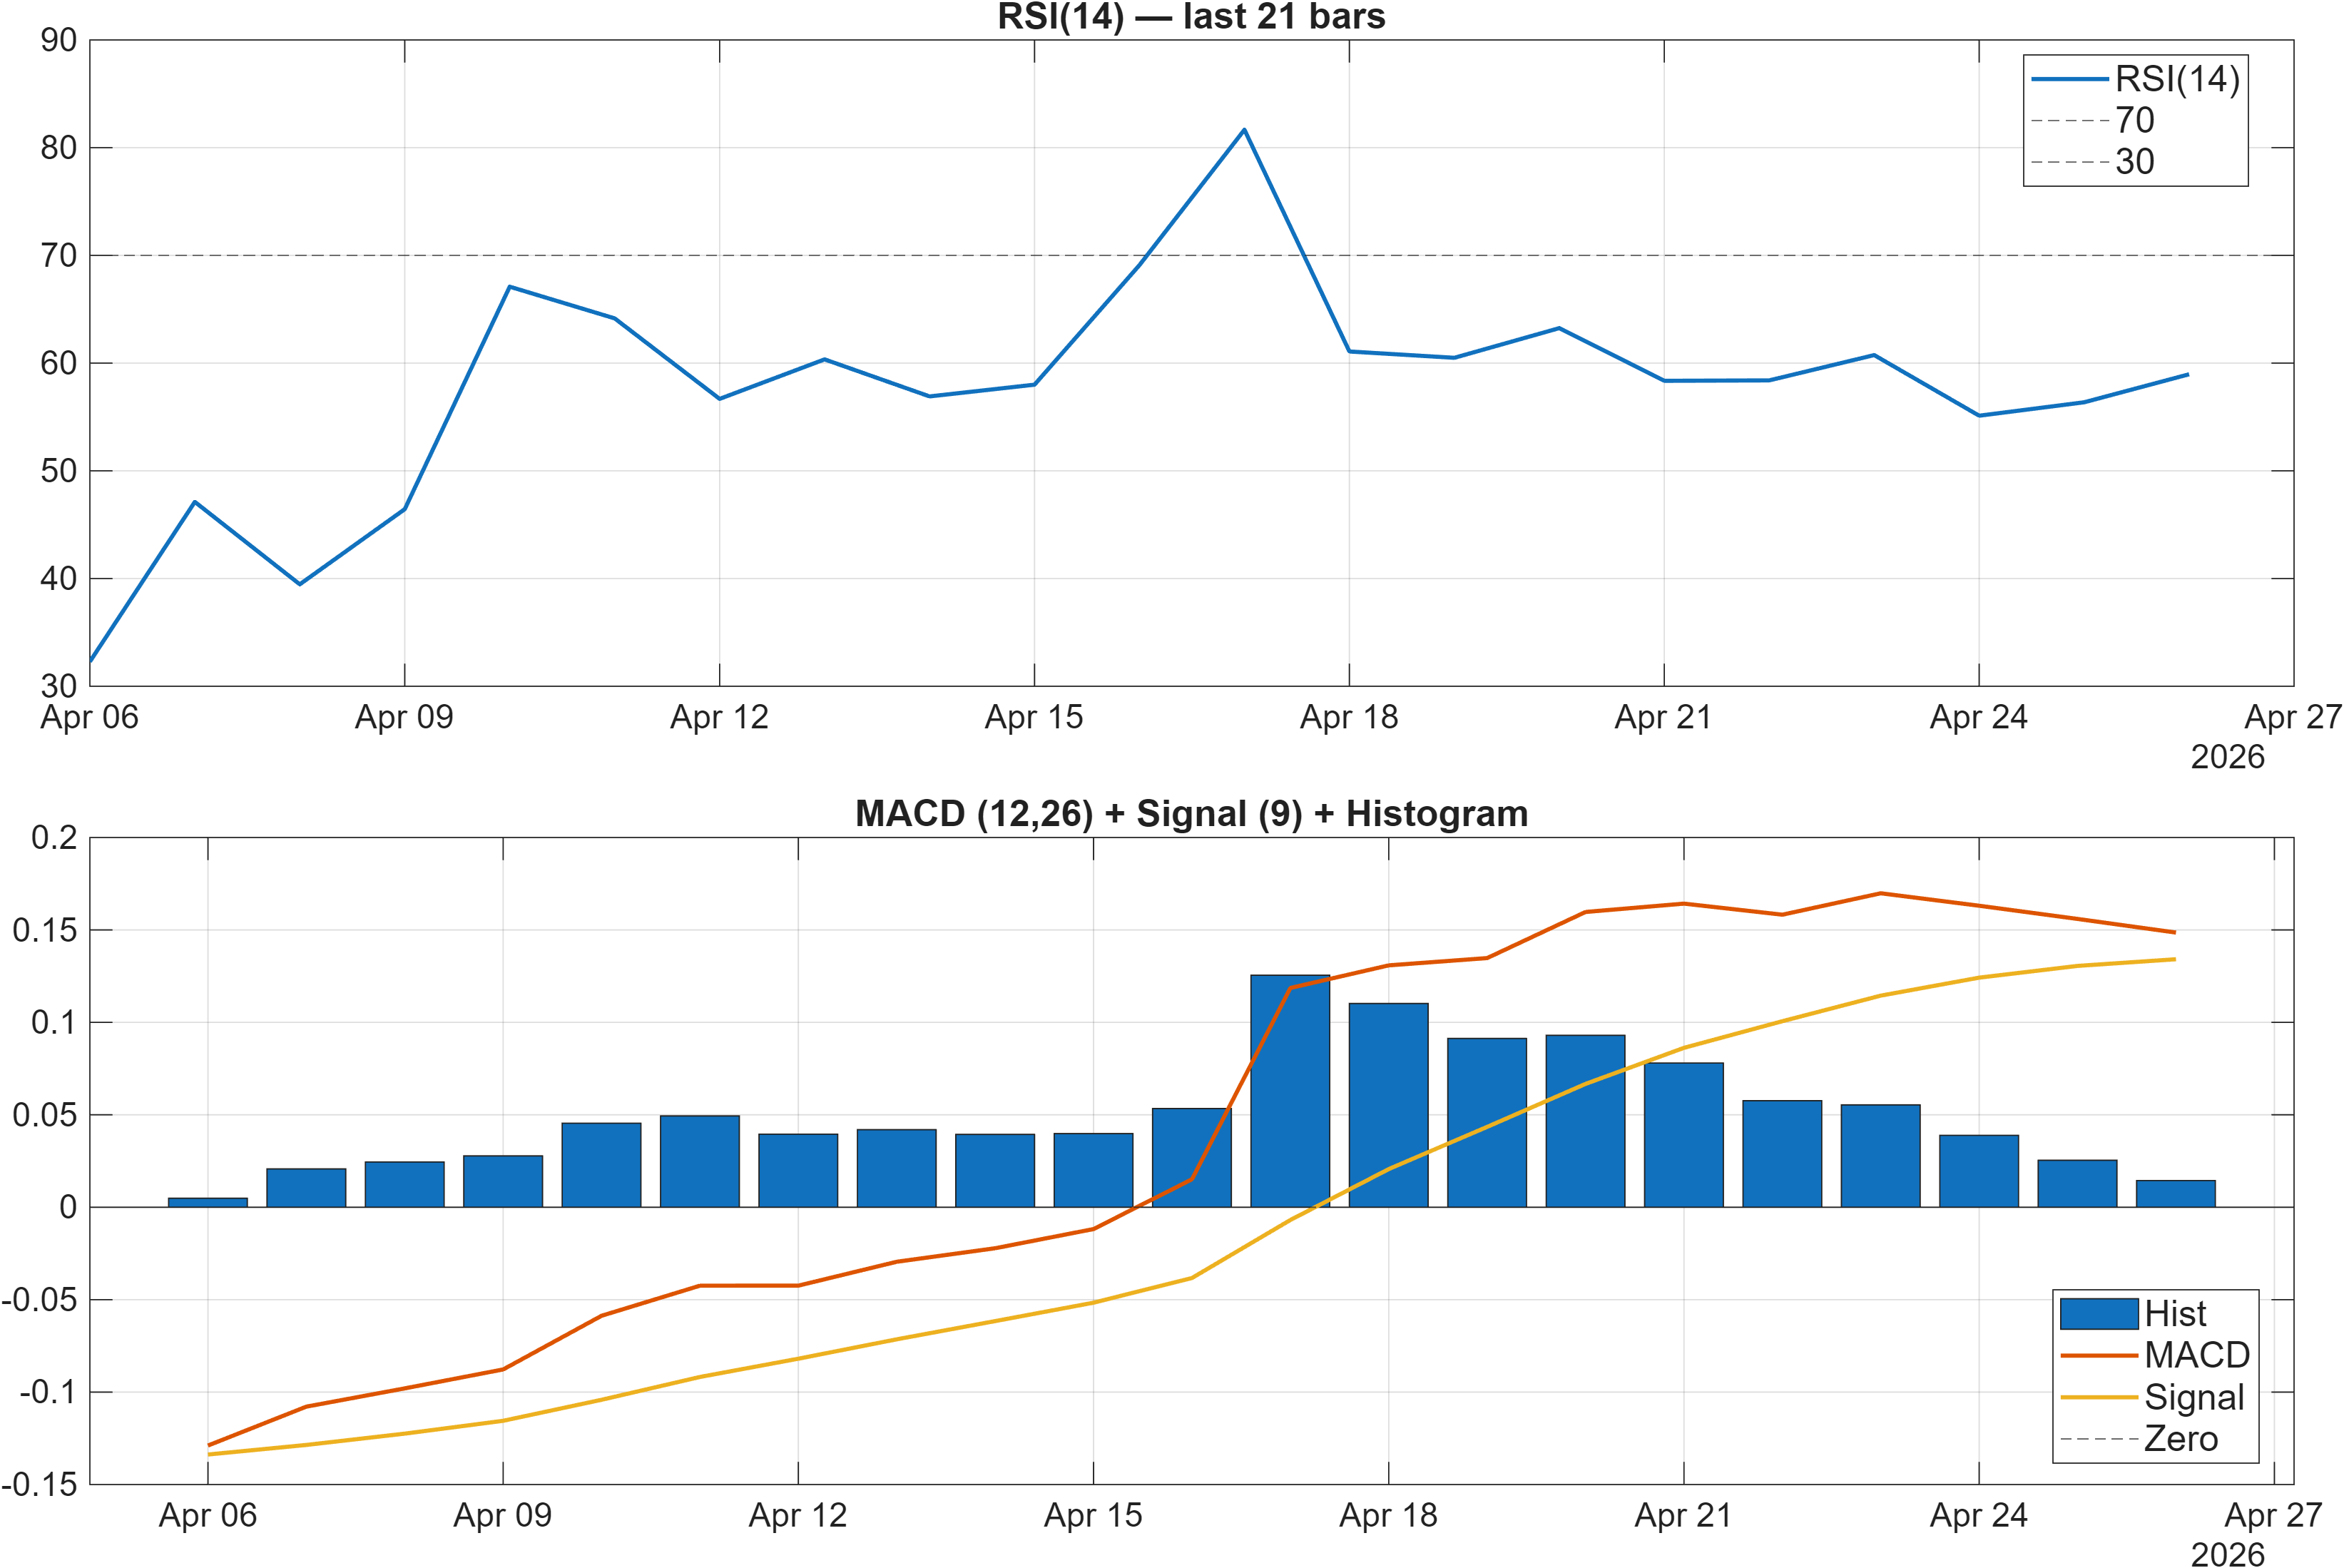
Interpretation: RSI bias = Neutral, MACD hist = 0.0144.
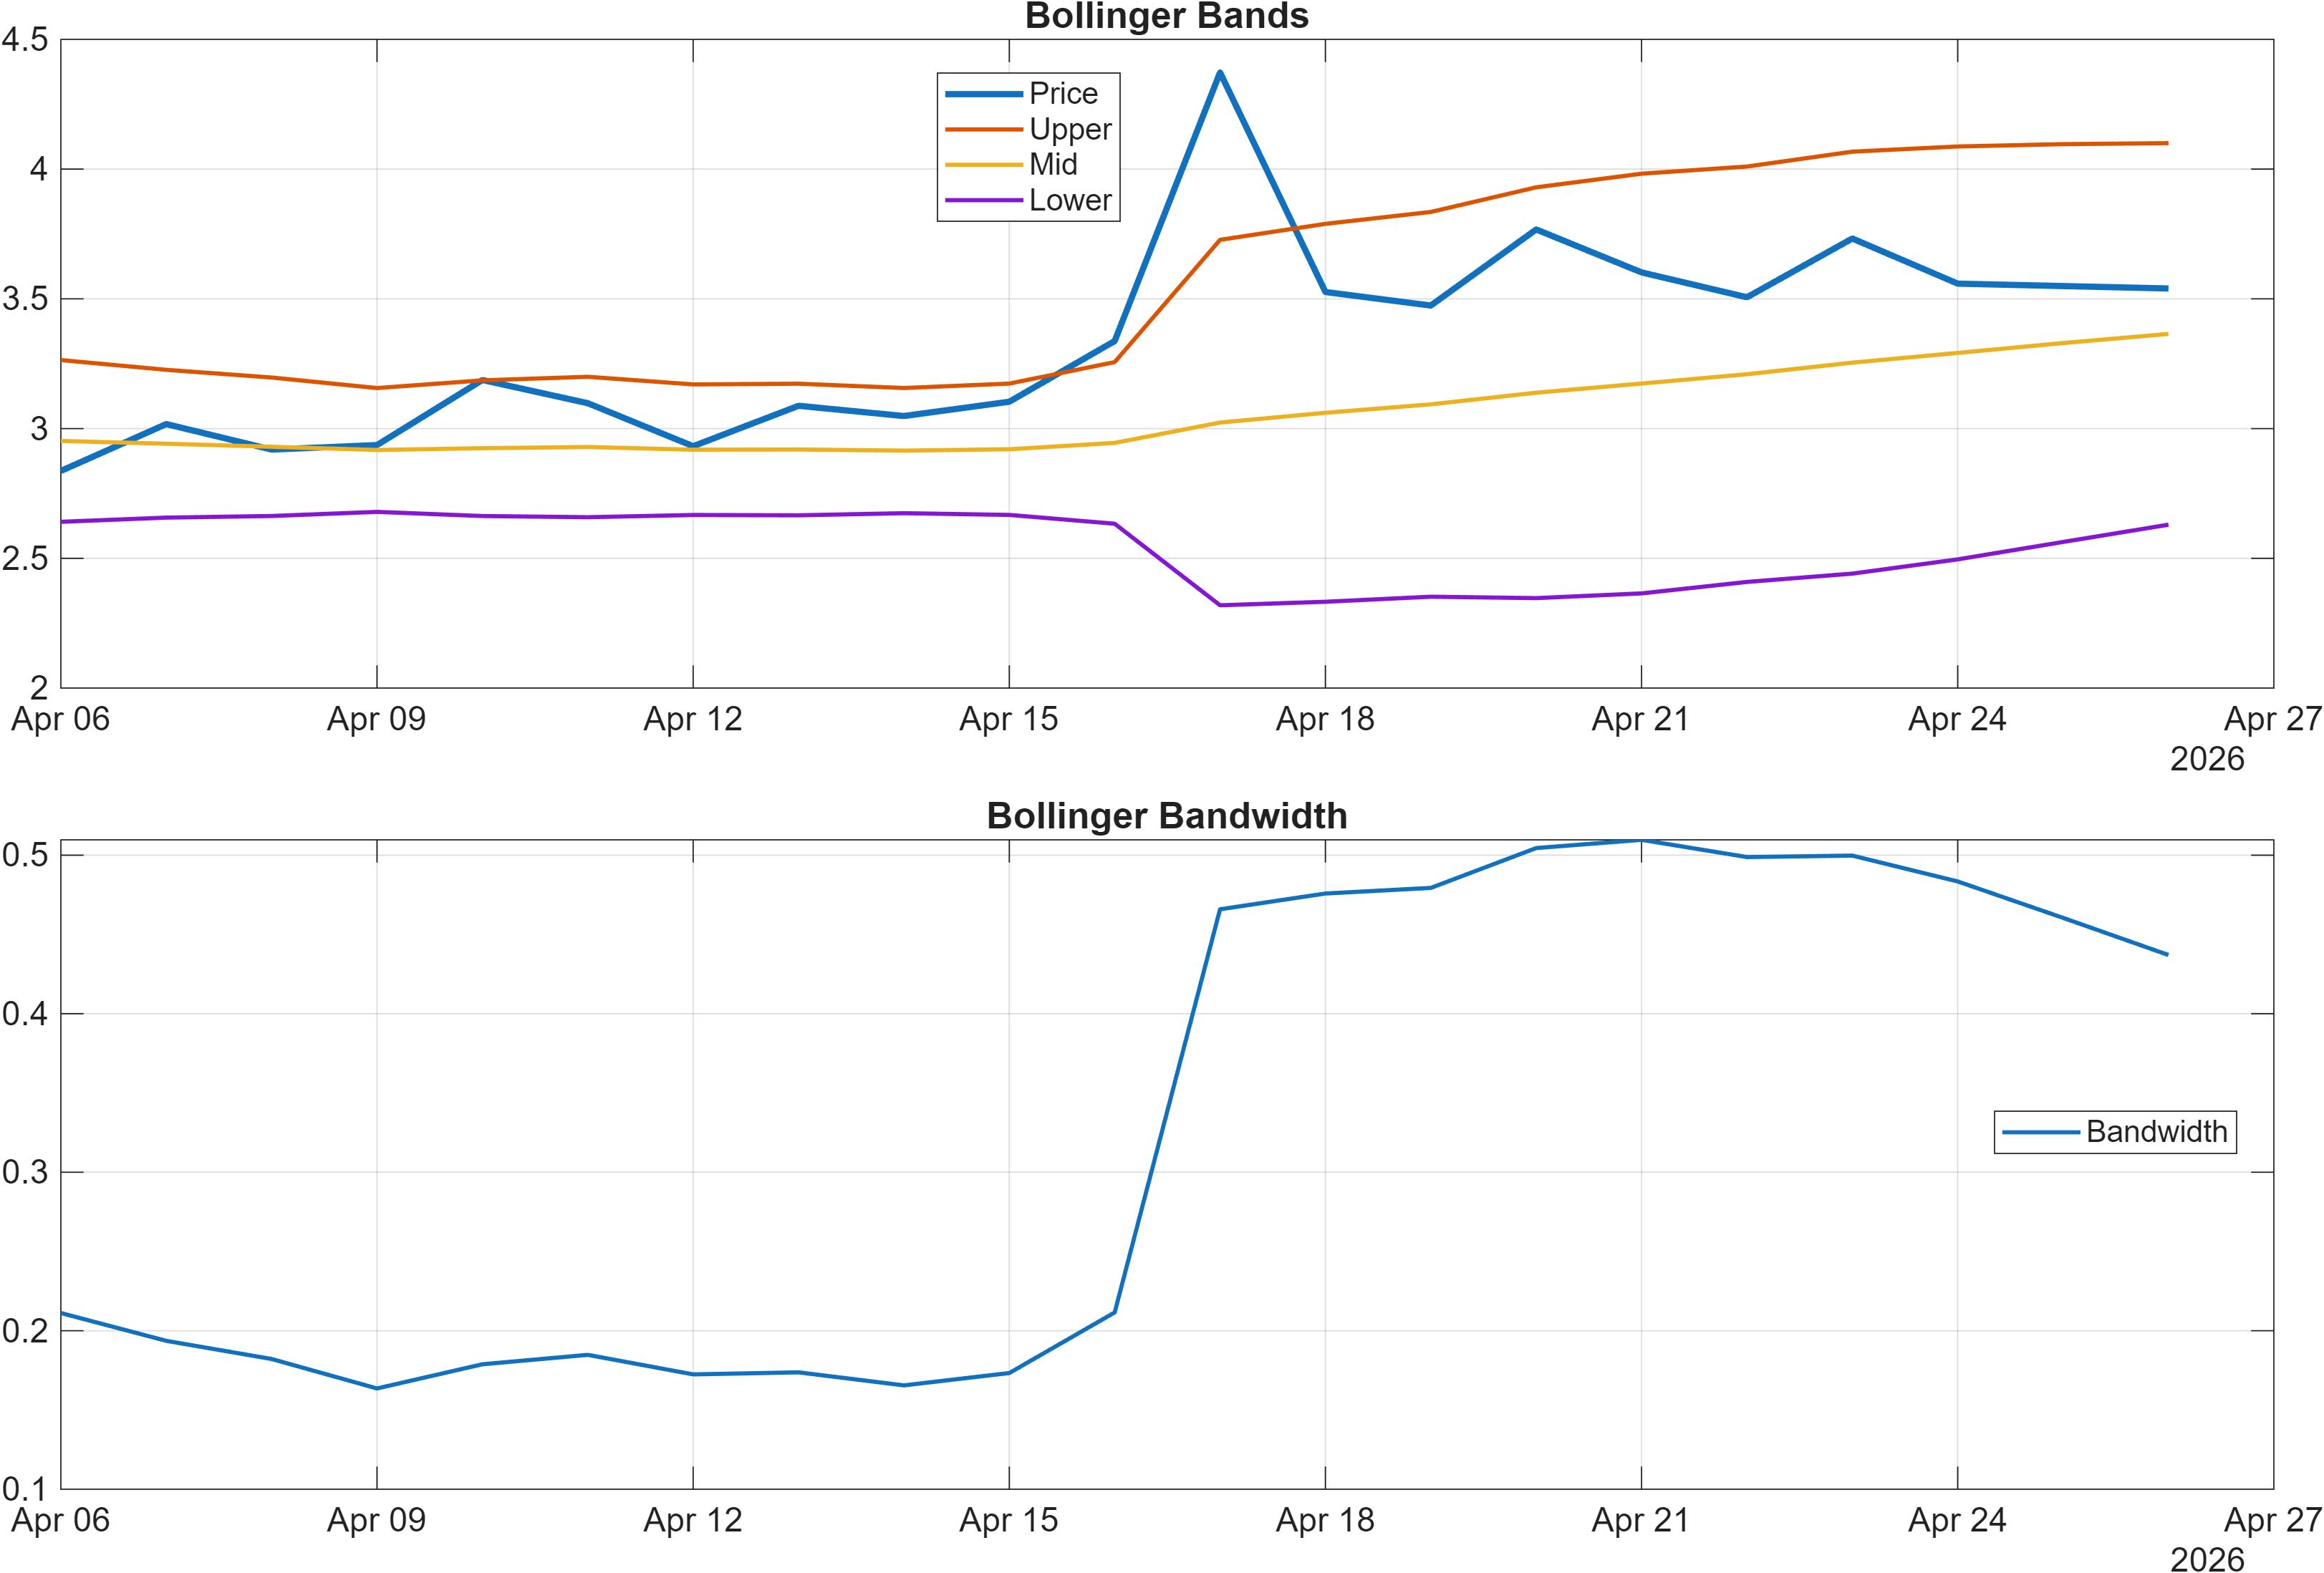
Interpretation: Bandwidth (volatility regime) latest = 0.4370.
The momentum complex suggests positive drift without an obvious exhaustion signature. The MACD histogram at 0.0144 aligns with a constructive impulse, while RSI framing is presented as Neutral despite RSI(14) reading 58.96 in the signal table—close enough to the mid-to-upper range to support trend continuation, but not so extended that mean reversion becomes the base case. The combined read is consistent with an asset that can trend, yet still reacts sharply to liquidity and volatility shocks.
Volatility is a central variable here. Bollinger bandwidth at 0.4370 points to a regime that is not compressed; that tends to widen the distribution of outcomes around key levels. In non-compressed bandwidth regimes, breakouts can follow through, but failed breaks can be equally abrupt. This interacts with the moving-average split (close above MA50, but MA50 below MA200) by increasing the probability of whipsaw around intermediate trend signals.
The internal consistency across indicators is notable: the signal table shows Stoch %K at 9.663 flagged Bullish and ROC(20) at 17.32 also Bullish. Together with MACD, that tilts momentum in favor of continuation attempts. The main constraint remains that a high-volatility environment can delay rank recovery on the daily/weekly horizons even when medium-term direction improves.
4) Support / Resistance zones
Support ~ 2.7813 | Resistance ~ 3.7772
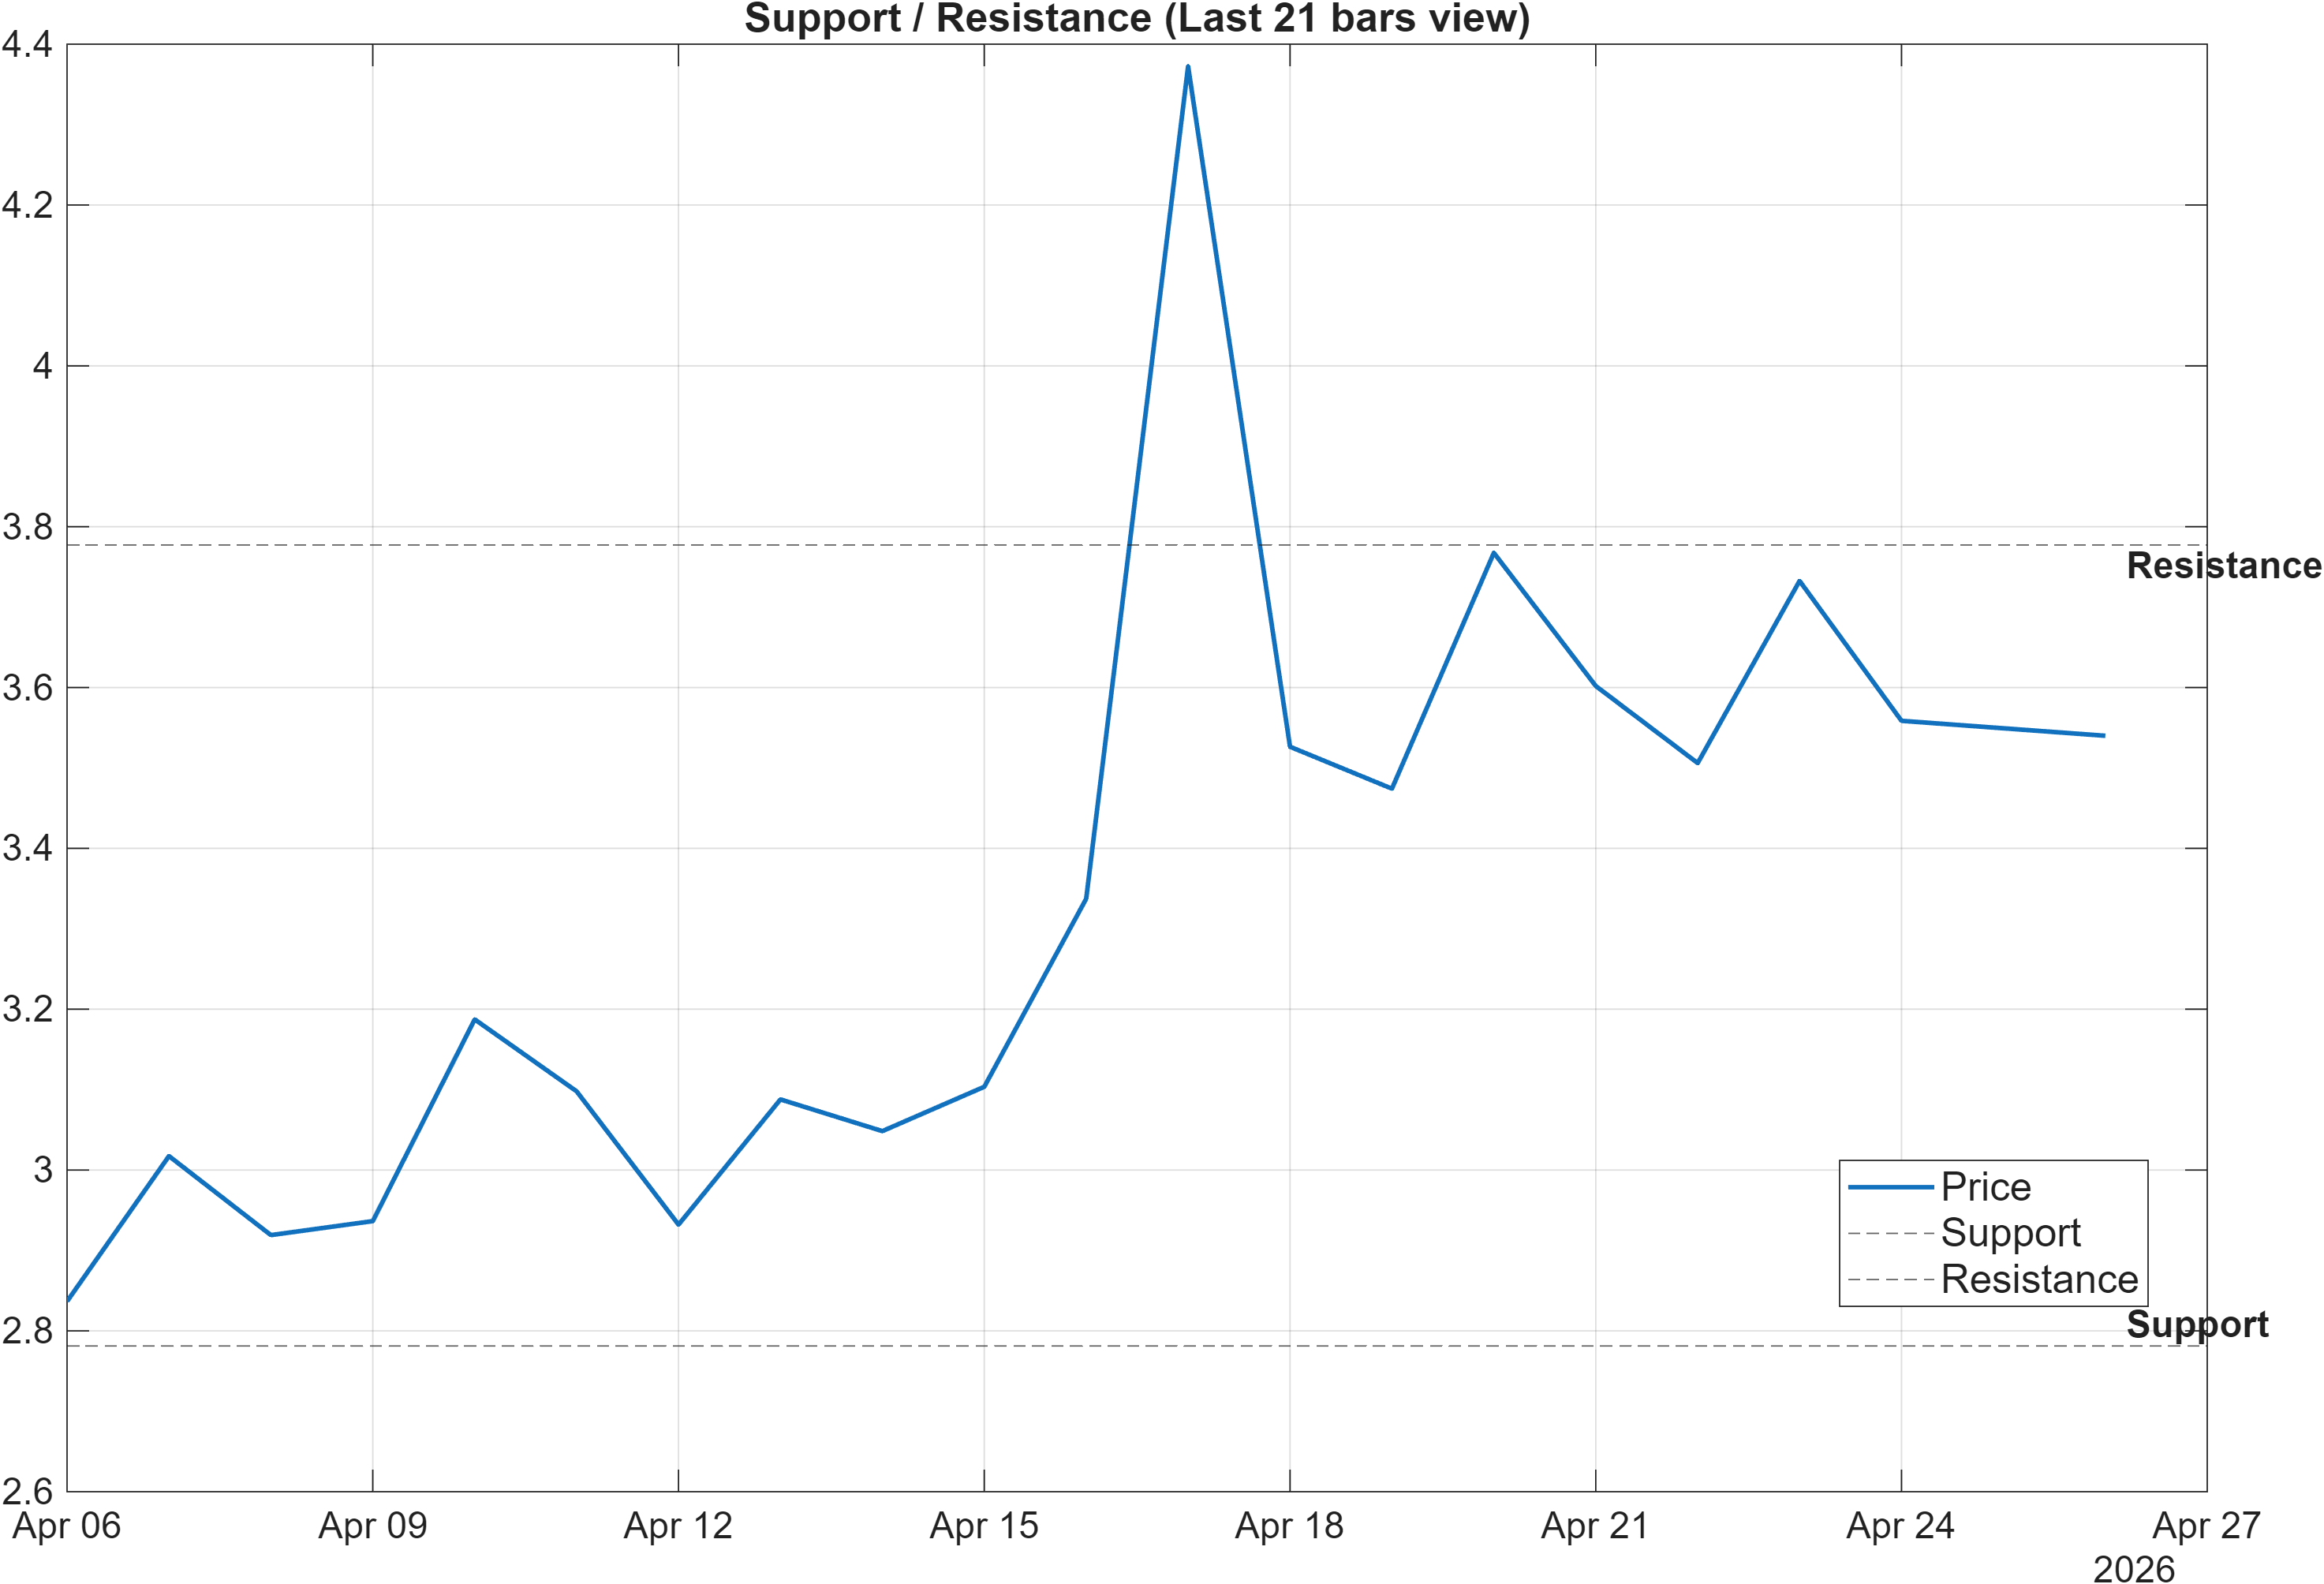
Scenario view: Break above resistance with volume → continuation. Close below support → signal deterioration risk.
The level map is clean and decision-oriented. With support ~2.7813 and resistance ~3.7772, METIS-USD is framed around a range-resolution problem: whether price can convert the upper boundary into acceptance (continuation) or whether it rejects and rotates back toward the lower boundary (deterioration risk). These levels also provide a practical bridge between medium-term bullish ranks and near-term neutral ranks—helpful when the ranking system is signaling “constructive backdrop, uncertain timing.”
The signal table adds context for why support matters. “MedPx vs Support” is 0.8637 and flagged Bullish, implying the median price relationship to the defined support zone is currently favorable. At the same time, the mixed trend stack (MA50 vs MA200 bearish) argues that resistance is not just a line on a chart—it is a likely validation checkpoint for the broader trend transition.
Because bandwidth is elevated (0.4370), level interactions can be less “surgical” and more probabilistic: brief breaches without follow-through are plausible. In that context, “break above resistance with volume” functions as a quality filter rather than a simplistic trigger. Conversely, a “close below support” would more directly challenge the bullish confluence seen in the 18-signal set (0.444) and help explain why the blended overall technical score remains only 0.110 (Neutral) despite many bullish sub-signals.
5) Quant Technical Dashboard (18 Signals)
KGNAI AI Technical Analysis Score (Deep Reinforcement Learning): Rank #668 out of 800 (Rank 1 represents the strongest technical positioning and a higher probability of favorable price behavior. As ranks increase toward the maximum, the probability of favorable outcomes weakens and bearish positioning becomes more dominant.) | Label: Bearish | Score: -0.670
18-Signal Technical Confluence Score: 0.444 (Bullish)
Overall Technical Score (18-signal confluence + DRL rank blend): 0.110 (Neutral)
Note: The blended score reflects signal strength weighted against broader AI technical ranking, which may temporarily diverge.
Blended technical score breakdown: 0.110 (Neutral | Bull 11 / Bear 3 / Neutral 4)
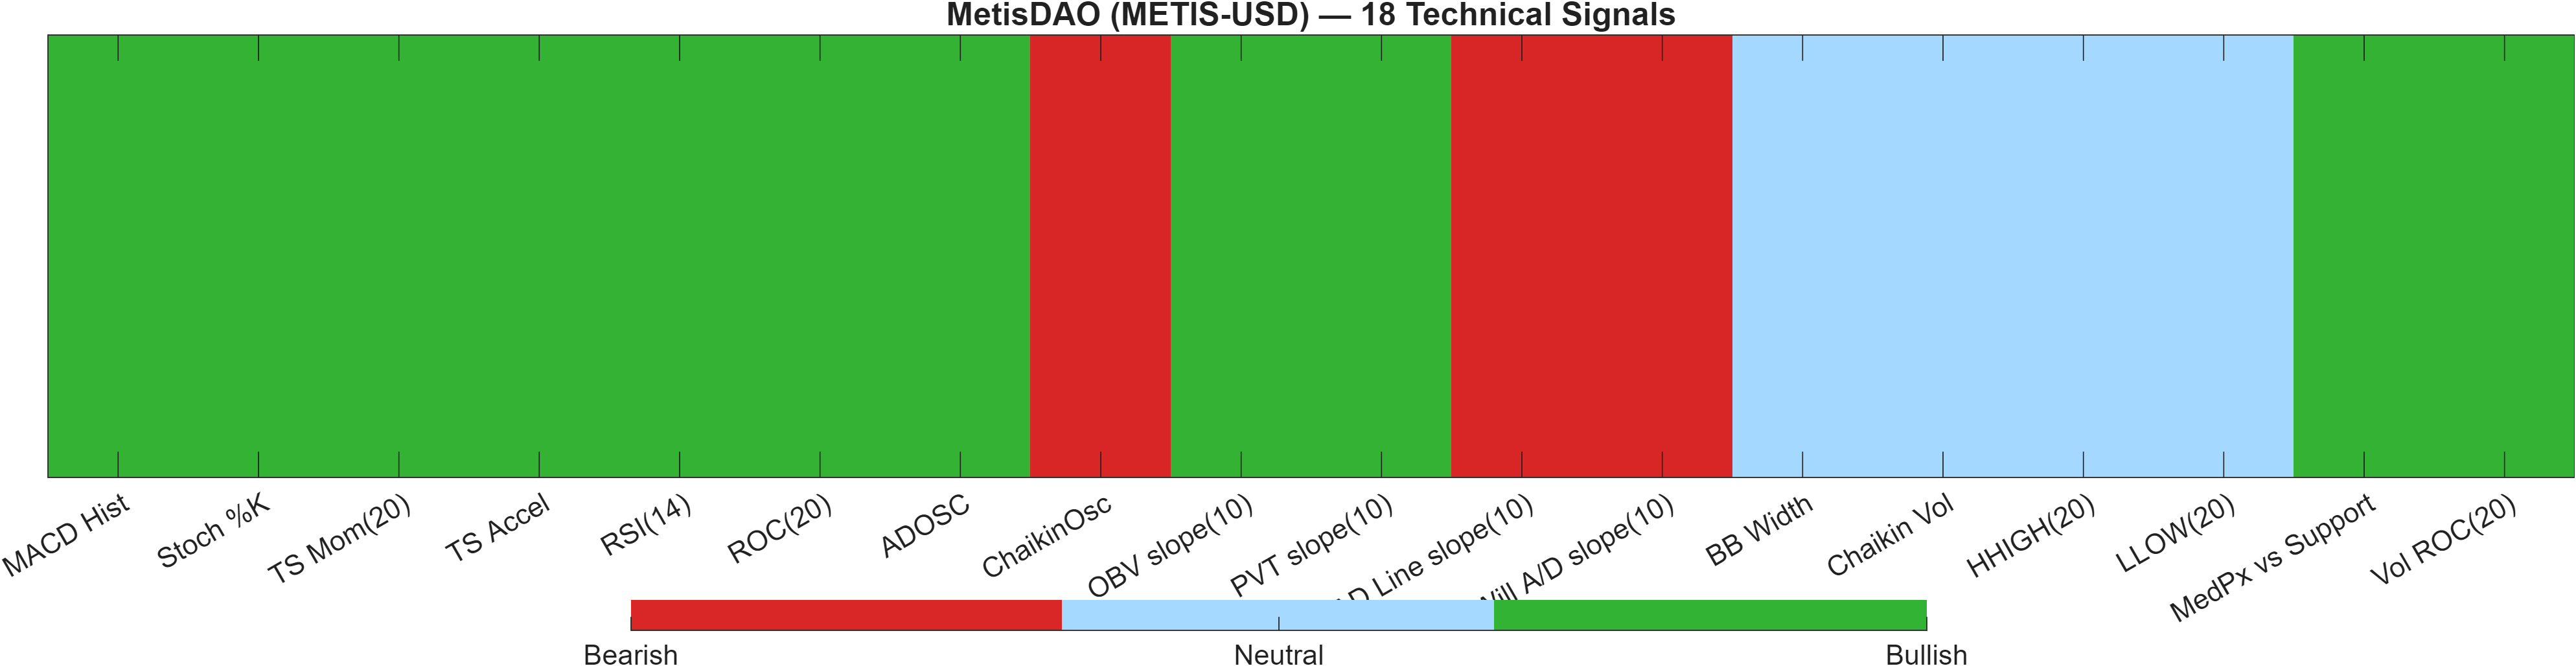
Signal table (Bull/Bear/Neutral)
| Indicator | Value | Signal |
|---|---|---|
| MACD Hist | 0.01443 | Bullish |
| Stoch %K | 9.663 | Bullish |
| TS Mom(20) | 0.5412 | Bullish |
| TS Accel | 0.677 | Bullish |
| RSI(14) | 58.96 | Bullish |
| ROC(20) | 17.32 | Bullish |
| ADOSC | 3.926 | Bullish |
| ChaikinOsc | -1.325e+07 | Bearish |
| OBV slope(10) | 1.053e+08 | Bullish |
| PVT slope(10) | 3.59e+07 | Bullish |
| AD Line slope(10) | -6.786e+07 | Bearish |
| Will A/D slope(10) | -0.02522 | Bearish |
| BB Width | 0.437 | Neutral |
| Chaikin Vol | -46.81 | Neutral |
| HHIGH(20) | 6.127 | Neutral |
| LLOW(20) | 2.79 | Neutral |
| MedPx vs Support | 0.8637 | Bullish |
| Vol ROC(20) | 102.7 | Bullish |
Interpretation: Indicator-level signals form the base confluence, which is then adjusted using a separate AI-driven technical ranking model. The final technical score summarizes this combined view.
The dashboard highlights a confluence-versus-model divergence that is worth respecting. On one side, the 18-signal system prints a Bullish confluence score of 0.444 with 11 bullish signals versus 3 bearish. On the other, the DRL technical rank is #668 with a Bearish label and score -0.670, pulling the blended technical stance down to 0.110 (Neutral).
This pattern often appears when classical indicators improve faster than broader pattern-recognition features (e.g., trend stability, drawdown behavior, or distributional asymmetry) embedded in the AI ranker. The bullish side is led by momentum and participation proxies—MACD histogram 0.01443, RSI(14) 58.96, and volume ROC(20) 102.7 are all flagged Bullish. These conditions support upside attempts and can reinforce breakouts if price acceptance develops above resistance (3.7772).
The bearish offsets are concentrated in accumulation/distribution measures (e.g., AD Line slope(10) -6.786e+07 and Will A/D slope(10) -0.02522), suggesting participation quality is uneven even while price momentum looks constructive. When this combination persists, it can produce rallies with weaker durability unless volume confirms at key inflection points. The blend being Neutral is therefore coherent: confluence is supportive, but the broader technical ranking is signaling that follow-through reliability is not yet fully established.
6) News sentiment + extractive gist
Note: Instrument-specific news matches were not found, so the digest includes broader market/sector headlines. Links are provided for verification.
Sentiment score (avg): 0.031 | Positive: 6% | Neutral: 94% | Negative: 0%
KGNAI AI News Sentiment Score (normalized -1 to +1): Not available (as of —) | Label: Not available | Overall news score: 0.03
Positive Developments
Recent coverage across major financial outlets indicates a cautiously constructive tone for the broader crypto complex, with narratives emphasizing renewed risk appetite and improving positioning in large-cap benchmarks. For METIS-USD, this matters indirectly: when sector-level participation expands, mid-cap and ecosystem-linked tokens can see improving liquidity conditions and stronger technical follow-through. The sentiment mix in the dataset—average score 0.031 with 6% positive and 0% negative—supports the view that the information backdrop is not actively hostile. In that setting, a technically constructive tape (MACD histogram 0.0144, RSI(14) 58.96) has a better chance of translating into sustained moves, provided confirmation occurs at the defined resistance zone (3.7772) and participation metrics stabilize.
Neutral / Mixed Developments
The dominant characteristic of the news set is neutrality, with 94% of items classified as neutral and no instrument-specific matches available in the provided data. That typically implies the market is trading more on technical structure and liquidity than on fresh METIS-specific catalysts. When the headline tape is mixed or informational, price often oscillates between well-defined levels, and indicator signals can rotate quickly—especially in a volatility regime where Bollinger bandwidth is 0.4370. As a result, the practical role of news here is contextual bias rather than directional guidance, reinforcing the need to treat support (2.7813) and resistance (3.7772) as probabilistic decision zones.
Negative / Risk Signals
While the quantified sentiment data shows 0% negative classification, broader-sector risk narratives remain present in crypto coverage, particularly around enforcement actions, fraud cases, and regulatory scrutiny. Even when not METIS-specific, such themes can tighten risk budgets and produce abrupt de-risking across the altcoin complex. This risk channel is consistent with why the blended technical score stays Neutral (0.110) despite a Bullish 18-signal confluence: the AI technical rank (#668) may be reflecting the market’s tendency toward fast reversals when sector risk headlines surface. In that environment, downside invalidation becomes more important than optimism—specifically, a close below 2.7813 would increase the probability that recent constructive momentum fails to persist.
- Whether sentiment remains predominantly neutral (94%) or shifts toward a higher positive share (currently 6%).
- Price behavior at 3.7772 (acceptance with volume vs rejection) in the context of bandwidth 0.4370.
- Any improvement in the AI technical rank from #668 that would reduce the confluence-versus-model gap.
Sources referenced: Reuters, Bloomberg, Yahoo Finance, MarketWatch, Investing.com
7) Sources
Not available in the provided data.
You may also like: How KGNAI AI ranks instruments across global markets
Disclaimer: KGNAI provides AI-generated analytics and educational market commentary only. This is not financial advice. Markets involve risk. Always do your own research.