
ORBR-USD (Orbler) Technical & Rank Report — 04-Mar-2026 | Bearish Confluence, Mixed Ranks
Orbler (ORBR-USD) enters 04-Mar-2026 with a mixed cross-horizon rank profile but a more consistently bearish technical backdrop. In the 800-instrument crypto universe, the weekly rank sits in the lower tier at #650, while the daily and 3‑monthly ranks (#508 and #516) point to a less extreme but still soft relative position. On-chart structure confirms downside pressure: price is below the MA50 and the MA50 is below the MA200, reinforcing a bearish trend stack. Momentum indicators lean negative as well, with a MACD histogram of -0.0005 and an extremely low RSI(14) reading of 2.308 in the signal set—conditions that can reflect both weakness and late-stage selling intensity. Volatility remains elevated with Bollinger Bandwidth at 0.6366. Key decision zones are defined by support ~0.0251 and resistance ~0.0514, while news sentiment is largely neutral in the provided digest.
- Rank stance (Short/Mid/Long): Short-term Bearish; Mid-term Neutral; Long-term Neutral (weekly rank is the weakest at #650/800).
- Technical confluence label: Bearish (18-signal confluence -0.611; blended technical score -0.420).
- Key levels: Support ~ 0.0251 | Resistance ~ 0.0514.
- News sentiment bias: Neutral (avg 0.050; 81% neutral; 0% negative in provided set).
- Confirmation / invalidation: A close below 0.0251 would align with further deterioration risk; a break above 0.0514 with volume is the defined improvement condition in the scenario view.
KGNAI evaluates assets using large cross-sectional datasets built from millions of structured data points. Inputs incorporate fundamental metrics, technical structures, and systematically processed news sentiment. Statistical models, machine learning, and AI frameworks are used to assess relative positioning, signal alignment, and probabilistic behavior across broad universes.
- Ranks are comparative across the tracked universe, not absolute price targets.
- Confluence reflects alignment among independent signal groups.
- Support/resistance levels are probabilistic decision zones, not guarantees.
- Sentiment provides contextual bias within the broader analytical framework.
1) KGNAI AI Analysis
Region: CRYPTO
Total universe size: 800 ranked instruments
- Daily rank: #508 out of 800 — Neutral
- Weekly rank: #650 out of 800 — Bearish
- Monthly rank: #606 out of 800 — Neutral
- 3-Monthly rank: #516 out of 800 — Neutral
ORBR-USD’s rank curve is asymmetric across horizons: the weekly reading (#650) is materially weaker than the daily (#508) and 3‑monthly (#516) placements. That pattern typically reflects recent relative underperformance within the tracked crypto universe, even as the broader multi-month positioning remains closer to the middle of the distribution.
The spread between weekly and daily ranks also suggests near-term stabilization attempts have not yet been validated by intermediate-horizon behavior. When the weekly rank sits in the lower tier while the daily is less extreme, it can indicate either (a) a bounce that is still fragile, or (b) a sideways phase after a drawdown where other instruments in the universe are improving faster.
The technical ranking overlay reinforces that ORBR-USD is not currently screening as strong on a cross-sectional basis: the AI technical analysis rank is #390 out of 800 with a Neutral label, while the broader confluence later in the report shifts negative. Taken together, the ranks argue for a cautious short-term stance consistent with the stated term view—Short-term Bearish, Mid-term Neutral, Long-term Neutral—where improvement would typically require cleaner technical confirmation rather than rank mean reversion alone.
KGNAI ranks each instrument across large universes using multiple proprietary AI tests and statistical models (millions of data points). Lower ranks generally indicate stronger probability of favorable performance behavior, while higher ranks indicate weaker probability and more bearish positioning.
Term view: Short-term: Bearish. Mid-term: Neutral. Long-term: Neutral.
Want the full universe and complete rank tables? Unlock full access on KGNAI: https://www.kgnai.com/pricing
2) Price & trend overview
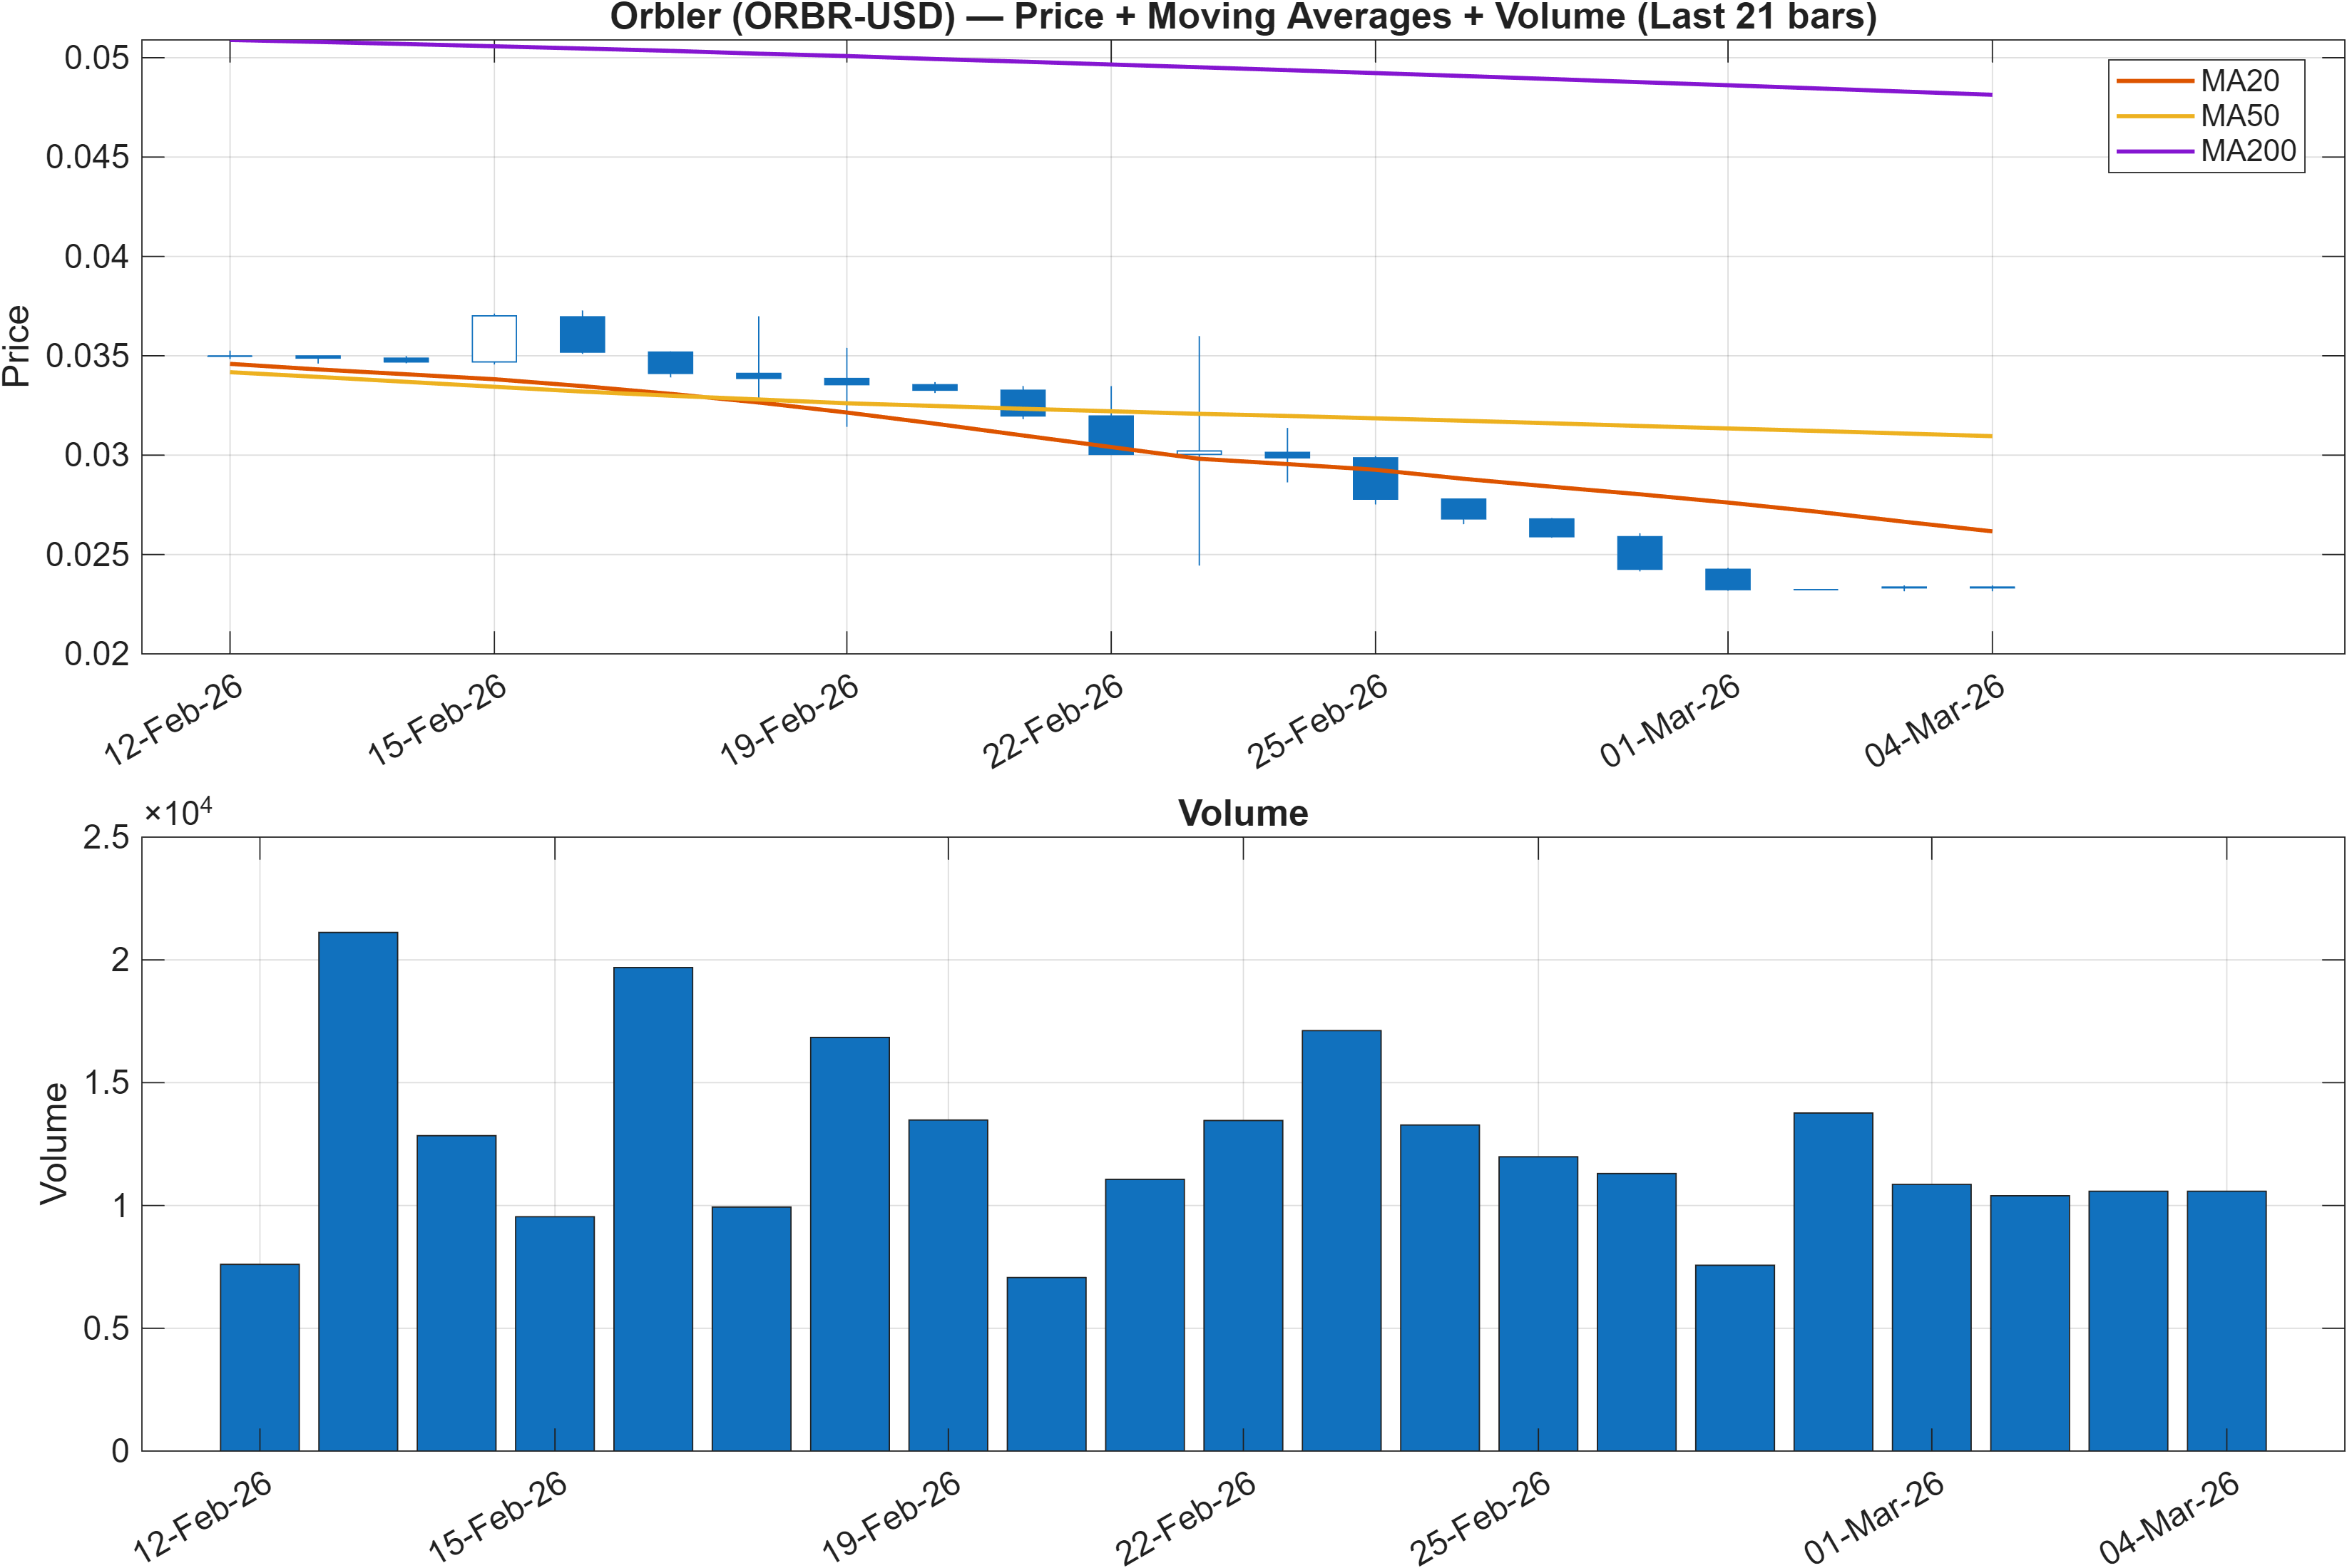
The trend stack is unambiguous in the provided interpretation: Close vs MA50 = Bearish and MA50 vs MA200 = Bearish. This is a classic downtrend alignment where price remains capped by the medium-term average and the medium-term average remains below the long-term trend reference.
For ORBR-USD, that alignment matters because it can keep rebounds mean-reverting rather than trend-forming—particularly if intermediate ranks remain weak (weekly #650). In such regimes, trend traders often look for evidence that price can reclaim the MA50 and hold, while longer-horizon participants typically require the MA50/MA200 relationship to flatten or turn before treating a move as more than a tactical bounce.
The key technical levels later in the report provide a practical framing for trend verification: the resistance band at 0.0514 functions as a nearby “acceptance test” for upside attempts, while support at 0.0251 defines the downside line where bearish continuation risk becomes harder to ignore. With momentum and participation signals also skewed negative elsewhere (e.g., Vol ROC(20) at -49.9 in the signal table), the trend picture is best described as bearish until proven otherwise, with improvements needing to show up simultaneously in price structure and confirmation indicators rather than in one-off spikes.
Interpretation: Close vs MA50 = Bearish, MA50 vs MA200 = Bearish.
3) Momentum & volatility dashboard
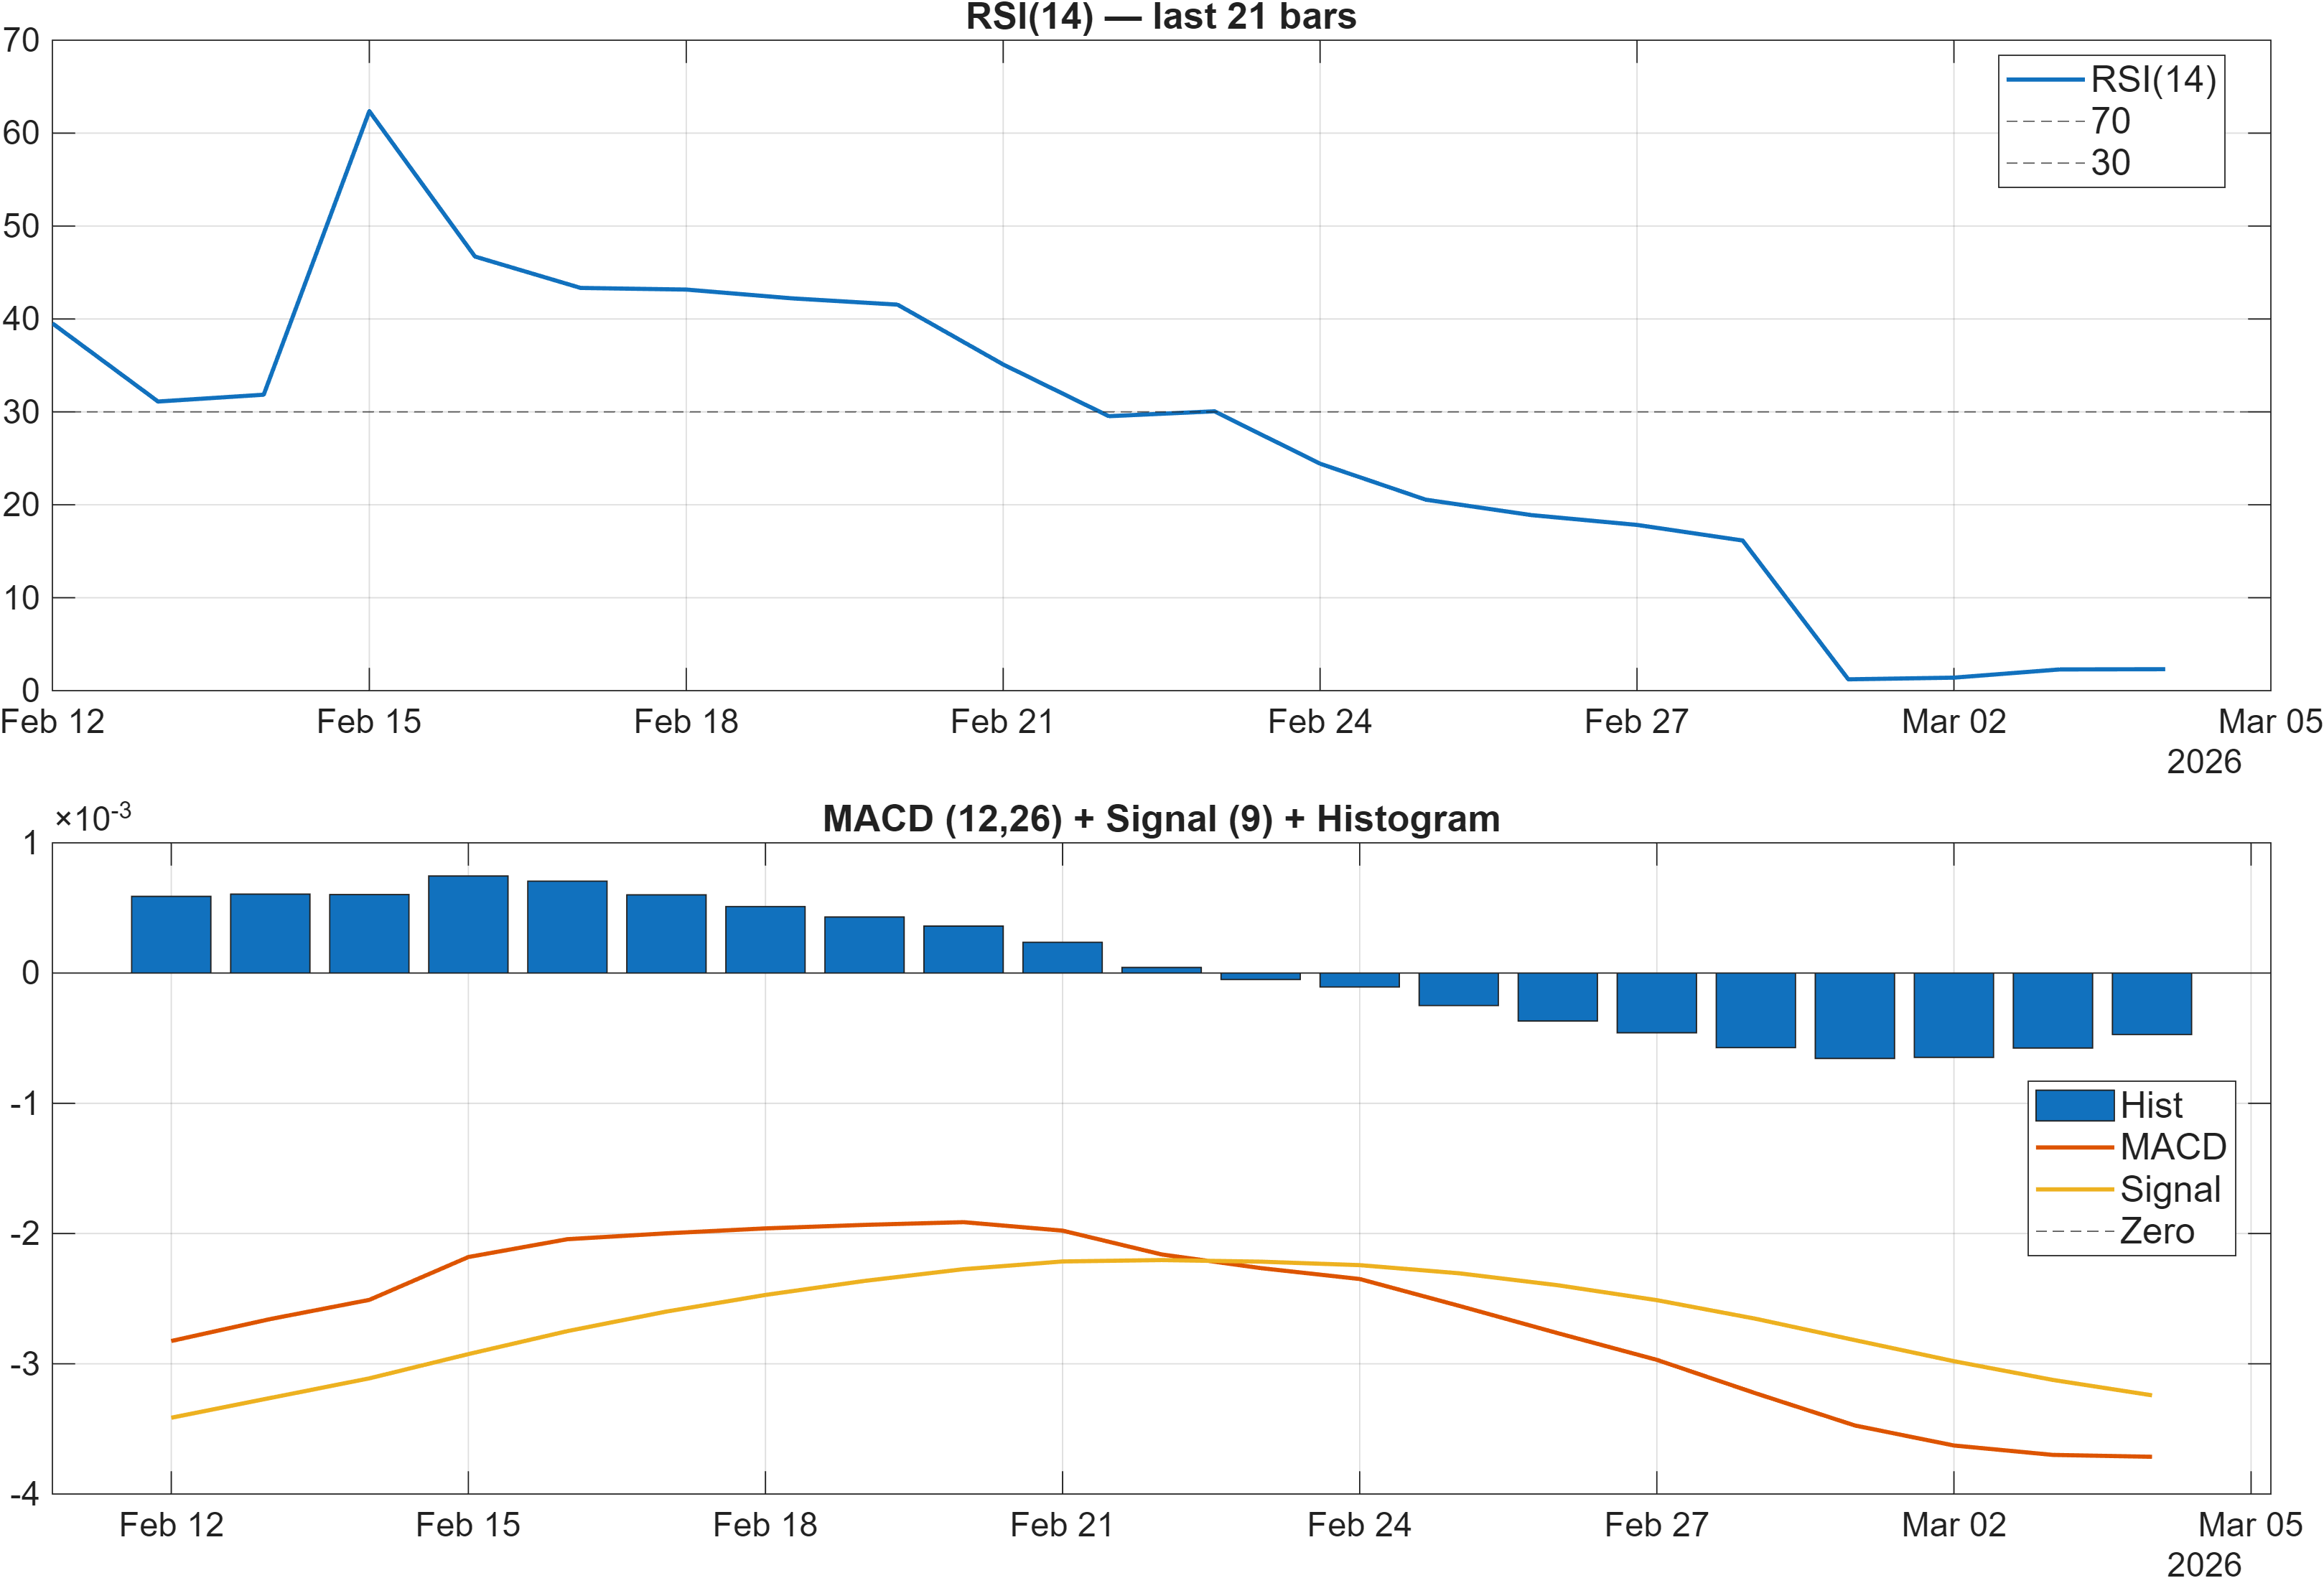
Momentum is tilted toward trend persistence rather than recovery, based on the combined RSI/MACD read. The dashboard notes RSI bias = Bearish, and the MACD histogram is negative at -0.0005, consistent with downside momentum dominance. Within the 18-signal set, the RSI(14) value of 2.308 is exceptionally low—an observation that can be associated with intense selling pressure and, at times, late-stage weakness where short-lived snapbacks are possible but not yet confirmed by trend or breadth.
Volatility is not “quiet” in this setup. Bollinger Bandwidth is 0.6366, and the BB Width signal is marked Neutral, implying that volatility is present but not delivering a clean directional volatility signal on its own. In practice, this combination often shifts the analytical focus from “volatility breakout” to follow-through quality: do negative momentum signals translate into lower lows, or does price begin to compress around support?
One notable divergence inside the signals is that not all participation measures confirm the downside equally: ADOSC at 42.84 is flagged bullish, while multiple volume/flow slopes are bearish (e.g., OBV slope(10) at -4.105e+04). This mixed internal picture can occur when short bursts of accumulation are overwhelmed by broader distribution trends. A cleaner momentum turn would typically require the MACD histogram to stabilize from negative territory while RSI bias improves alongside price reclaiming key reference levels.
Interpretation: RSI bias = Bearish, MACD hist = -0.0005.
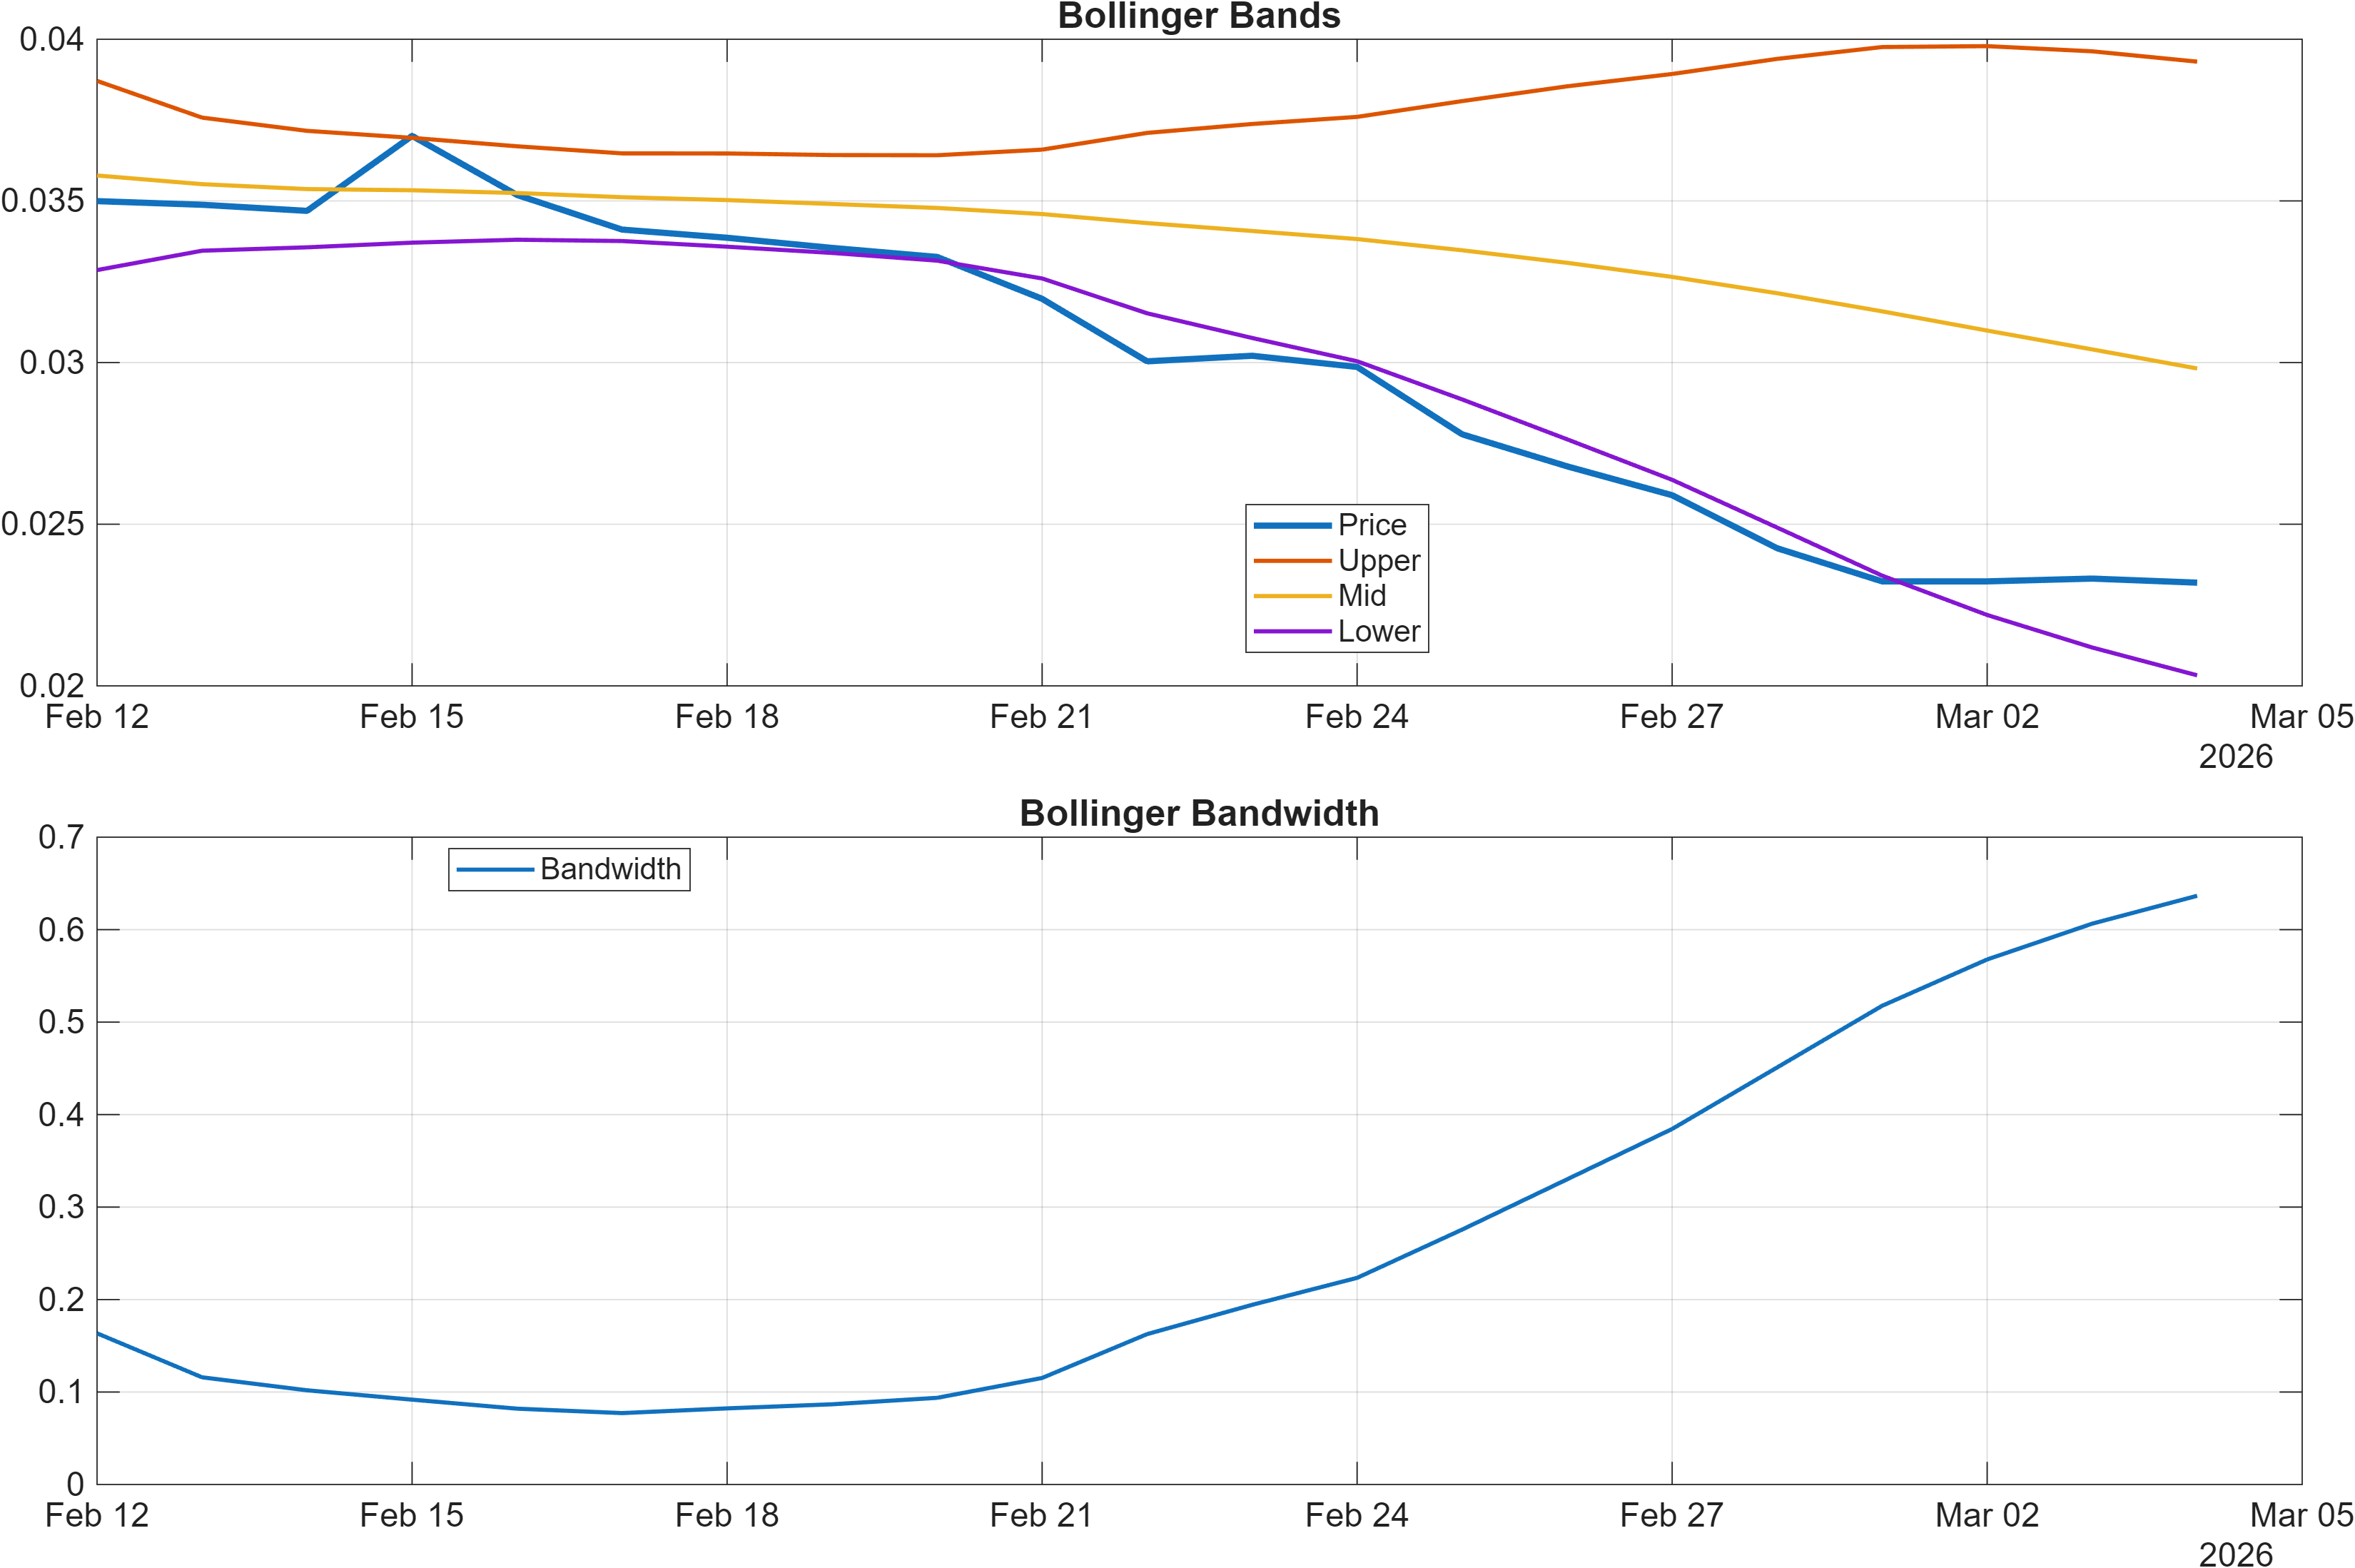
Interpretation: Bandwidth (volatility regime) latest = 0.6366.
4) Support / Resistance zones
Support ~ 0.0251 | Resistance ~ 0.0514
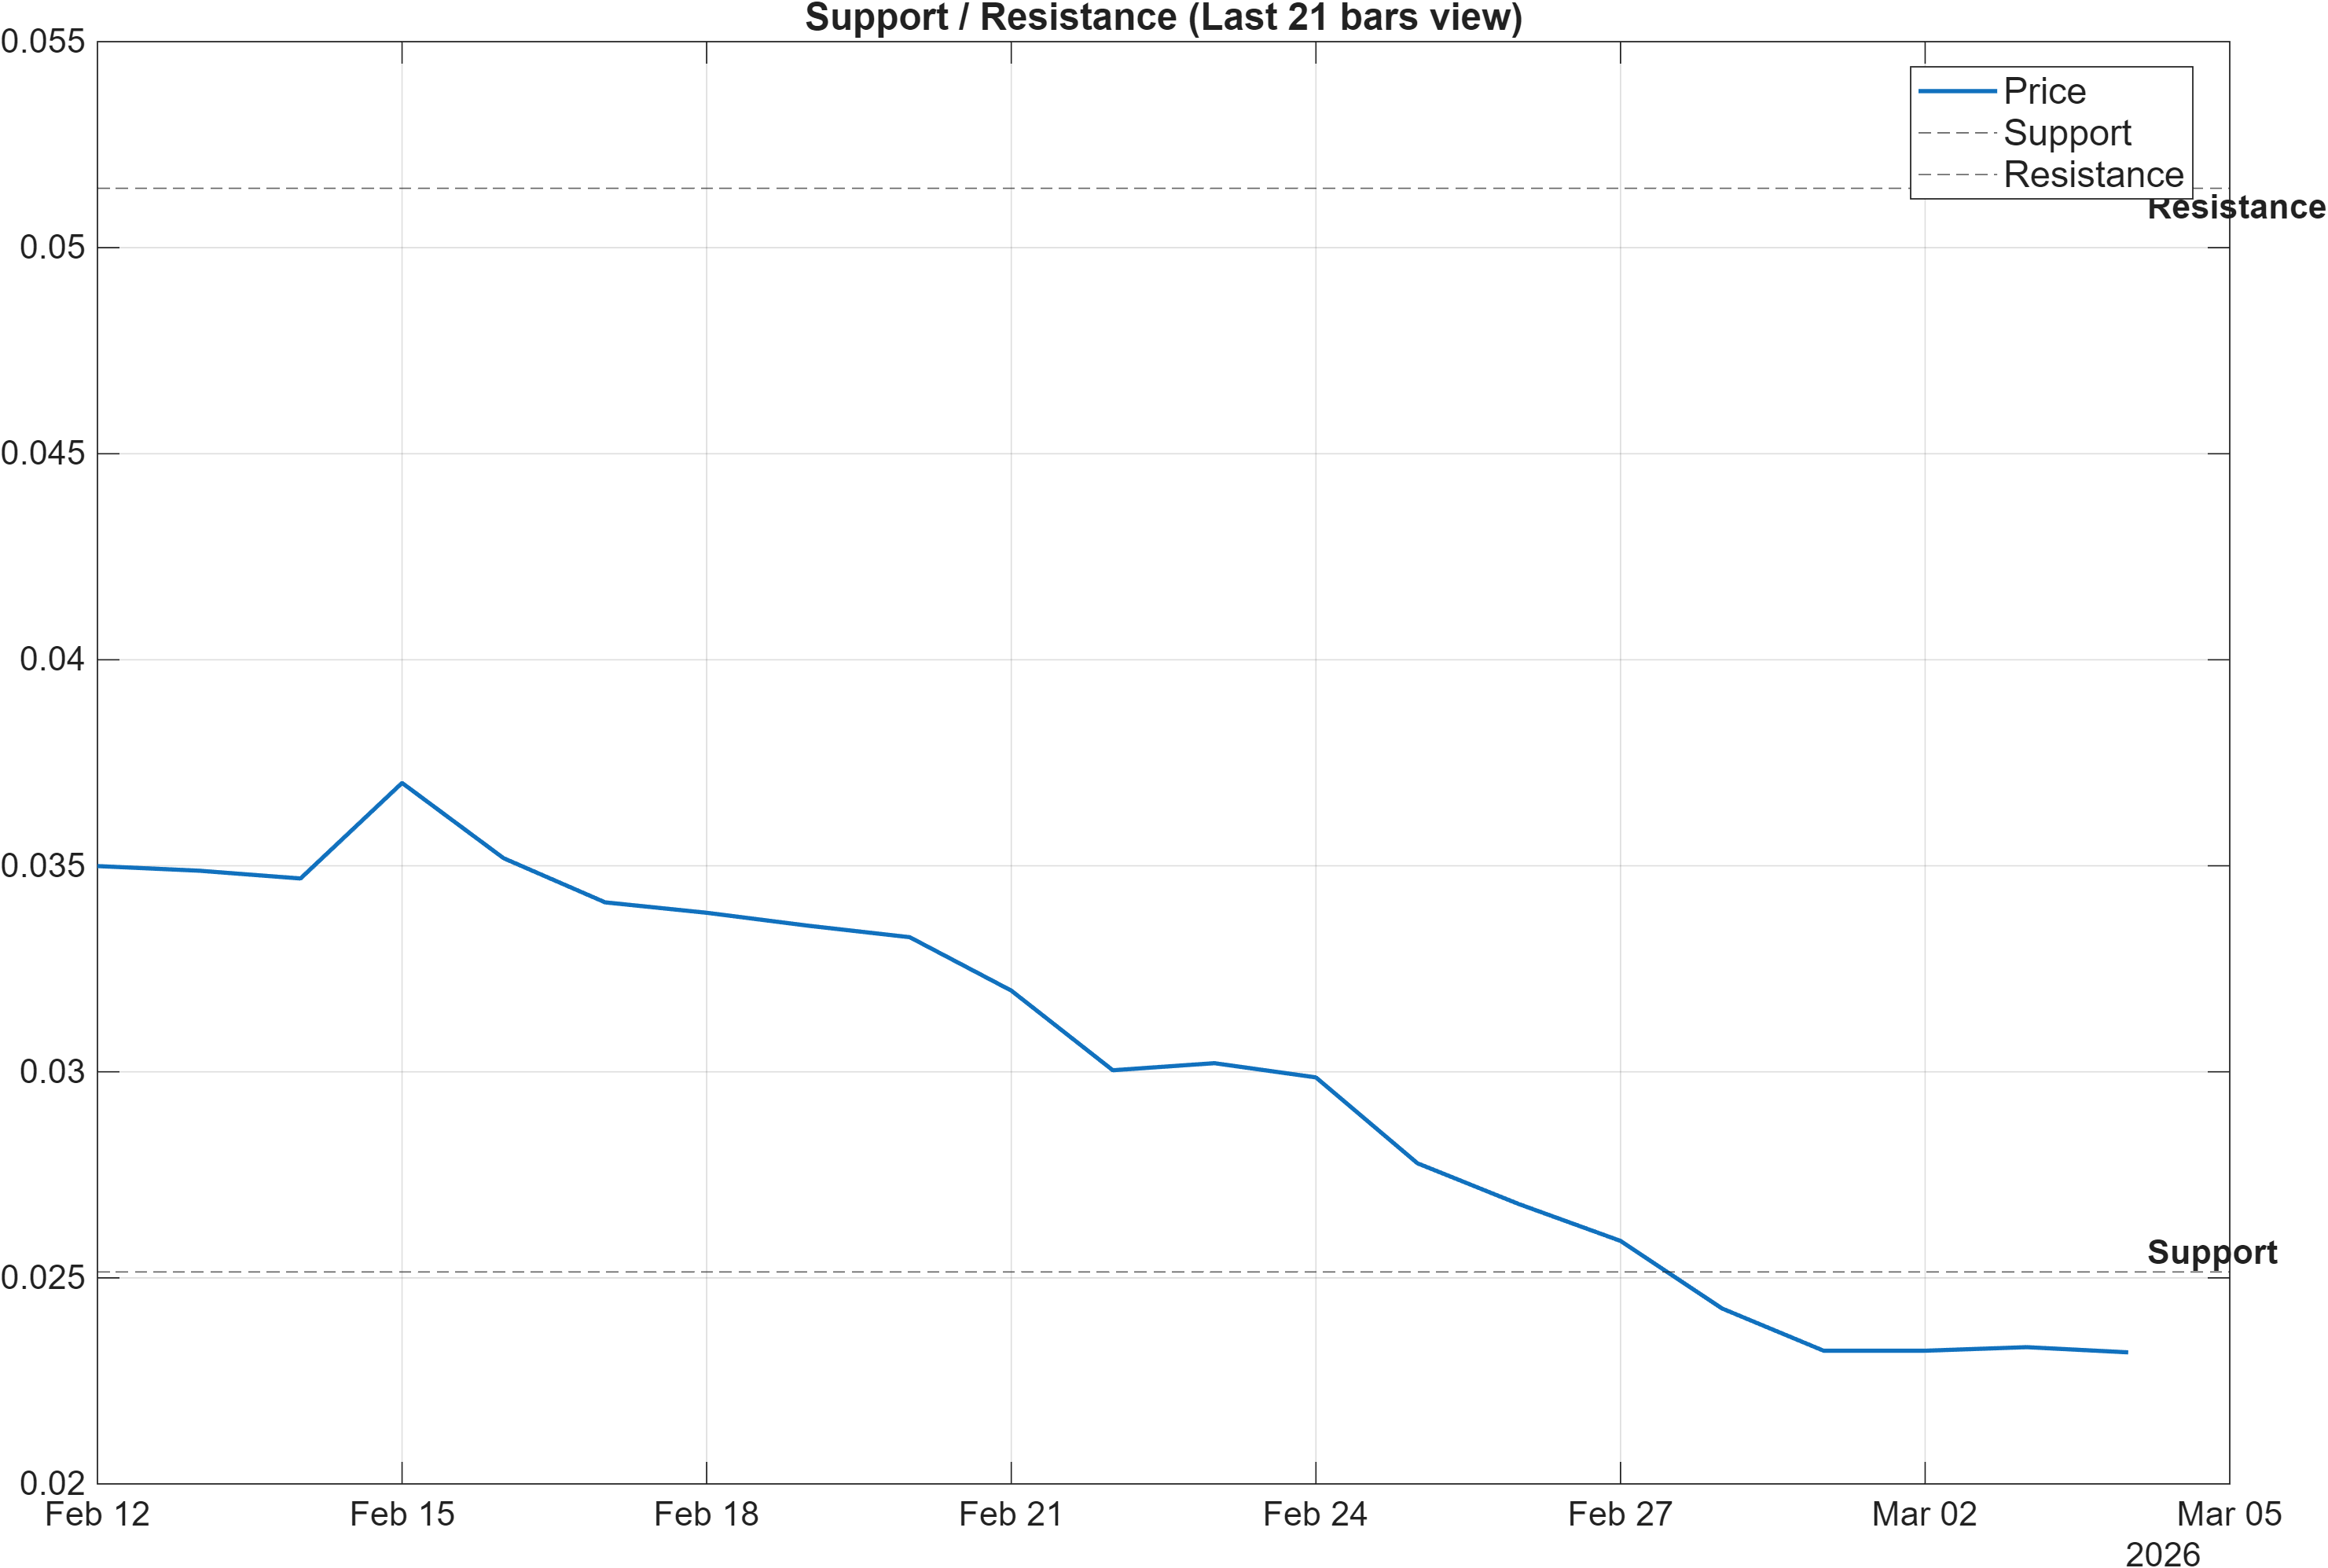
ORBR-USD is framed by a wide decision corridor: 0.0251 as support and 0.0514 as resistance. This spacing matters because it can produce two distinct regimes: (1) range repair where price oscillates within the band while indicators normalize, or (2) directional continuation if either boundary is resolved with follow-through.
Given the bearish moving-average stack (close below MA50; MA50 below MA200) and negative momentum (MACD histogram -0.0005), the level that tends to carry the higher informational value is support. A close below 0.0251 would align the level structure with the prevailing momentum/trend signals, increasing the likelihood that volatility (Bandwidth 0.6366) expresses as downside expansion rather than benign churn.
Conversely, upside work is defined more by acceptance above resistance than by intraday probes. The scenario view specifies that a break above 0.0514 with volume would indicate continuation—effectively requiring participation to corroborate price. That requirement is particularly relevant because several participation proxies in the signal table are bearish (e.g., Vol ROC(20) -49.9, PVT slope(10) -2836), implying that rallies may struggle without improved volume dynamics. Until one of these boundaries resolves, the most defensible interpretation is that levels serve as risk-defined checkpoints rather than directional forecasts.
Scenario view: Break above resistance with volume → continuation. Close below support → signal deterioration risk.
5) Quant Technical Dashboard (18 Signals)
KGNAI AI Technical Analysis Score (Deep Reinforcement Learning): Rank #390 out of 800 (Rank 1 represents the strongest technical positioning and a higher probability of favorable price behavior. As ranks increase toward the maximum, the probability of favorable outcomes weakens and bearish positioning becomes more dominant.) | Label: Neutral | Score: 0.025
18-Signal Technical Confluence Score: -0.611 (Bearish)
Overall Technical Score (18-signal confluence + DRL rank blend): -0.420 (Bearish)
Note: The blended score reflects signal strength weighted against broader AI technical ranking, which may temporarily diverge.
Blended technical score breakdown: -0.420 (Bearish | Bull 2 / Bear 13 / Neutral 3)
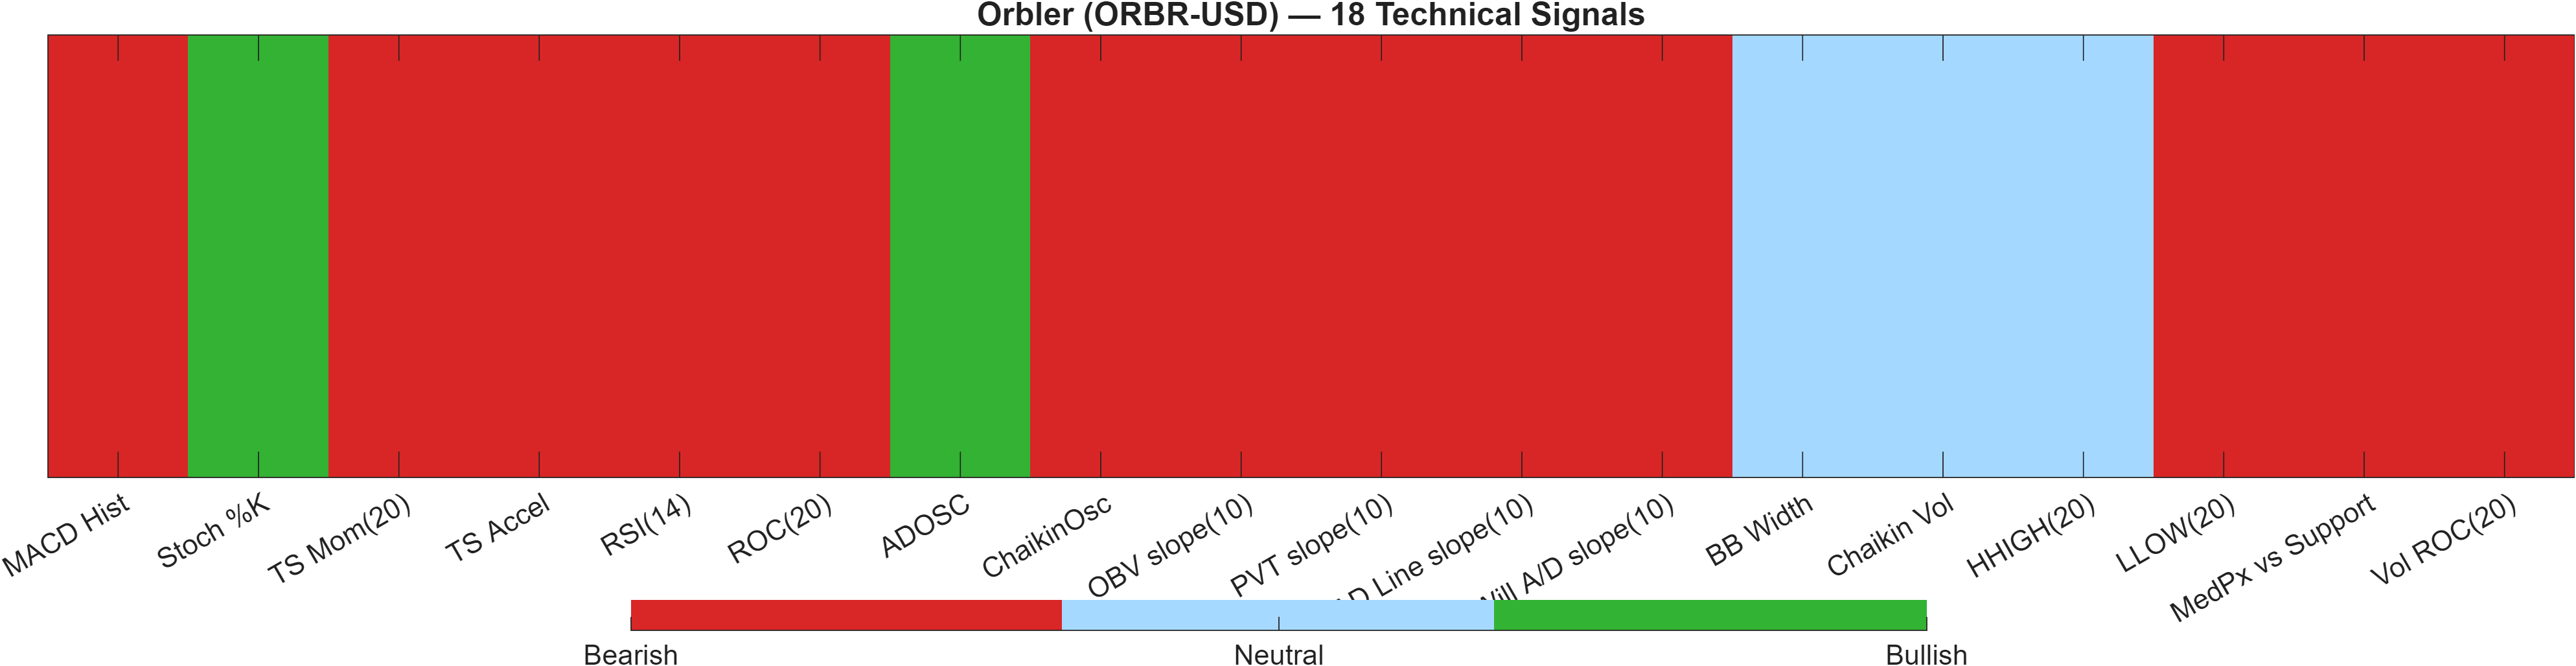
The dashboard is defined by a bearish majority across independent indicators: the 18-signal confluence prints -0.611 and the blended overall technical score remains bearish at -0.420, with the breakdown showing Bear 13 against Bull 2. This is a broad-based signal set rather than a single-indicator warning, which tends to reduce the chance that one “fix” (e.g., a short-term oscillator bounce) meaningfully changes the regime.
The DRL technical rank is #390/800 with a Neutral label and score 0.025, creating a useful tension: cross-sectional AI technical positioning is not among the very worst, yet the multi-signal confluence is decisively bearish. In market-structure terms, this can occur when the instrument is weak, but weakness is not uniquely concentrated versus peers—or when certain features (like isolated accumulation bursts) partially offset otherwise negative momentum/participation.
Several indicators help explain the confluence tilt without needing to enumerate the full table: momentum is negative (e.g., MACD Hist -0.000472, ROC(20) -33.51), and participation slopes largely point down (e.g., OBV slope(10) -4.105e+04). Meanwhile, the few non-bearish elements—such as Stoch %K at 1.321 (bullish) and ADOSC at 42.84 (bullish)—look more like localized counter-signals than a dominant reversal complex. As long as the blend remains below zero and the bearish count remains lopsided, the technical dashboard supports a defensive interpretation.
Signal table (Bull/Bear/Neutral)
| Indicator | Value | Signal |
|---|---|---|
| MACD Hist | -0.000472 | Bearish |
| Stoch %K | 1.321 | Bullish |
| TS Mom(20) | -0.01156 | Bearish |
| TS Accel | -0.008705 | Bearish |
| RSI(14) | 2.308 | Bearish |
| ROC(20) | -33.51 | Bearish |
| ADOSC | 42.84 | Bullish |
| ChaikinOsc | -1.894e+04 | Bearish |
| OBV slope(10) | -4.105e+04 | Bearish |
| PVT slope(10) | -2836 | Bearish |
| AD Line slope(10) | -4.333e+04 | Bearish |
| Will A/D slope(10) | -0.002605 | Bearish |
| BB Width | 0.6366 | Neutral |
| Chaikin Vol | -64.93 | Neutral |
| HHIGH(20) | 0.03728 | Neutral |
| LLOW(20) | 0.02315 | Bearish |
| MedPx vs Support | -0.001846 | Bearish |
| Vol ROC(20) | -49.9 | Bearish |
Interpretation: Indicator-level signals form the base confluence, which is then adjusted using a separate AI-driven technical ranking model. The final technical score summarizes this combined view.
6) News sentiment + extractive gist
Note: Instrument-specific news matches were not found, so the digest includes broader market/sector headlines. Links are provided for verification.
Sentiment score (avg): 0.050 | Positive: 19% | Neutral: 81% | Negative: 0%
KGNAI AI News Sentiment Score (normalized -1 to +1): Not available (as of —) | Label: Not available | Overall news score: 0.05
Positive Developments
Recent coverage across major financial outlets indicates ongoing institutional and infrastructure-oriented activity across the crypto ecosystem, including continued development of payments and custody tooling aimed at banks and fintechs. That type of backdrop is typically constructive for sector participation even when individual tokens face weak technical setups. Separately, network-usage narratives around major chains have remained active, which can support longer-term engagement and liquidity depth. For ORBR-USD specifically, this matters mainly as a contextual offset: a neutral-to-constructive sector tape can reduce the probability that weakness is purely idiosyncratic, but it does not override the report’s bearish technical confluence (-0.611) or the bearish trend stack (close below MA50; MA50 below MA200). Net, the positive flow is best treated as background support rather than a direct catalyst in the provided data.
Neutral / Mixed Developments
The digest is dominated by broadly informational market updates and policy/election-related discussions, which often translate into headline sensitivity without immediate directional persistence. With the sentiment mix heavily neutral (81%) and the average score modestly positive at 0.050, the news layer reads more like a “temperature check” than a driver. For ORBR-USD, this neutral skew aligns with the rank profile that is mixed rather than uniformly bearish (daily #508 and 3‑monthly #516 are not at the extreme tail), suggesting the market may be waiting on clearer confirmation from price and liquidity rather than reacting to a single narrative stream.
Negative / Risk Signals
Risk framing in the broader crypto tape remains present, particularly around macro-linked risk appetite, regulatory developments, and episodic geopolitical or cross-asset shocks that can tighten liquidity conditions. Even if the provided sentiment set shows 0% negative classification, the technical state of ORBR-USD implies it may be more exposed to adverse tape conditions: the weekly rank at #650, negative momentum (MACD histogram -0.0005), and weak participation proxies (e.g., Vol ROC(20) -49.9) can amplify downside responses when volatility rises. In this context, the key risk is less “news negativity” and more news-driven volatility interacting with an already bearish technical baseline near defined support (0.0251).
- Whether price action holds above 0.0251 on any volatility expansion (Bandwidth 0.6366).
- Signs of participation repair (e.g., improvement from Vol ROC(20) -49.9) alongside any attempt to reclaim trend references.
- Any shift in the rank curve where weekly rank (#650) begins to converge toward the daily/3‑monthly region.
Sources referenced: Reuters, Bloomberg, Yahoo Finance, MarketWatch, Investing.com
7) Sources
Not available in the provided data.
You may also like: How KGNAI AI ranks instruments across global markets
Disclaimer: KGNAI provides AI-generated analytics and educational market commentary only. This is not financial advice. Markets involve risk. Always do your own research.