
RSETH-USD (Kelp DAO Restaked ETH) — 06-Mar-2026 Technicals Point to Consolidation With Mixed Horizon Ranks
RSETH-USD (Kelp DAO Restaked ETH) currently presents a near-term constructive profile while longer-horizon positioning remains more reserved. Within KGNAI’s 800-instrument CRYPTO universe, the weekly rank (#7) indicates upper-quartile strength, supported by a bullish 18-signal confluence score (0.389). At the same time, the monthly rank (#491) and the overall blended technical score (0.279, Neutral) frame the move as potentially transitional rather than a clean trend continuation. Momentum indicators show incremental upside bias (e.g., RSI(14) 57.37; MACD histogram 50.7068), while volatility appears comparatively contained (Bollinger bandwidth 0.1411), a condition that often increases sensitivity to level breaks. Key decision zones are defined by support ~2007.4214 and resistance ~3510.7144, where confirmation from participation/volume becomes central.
Key Takeaways
- Rank stance: Short-term Bullish (Daily #51); Mid-term Neutral (Monthly #491); Long-term Neutral (3-Monthly not available).
- Technical confluence: 18-signal score 0.389 Bullish, but blended score 0.279 Neutral.
- Key levels: Support ~ 2007.4214 | Resistance ~ 3510.7144.
- News sentiment bias: Neutral (avg sentiment 0.013; Neutral 81%).
- Confirmation / invalidation: A break above 3510.7144 with volume improves continuation odds; a close below 2007.4214 increases deterioration risk.
What KGNAI Measures
KGNAI evaluates assets using large cross-sectional datasets built from millions of structured data points. Inputs incorporate fundamental metrics, technical structures, and systematically processed news sentiment. Statistical models, machine learning, and AI frameworks are used to assess relative positioning, signal alignment, and probabilistic behavior across broad universes.
How to Read This Report
- Ranks are comparative across the tracked universe, not absolute price targets.
- Confluence reflects alignment among independent signal groups.
- Support/resistance levels are probabilistic decision zones, not guarantees.
- Sentiment provides contextual bias within the broader analytical framework.
1) KGNAI AI Analysis
Region: CRYPTO
Total universe size: 800 ranked instruments
- Daily rank: #51 out of 800 — Bullish
- Weekly rank: #7 out of 800 — Bullish
- Monthly rank: #491 out of 800 — Neutral
- 3-Monthly rank: Not available for this horizon — Not available
The rank stack is directionally split in a way that often appears during regime handoffs: strong short-horizon behavior alongside less committed longer-horizon positioning. The weekly rank (#7) places RSETH-USD in the top decile of the 800-instrument universe, consistent with near-term demand persistence. The daily rank (#51) reinforces that strength without suggesting an overly crowded extreme.
The counterweight is the monthly rank (#491), which sits in the lower half of the universe and keeps the medium-term profile categorized as Neutral. This divergence matters because it implies the recent advance has not yet translated into broader-horizon statistical dominance. In practical market-structure terms, short-cycle flows can lift the tape, but trend sustainability typically improves when multiple horizons align.
The missing 3-monthly rank is Not available in the provided data. That absence limits long-horizon validation, increasing the importance of observable confirmation through technical structure and participation indicators. Overall, the most defensible interpretation is a tactical bullish posture with a strategic neutrality bias: the asset screens well versus peers on the weekly horizon, but the medium-term ranking suggests the move may still be proving itself.
KGNAI ranks each instrument across large universes using multiple proprietary AI tests and statistical models (millions of data points). Lower ranks generally indicate stronger probability of favorable performance behavior, while higher ranks indicate weaker probability and more bearish positioning.
Term view: Short-term: Bullish. Mid-term: Neutral. Long-term: Neutral.
2) Price & trend overview
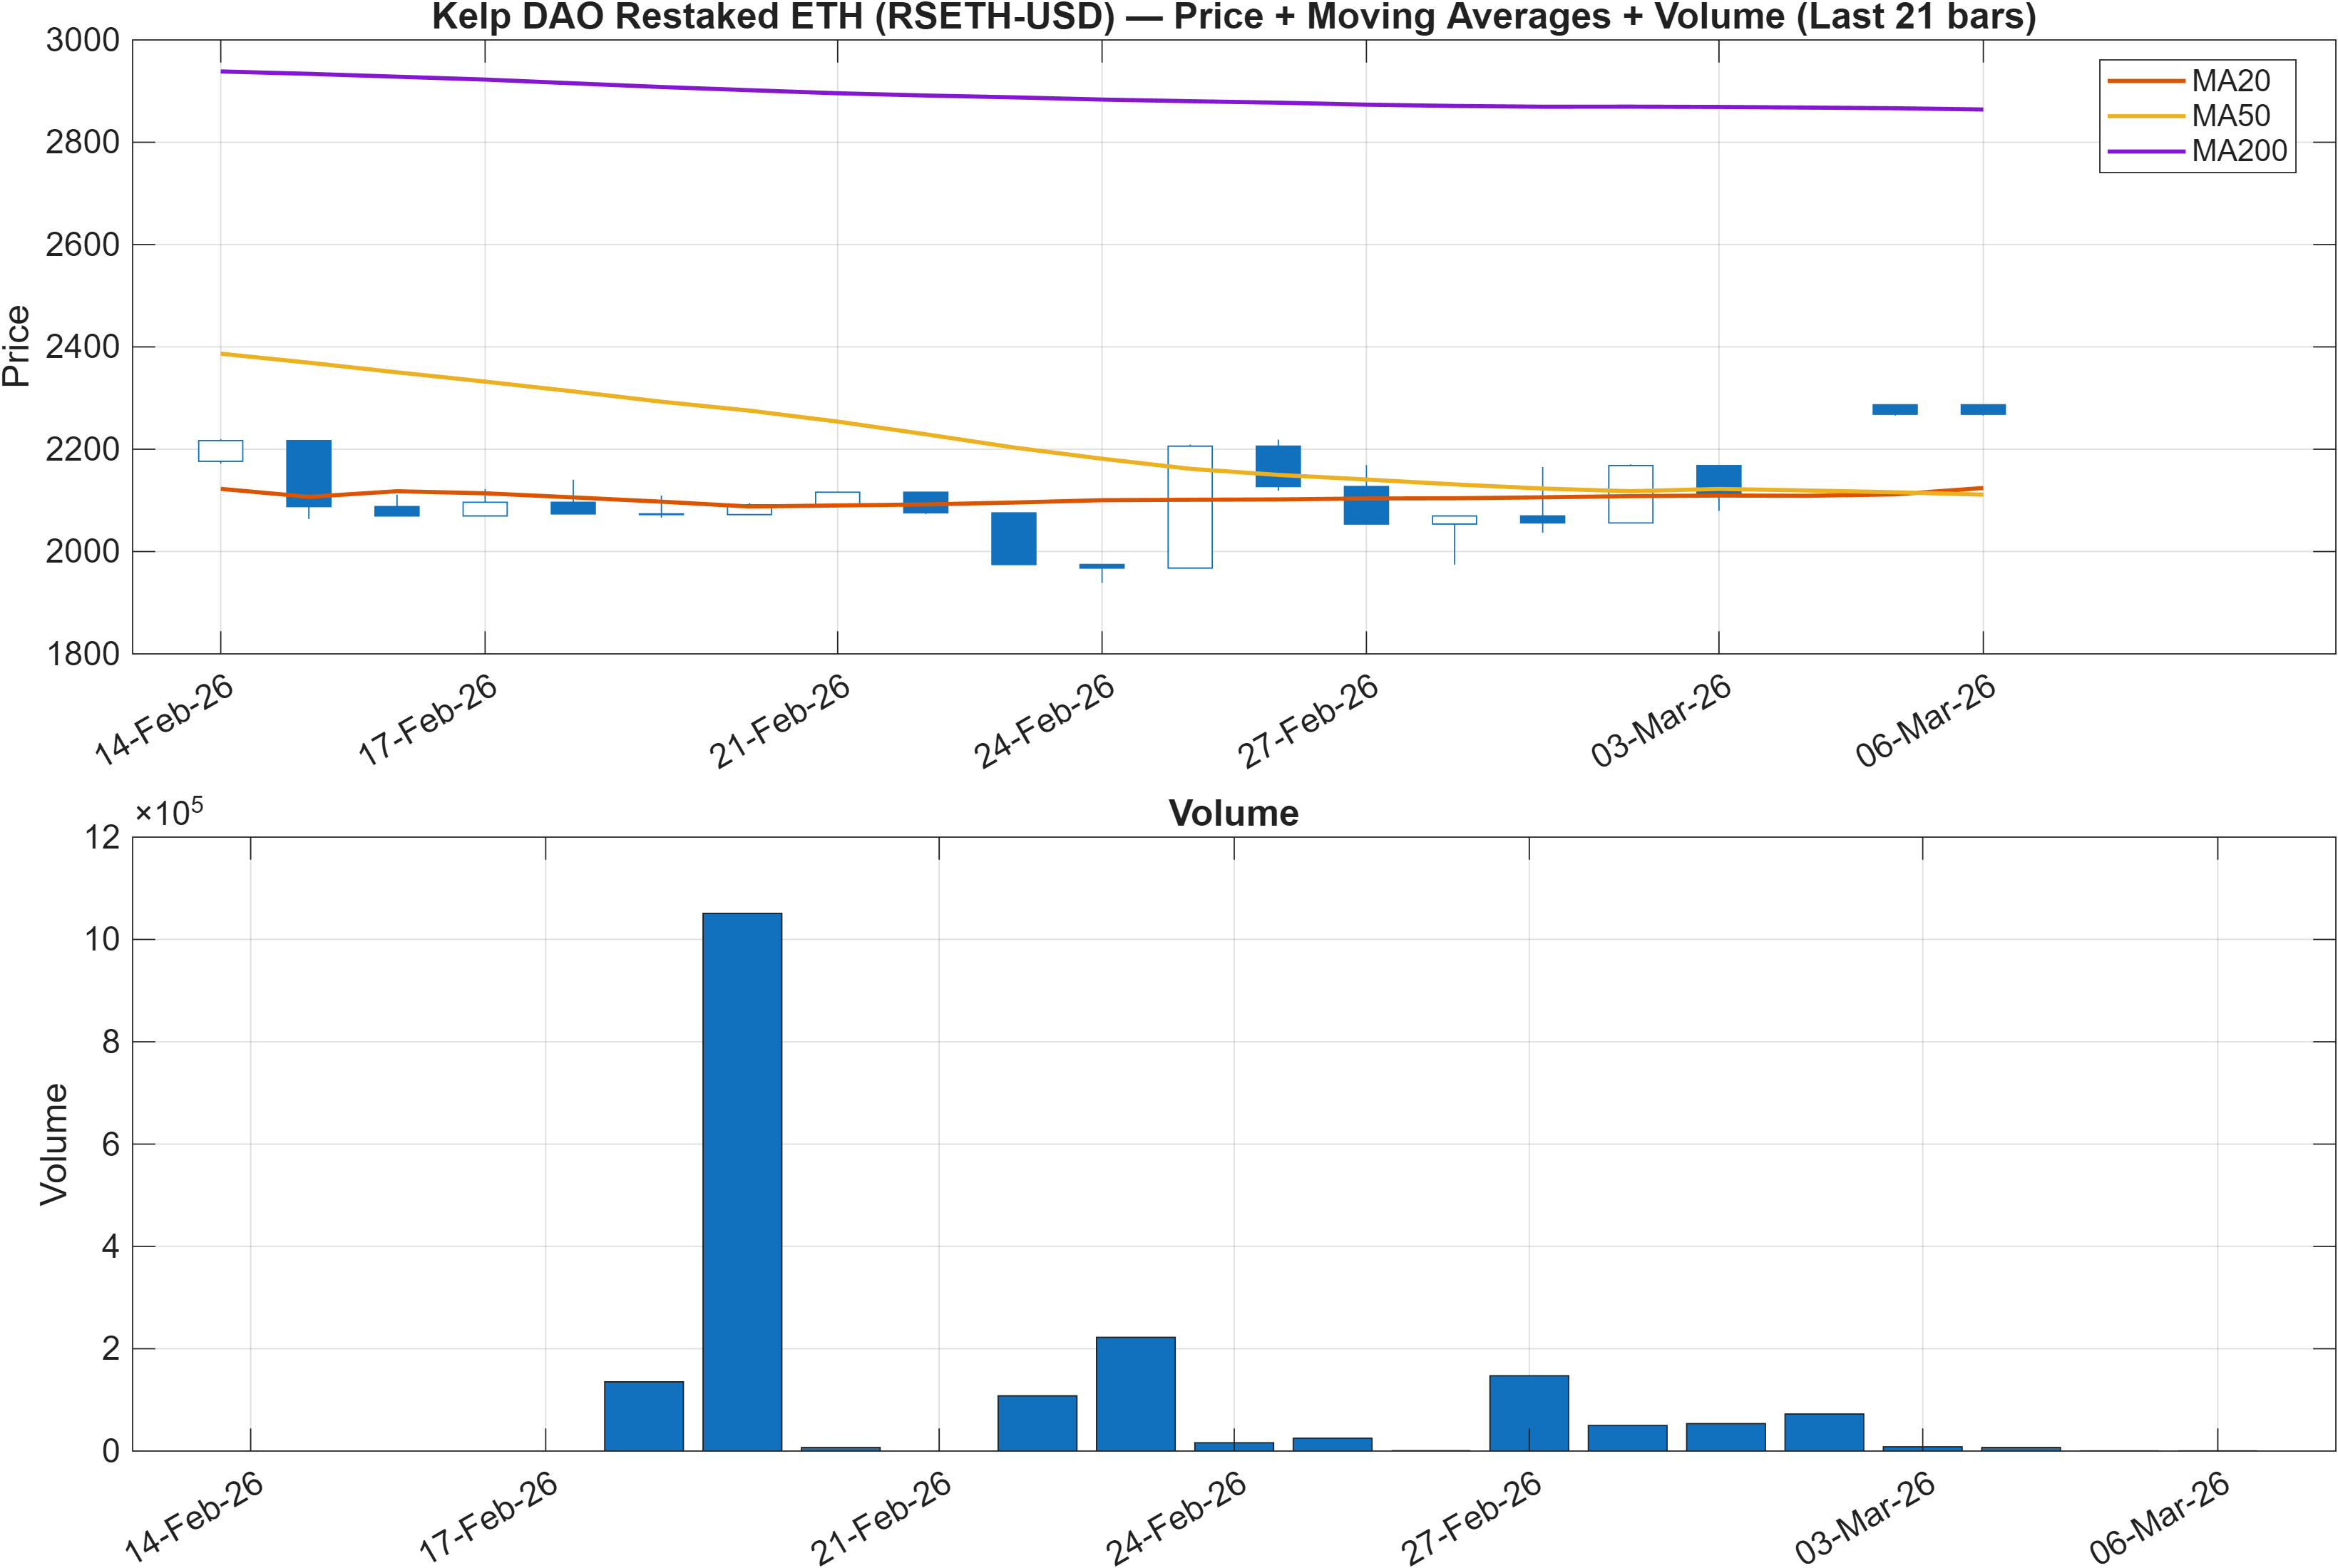
Interpretation: Close vs MA50 = Bullish, MA50 vs MA200 = Bearish.
The trend picture is best described as short-term strength inside a longer-term repair phase. Price closing above the MA50 is a classic “tactical” trend-positive condition, typically consistent with improving risk appetite and buyers defending pullbacks. However, the MA50 remaining below the MA200 keeps the broader structure in a bearish moving-average stack, a configuration that often persists until an extended period of constructive price action forces longer-term averages to turn.
This split aligns with the rank divergence: the weekly rank (#7) indicates strong recent behavior versus peers, while the monthly rank (#491) signals that the larger sample still views the market as mixed. When these conditions coexist, continuation can still occur, but it tends to be more sensitive to failed retests and to any deceleration in participation.
From a market-structure perspective, this setup commonly produces two tradable narratives: (1) a continuation attempt that needs repeated closes above the MA50 while volatility remains controlled, or (2) a mean-reversion slide that typically shows up first as weakening breadth/volume metrics before price breaks decisively. With the next major decision zones defined at support ~2007.4214 and resistance ~3510.7144, trend validity is less about forecasting and more about how price behaves as it approaches and interacts with these boundaries.
Volume context is also relevant because participation-backed advances tend to withstand consolidation better than low-participation lifts. In later sections, the signal set includes both constructive and cautionary volume/breadth reads, which is consistent with a market that is trending short-term but still negotiating longer-term acceptance.
3) Momentum & volatility dashboard
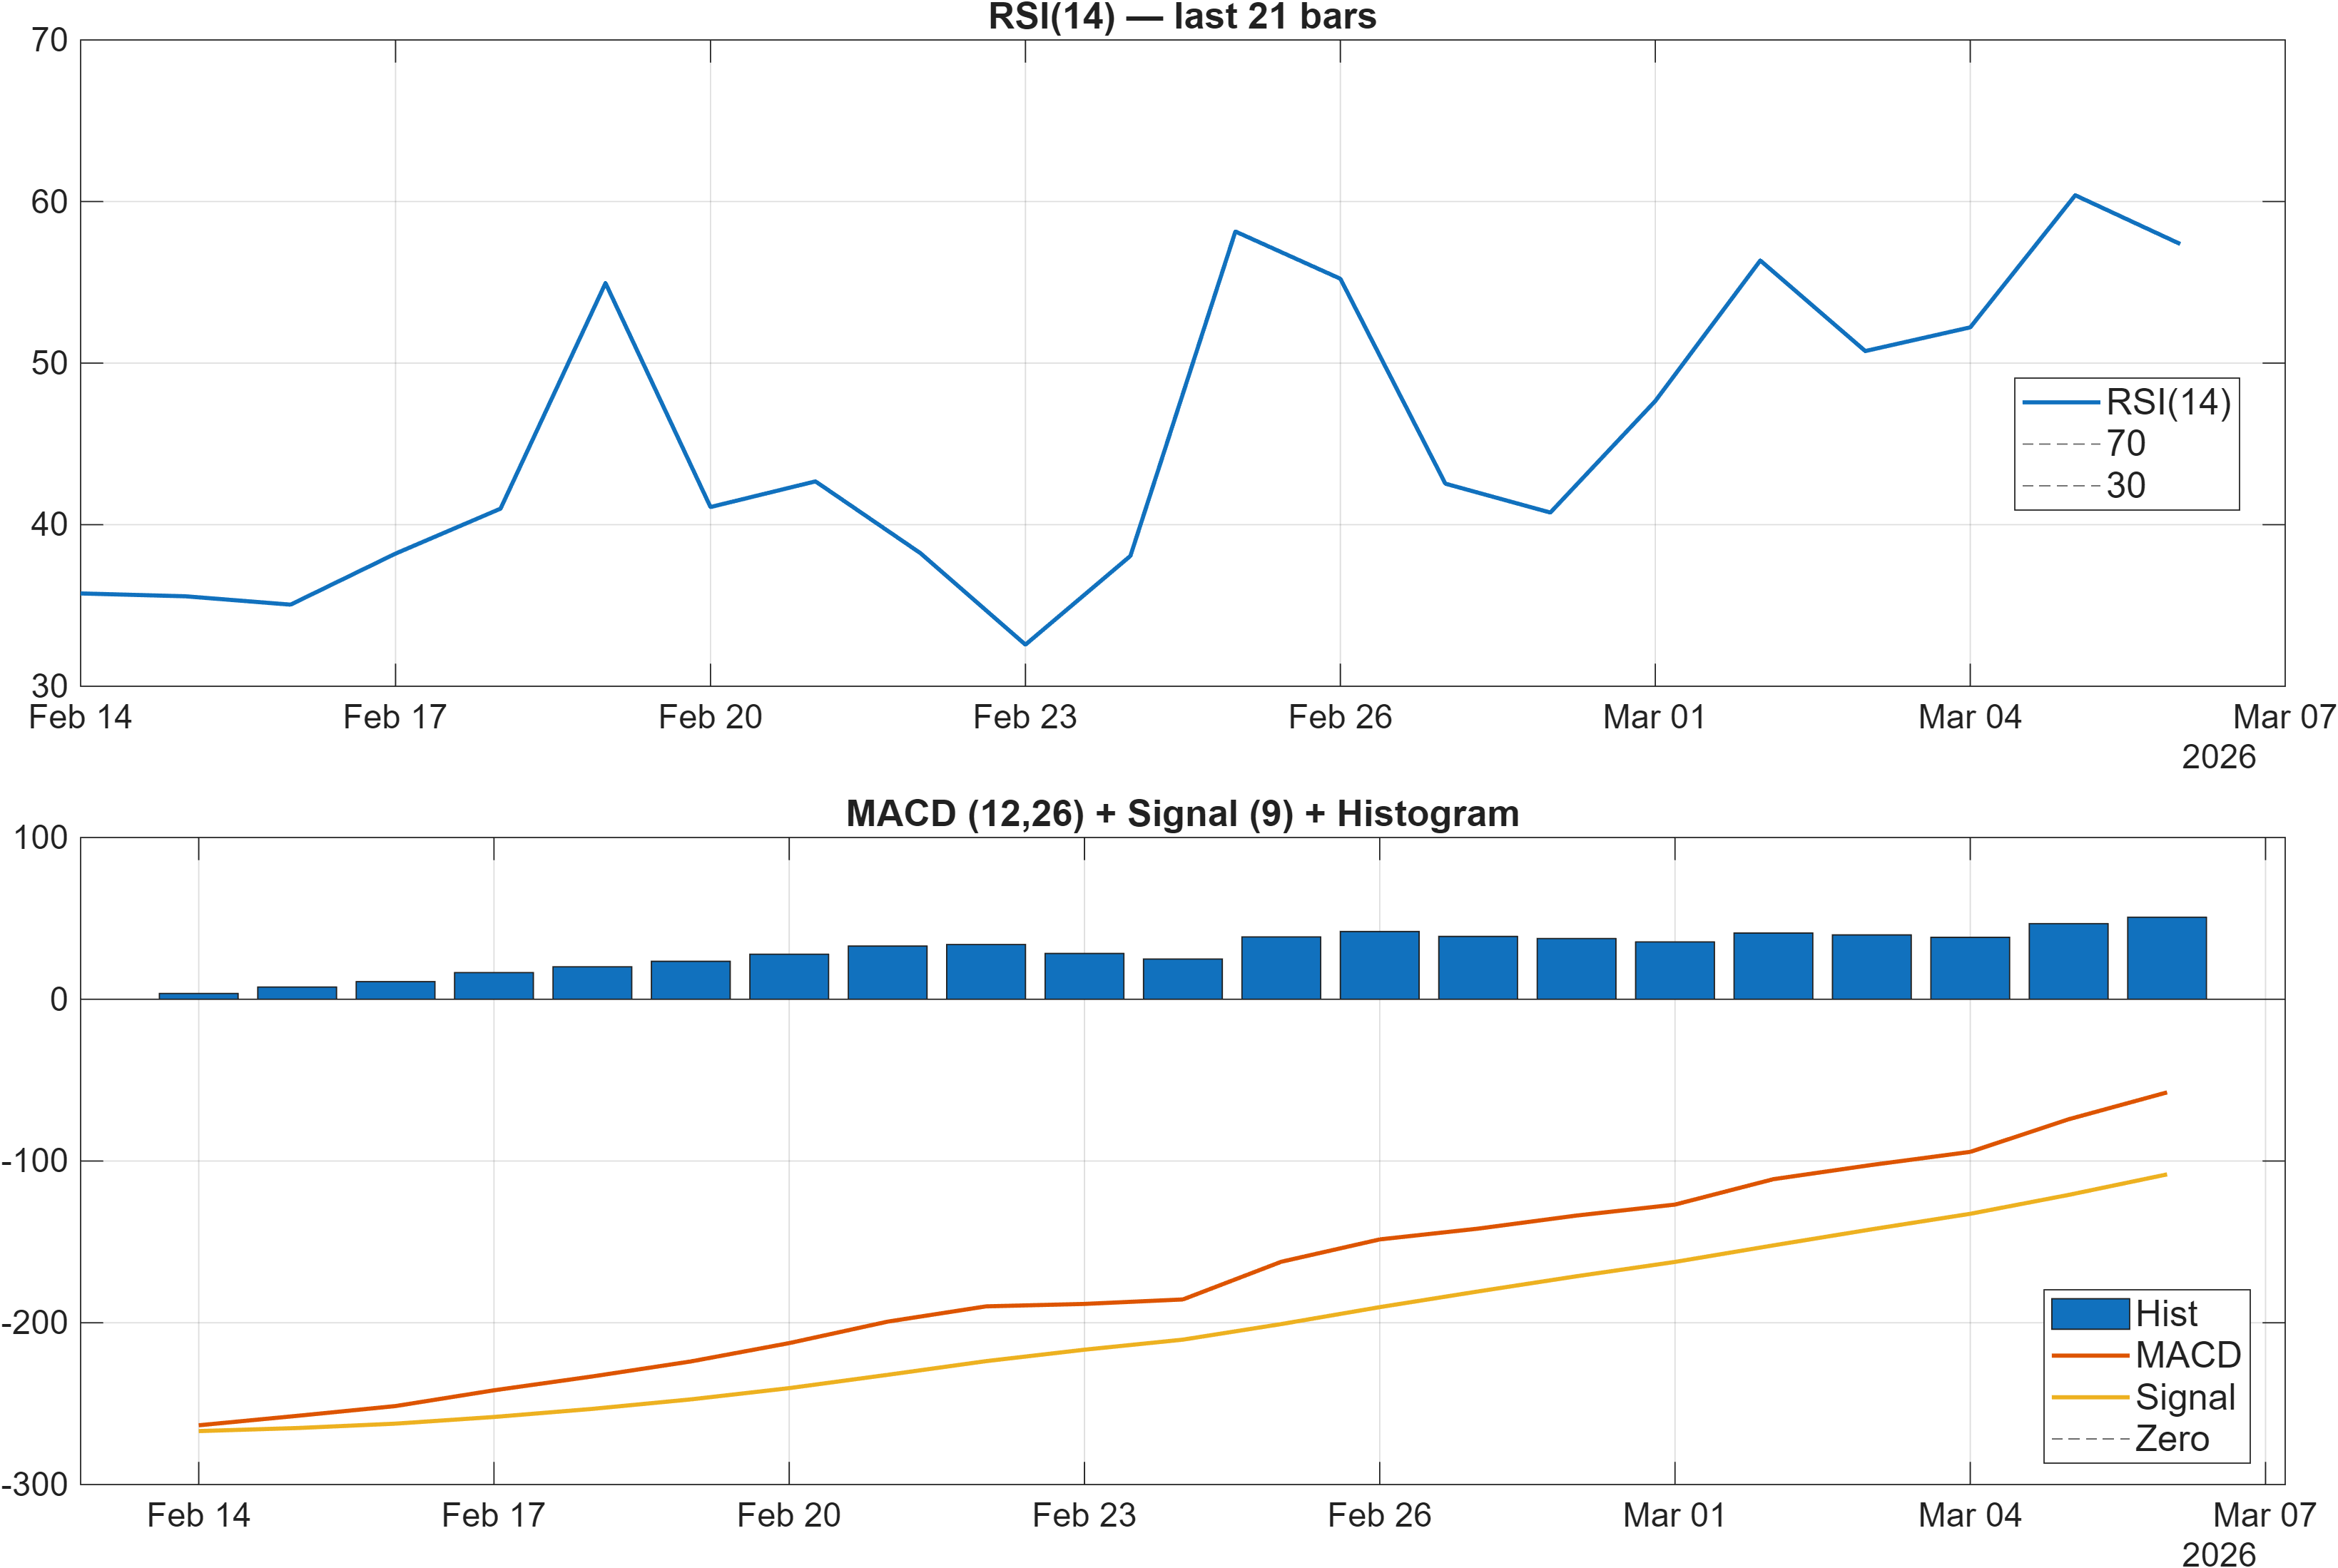
Interpretation: RSI bias = Neutral, MACD hist = 50.7068.
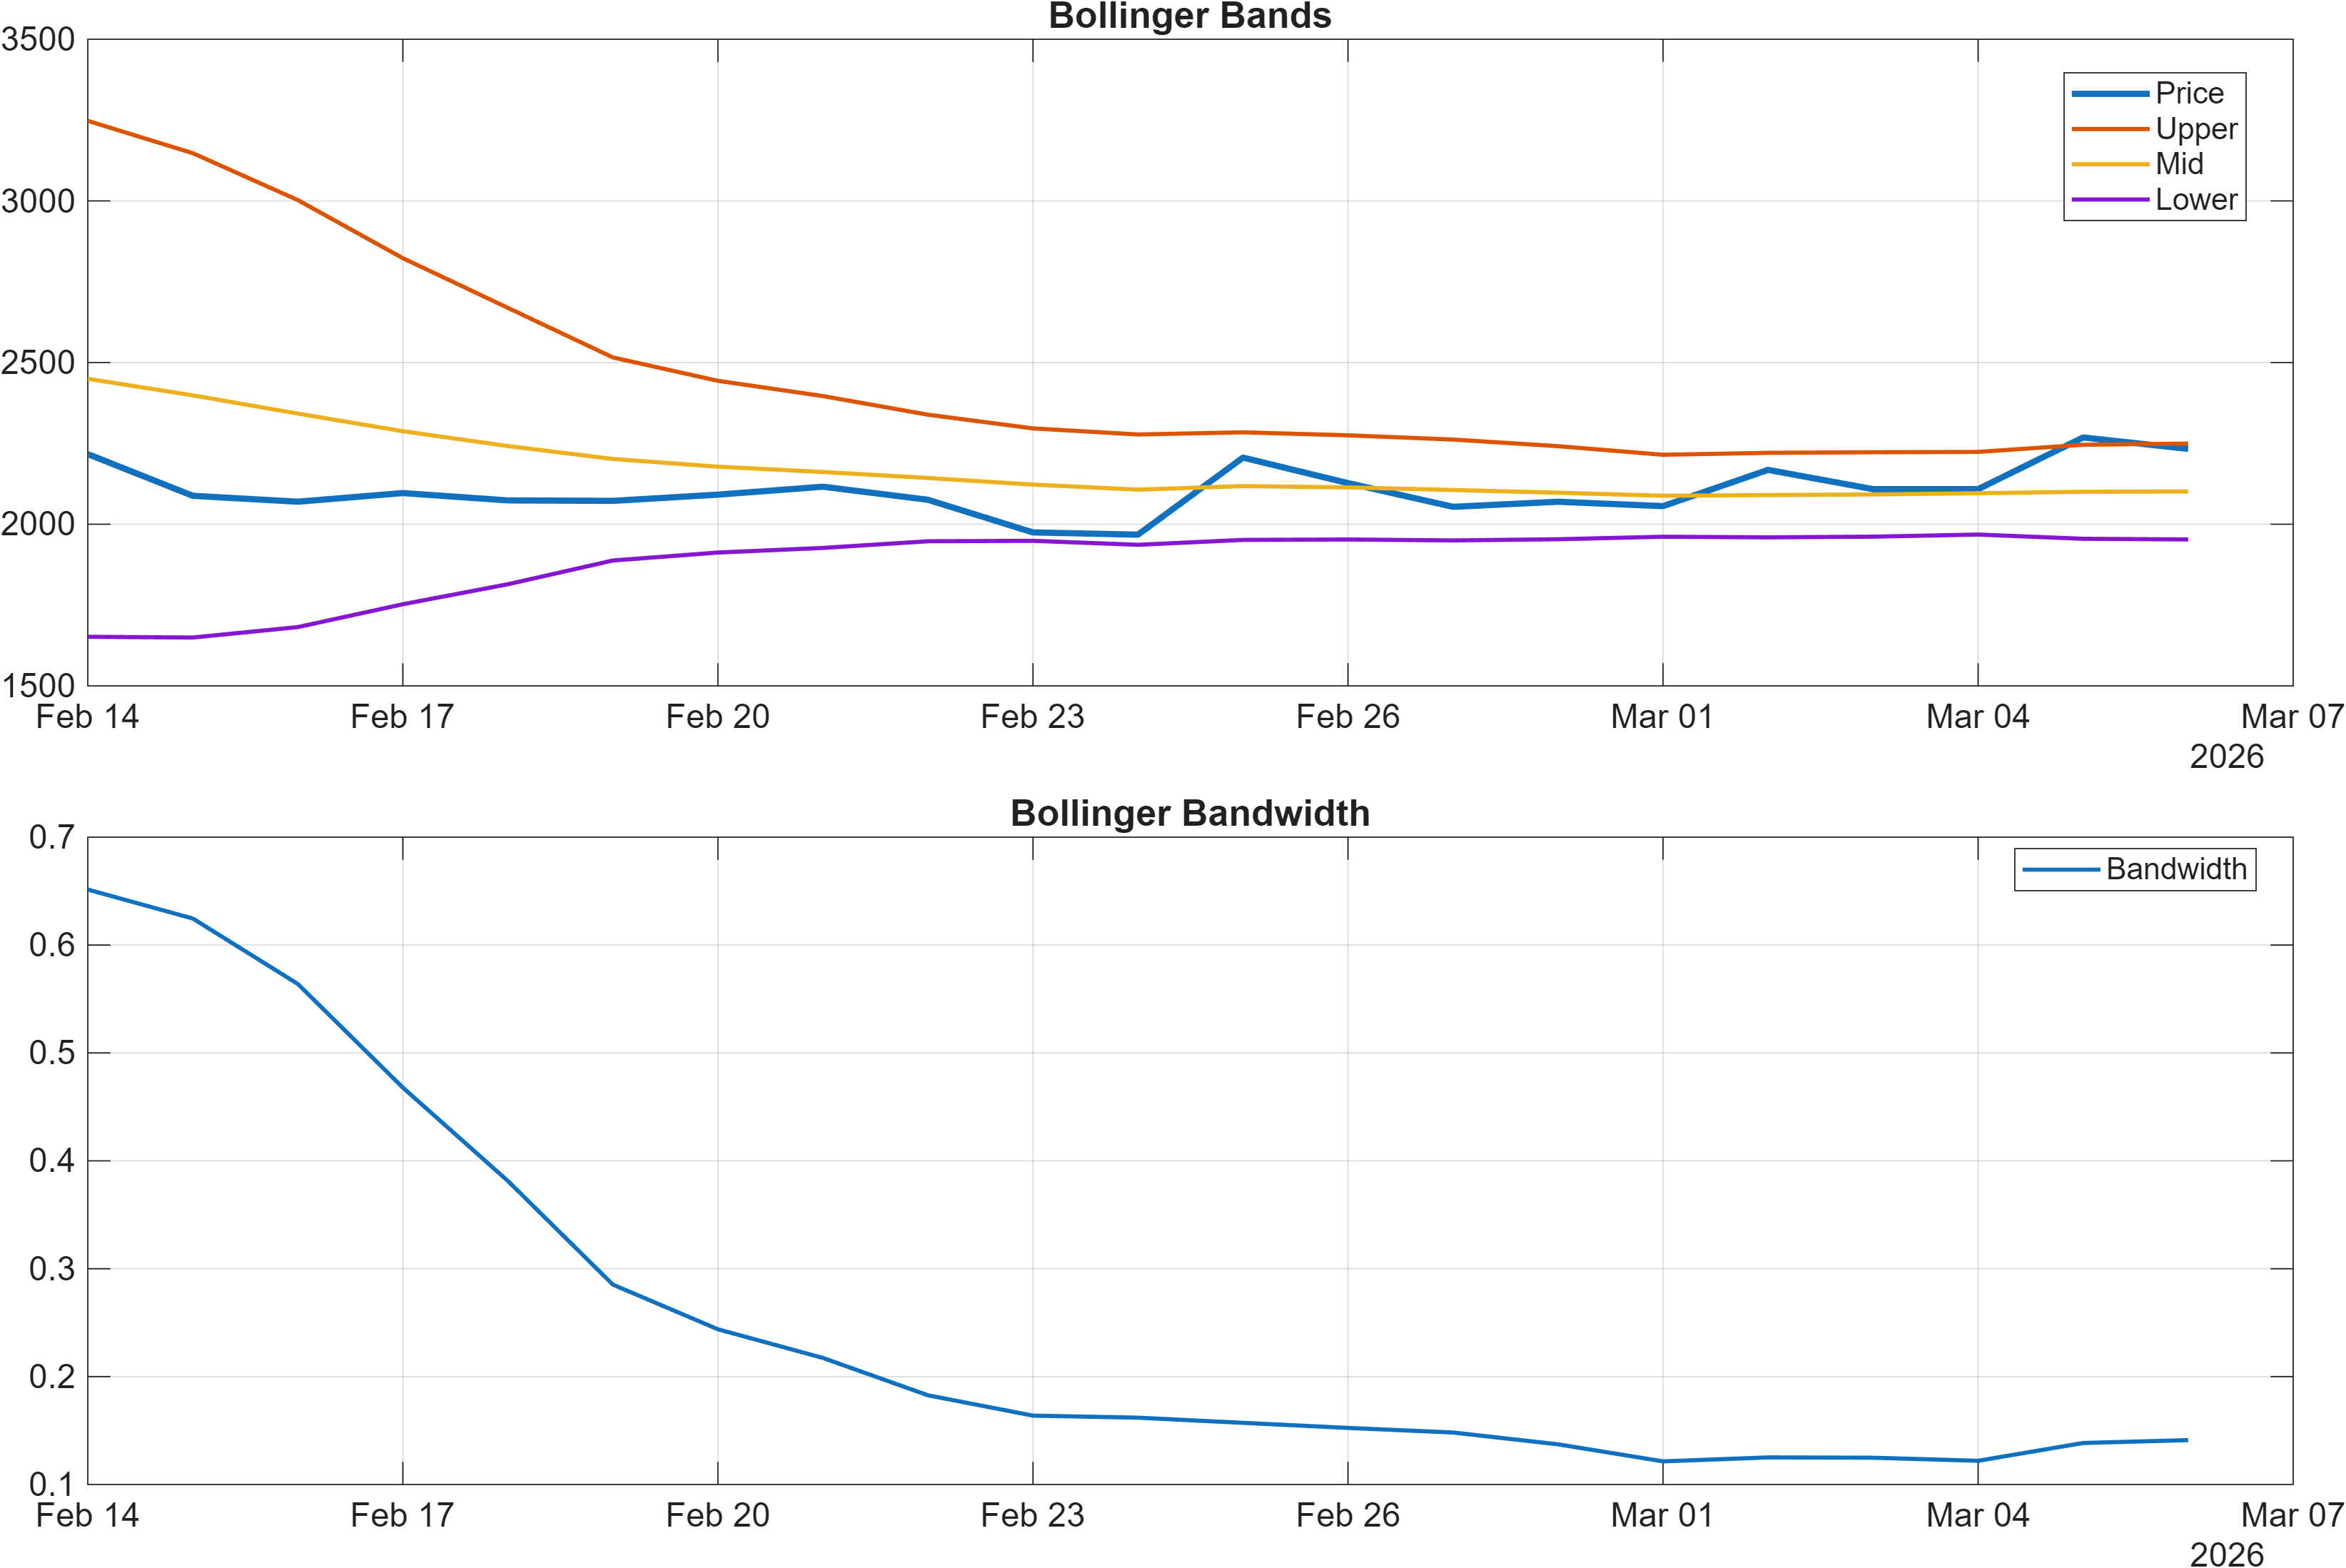
Interpretation: Bandwidth (volatility regime) latest = 0.1411.
Momentum and volatility are sending a “pause, not reversal” message—constructive, but with enough late-cycle hints to demand confirmation. The MACD histogram at 50.7068 supports positive momentum persistence, consistent with the weekly rank strength. Meanwhile, RSI(14) at 57.37 sits above the midpoint and is labeled bullish in the signal table, yet the dashboard interpretation classifies the RSI bias as neutral—an example of how adjacent rule sets can disagree when momentum is positive but not decisively extended.
The volatility regime is equally important here. Bollinger bandwidth at 0.1411 points to comparatively compressed volatility versus expansion phases. Compression does not determine direction, but it does elevate the importance of level-based triggers because small price moves can transition into larger ranges once bandwidth begins to widen.
Short-cycle exhaustion risk is hinted by overbought-style oscillators: Stoch %K at 94.18 is flagged bearish, which often appears when price is elevated within its recent range even if the larger trend is still supportive. In these conditions, the market can either (a) digest via sideways consolidation while trend metrics stay constructive, or (b) retrace quickly if participation fades.
Net: momentum is supportive, volatility is tight, and oscillator positioning is late-cycle. That combination generally argues for waiting on confirmation through a breakout/hold dynamic rather than relying on any single indicator print.
4) Support / Resistance zones
Support ~ 2007.4214 | Resistance ~ 3510.7144
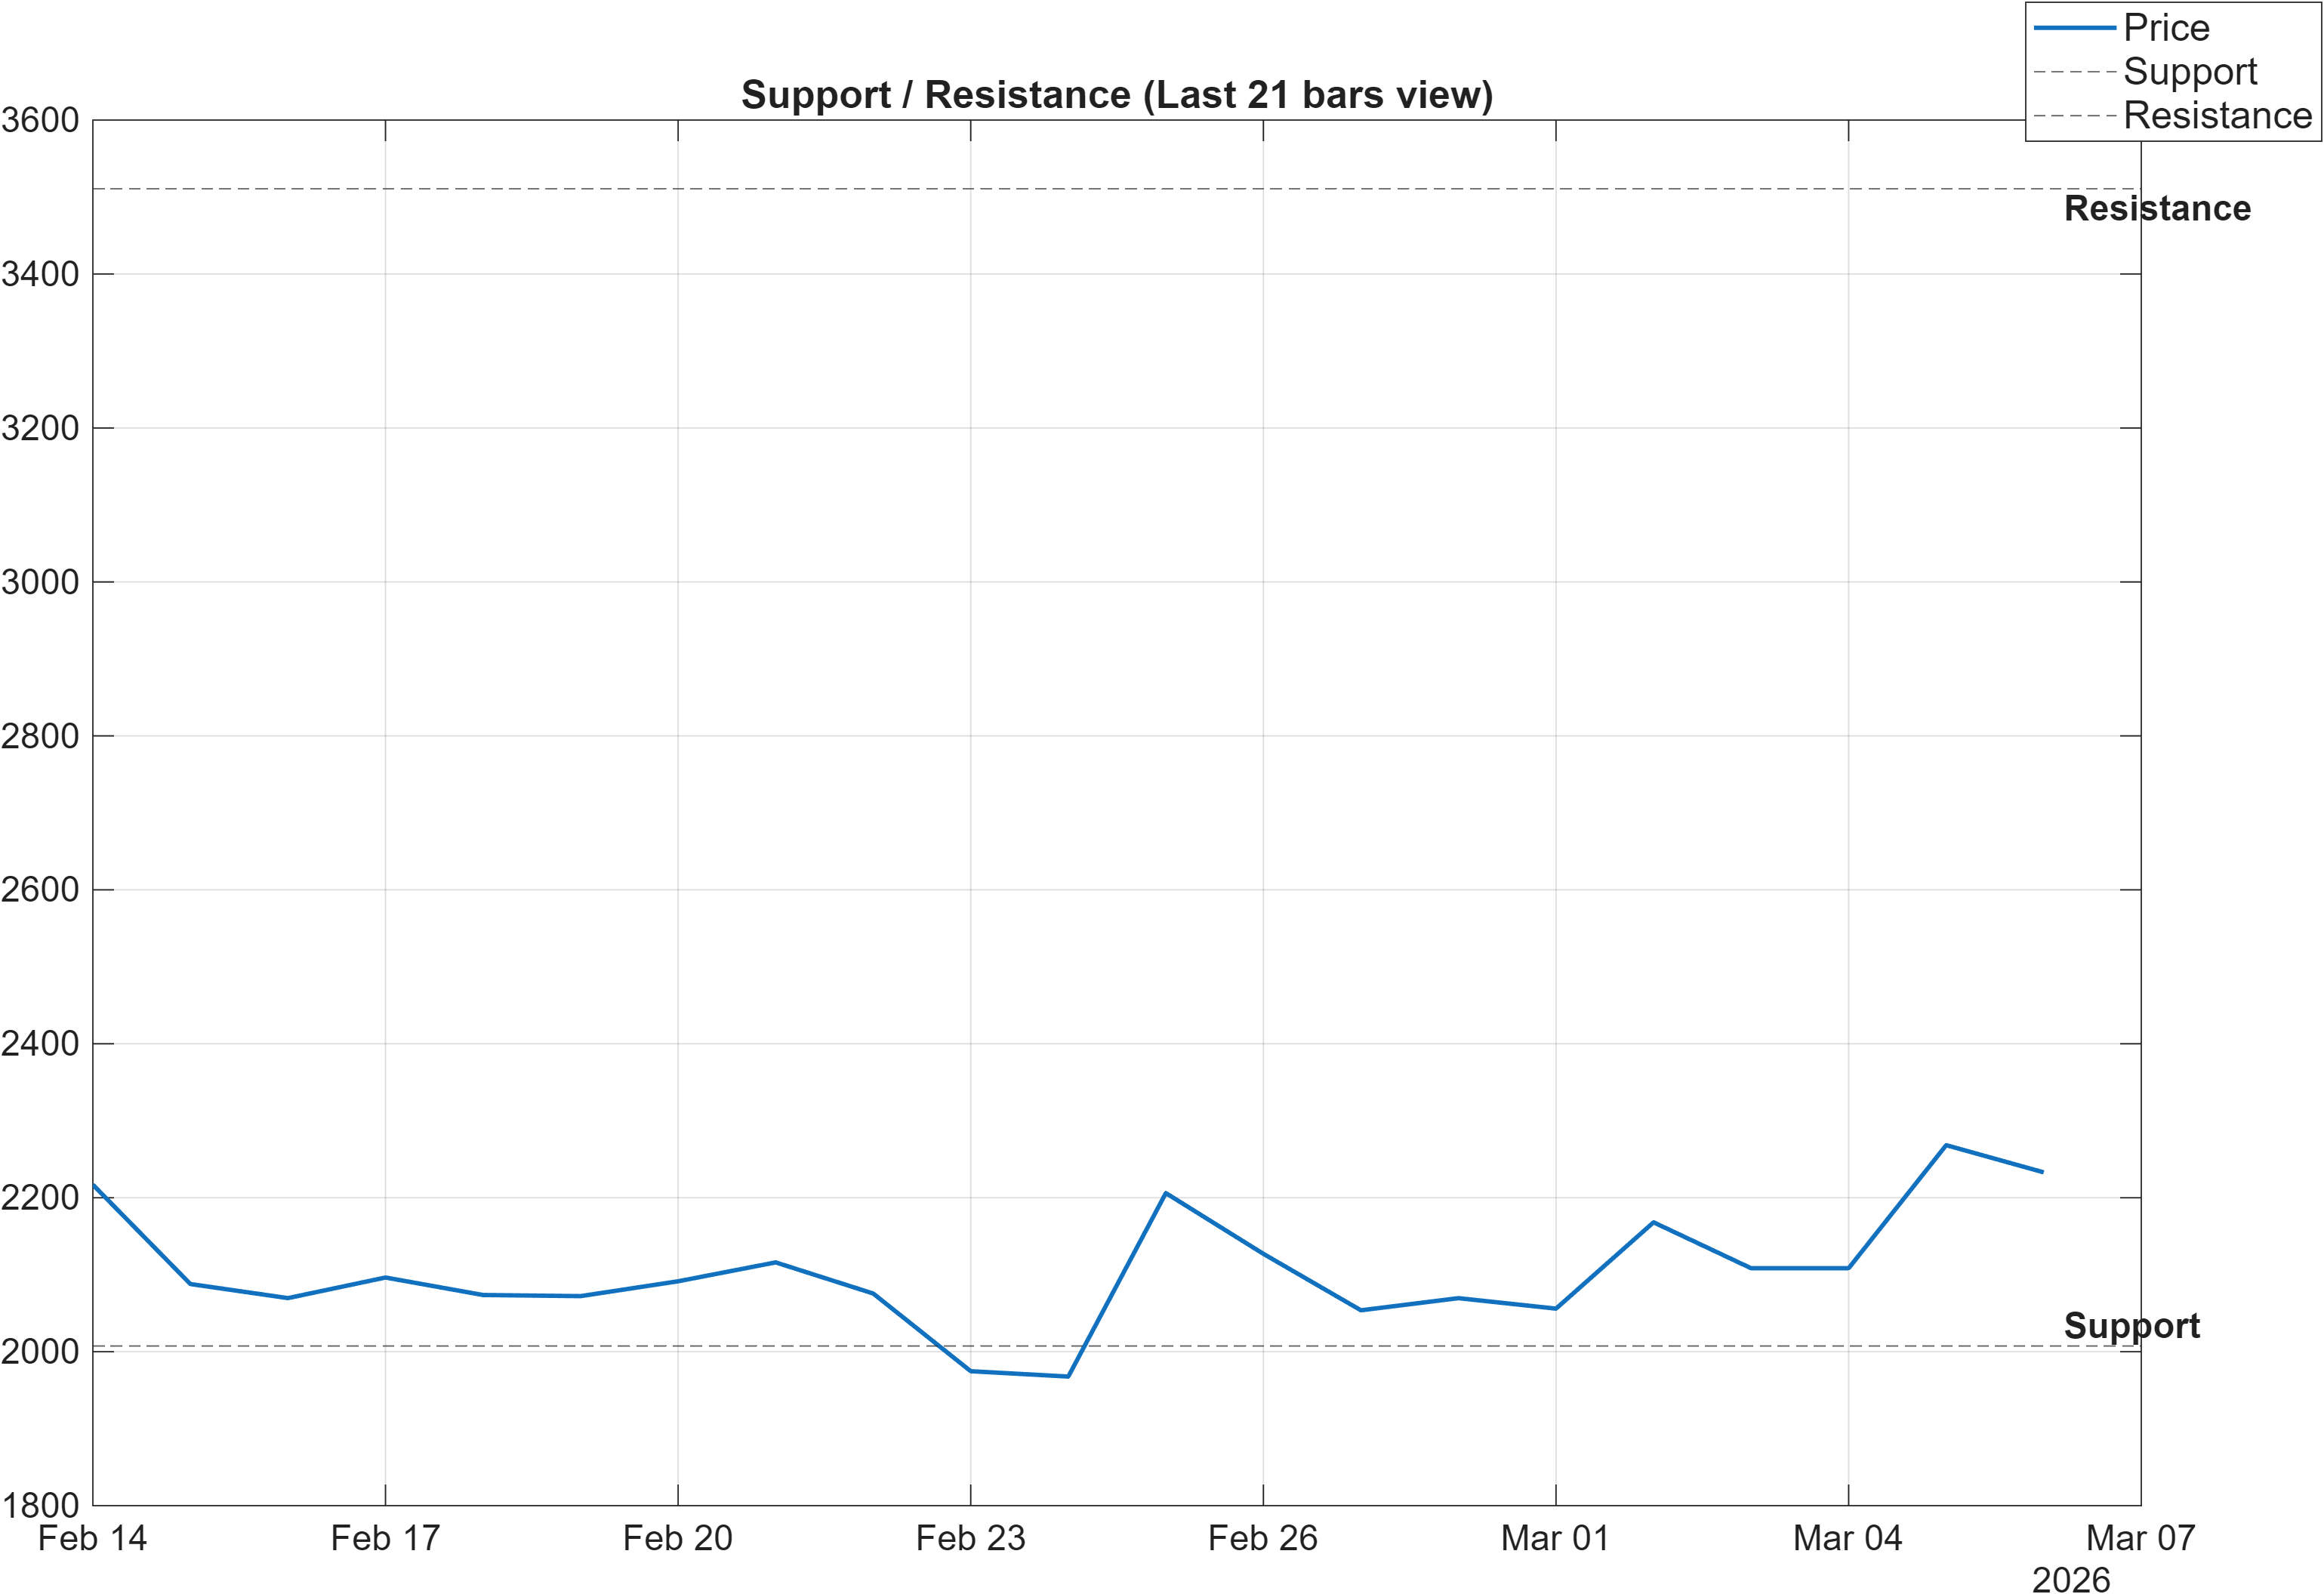
Scenario view: Break above resistance with volume → continuation. Close below support → signal deterioration risk.
The level map is unusually clean: support ~2007.4214 and resistance ~3510.7144 define the primary decision corridor. With volatility relatively contained (bandwidth 0.1411), these zones become more than reference points—they act as probabilistic inflection areas where order flow tends to concentrate and where risk can be measured more objectively.
On the upside, a break above 3510.7144 requires confirmation beyond price alone. The technical stack already includes constructive momentum inputs (e.g., MACD histogram 50.7068 and ROC(20) 6.95), but continuation quality is typically higher when the move is accompanied by improving participation signals. This matters because the signal set shows mixed volume/breadth behavior (some accumulation metrics positive, others negative), which can make resistance breaks more prone to quick retests.
On the downside, a close below 2007.4214 would do more than violate a line—it would conflict with the short-horizon bullish framework expressed by the daily rank (#51) and the weekly rank (#7). When ranks stay strong but support fails, the typical interpretation is that the market is transitioning from “trend attempt” to “failed breakout / distribution,” particularly if breadth-based measures are already fragile.
Given the mixed horizon ranks (bullish short-term, neutral medium-term), these levels can be viewed as the mechanism that resolves the disagreement: holding above support keeps consolidation constructive; reclaiming and sustaining above resistance is the cleaner pathway to longer-horizon alignment.
5) Quant Technical Dashboard (18 Signals)
KGNAI AI Technical Analysis Score (Deep Reinforcement Learning): Rank #391 out of 800 (Rank 1 represents the strongest technical positioning and a higher probability of favorable price behavior. As ranks increase toward the maximum, the probability of favorable outcomes weakens and bearish positioning becomes more dominant.) | Label: Neutral | Score: 0.022
18-Signal Technical Confluence Score: 0.389 (Bullish)
Overall Technical Score (18-signal confluence + DRL rank blend): 0.279 (Neutral)
Note: The blended score reflects signal strength weighted against broader AI technical ranking, which may temporarily diverge.
Blended technical score breakdown: 0.279 (Neutral | Bull 11 / Bear 4 / Neutral 3)
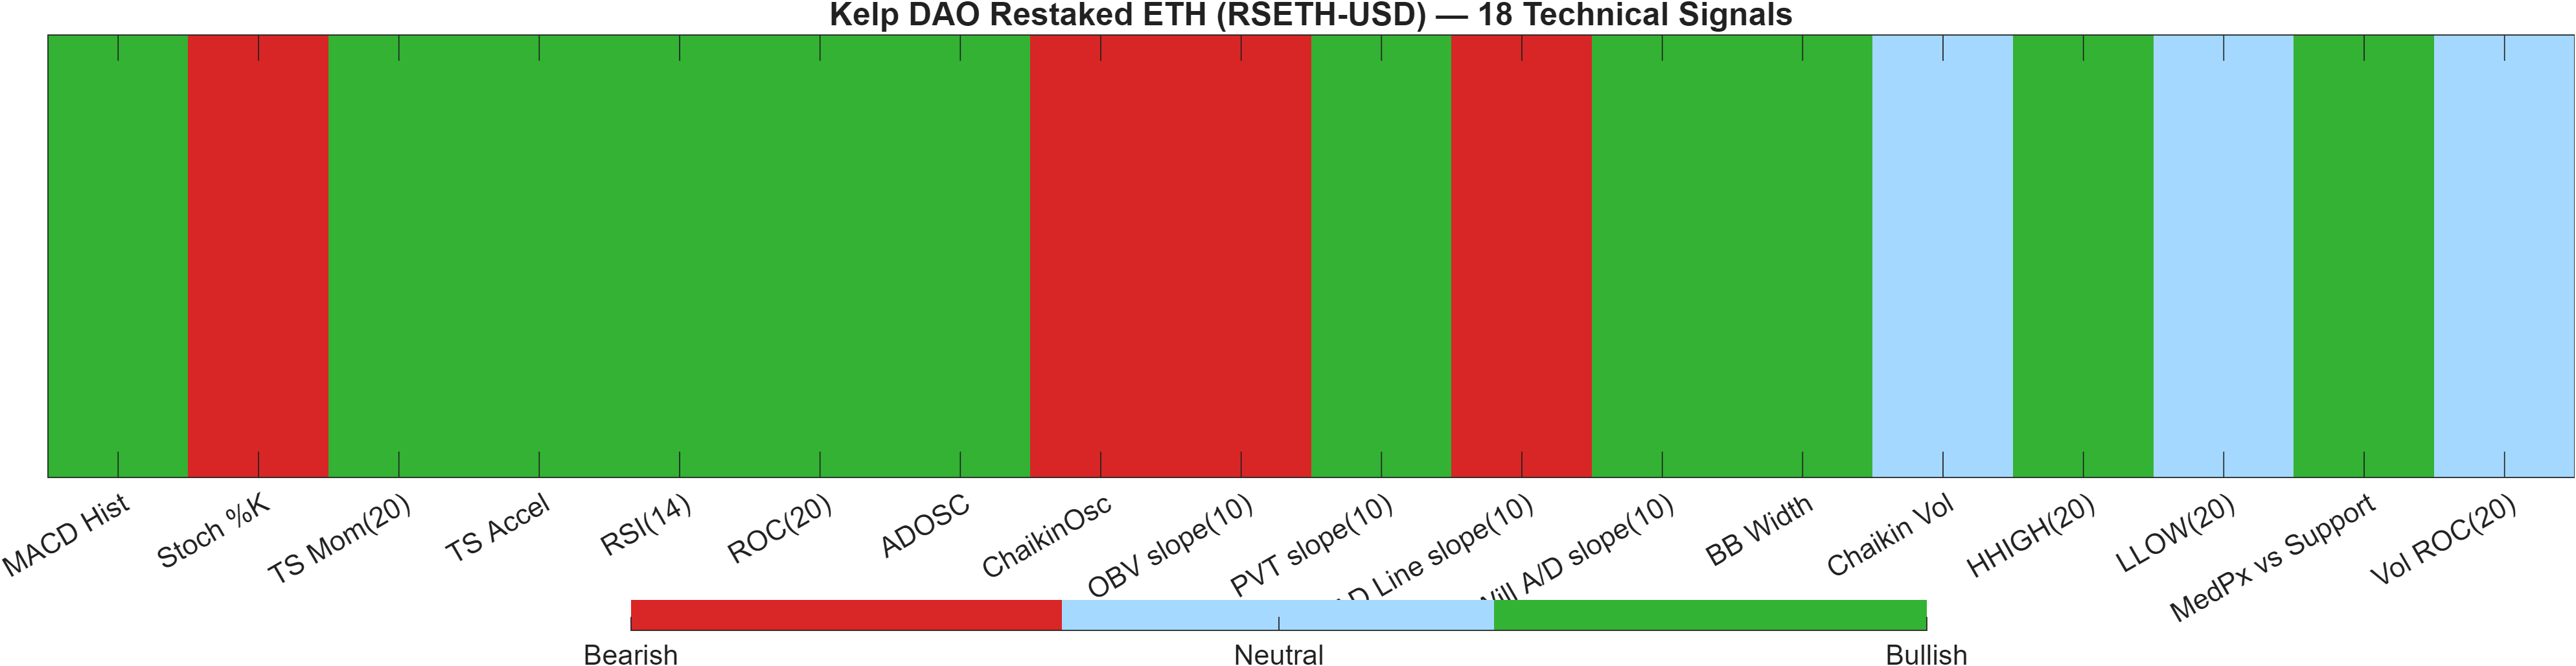
Signal table (Bull/Bear/Neutral)
| Indicator | Value | Signal |
|---|---|---|
| MACD Hist | 50.71 | Bullish |
| Stoch %K | 94.18 | Bearish |
| TS Mom(20) | 180.4 | Bullish |
| TS Accel | 1290 | Bullish |
| RSI(14) | 57.37 | Bullish |
| ROC(20) | 6.95 | Bullish |
| ADOSC | 5.917 | Bullish |
| ChaikinOsc | -7.481e+04 | Bearish |
| OBV slope(10) | -6.235e+04 | Bearish |
| PVT slope(10) | 1700 | Bullish |
| AD Line slope(10) | -4.5e+04 | Bearish |
| Will A/D slope(10) | 229.8 | Bullish |
| BB Width | 0.1411 | Bullish |
| Chaikin Vol | -33.2 | Neutral |
| HHIGH(20) | 2287 | Bullish |
| LLOW(20) | 1939 | Neutral |
| MedPx vs Support | 268.9 | Bullish |
| Vol ROC(20) | — | Neutral |
Interpretation: Indicator-level signals form the base confluence, which is then adjusted using a separate AI-driven technical ranking model. The final technical score summarizes this combined view.
This dashboard highlights a confluence vs model-rank divergence. The 18-signal engine is constructive (0.389, Bullish) with 11 bullish signals, yet the Deep Reinforcement Learning technical rank is #391/800 with a Neutral label and a score of 0.022. The blended outcome (0.279, Neutral) implies the broader technical state is not as dominant as the indicator checklist alone suggests.
Where the bullish case is strongest is in trend/momentum and select accumulation measures: MACD Hist 50.71, RSI(14) 57.37, and ROC(20) 6.95 point in the same direction. Time-series components also skew positive (TS Mom(20) 180.4; TS Accel 1290), which tends to support continuation attempts during consolidations.
The caution flags are concentrated in participation and oscillator extremes. Stoch %K 94.18 is bearish, signaling late-range positioning. Breadth/flow proxies are mixed: ChaikinOsc -7.481e+04 and OBV slope(10) -6.235e+04 lean bearish, while ADOSC 5.917 and PVT slope(10) 1700 lean bullish. This combination is consistent with selective accumulation rather than broad-based participation.
Taken together, the dashboard supports a neutral base case with an upside bias that becomes more credible if the bearish participation readings stabilize while price defends the defined support zone.
6) News sentiment + extractive gist
Note: Instrument-specific news matches were not found, so the digest includes broader market/sector headlines. Links are provided for verification.
Sentiment score (avg): 0.013 | Positive: 12% | Neutral: 81% | Negative: 6%
KGNAI AI News Sentiment Score (normalized -1 to +1): Not available (as of —) | Label: Not available | Overall news score: 0.01
Positive Developments
Recent coverage across major financial outlets indicates a modestly constructive backdrop for the broader crypto complex, with attention on market-access improvements and incremental infrastructure maturation. The sentiment mix remains dominated by neutral items (81%), but the positive slice (12%) reflects recurring themes around mainstream participation and product accessibility, which can indirectly support liquid ETH-linked instruments. In parallel, the technical backdrop for RSETH-USD leans supportive on shorter horizons (e.g., weekly rank #7), which can amplify the impact of even mildly positive sector tone when volatility is contained (bandwidth 0.1411). The key nuance is that “constructive” coverage does not need to be uniformly bullish to matter; in consolidation regimes, a steady informational flow can help maintain bid stability, especially if price continues to respect the 2007.4214 support zone.
Neutral / Mixed Developments
The dominant signal from the news digest is contextual neutrality: the average sentiment score is 0.013 with an overall news score of 0.01, and instrument-specific matches are not present in the provided data. Mixed items appear to center on evolving regulatory and operational considerations that are not uniquely tied to RSETH-USD, but can shape risk premia across crypto markets. For portfolio decision-making, this keeps news as a bias layer rather than a primary driver—consistent with the blended technical stance (0.279, Neutral). In this environment, price/level behavior (support vs resistance) tends to dominate short-horizon outcomes more than the incremental tone of general sector headlines.
Negative / Risk Signals
Risk-oriented coverage across major outlets continues to emphasize the sector’s sensitivity to enforcement headlines and to shifts in miner/participant behavior, both of which can influence volatility and cross-asset correlations. Even with a relatively small negative share (6%), these themes matter because RSETH-USD’s technical state is not fully synchronized across horizons (e.g., monthly rank #491 versus weekly rank #7). In mixed-regime markets, adverse sector news can accelerate mean reversion, particularly if participation indicators are already uneven (e.g., OBV slope(10) -6.235e+04 alongside bullish momentum prints). The practical implication is that downside risk should be assessed through the lens of level integrity: a breach of 2007.4214 would align technical deterioration with a more fragile sentiment backdrop.
What to monitor next
- Whether volatility expands from 0.1411 alongside a level break (3510.7144 or 2007.4214).
- Whether participation signals (e.g., OBV slope, ChaikinOsc) converge toward the bullish momentum reads.
- Whether neutrality in sentiment (81%) shifts materially toward positive or negative in subsequent digests.
Sources referenced: Reuters, Bloomberg, Yahoo Finance, MarketWatch, Investing.com
Snapshot: AI Rank (Short–Mid–Long): Mixed (Bullish–Neutral–Neutral) · Technical Confluence: Bullish · Key Levels: Support ~2007.42 | Resistance ~3510.71 · News Sentiment: Neutral
7) Sources
Not available in the provided data.
You may also like: How KGNAI AI ranks instruments across global markets
Disclaimer: KGNAI provides AI-generated analytics and educational market commentary only. This is not financial advice. Markets involve risk. Always do your own research.