
Viction (VIC-USD) Technical, Rank & Sentiment Report — 08-Mar-2026 (Neutral stance awaiting confirmation)
VIC-USD enters 08-Mar-2026 with a ranking profile that is constructive on select horizons but not yet confirmed by broader technical structure. Cross-sectional positioning shows stronger relative behavior on the daily and especially the 3‑monthly lens, while the weekly and monthly views sit closer to the middle of the tracked universe. Technically, the market is still working through a bearish moving-average structure (close vs MA50 and MA50 vs MA200 both flagged bearish), while momentum is mixed: RSI is neutral overall, and the MACD histogram is slightly positive at 0.0007, consistent with early stabilization rather than trend re-acceleration. Volatility context remains relevant, with Bollinger bandwidth at 0.2811, and key decision zones are clearly defined at support ~0.0448 and resistance ~0.0980.
- Rank stance: Short-term Neutral; Mid-term Neutral; Long-term Neutral (with 3‑monthly rank notably stronger than weekly/monthly).
- Technical confluence: 18-signal confluence is Neutral while the blended technical score is Bearish (signal mix tilts bearish).
- Key levels: Support ~0.0448 and Resistance ~0.0980 frame near-term regime tests.
- News sentiment bias: Neutral (avg sentiment 0.000, with 100% neutral classification in the provided sample).
- Confirmation / invalidation: A break above 0.0980 with volume would strengthen continuation risk-on conditions; a close below 0.0448 increases deterioration risk.
KGNAI evaluates assets using large cross-sectional datasets built from millions of structured data points. Inputs incorporate fundamental metrics, technical structures, and systematically processed news sentiment. Statistical models, machine learning, and AI frameworks are used to assess relative positioning, signal alignment, and probabilistic behavior across broad universes.
- Ranks are comparative across the tracked universe, not absolute price targets.
- Confluence reflects alignment among independent signal groups.
- Support/resistance levels are probabilistic decision zones, not guarantees.
- Sentiment provides contextual bias within the broader analytical framework.
1) KGNAI AI Analysis
Region: CRYPTO
Total universe size: 800 ranked instruments
- Daily rank: #70 out of 800 — Bullish
- Weekly rank: #192 out of 800 — Neutral
- Monthly rank: #196 out of 800 — Neutral
- 3-Monthly rank: #28 out of 800 — Bullish
VIC-USD’s cross-sectional profile is best described as timeframe-divergent. The daily rank (#70/800) places it in the upper slice of the universe, suggesting improving relative behavior versus peers over the most recent window. The standout is the 3‑monthly rank (#28/800), which is closer to the top decile and indicates that, over a broader horizon, the asset has displayed stronger statistical behavior characteristics than most of the 800-instrument universe.
That said, the weekly (#192/800) and monthly (#196/800) ranks sit nearer the upper quartile-to-mid range rather than the extreme strength implied by the 3‑monthly view. This rank curvature often appears when a longer-horizon improvement is present, but the intermediate windows have not yet re-accelerated in sync—consistent with consolidation, mean reversion, or a pause after a prior move.
The stated term view remains Neutral across short-, mid-, and long-term horizons, which is coherent with the mixed rank stack: constructive tails (daily, 3‑monthly) alongside more average intermediate readings. In practical portfolio terms, this configuration tends to reward investors who separate relative strength from timing: the rank data argues VIC-USD is not broadly weak across the universe, but it also does not yet present uniform confirmation across all monitored horizons.
2) Price & trend overview
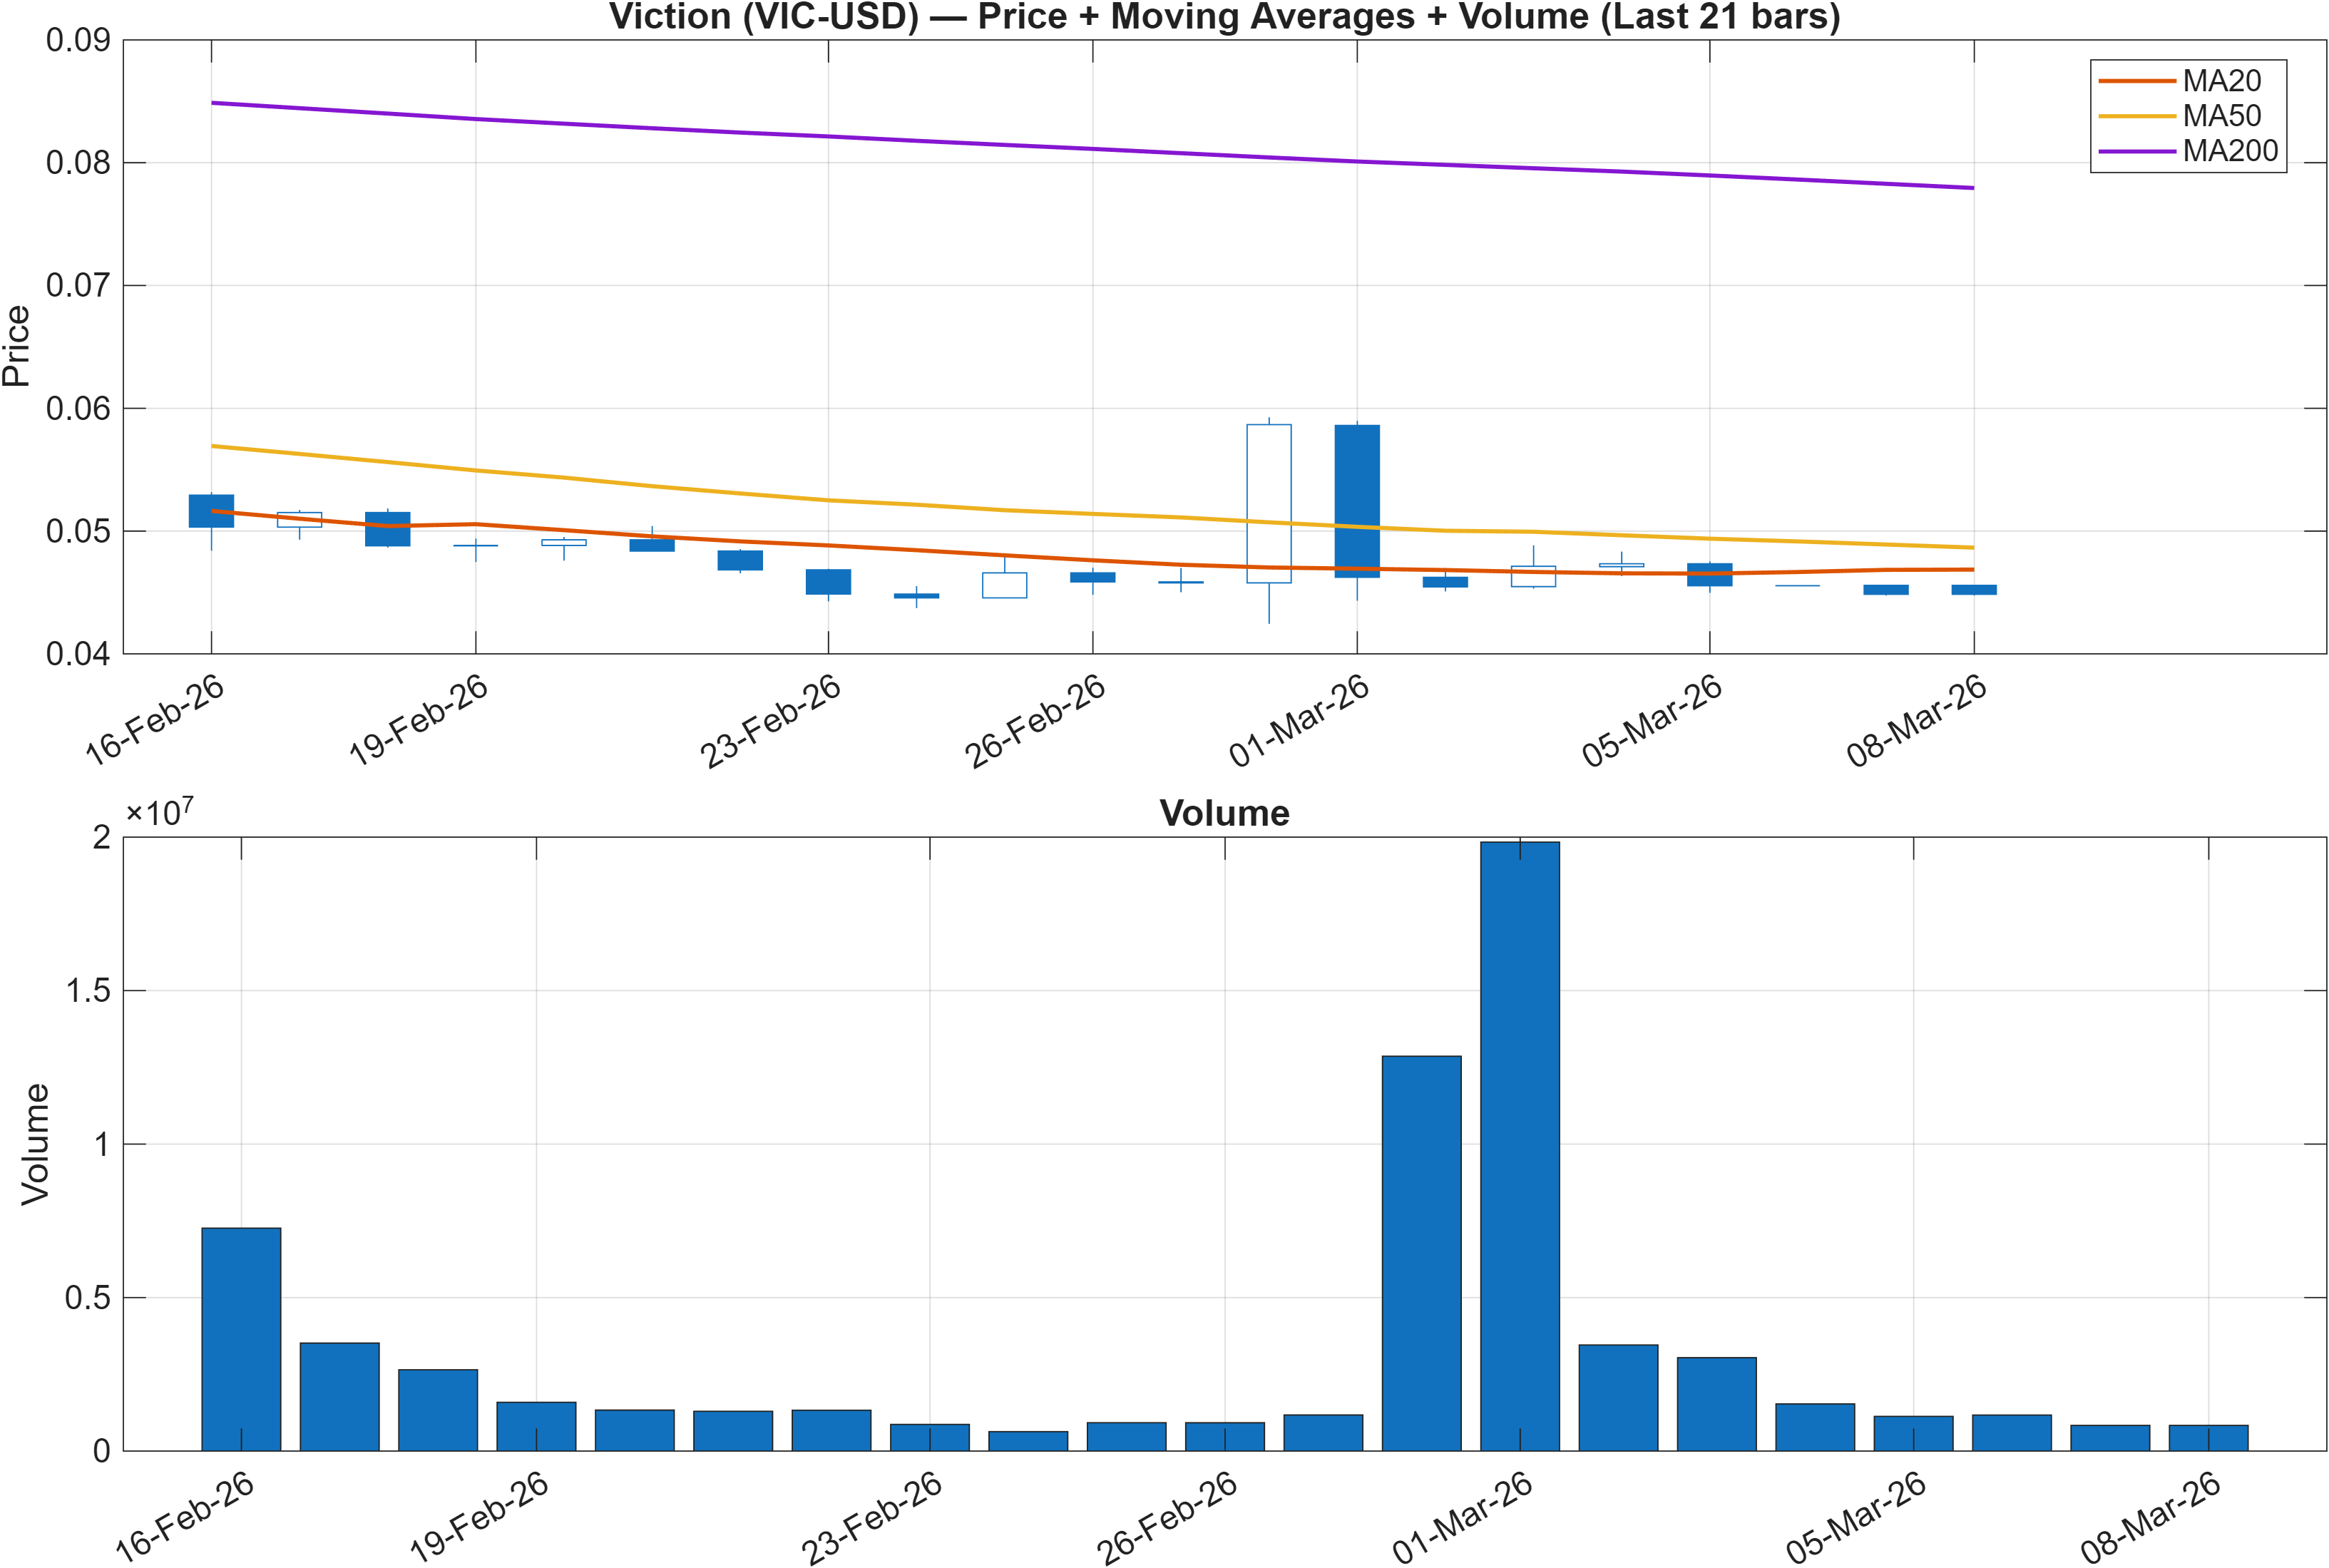
Interpretation: Close vs MA50 = Bearish, MA50 vs MA200 = Bearish.
The trend layer remains structurally defensive because both moving-average relationships are bearish: price is below the MA50, and the MA50 sits below the MA200. This is a classic configuration associated with a market that has not yet completed a trend repair process. In this regime, rallies often need additional confirmation—typically via reclaiming the MA50 and then stabilizing above it—before the trend state can be described as improving rather than merely bouncing.
Importantly, this bearish trend framing does not automatically negate the stronger cross-sectional ranks seen on the daily and 3‑monthly horizons. Instead, it highlights a common situation in crypto market structure: relative performance improves first, while the slow-moving trend filters (MA relationships) respond later. That lag can create a “rank/structure mismatch,” where ranking models detect improving behavior against peers even though the chart structure remains below major trend references.
Given the clearly defined horizontal decision zones—support ~0.0448 and resistance ~0.0980—trend evaluation is best anchored to how price behaves near these boundaries. A market can remain under bearish MA alignment and still transition if it demonstrates repeated higher lows above support and eventually pressures the upper band of the range. Conversely, losing support while MA alignment is already bearish tends to reinforce a continuation of the defensive regime.
3) Momentum & volatility dashboard
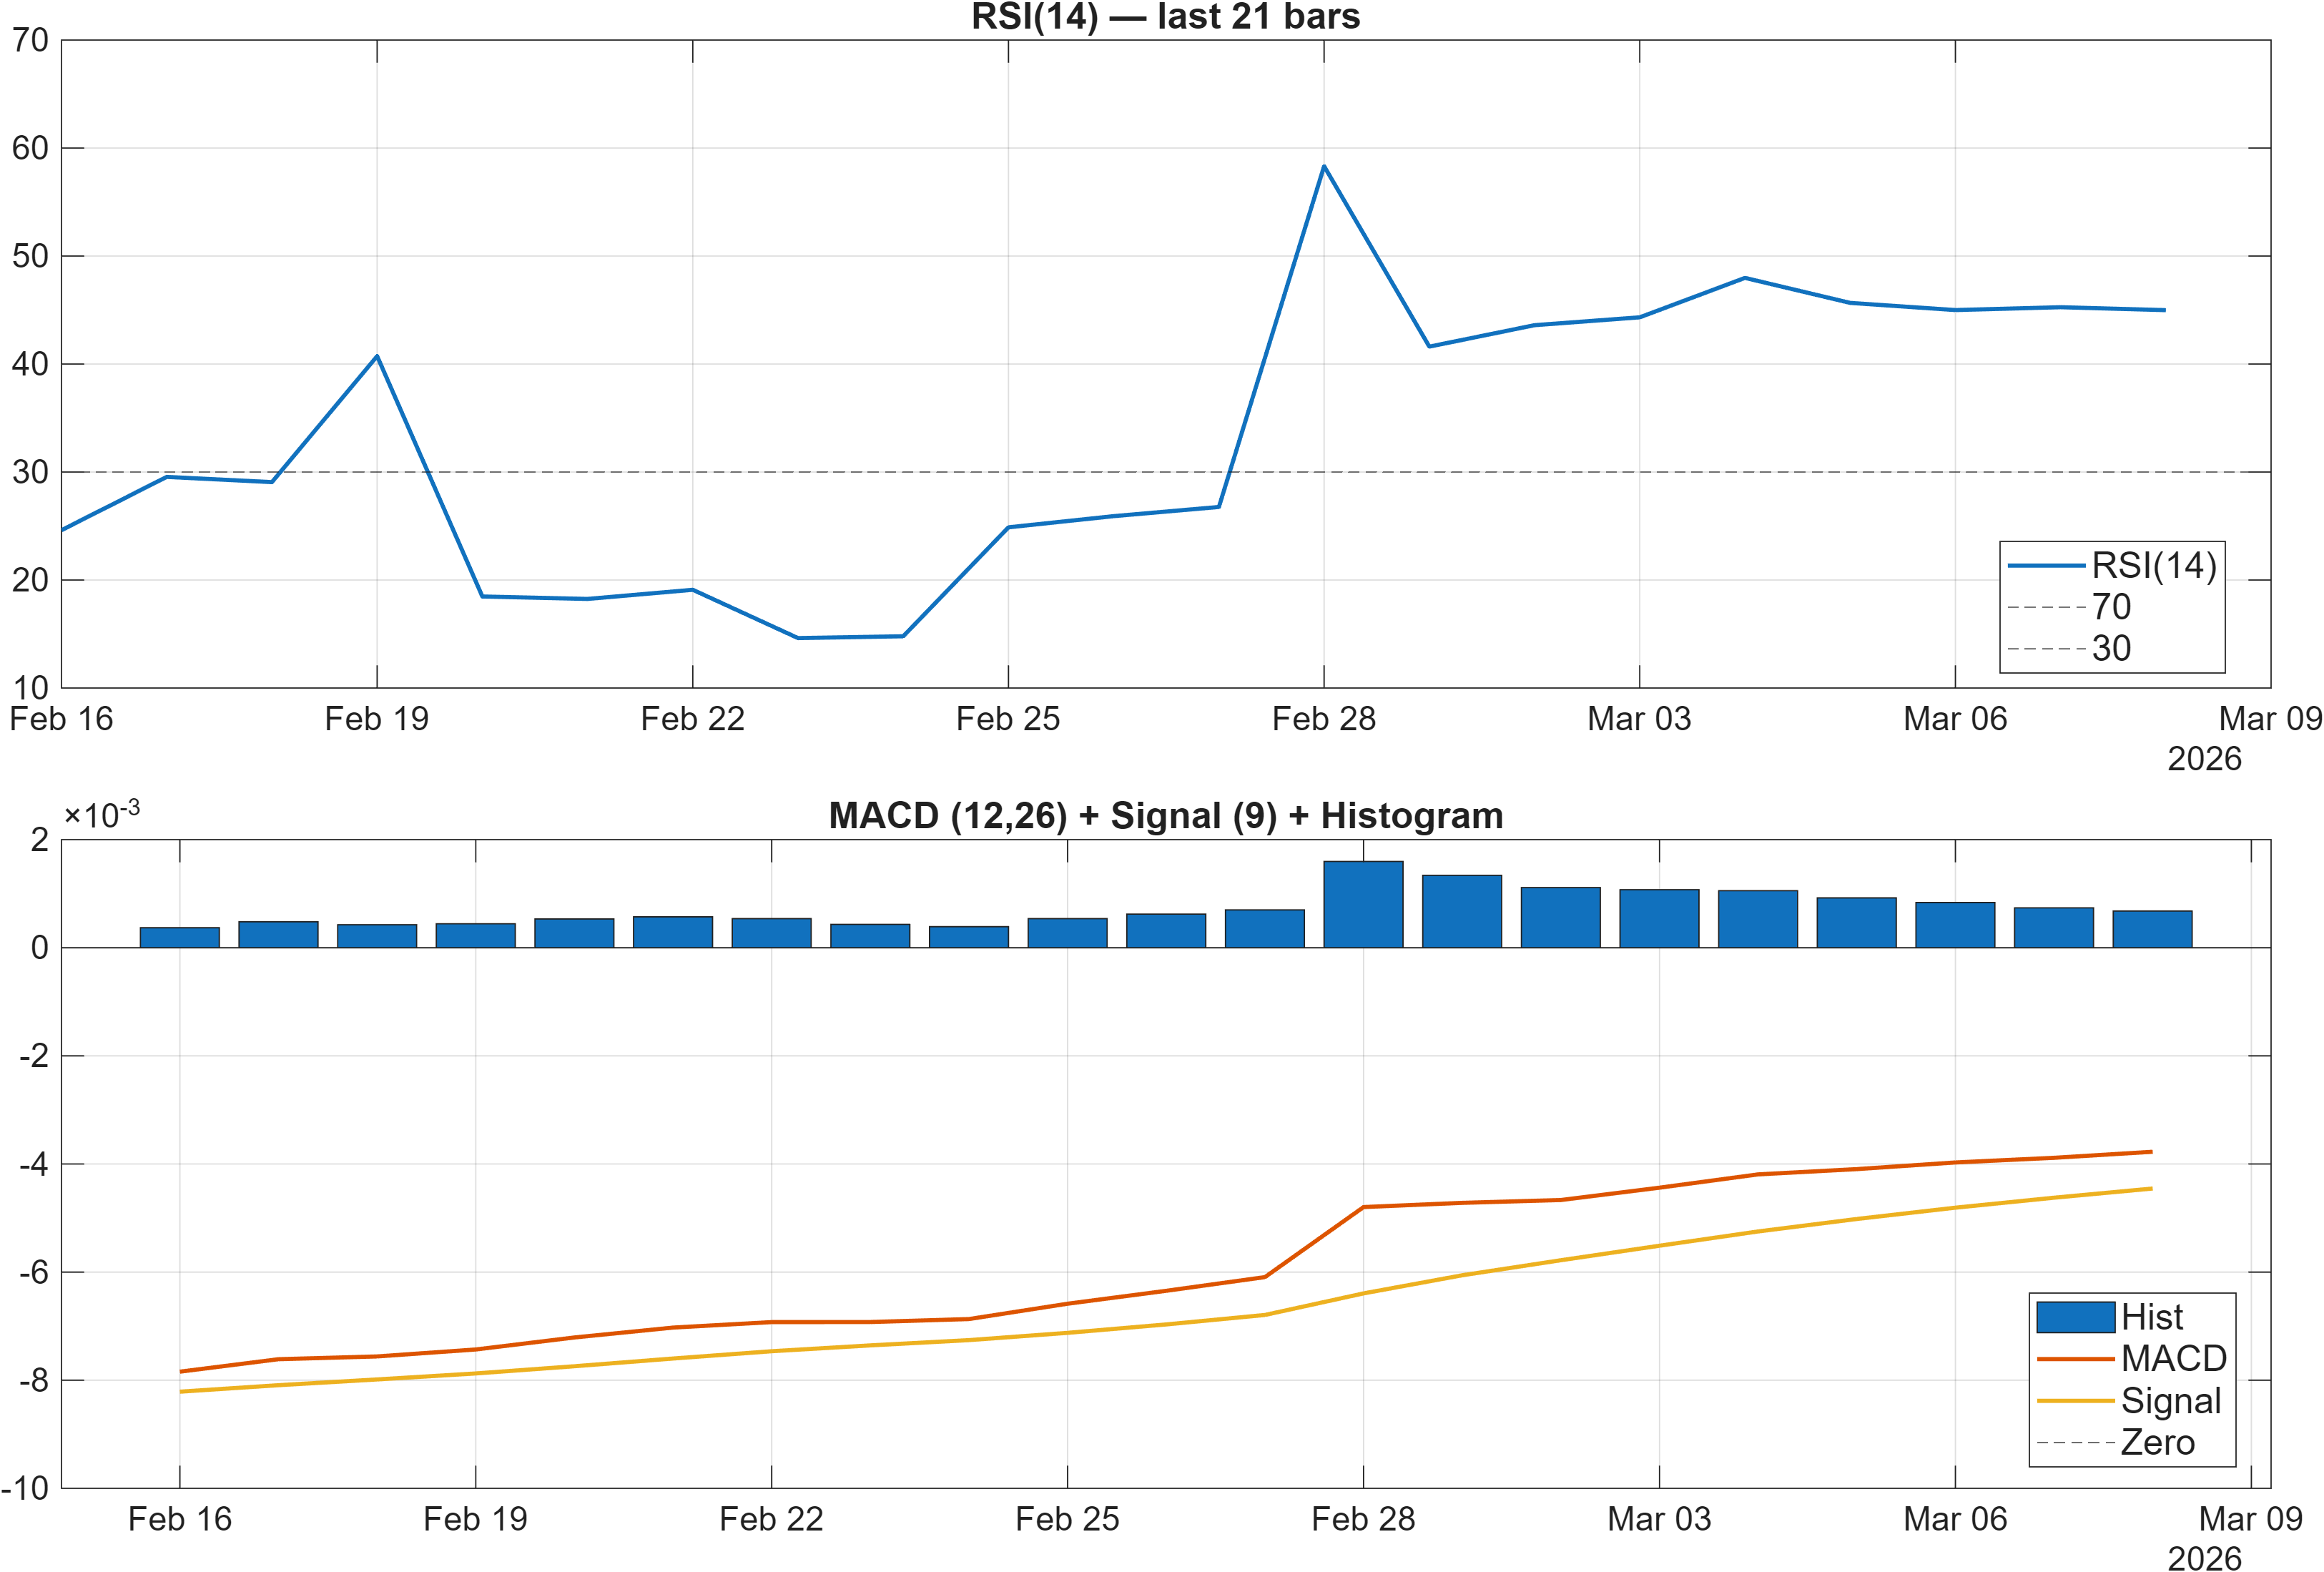
Interpretation: RSI bias = Neutral, MACD hist = 0.0007.
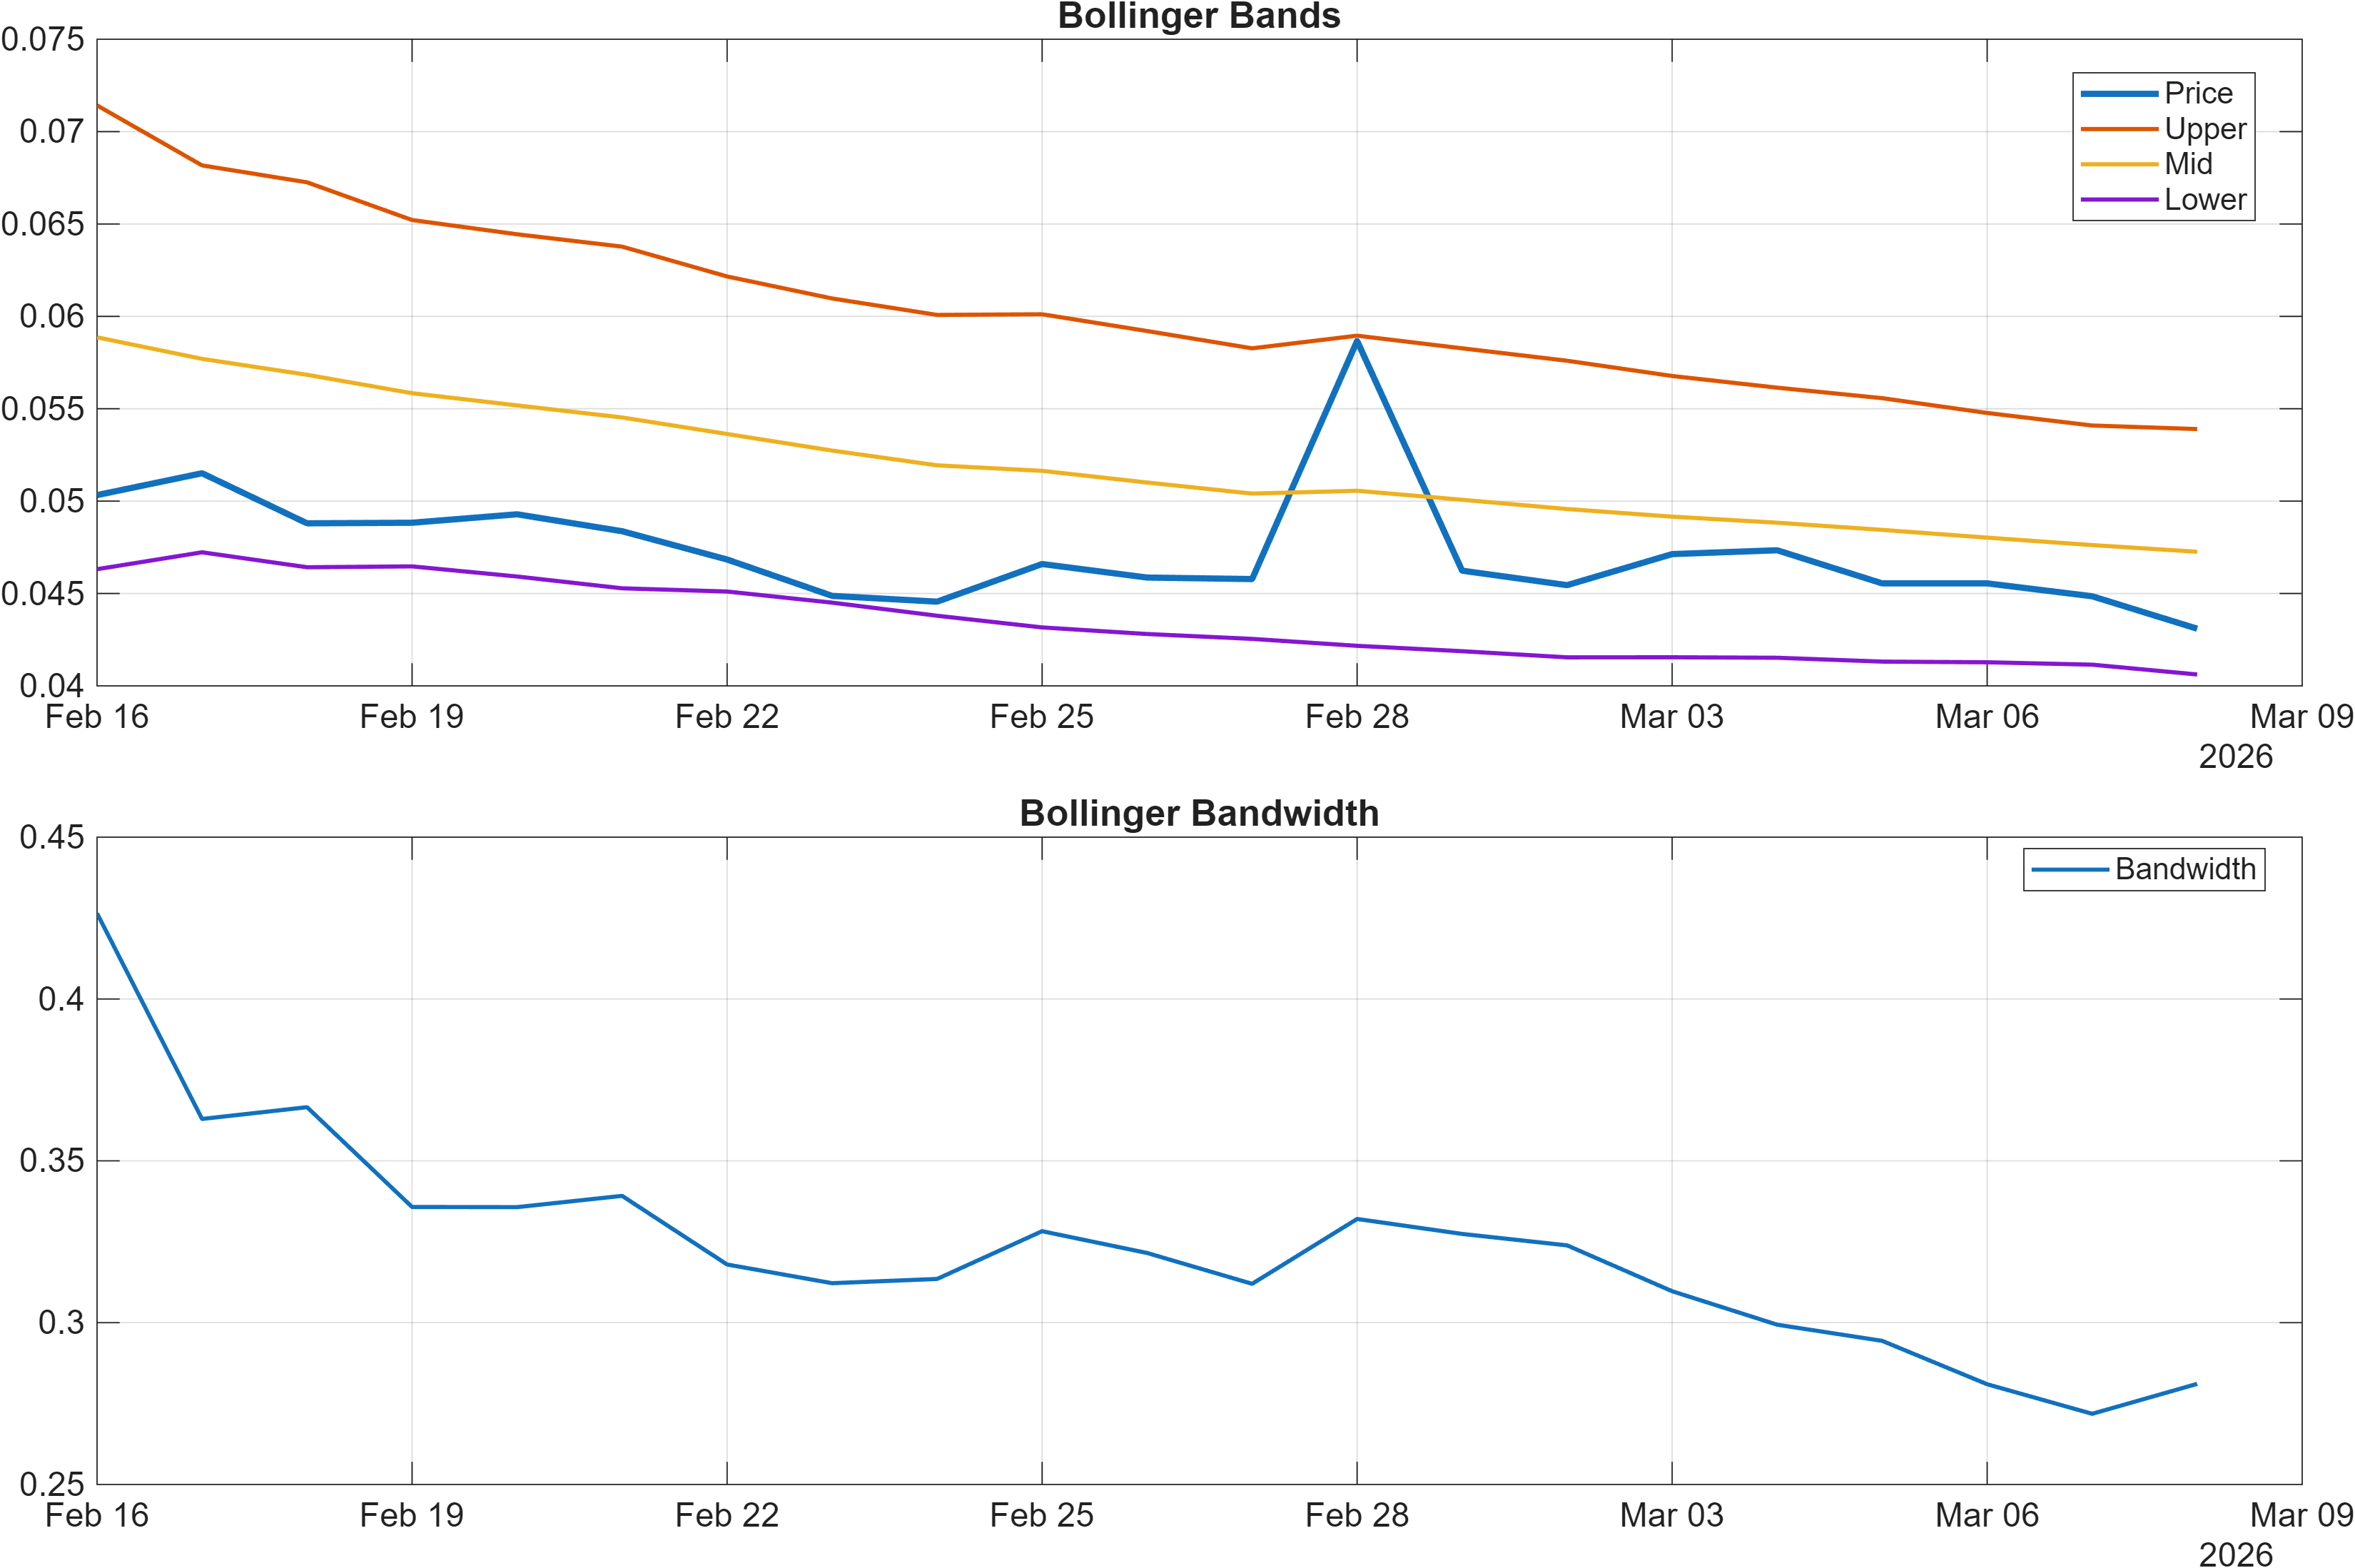
Interpretation: Bandwidth (volatility regime) latest = 0.2811.
Momentum is currently mixed-to-stabilizing rather than decisively trending. The RSI bias is tagged Neutral, which aligns with a market that is neither in a strong impulse phase nor in a clear capitulation state. Meanwhile, the MACD histogram at 0.0007 is modestly positive, suggesting incremental improvement in momentum versus the immediate prior period—but not necessarily enough to override the bearish higher-timeframe trend filters seen in the moving averages.
From a regime perspective, volatility provides the backdrop for how momentum signals should be weighted. With Bollinger bandwidth at 0.2811, the market is not presenting an extreme compression signal by itself in the provided data. That matters because the reliability of short-term momentum shifts (like a slightly positive MACD histogram) often depends on whether volatility is expanding from a compressed base or simply oscillating within a broader, choppy range.
The signal combination—neutral RSI, slightly positive MACD histogram, and a non-extreme bandwidth reading—fits a “wait for confirmation” environment. In these conditions, momentum indicators can flip frequently unless anchored to structure. For VIC-USD, the most relevant structural anchors remain the 0.0448 support and 0.0980 resistance zones, where a volatility expansion (via widening bands and sustained directional candles) would provide cleaner validation than oscillator readings alone.
4) Support / Resistance zones
Support ~ 0.0448 | Resistance ~ 0.0980
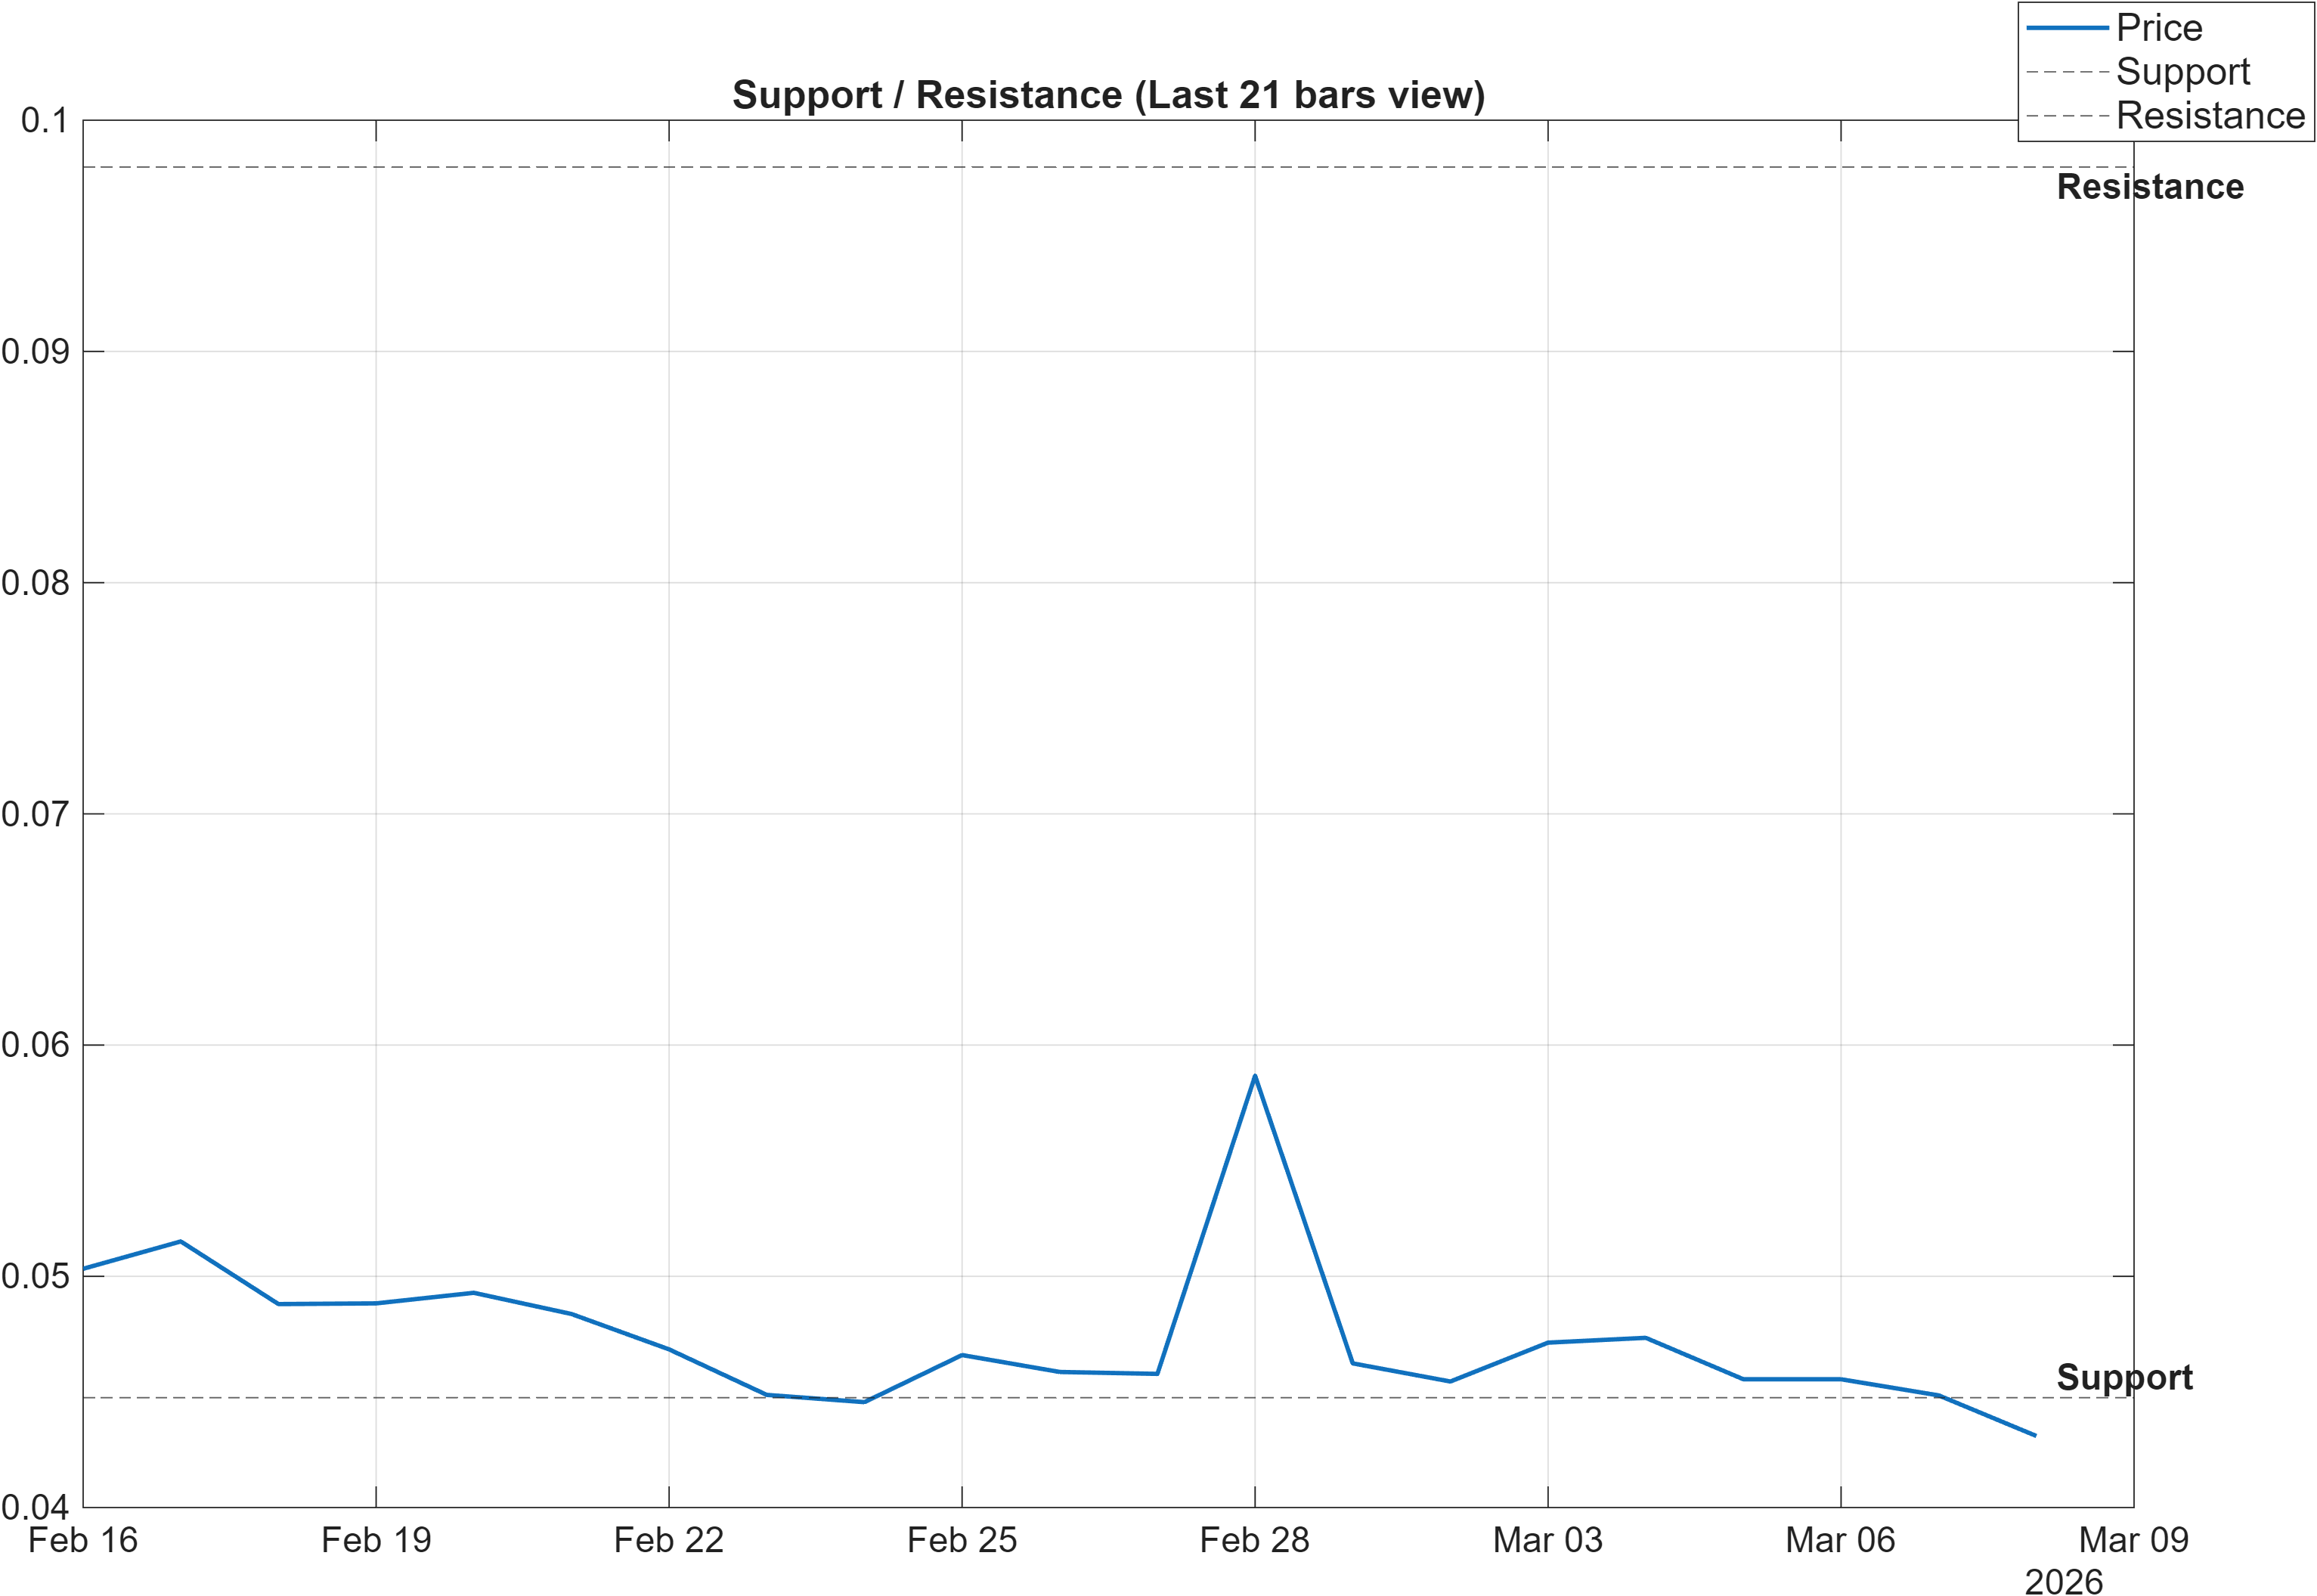
Scenario view: Break above resistance with volume → continuation. Close below support → signal deterioration risk.
The market structure is currently best framed as a two-sided decision map bounded by support near 0.0448 and resistance near 0.0980. With moving averages still bearish, these horizontal levels become especially important because they define where buyers have previously demonstrated willingness to absorb supply (support) and where sellers have historically regained control (resistance). In transitional regimes, price interaction with these zones tends to carry more informational value than oscillators in the middle of the range.
A clean break above 0.0980 with volume is explicitly described in the provided scenario logic as a continuation signal. Interpreted structurally, that would represent not only a range escape but also a meaningful shift in auction dynamics—price accepting above prior supply. If accompanied by improving momentum measures (e.g., a persistently positive MACD histogram rather than a brief uptick around 0.0007), it would reduce the likelihood that the breakout is merely a volatility spike.
On the downside, a close below 0.0448 is flagged as deterioration risk. With the broader MA structure already bearish, a loss of support would be consistent with regime continuation rather than a temporary pullback. In that scenario, neutral sentiment (0.000 average, 100% neutral in the provided sample) offers little offsetting tailwind; the market would be leaning primarily on technical stabilization rather than narrative-driven demand.
5) Quant Technical Dashboard (18 Signals)
KGNAI AI Technical Analysis Score (Deep Reinforcement Learning): Rank #648 out of 800 (Rank 1 represents the strongest technical positioning and a higher probability of favorable price behavior. As ranks increase toward the maximum, the probability of favorable outcomes weakens and bearish positioning becomes more dominant.) | Label: Bearish | Score: -0.620
18-Signal Technical Confluence Score: -0.167 (Neutral)
Overall Technical Score (18-signal confluence + DRL rank blend): -0.303 (Bearish)
Note: The blended score reflects signal strength weighted against broader AI technical ranking, which may temporarily diverge.
Blended technical score breakdown: -0.303 (Bearish | Bull 6 / Bear 9 / Neutral 3)
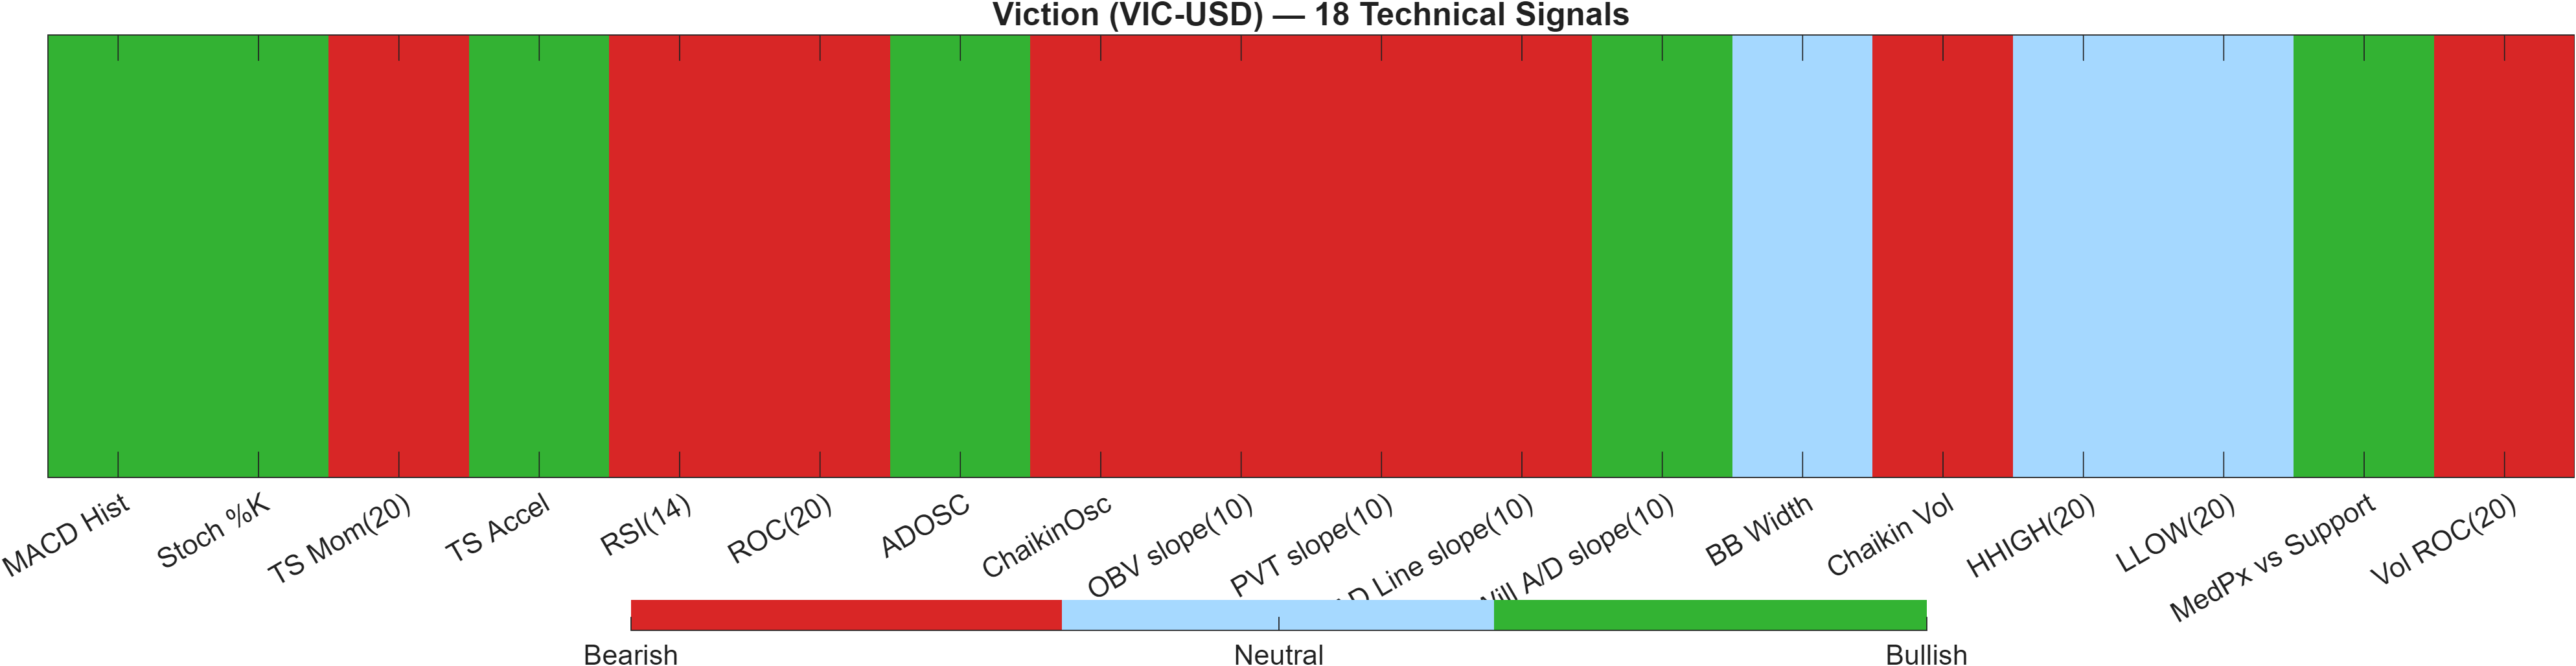
Signal alignment and score interpretation
The dashboard highlights a meaningful dispersion between indicator-level confluence and model-weighted technical ranking. On one hand, the 18‑signal confluence score is -0.167 (Neutral), indicating the raw signal set is not uniformly bearish. On the other hand, the DRL technical rank is #648 out of 800 with a Bearish label and -0.620 score, pulling the blended result to an overall technical score of -0.303 (Bearish). That gap matters because it suggests that while several indicators may be stabilizing, the broader technical state (as learned by the DRL framework) still resembles weaker historical patterns for favorable behavior.
The blended breakdown—Bull 6 / Bear 9 / Neutral 3—also supports the idea that the market is not in a clean uptrend repair yet. Mixed tapes often show “green shoots” in faster signals while slower or flow-sensitive indicators remain negative. This is consistent with the earlier trend read (bearish MA relationships) and with momentum being only mildly constructive (MACD histogram near 0.0007 rather than strongly positive).
The most actionable interpretation is not that any single oscillator is “right,” but that the system is currently tilted bearish while allowing for a non-trivial stabilization pathway. A decisive shift would typically require improvement in the blended score (not just the confluence score), and—crucially—confirmation through structure at 0.0980 rather than repeated mean reversion within the range.
Signal table (Bull/Bear/Neutral)
| Indicator | Value | Signal |
|---|---|---|
| MACD Hist | 0.0006799 | Bullish |
| Stoch %K | 14.28 | Bullish |
| TS Mom(20) | -0.006659 | Bearish |
| TS Accel | 0.007879 | Bullish |
| RSI(14) | 44.99 | Bearish |
| ROC(20) | -16.34 | Bearish |
| ADOSC | 6.007 | Bullish |
| ChaikinOsc | -2.78e+06 | Bearish |
| OBV slope(10) | -8.993e+06 | Bearish |
| PVT slope(10) | -5.802e+05 | Bearish |
| AD Line slope(10) | -6.903e+06 | Bearish |
| Will A/D slope(10) | 0.0008247 | Bullish |
| BB Width | 0.2811 | Neutral |
| Chaikin Vol | 1.8 | Bearish |
| HHIGH(20) | 0.05927 | Neutral |
| LLOW(20) | 0.04245 | Neutral |
| MedPx vs Support | 0.0004144 | Bullish |
| Vol ROC(20) | -76.23 | Bearish |
Interpretation: Indicator-level signals form the base confluence, which is then adjusted using a separate AI-driven technical ranking model. The final technical score summarizes this combined view.
6) News sentiment + extractive gist
Note: Some headlines were matched using a looser (title-only) rule to avoid missing relevant coverage.
Sentiment score (avg): 0.000 | Positive: 0% | Neutral: 100% | Negative: 0%
KGNAI AI News Sentiment Score (normalized -1 to +1): Not available (as of —) | Label: Not available | Overall news score: 0.00
Positive Developments
Recent coverage across major financial outlets reads as directionally muted for VIC-USD specifically, but it still provides context for the broader crypto operating environment. The most constructive takeaway is that information flow appears to be dominated by compliance and operational headlines rather than asset-specific panic catalysts, aligning with the dataset’s 0.000 average sentiment and 100% neutral classification. In that setting, price behavior tends to be governed more by technical structure—such as whether VIC-USD can press toward 0.0980—than by narrative shocks. Separately, the presence of consumer-facing “recovery” content in the matched feed can be interpreted as a sign of ongoing retail attention to security and asset recovery themes, which is not inherently bullish but can coincide with heightened engagement during range-bound markets. Overall, the “positive” bucket is less about optimistic catalysts and more about an absence of strongly negative, asset-specific narrative pressure within the provided sample.
Neutral / Mixed Developments
The news mix is largely informational and repeats similar themes, which is consistent with the report’s Neutral sentiment profile and the absence of a normalized KGNAI news sentiment score (listed as Not available). Regulatory and platform-access developments can be market-relevant, yet the provided items do not translate into a clear directional impulse for VIC-USD; instead, they function as background conditions that can influence risk appetite, liquidity routing, and venue availability. This neutrality also mirrors the technical state: RSI bias is Neutral, MACD histogram is only slightly positive at 0.0007, and the market still sits under bearish moving-average structure. In short, the news tape is not supplying confirmation, so confirmation—if it arrives—would more likely come from price acceptance above resistance or from a volatility/volume expansion rather than from sentiment-driven repricing.
Negative / Risk Signals
The primary risk signal embedded in the matched coverage is regulatory and access friction within parts of the crypto ecosystem. Even when not directly linked to VIC-USD, such developments can contribute to episodic liquidity disruption, tighter onboarding, or shifts in where participation concentrates—all of which can affect smaller or mid-tier tokens through spreads and volatility. Additionally, the appearance of “recovery service” themed items can be a soft risk marker for the broader environment because it often coexists with elevated concern around fraud, hacks, or loss events. The dataset nevertheless categorizes the sample as 100% neutral, implying that—within this feed—risk is framed more as cautionary context than as acute negative sentiment. From a market-structure standpoint, the technical invalidation level remains explicit: a close below 0.0448 would align deteriorating price action with an already bearish moving-average configuration, increasing downside regime persistence risk.
- Whether sentiment remains neutral (0.000 avg) as price tests the 0.0980 resistance zone.
- Any shift from range conditions toward follow-through (e.g., sustained positive momentum beyond a 0.0007 MACD histogram reading).
- Whether downside structure reasserts via a close below 0.0448.
Sources referenced: Reuters, Bloomberg, Yahoo Finance, MarketWatch, Investing.com
7) Sources
Not available in the provided data.
You may also like: How KGNAI AI ranks instruments across global markets
Disclaimer: KGNAI provides AI-generated analytics and educational market commentary only. This is not financial advice. Markets involve risk. Always do your own research.