
VRSC-USD (Verus Coin) Technical & Rank Update — 22-Mar-2026 | Mixed Signals, Neutral Confluence
Verus Coin (VRSC-USD) enters 22-Mar-2026 with a rank profile that skews constructive on longer horizons, but with notable technical frictions in the current tape. In KGNAI’s cross-sectional universe of 800 ranked crypto instruments, the 3-month rank (#28) and monthly rank (#77) sit in the stronger cohort, while the weekly rank (#220) and the declared short-term view: Neutral point to reduced near-term clarity. On price structure, the moving-average read flags Close vs MA50 = Bearish and MA50 vs MA200 = Bearish, which can cap follow-through even when broader ranks are supportive. Momentum inputs are not decisively extended—RSI(14) at 45.76 reads neutral—while Bollinger Bandwidth at 0.1359 suggests an active volatility regime where level breaks matter more than narratives. Key decision zones remain support ~0.6784 and resistance ~0.9125, with sector-level news sentiment slightly negative (-0.055) but largely neutral in composition.
Key Takeaways
- Rank stance: Short Neutral (daily rank #103), Mid Bullish (monthly rank #77), Long Bullish (3-month rank #28).
- Technical confluence: Neutral (18-signal confluence 0.278; overall blended technical score -0.030).
- Key levels: Support ~0.6784 and Resistance ~0.9125 remain the primary probabilistic decision zones.
- News sentiment bias: Slightly negative/neutral mix (-0.055; 75% neutral share).
- Confirmation / invalidation: Break above 0.9125 with volume supports continuation; a close below 0.6784 elevates deterioration risk.
What KGNAI Measures
KGNAI evaluates assets using large cross-sectional datasets built from millions of structured data points. Inputs incorporate fundamental metrics, technical structures, and systematically processed news sentiment. Statistical models, machine learning, and AI frameworks are used to assess relative positioning, signal alignment, and probabilistic behavior across broad universes.
How to Read This Report
- Ranks are comparative across the tracked universe, not absolute price targets.
- Confluence reflects alignment among independent signal groups.
- Support/resistance levels are probabilistic decision zones, not guarantees.
- Sentiment provides contextual bias within the broader analytical framework.
1) KGNAI AI Analysis
Region: CRYPTO
Total universe size: 800 ranked instruments
- Daily rank: #103 out of 800 — Bullish
- Weekly rank: #220 out of 800 — Neutral
- Monthly rank: #77 out of 800 — Bullish
- 3-Monthly rank: #28 out of 800 — Bullish
The rank stack shows an asymmetric setup: longer-horizon positioning is materially stronger than the intermediate (weekly) read. The 3-month rank (#28) places VRSC-USD in the top slice of the 800-instrument universe, which typically aligns with better relative behavior when broad risk conditions are stable. The monthly rank (#77) reinforces that constructive bias, suggesting the recent regime has not fully broken despite pullbacks.
In contrast, the weekly rank (#220) is less supportive and matches the stated short-term view: Neutral. This type of divergence often reflects either (a) a consolidation phase that has not yet resolved, or (b) a market where dispersion increases and timing becomes more sensitive to level breaks. The daily rank (#103) remains bullish on a cross-sectional basis, but it is not as dominant as the 3-month signal—consistent with “bullish tilt, but not clean.”
The key analytical point is timeframe alignment. With weekly neutrality sitting between bullish monthly and bullish 3-month readings, VRSC-USD is best characterized as constructive in regime, contested in execution. That profile tends to reward disciplined confirmation: improved price structure and supportive momentum/volume behavior can re-synchronize the stack; a deterioration below key levels can pull the higher-timeframe edge back toward neutrality.
2) Price & trend overview
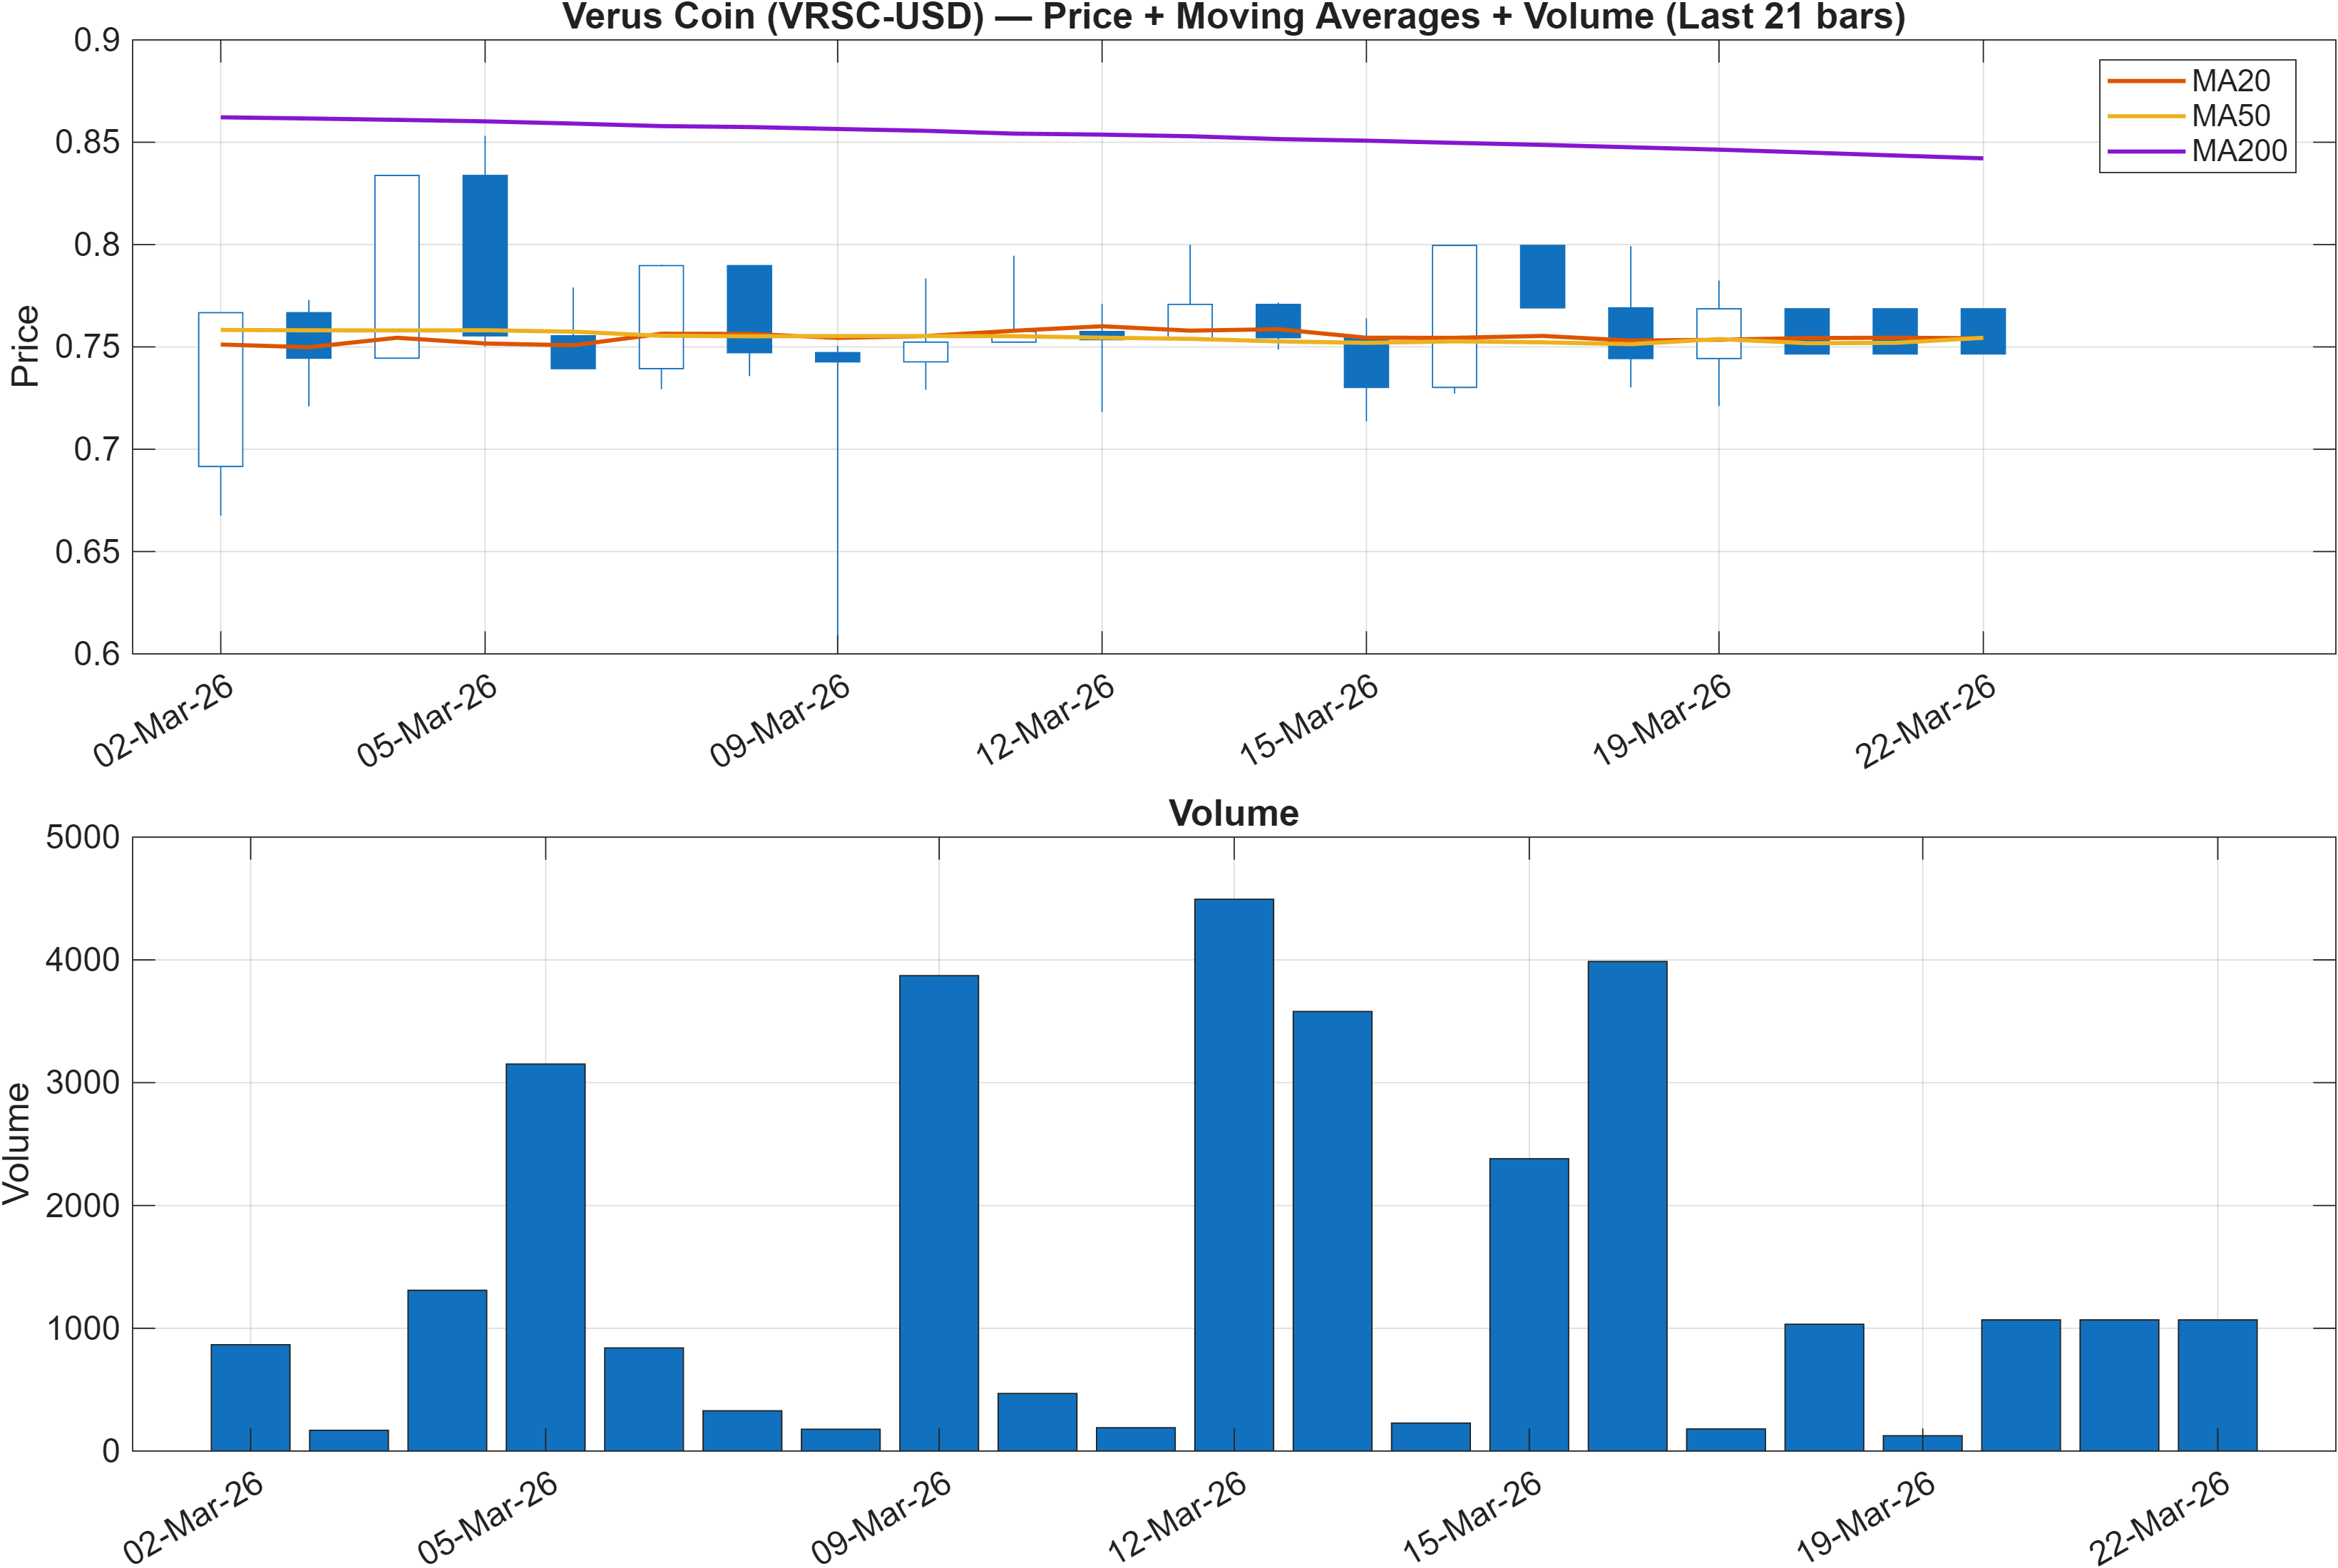
Trend diagnostics are currently defined by a bearish moving-average configuration. The snapshot explicitly flags Close vs MA50 = Bearish and MA50 vs MA200 = Bearish, which places the market in a structure where rallies can face overhead supply and where trend-following systems typically demand more proof before re-risking. This is a meaningful counterweight to the favorable longer-horizon ranks (#77 monthly, #28 over 3 months).
From a market-structure perspective, the most useful framing is regime vs path: the cross-sectional ranks imply VRSC-USD has been behaving relatively well across broader windows, yet the moving averages suggest the near-term trend path remains vulnerable. When those two layers disagree, the market often shifts into a “confirmation-first” posture, where the probability mass clusters around level-based outcomes rather than smooth trend continuation.
The practical implication is not prediction; it is conditionality. A market can maintain bullish longer-horizon ranks while still requiring repair in price structure. In this setup, the next durable move typically emerges when price behavior begins to re-align with the faster trend proxy (MA50), and participation (volume) confirms. Until then, the bearish MA stacking argues for treating upside attempts as tests rather than conclusions—especially with volatility active elsewhere in the dashboard.
3) Momentum & volatility dashboard
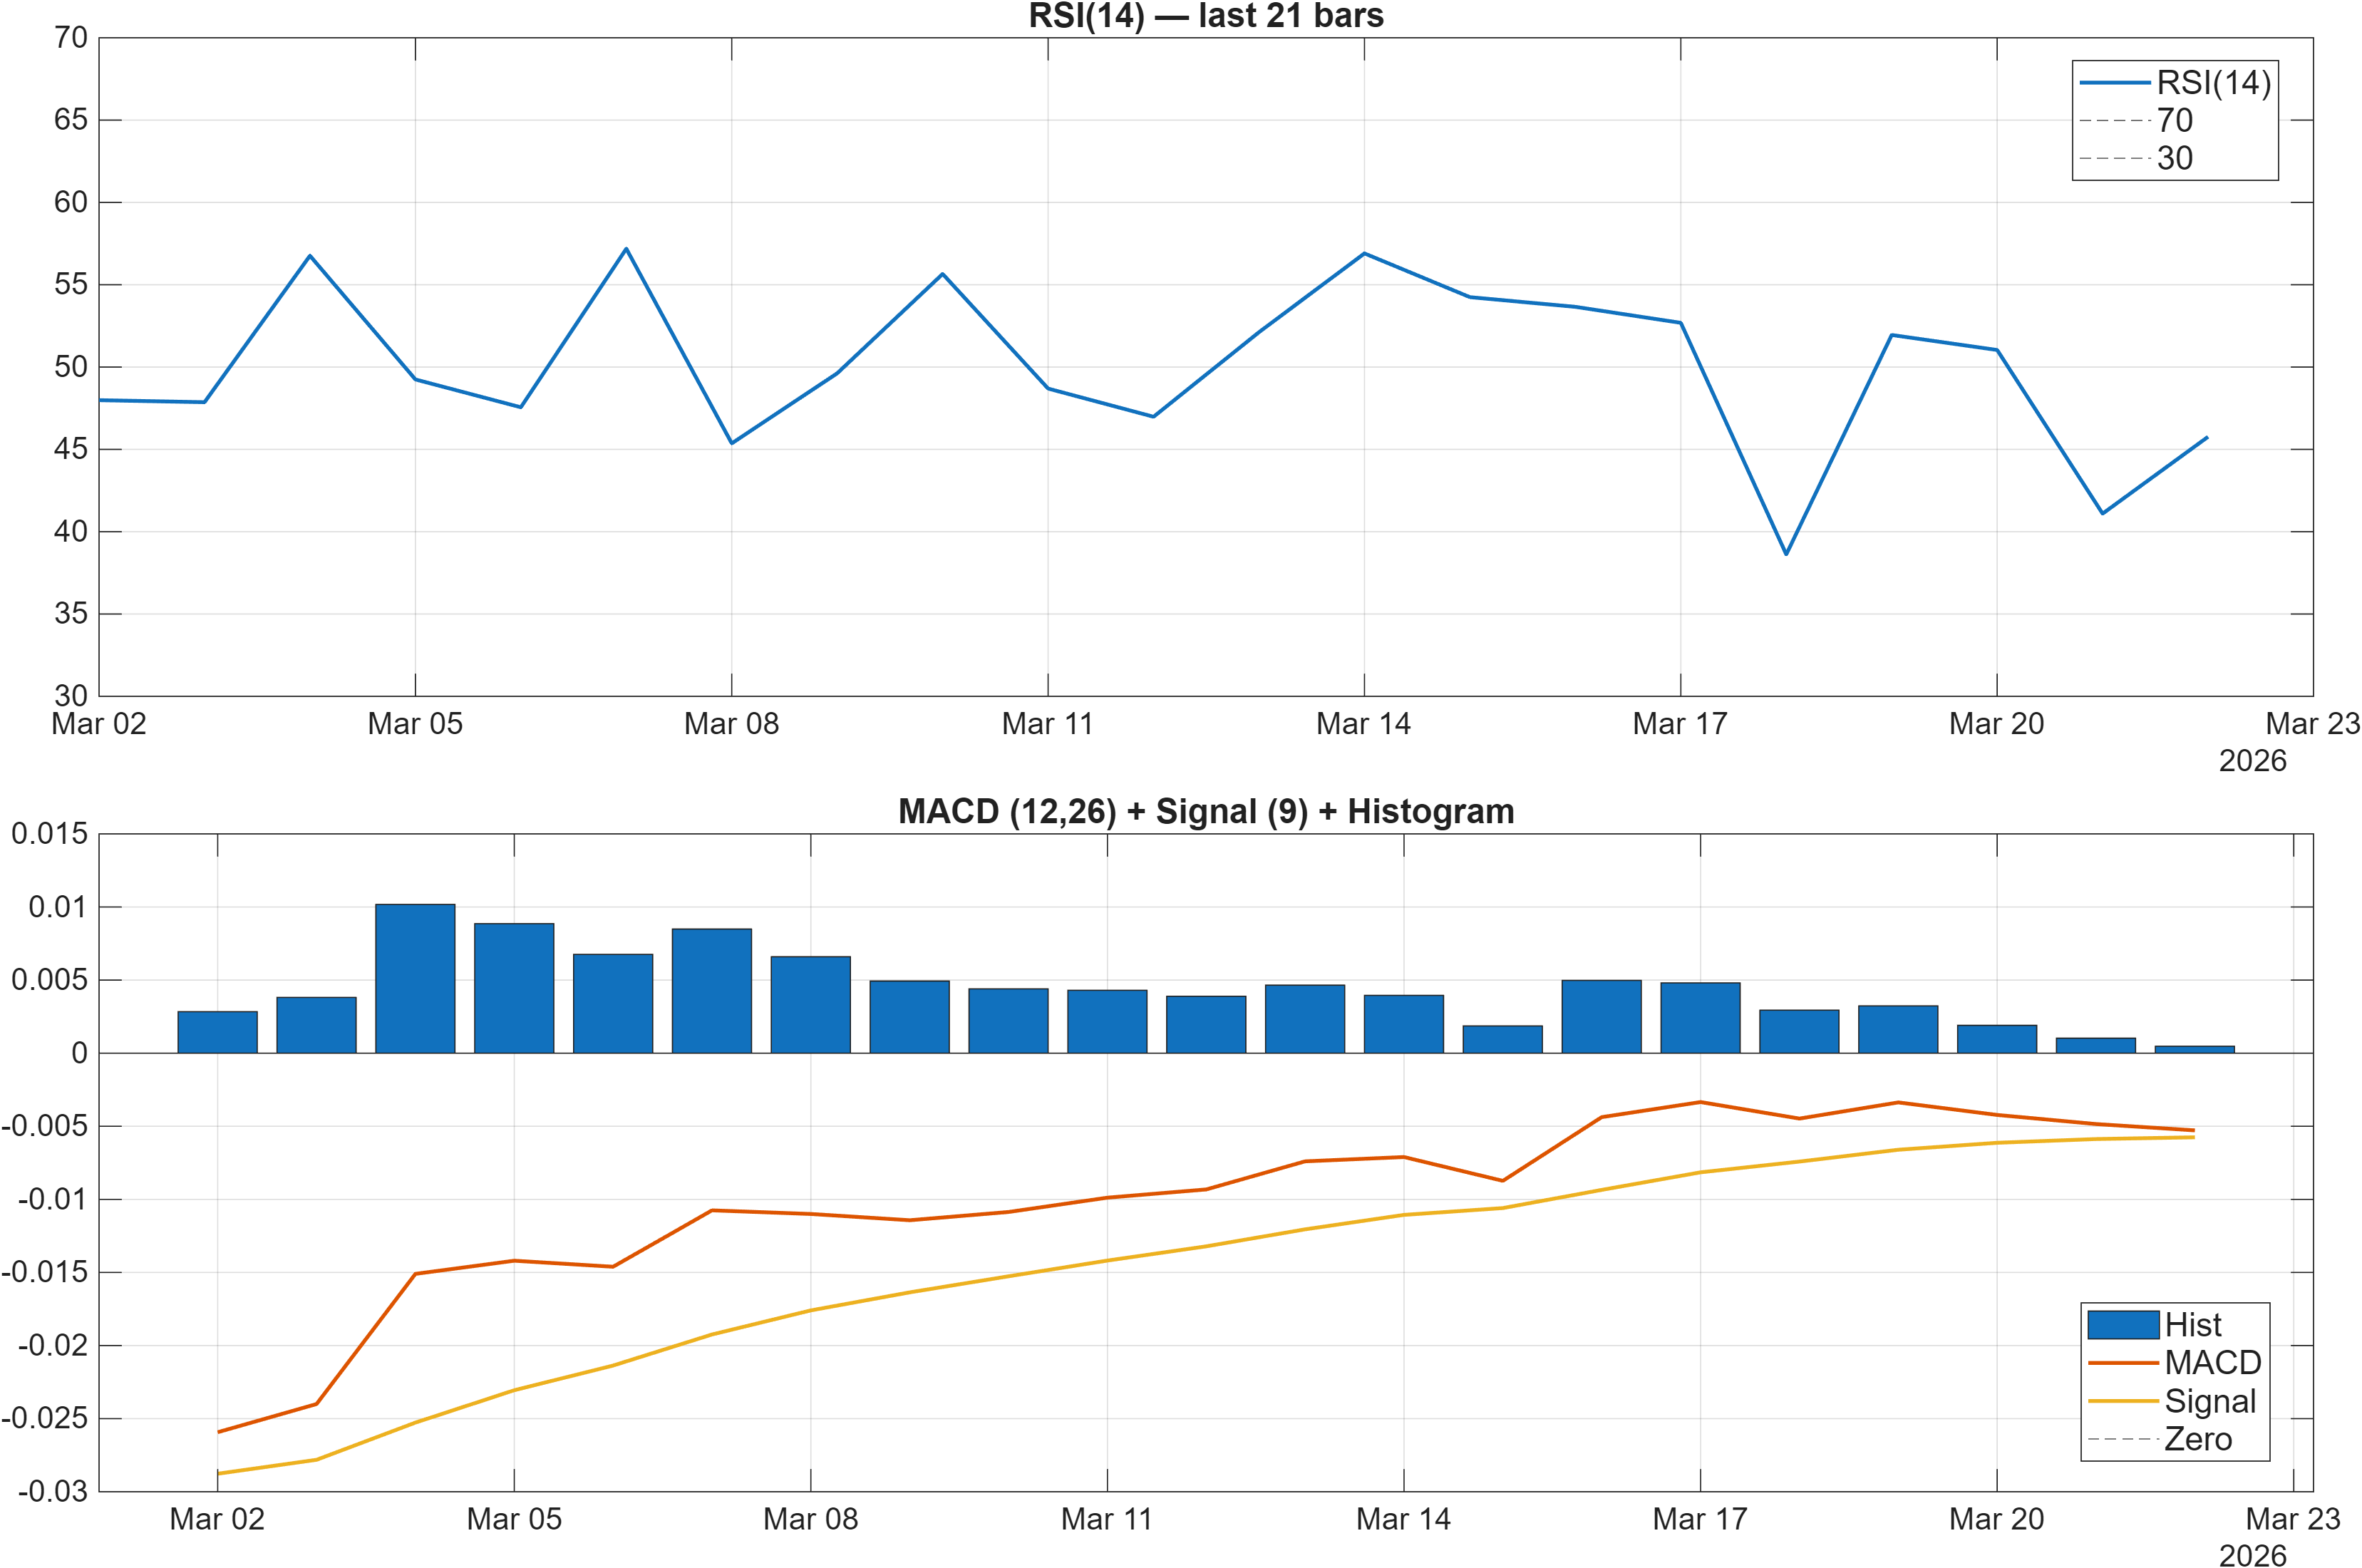
Momentum is stable but not forceful in the current read. The stated RSI bias = Neutral aligns with RSI(14) at 45.76, a zone that typically reflects balance rather than trend acceleration. That matters because the moving-average layer is bearish; without a momentum push, bearish trend structure can persist longer than many participants expect.
At the same time, MACD inputs provide a modest offset. The dashboard notes MACD hist = 0.0005 (and the signal table shows MACD Hist 0.0004739 as Bullish). Positive histogram readings can be consistent with early-stage repair or short-term rebounds, but by themselves they do not invalidate bearish MA stacking. The more informative question is whether positive MACD can persist while RSI stays neutral—this often produces compression rather than breakout, particularly when price remains below key trend references.
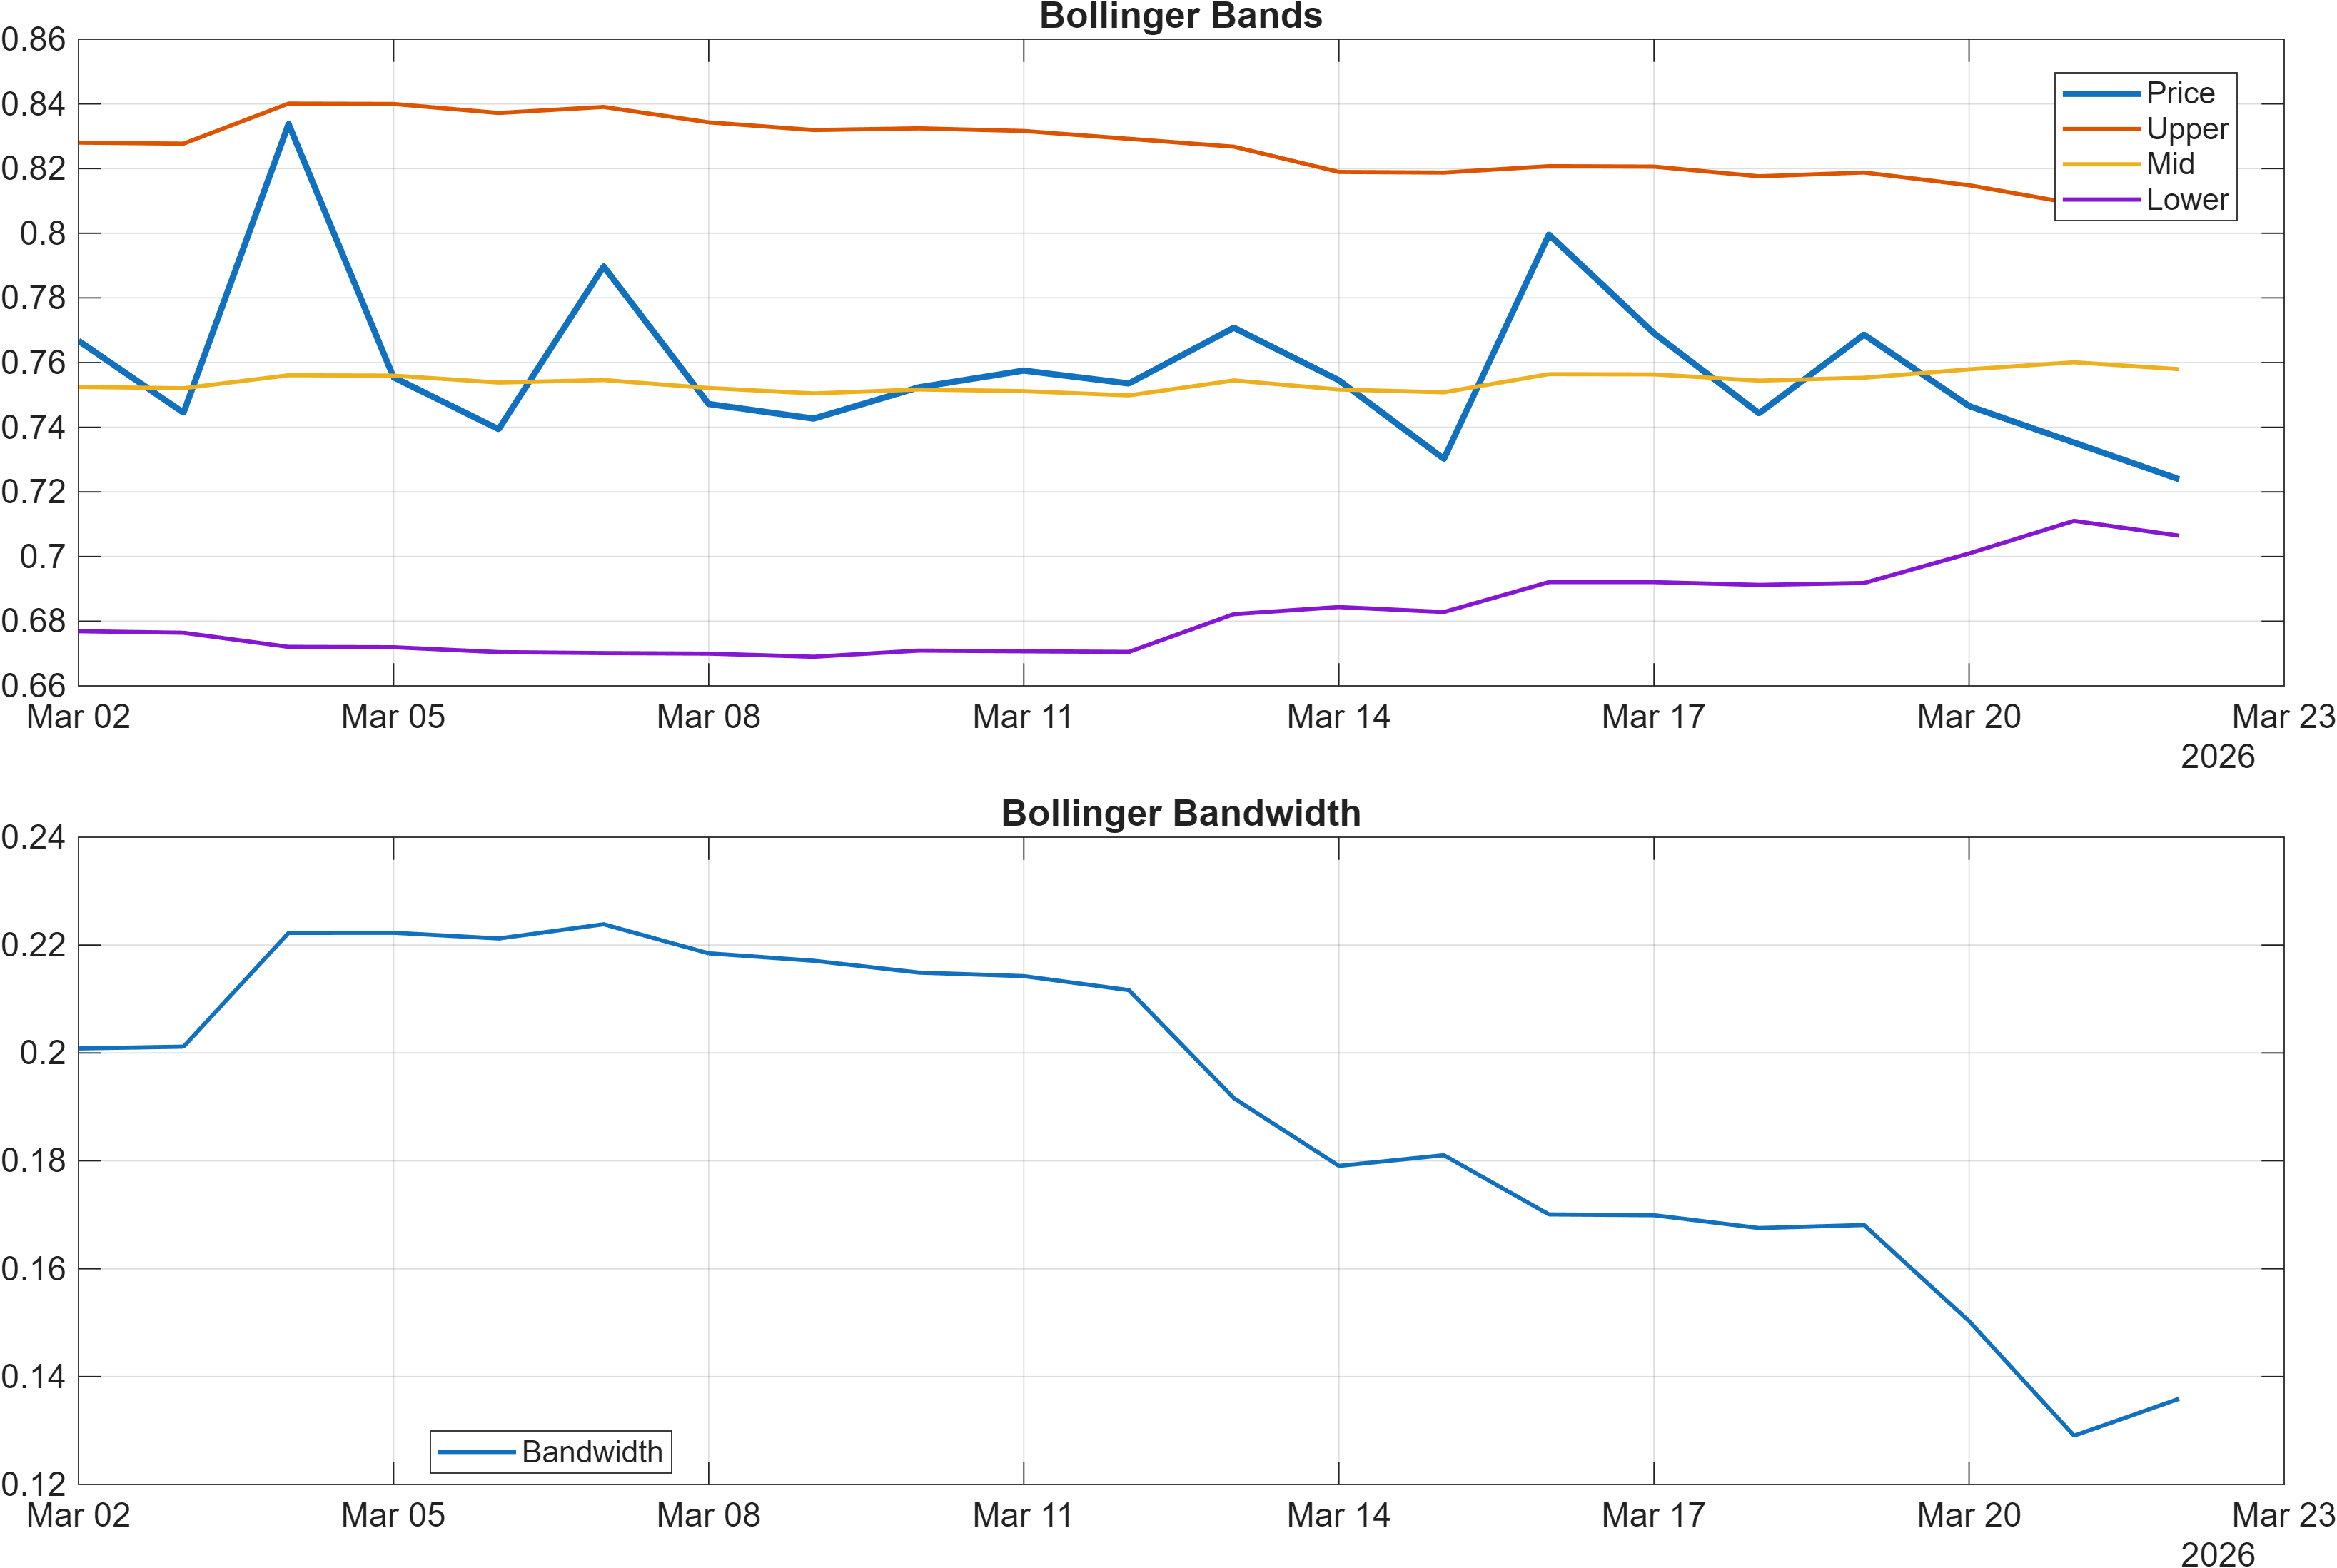
Volatility regime is clearly present via Bollinger Bandwidth at 0.1359. Active bandwidth tends to widen outcome dispersion: moves can travel farther, but timing error bars increase. In these conditions, level-based evaluation (support/resistance) typically dominates oscillator interpretation. If volatility remains elevated while RSI stays neutral, the market often expresses itself through sharp swings within a range rather than a clean directional trend.
4) Support / Resistance zones
Support ~ 0.6784 | Resistance ~ 0.9125
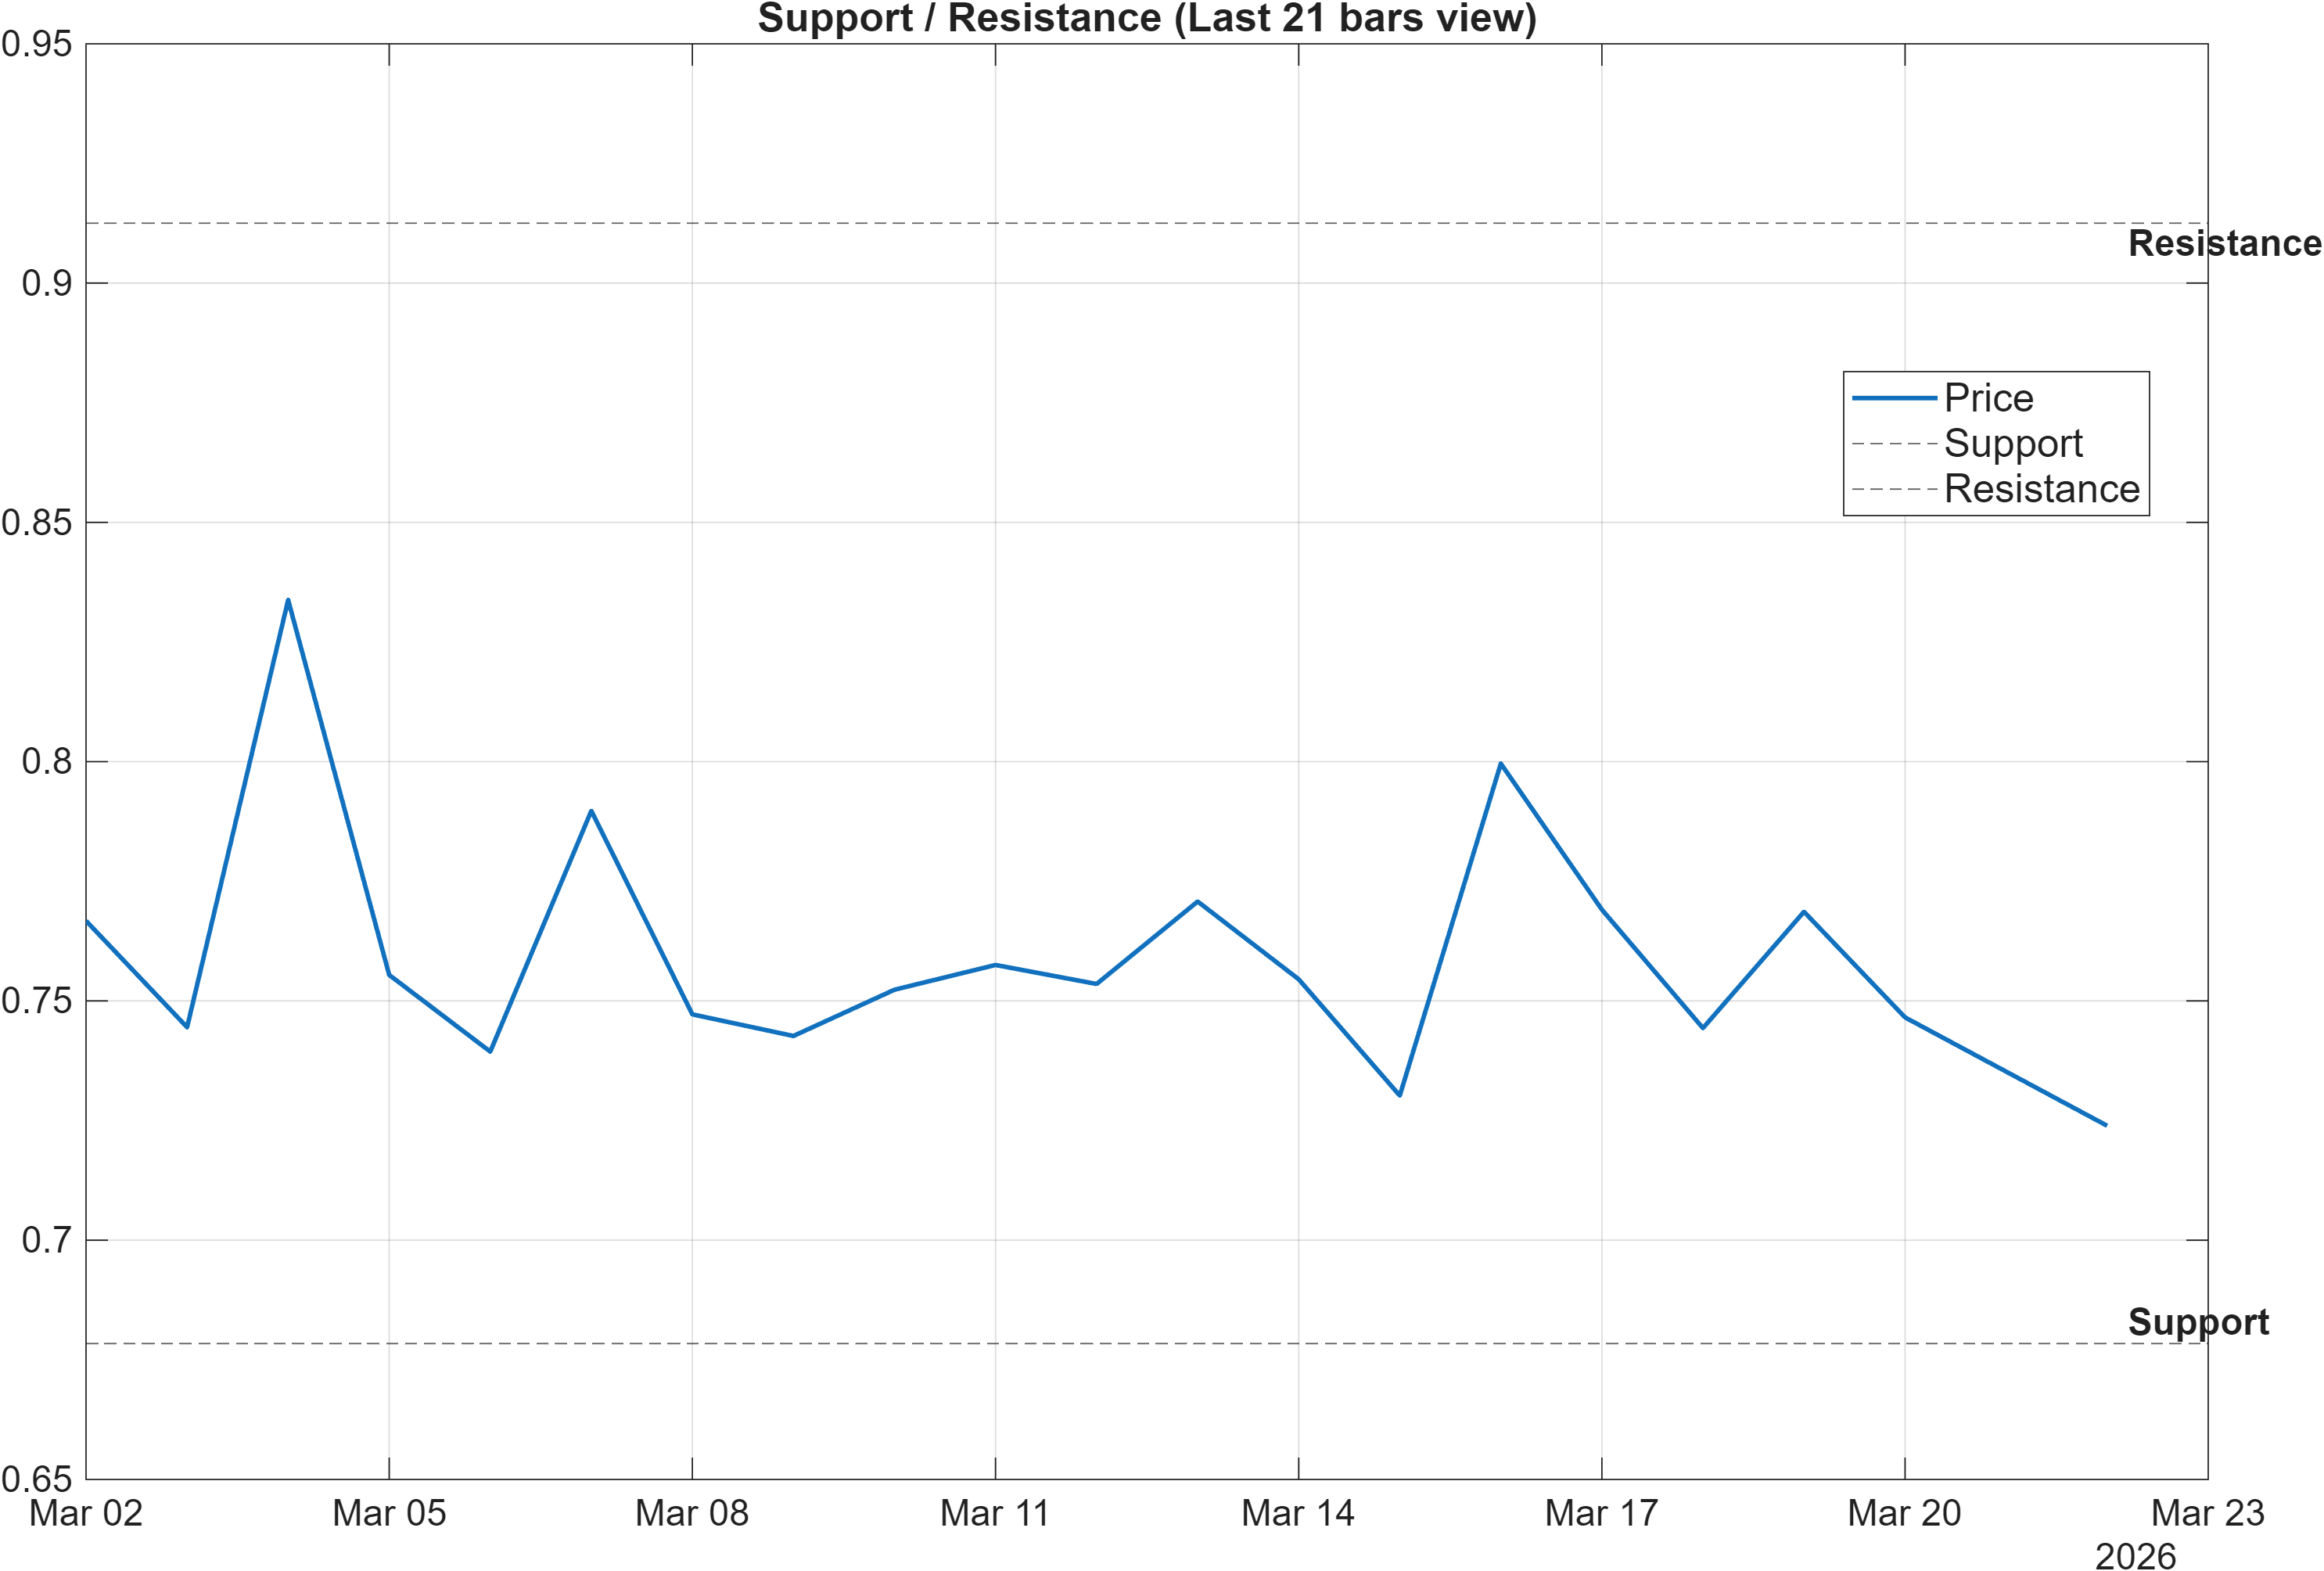
With a neutral confluence backdrop and an active volatility regime (0.1359 bandwidth), VRSC-USD’s most actionable information sits in the 0.6784 / 0.9125 corridor. These are not deterministic lines; they function as probabilistic decision zones where market participants tend to reveal intent through follow-through and participation.
The scenario framing provided is appropriately conditional: a break above resistance with volume points toward continuation, while a close below support increases deterioration risk. This is especially relevant given the bearish trend layer (Close vs MA50 bearish; MA50 vs MA200 bearish). In bearish MA conditions, resistance tests can fail more frequently, which raises the bar for what “confirmation” should look like—typically persistence above the level rather than a single intraday spike.
The ranks add nuance: longer-horizon strength (#28 over 3 months) suggests the market may be more resilient on pullbacks than a purely bearish technical structure would imply. That makes support behavior particularly informative. If price holds above 0.6784 while momentum remains neutral (RSI ~45.76), the market can remain in a constructive range-building process. Conversely, a decisive breakdown below 0.6784 would align trend structure and level structure to the downside, a configuration that typically worsens risk asymmetry even if the longer-term ranks were previously supportive.
5) Quant Technical Dashboard (18 Signals)
KGNAI AI Technical Analysis Score (Deep Reinforcement Learning): Rank #699 out of 800 (Rank 1 represents the strongest technical positioning and a higher probability of favorable price behavior. As ranks increase toward the maximum, the probability of favorable outcomes weakens and bearish positioning becomes more dominant.) | Label: Bearish | Score: -0.748
18-Signal Technical Confluence Score: 0.278 (Neutral)
Overall Technical Score (18-signal confluence + DRL rank blend): -0.030 (Neutral)
Note: The blended score reflects signal strength weighted against broader AI technical ranking, which may temporarily diverge.
Blended technical score breakdown: -0.030 (Neutral | Bull 9 / Bear 4 / Neutral 5)
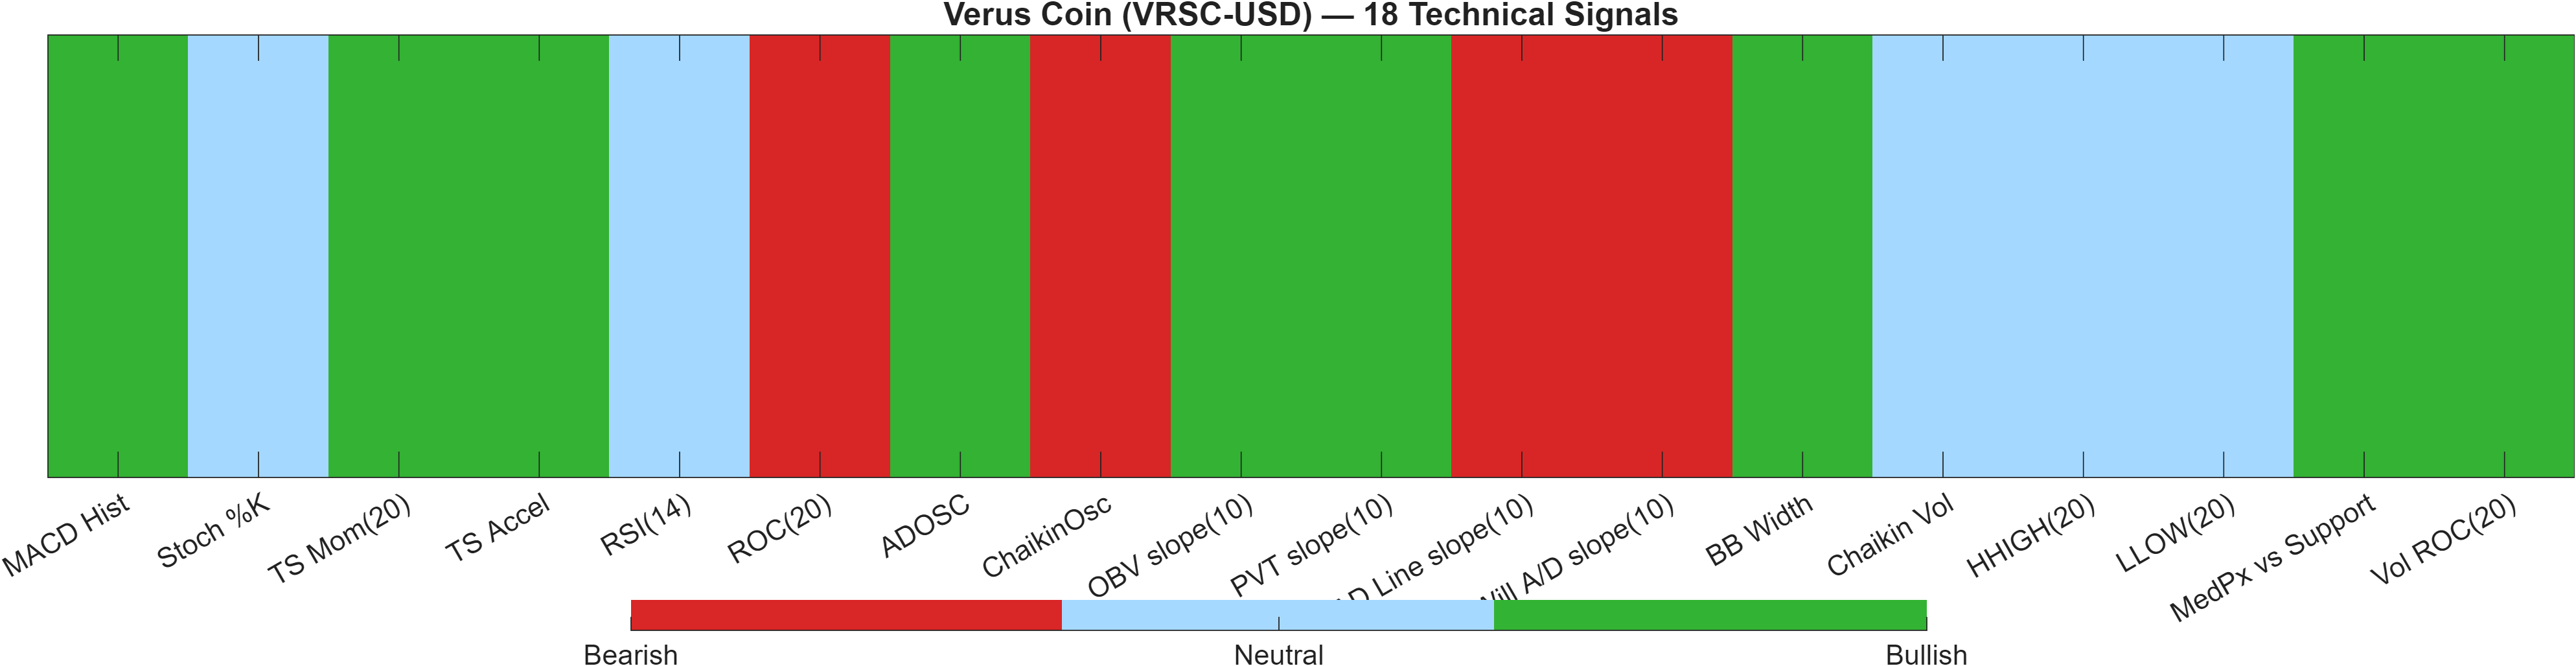
The technical layer is best described as neutral on confluence, conflicted on model ranking. The 18-signal confluence score of 0.278 (Neutral) indicates a mild bullish lean (the blend shows Bull 9 / Bear 4 / Neutral 5) but not a high-conviction clustering. However, the separate Deep Reinforcement Learning technical rank is #699 out of 800 with a Bearish label and score -0.748, which meaningfully pressures the composite.
This divergence matters because it suggests the market’s surface indicators (a slight majority of bullish signals) may not fully capture the broader technical positioning the DRL model is penalizing—often related to pattern persistence, drawdown characteristics, or multi-feature interactions that are not obvious from single indicators. The resulting overall technical score of -0.030 (Neutral) is effectively a compromise: modest signal positives exist, but the AI technical regime classification remains cautious.
Selected signal details align with this “mixed-but-not-broken” view: ROC(20) at -2.765 is bearish (a drag on directional momentum), while MACD Hist 0.0004739 and BB Width 0.1359 print bullish in the table (consistent with positive short-term impulse and a volatility regime that can support larger moves). Meanwhile, Stoch %K at 38.19 and RSI(14) at 45.76 remain neutral—often characteristic of markets that are deciding whether a rebound becomes a trend.
Signal table (Bull/Bear/Neutral)
| Indicator | Value | Signal |
|---|---|---|
| MACD Hist | 0.0004739 | Bullish |
| Stoch %K | 38.19 | Neutral |
| TS Mom(20) | 0.002059 | Bullish |
| TS Accel | 0.01104 | Bullish |
| RSI(14) | 45.76 | Neutral |
| ROC(20) | -2.765 | Bearish |
| ADOSC | 0.8815 | Bullish |
| ChaikinOsc | -510.1 | Bearish |
| OBV slope(10) | 2802 | Bullish |
| PVT slope(10) | 312.5 | Bullish |
| AD Line slope(10) | -1690 | Bearish |
| Will A/D slope(10) | -0.02144 | Bearish |
| BB Width | 0.1359 | Bullish |
| Chaikin Vol | -34.65 | Neutral |
| HHIGH(20) | 0.8532 | Neutral |
| LLOW(20) | 0.6091 | Neutral |
| MedPx vs Support | 0.07911 | Bullish |
| Vol ROC(20) | 532 | Bullish |
The highest-value takeaway from this dashboard is the neutral composite with a bearish DRL overlay. When those disagree, markets often resolve through price acceptance/rejection at key levels rather than through oscillator drift.
6) News sentiment + extractive gist
Note: Instrument-specific news matches were not found, so the digest includes broader market/sector headlines. Links are provided for verification.
Sentiment score (avg): -0.055 | Positive: 6% | Neutral: 75% | Negative: 19%
KGNAI AI News Sentiment Score (normalized -1 to +1): Not available (as of —) | Label: Not available | Overall news score: -0.05
Positive Developments
Recent coverage across major financial outlets indicates the constructive side of the crypto narrative remains anchored in macro-awareness and risk-hedging discourse. Discussion of stagflation dynamics continues to frame crypto—particularly Bitcoin—as part of a broader debate about inflation sensitivity, liquidity conditions, and policy constraints. While this is not instrument-specific, it can still affect smaller assets like VRSC-USD through sector beta and flows. The sentiment mix, however, shows that outright optimism is limited (6% positive), suggesting the “positive” channel is more about contextual support than exuberant demand. In practical market terms, that environment tends to reward technical confirmation (breaks, holds, and volume) more than story-driven chasing, which fits VRSC-USD’s current setup: bullish longer-horizon ranks alongside neutral confluence and bearish moving-average structure.
Neutral / Mixed Developments
The dominant feature of the news tape is neutrality: 75% of items score neutral, and the average sentiment sits only slightly negative at -0.055. That profile usually corresponds to a market digesting a wide range of inputs without a single catalyst taking control. For VRSC-USD, that matters because the technical picture is also “in-between” (overall technical score -0.030, neutral). When both tape and technicals lean toward mixed/neutral, the most reliable decision points often come from hard levels—specifically 0.6784 support and 0.9125 resistance—rather than from incremental narrative shifts. Not available in the provided data: a normalized KGNAI news sentiment score and label for this instrument.
Negative / Risk Signals
Risk coverage remains present and non-trivial, reflected in the 19% negative share and the slightly negative aggregate score (-0.055). Recent reporting across major financial outlets highlights recurring sector stressors: security incidents, depegging events, and regulatory/legal scrutiny. Even when not tied directly to VRSC-USD, these themes can increase correlation and raise the market’s risk premium, particularly for smaller or less liquid tokens. In a chart context, that backdrop can amplify the importance of trend structure: with Close vs MA50 = Bearish and MA50 vs MA200 = Bearish, negative sector impulses may translate into faster tests of support. The cleanest risk signal for this setup remains the level condition already defined: a close below 0.6784 would shift the balance toward deterioration risk.
- Whether sector risk headlines coincide with a failed retest near 0.9125 (rejection vs acceptance).
- Any shift in the sentiment mix away from the current 75% neutral composition.
- Signs that volatility (Bandwidth 0.1359) compresses or expands into the next level test.
Sources referenced: Reuters, Bloomberg, Yahoo Finance, MarketWatch, Investing.com
7) Sources
Source URLs are listed below exactly as provided in the draft. For this report’s news digest, instrument-specific matches were not found; the items reflect broader market/sector coverage.
- Coinbase-backed CoinDCX founders questioned in fraud case: Report — https://cointelegraph.com/news/coinbase-backed-coindcx-founders-questioned-report?utm_source=rss_feed&utm_medium=rss&utm_campaign=rss_partner_inbound
- ‘Hawk Tuah’ girl Hailey Welsh says memecoin implosion ‘traumatized’ her — https://cointelegraph.com/news/hawk-tuah-hailey-welsh-memecoin-traumatized?utm_source=rss_feed&utm_medium=rss&utm_campaign=rss_partner_inbound
- Resolv Labs’ stablecoin depegs as attacker mints millions of tokens — https://cointelegraph.com/news/resolv-labs-stablecoin-depegs-attacker-mints-millions-of-tokens?utm_source=rss_feed&utm_medium=rss&utm_campaign=rss_partner_inbound
- Nevada judge temporarily blocks Kalshi from operating in the state — https://cointelegraph.com/news/nevada-judge-temporarily-blocks-kalshi-from-operating-in-the-state?utm_source=rss_feed&utm_medium=rss&utm_campaign=rss_partner_inbound
- CFTC staff clarify expectations on using crypto as collateral — https://cointelegraph.com/news/cftc-staff-clarify-expectations-crypto-collateral?utm_source=rss_feed&utm_medium=rss&utm_campaign=rss_partner_inbound
- Here’s what happened in crypto today — https://cointelegraph.com/news/what-happened-in-crypto-today?utm_source=rss_feed&utm_medium=rss&utm_campaign=rss_partner_inbound
- Brazil's finance minister shelves crypto tax policy due to election: Report — https://cointelegraph.com/news/brazil-finance-minister-shelves-crypto-tax?utm_source=rss_feed&utm_medium=rss&utm_campaign=rss_partner_inbound
- SEC crypto guidance puts the 'final nail' in the Gensler era: Analyst — https://cointelegraph.com/news/sec-crypto-guidance-final-nail-gensler-era?utm_source=rss_feed&utm_medium=rss&utm_campaign=rss_partner_inbound
You may also like: How KGNAI AI ranks instruments across global markets
Disclaimer: KGNAI provides AI-generated analytics and educational market commentary only. This is not financial advice. Markets involve risk. Always do your own research.