
WBNB-USD (Wrapped BNB) — 13-Mar-2026 Quant Snapshot with Bullish Technical Confluence, Neutral Mid-Term Rank
Wrapped BNB (WBNB-USD) screens as a short-term leader within KGNAI’s CRYPTO universe while the medium-to-longer horizon remains more balanced. In an 800-instrument cross-section, the Daily rank (#31) and Weekly rank (#34) sit in the upper tier, while the 3-Monthly rank (#185) shifts the profile toward neutrality. Technically, the signal stack is constructive: the 18-signal confluence score is 0.722 (Bullish) and the blended technical score is 0.712 (Bullish), supported by momentum measures including RSI(14) at 63.85 and a positive MACD histogram (7.9238 / 7.924). Volatility is not extreme with Bollinger Bandwidth at 0.1231, suggesting trend conditions may persist without requiring immediate expansion. Key decision zones are clearly defined at Support ~ 592.0222 and Resistance ~ 936.0535. News flow is broadly sector-level and reads neutral overall (sentiment avg 0.034; 81% neutral).
- Rank stance: Short-term Bullish (Daily #31 / Weekly #34); Mid-term Neutral bias via 3-Monthly #185; Monthly remains Bullish (#90).
- Technical confluence: Bullish (18-signal 0.722; blended 0.712; Bull 13 / Bear 0 / Neutral 5).
- Key levels: Support ~ 592.0222 | Resistance ~ 936.0535.
- News sentiment bias: Neutral (avg 0.034; 12% positive / 81% neutral / 6% negative; instrument-specific matches not found).
- Confirmation / invalidation: Continuation risk-reduction improves on a break above 936.0535 with volume; deterioration risk increases on a close below 592.0222.
KGNAI evaluates assets using large cross-sectional datasets built from millions of structured data points. Inputs incorporate fundamental metrics, technical structures, and systematically processed news sentiment. Statistical models, machine learning, and AI frameworks are used to assess relative positioning, signal alignment, and probabilistic behavior across broad universes.
- Ranks are comparative across the tracked universe, not absolute price targets.
- Confluence reflects alignment among independent signal groups.
- Support/resistance levels are probabilistic decision zones, not guarantees.
- Sentiment provides contextual bias within the broader analytical framework.
1) KGNAI AI Analysis
Region: CRYPTO
Total universe size: 800 ranked instruments
- Daily rank: #31 out of 800 — Bullish
- Weekly rank: #34 out of 800 — Bullish
- Monthly rank: #90 out of 800 — Bullish
- 3-Monthly rank: #185 out of 800 — Neutral
WBNB-USD’s cross-sectional profile shows near-term leadership with a more moderate intermediate backdrop. The Daily rank (#31) and Weekly rank (#34) place the asset in the upper tier of the 800-instrument universe, indicating that multiple tests are currently favoring short-horizon behavior. The Monthly rank (#90) remains constructive, but the 3-Monthly rank (#185) shifts the balance toward a neutral regime—a typical footprint when a strong run is present but longer-window dispersion has not fully rotated into the top cohort.
The term labels formalize that split: Short-term Bullish alongside Mid-term Neutral and Long-term Neutral. In practice, this is less about contradiction and more about horizon dependency: shorter windows can respond quickly to momentum and flow, while multi-month rank tests tend to penalize drawdown history or slower-moving relative strength.
This rank structure is consistent with the technical layer later in the report, where signal confluence is explicitly Bullish (overall blended technical score 0.712) while volatility is not showing a runaway expansion (bandwidth 0.1231). That combination often aligns with continuation that still requires level-based confirmation, rather than a one-way, high-volatility trend.
KGNAI ranks each instrument across large universes using multiple proprietary AI tests and statistical models (millions of data points). Lower ranks generally indicate stronger probability of favorable performance behavior, while higher ranks indicate weaker probability and more bearish positioning.
Term view: Short-term: Bullish. Mid-term: Neutral. Long-term: Neutral.
Want the full universe and complete rank tables? Unlock full access on KGNAI: https://www.kgnai.com/pricing
2) Price & trend overview
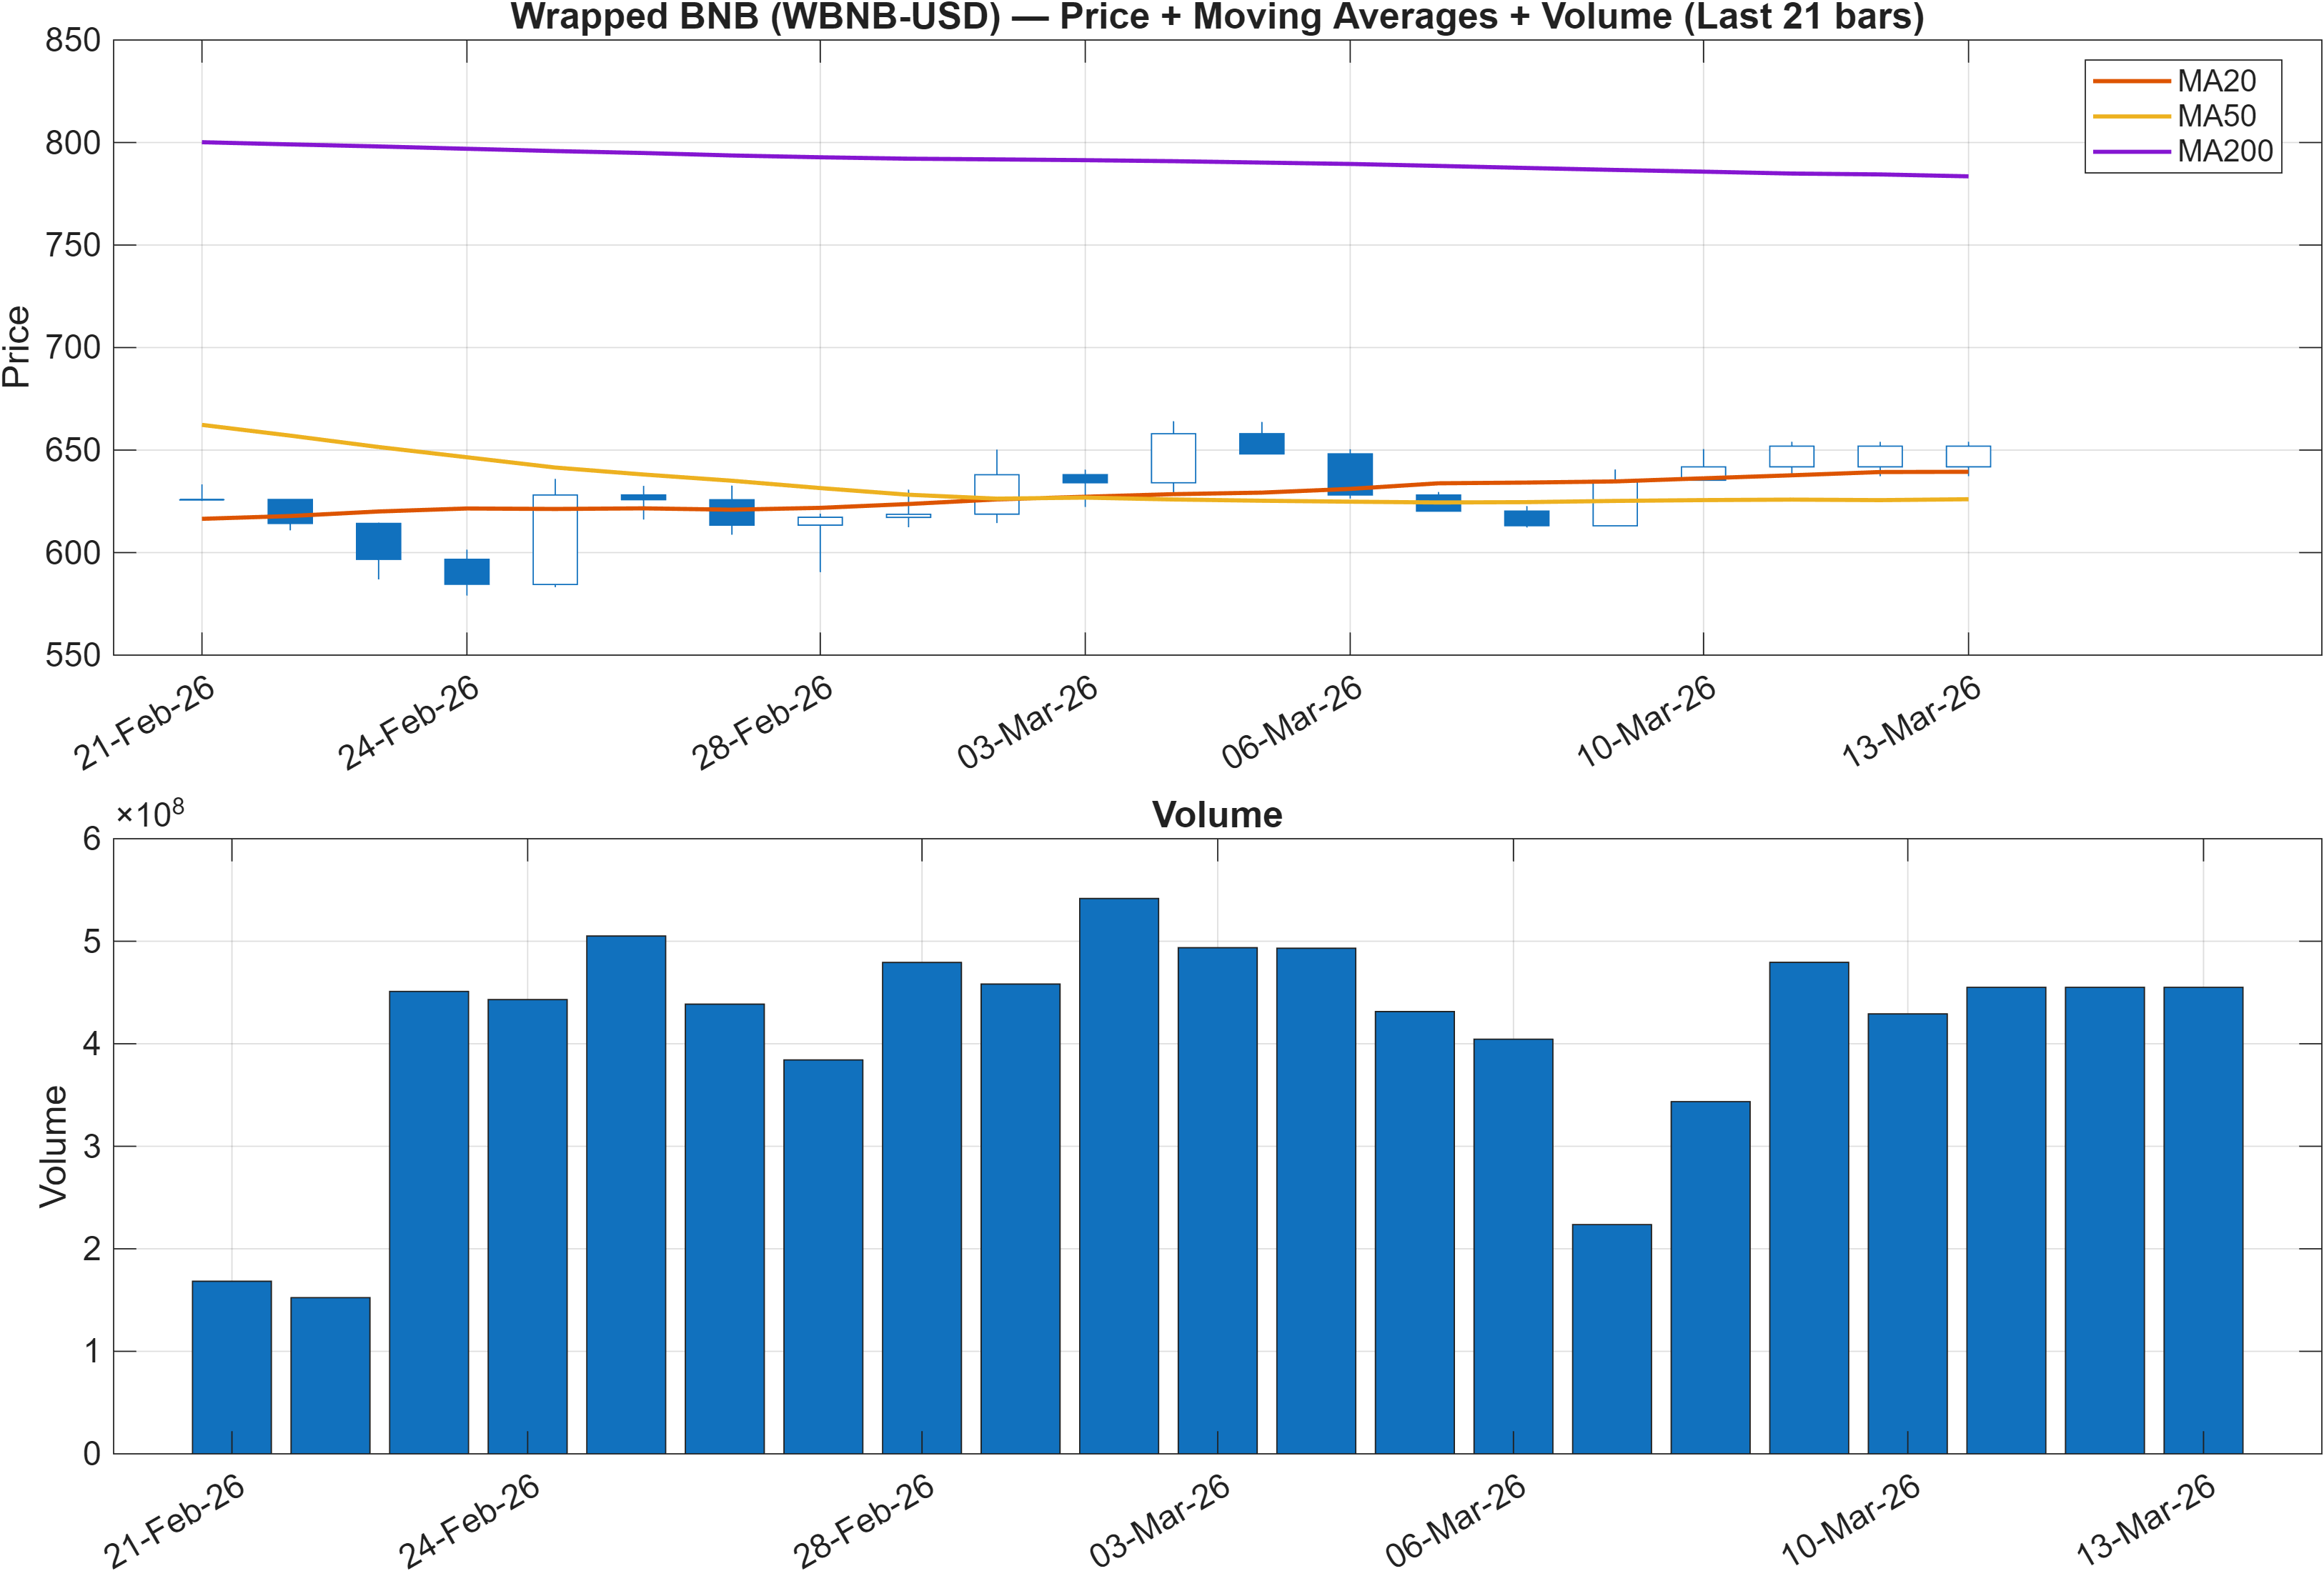
Interpretation: Close vs MA50 = Bullish, MA50 vs MA200 = Bearish.
The trend map is mixed by design: price action is positioned favorably versus the intermediate moving average (Close vs MA50 = Bullish), while the longer-horizon trend filter remains challenged (MA50 vs MA200 = Bearish). This is a classic configuration for an asset attempting to recover within a broader, slower-moving downtrend or consolidation regime. It also helps explain why the rank stack is stronger on Daily/Weekly than on 3-Monthly (#185).
From a market-structure standpoint, the key question is whether the current push is a tactical extension or the start of a more durable transition. The report’s defined level framework—Support ~ 592.0222 and Resistance ~ 936.0535—provides the relevant decision zones for that question, especially when interpreted alongside volume behavior shown in Figure 1.
Because the MA50 vs MA200 condition is still bearish, breakouts are more vulnerable to retracement unless they are reinforced by momentum persistence (see RSI(14) 63.85) and positive trend acceleration signals (TS Accel 178.4). Conversely, holding above support while maintaining constructive momentum would keep the nearer-term rank advantage (Daily #31; Weekly #34) consistent with trend continuation at the tactical horizon.
In short, the price/MA framework does not argue against the bullish short-term read; it frames it as a continuation attempt within an incomplete longer-term repair. That difference matters for positioning discipline and for how strictly traders may want to use the support/resistance bands as validation points.
3) Momentum & volatility dashboard
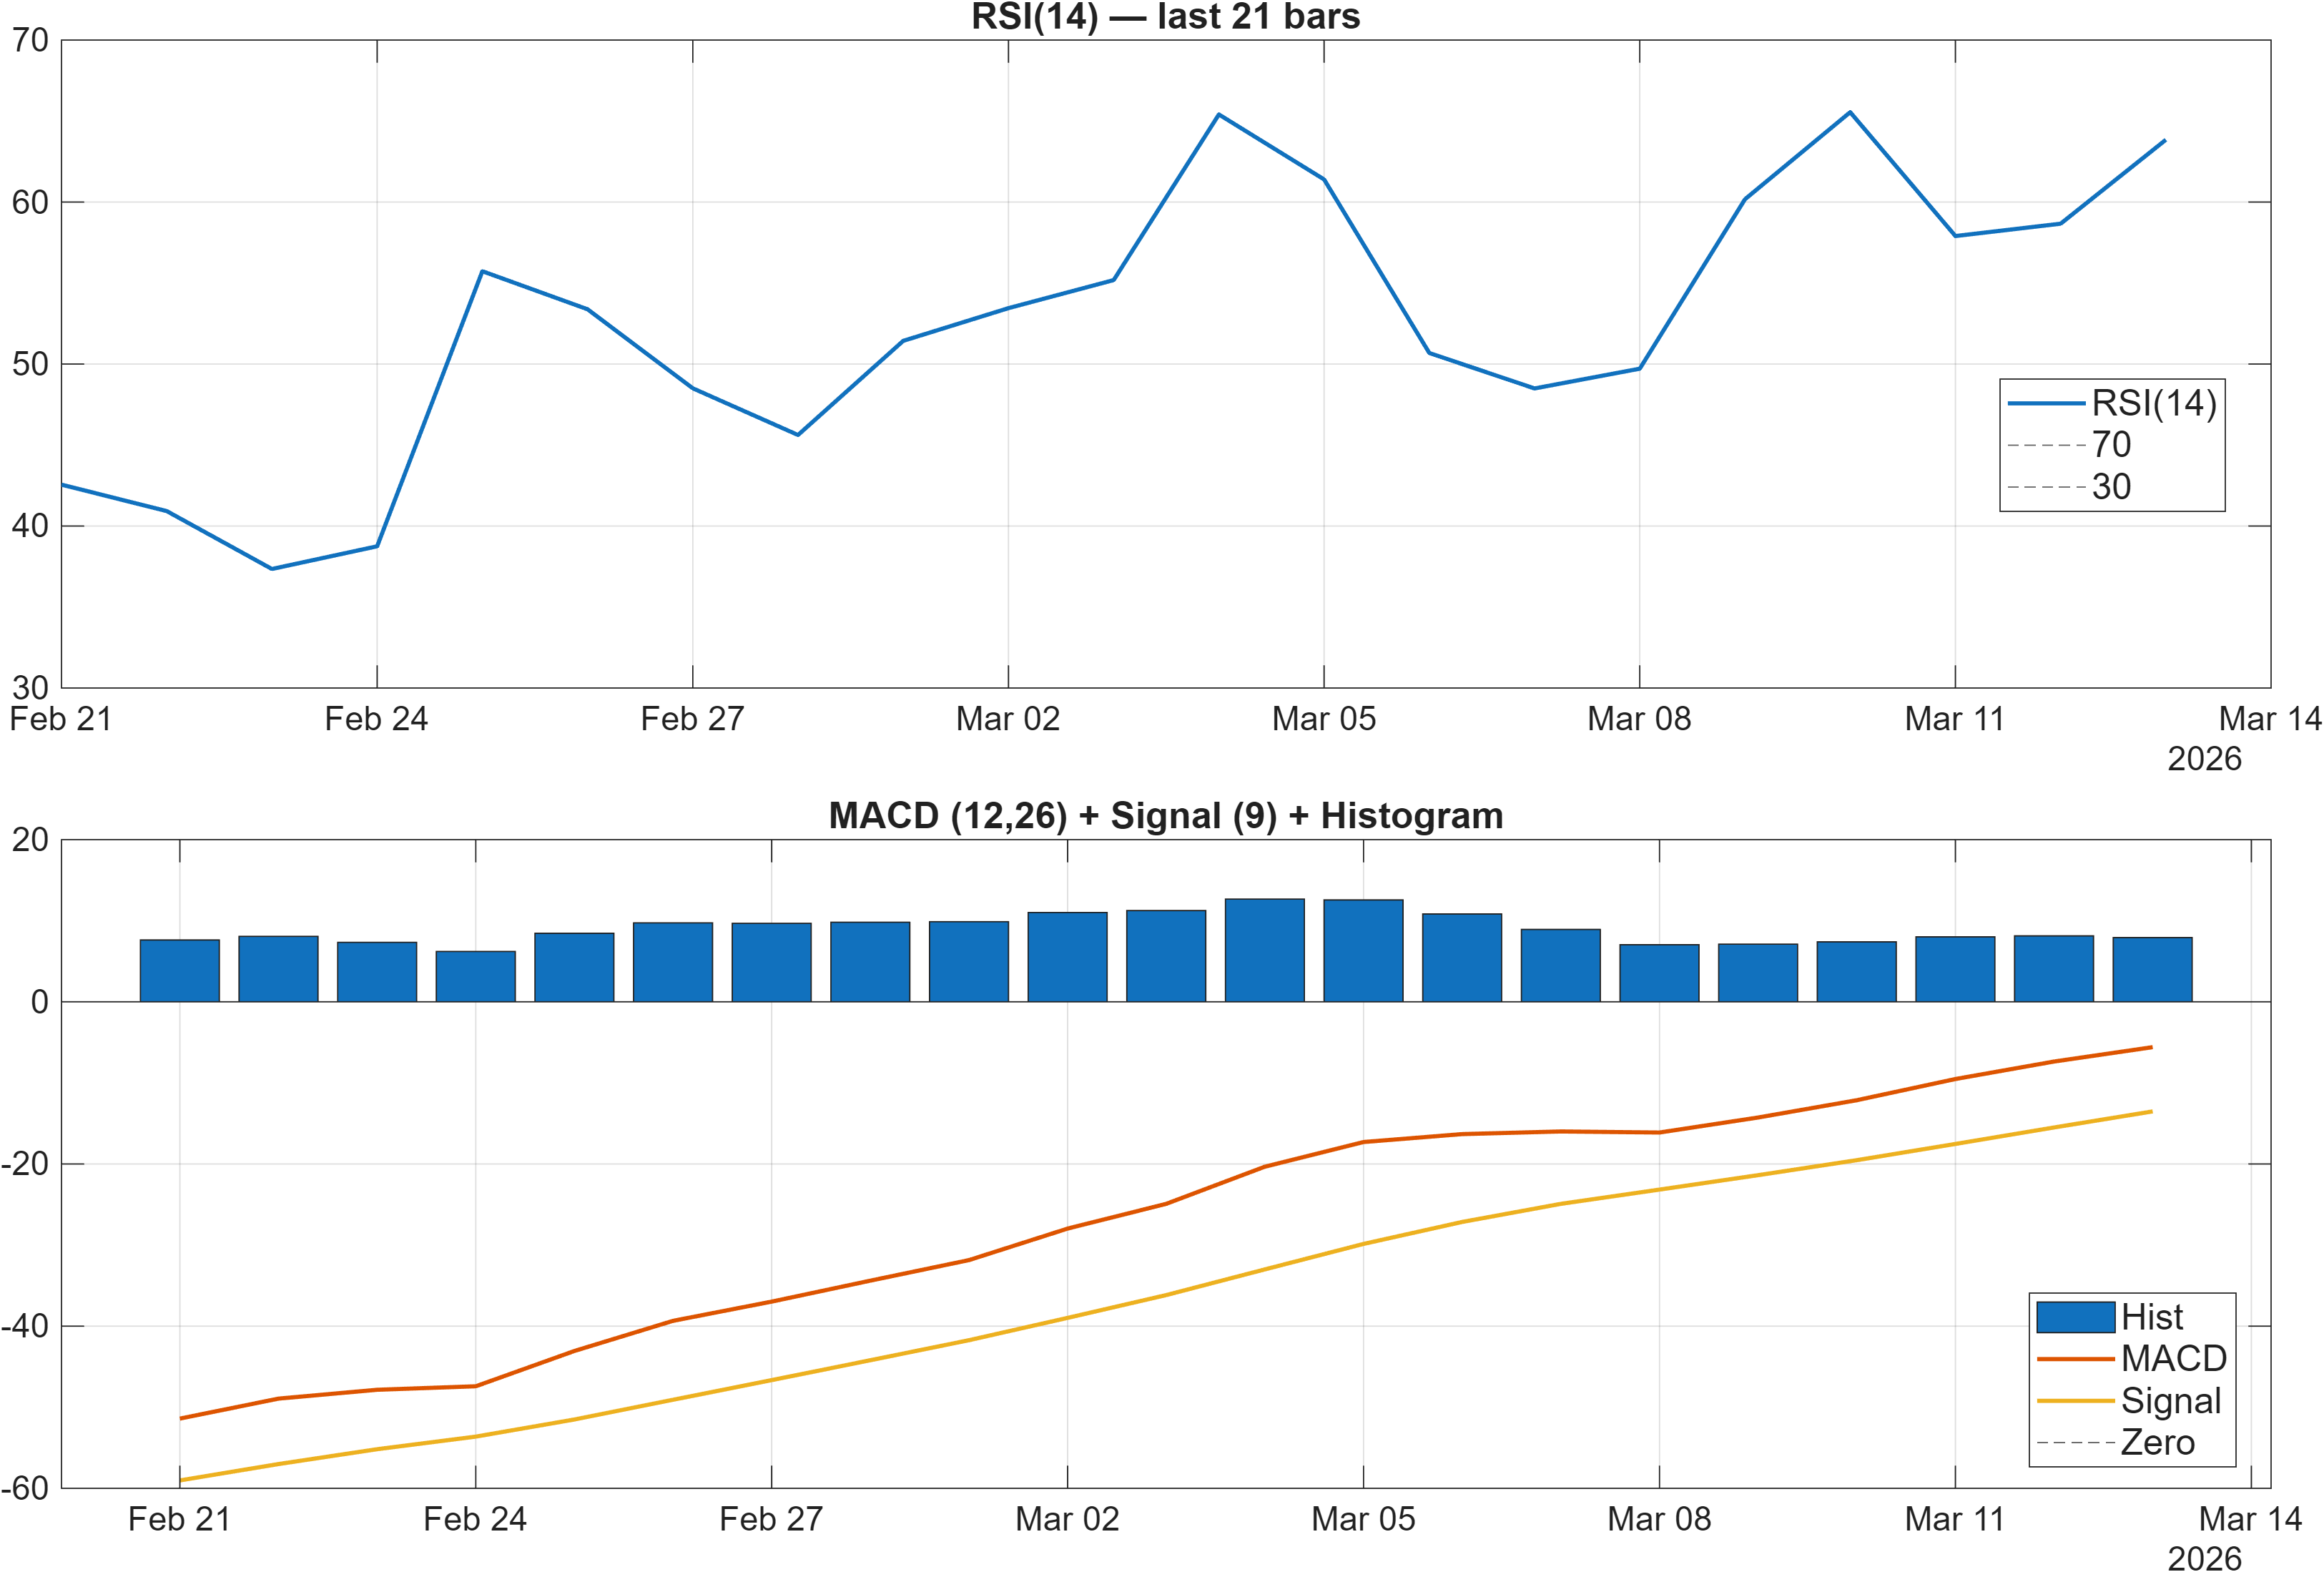
Interpretation: RSI bias = Bullish, MACD hist = 7.9238.
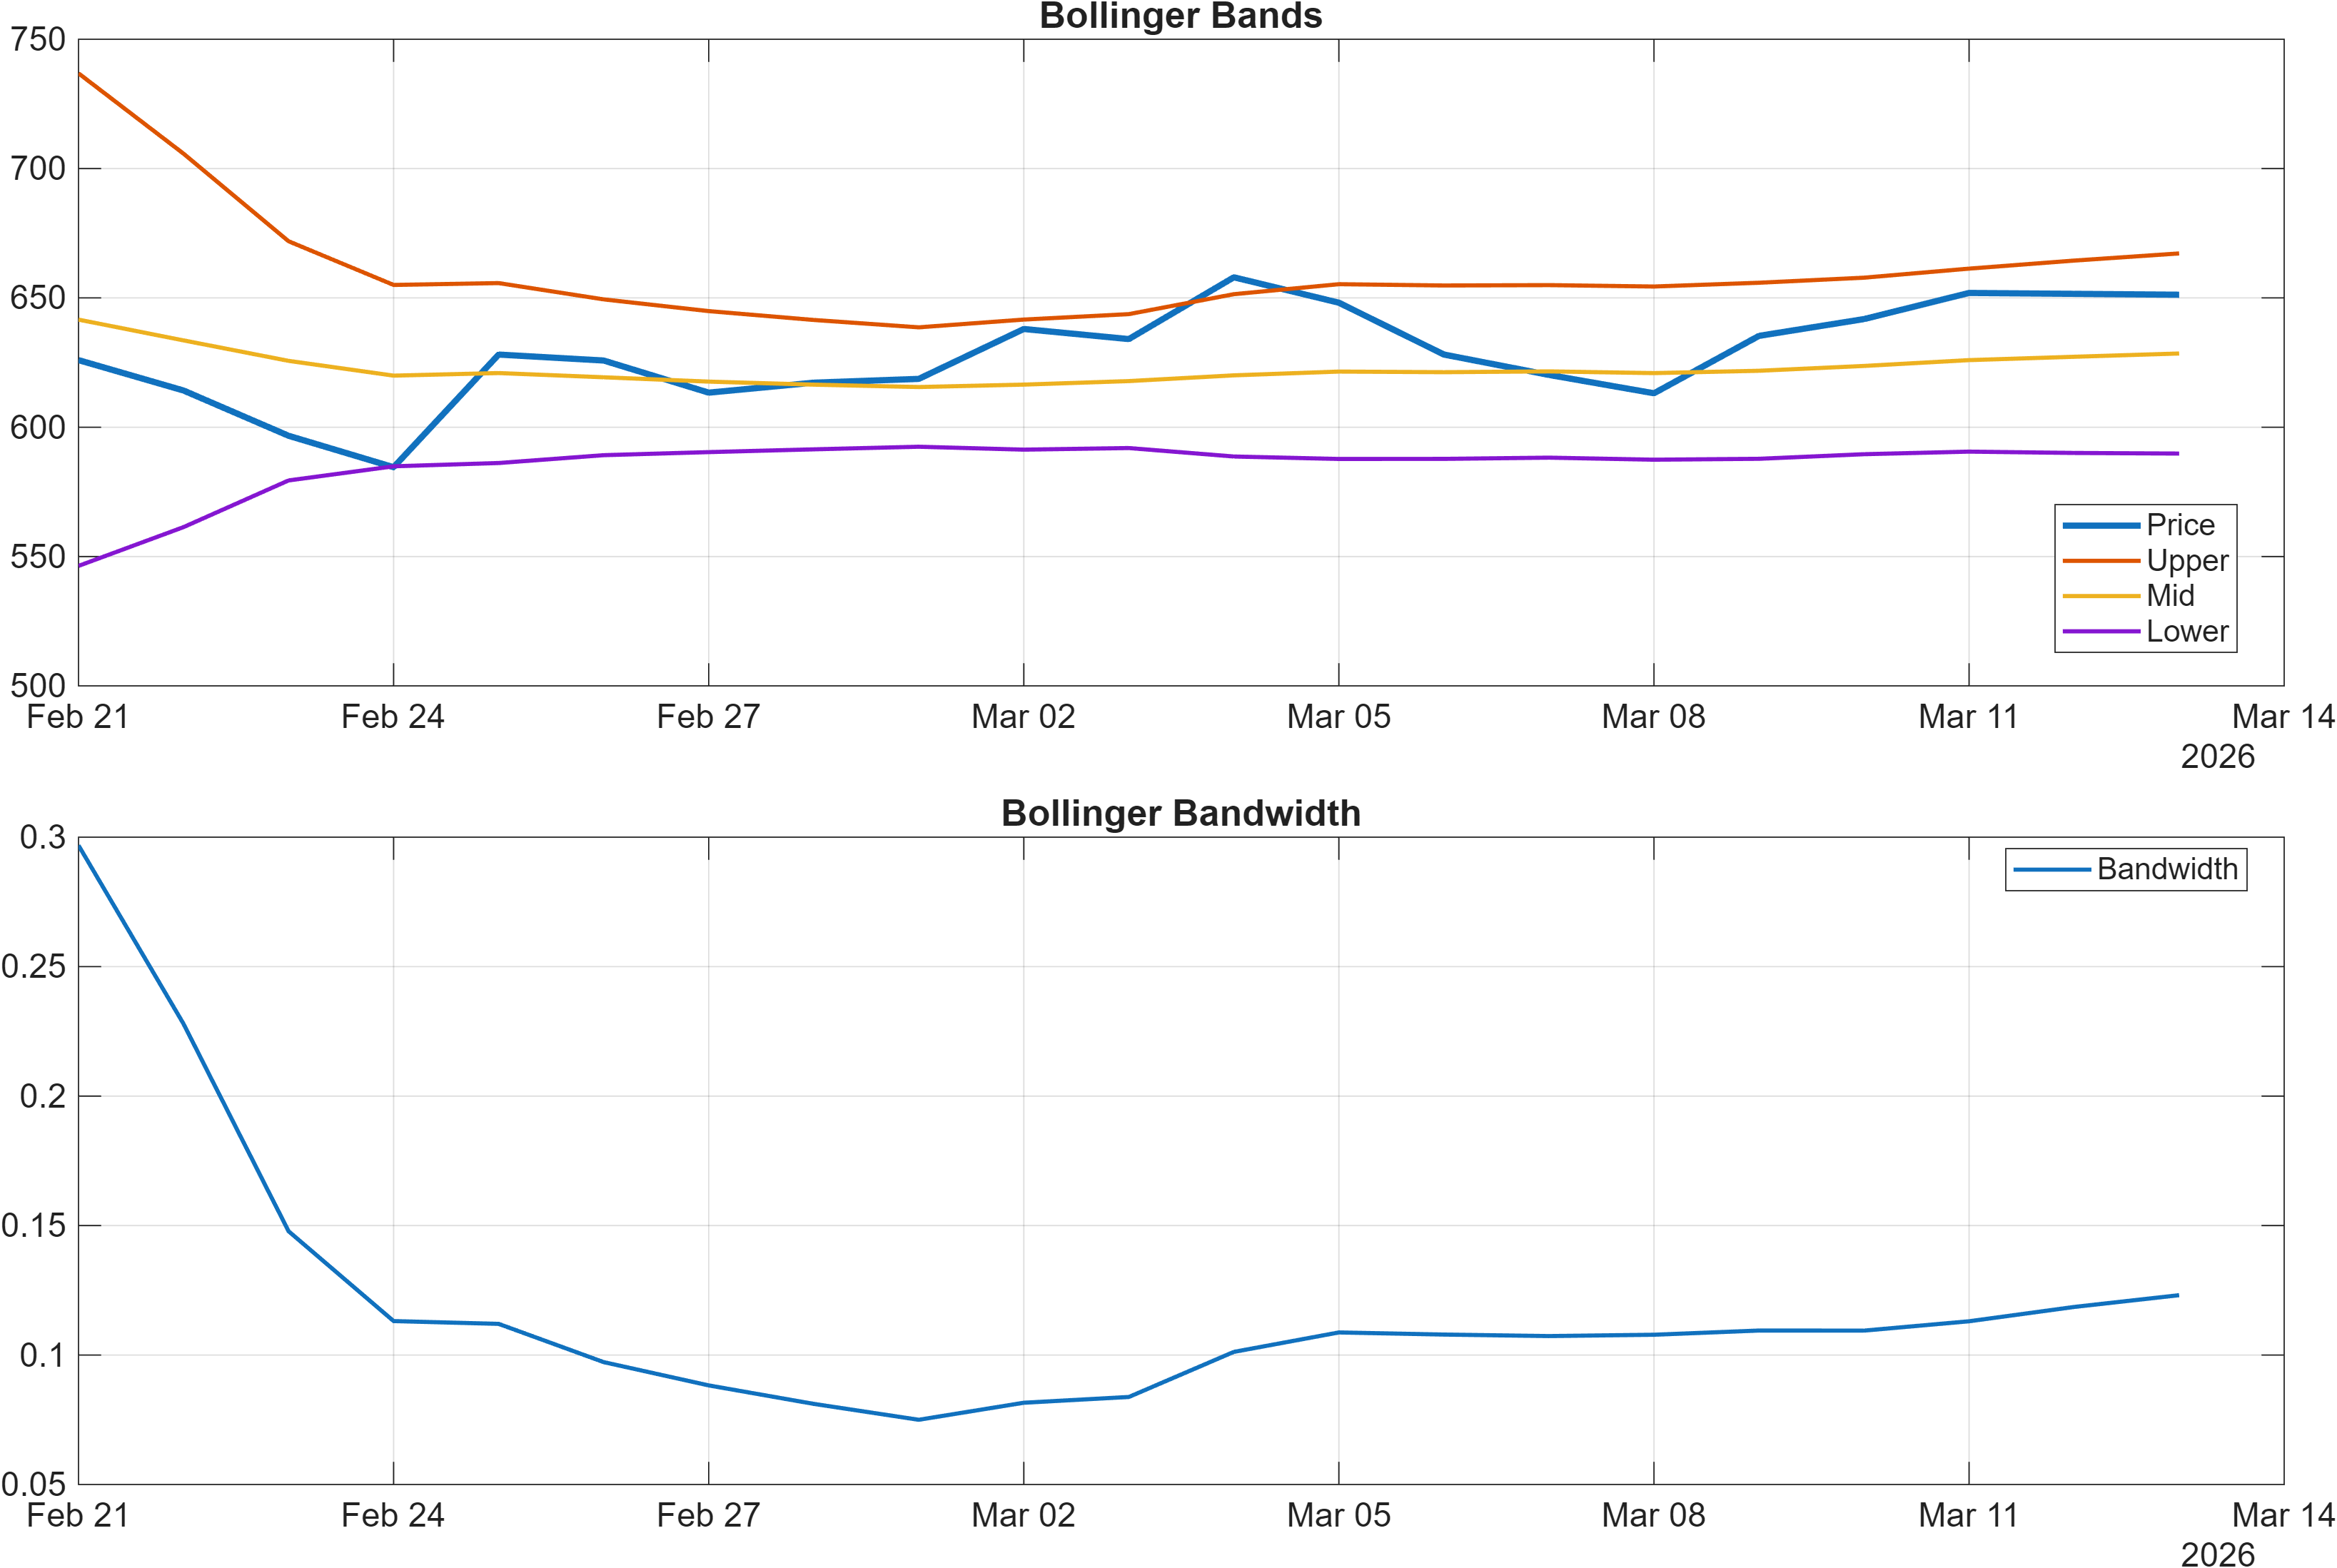
Interpretation: Bandwidth (volatility regime) latest = 0.1231.
Momentum signals are broadly aligned with the report’s bullish technical confluence. RSI is explicitly biased bullish, with RSI(14) at 63.85, a level consistent with positive trend pressure without necessarily implying extreme exhaustion. The MACD histogram is also positive (reported as 7.9238 in the interpretation and 7.924 in the signal table), reinforcing that momentum is not only elevated but also directionally supportive.
Volatility, however, is not flashing an aggressive expansion: Bollinger Bandwidth sits at 0.1231 (also echoed as BB Width in the signal table). This matters because strong momentum paired with only moderate bandwidth often corresponds to a grinding trend—price advances can persist, but they may require repeated confirmation rather than one decisive “impulse” move.
The dashboard also implies a constructive internal tempo via time-series measures: TS Mom(20) is 37.72 and TS Accel is 178.4, supporting the idea that momentum is not merely elevated but has also been accelerating. When acceleration leads without a matching volatility surge, breakouts can still occur, but failure risk increases if follow-through volume does not confirm.
Net assessment: the momentum/volatility mix argues for trend persistence over immediate exhaustion, while keeping attention on level-based triggers (Support 592.0222; Resistance 936.0535) to validate whether the next phase is continuation or mean-reversion.
4) Support / Resistance zones
Support ~ 592.0222 | Resistance ~ 936.0535
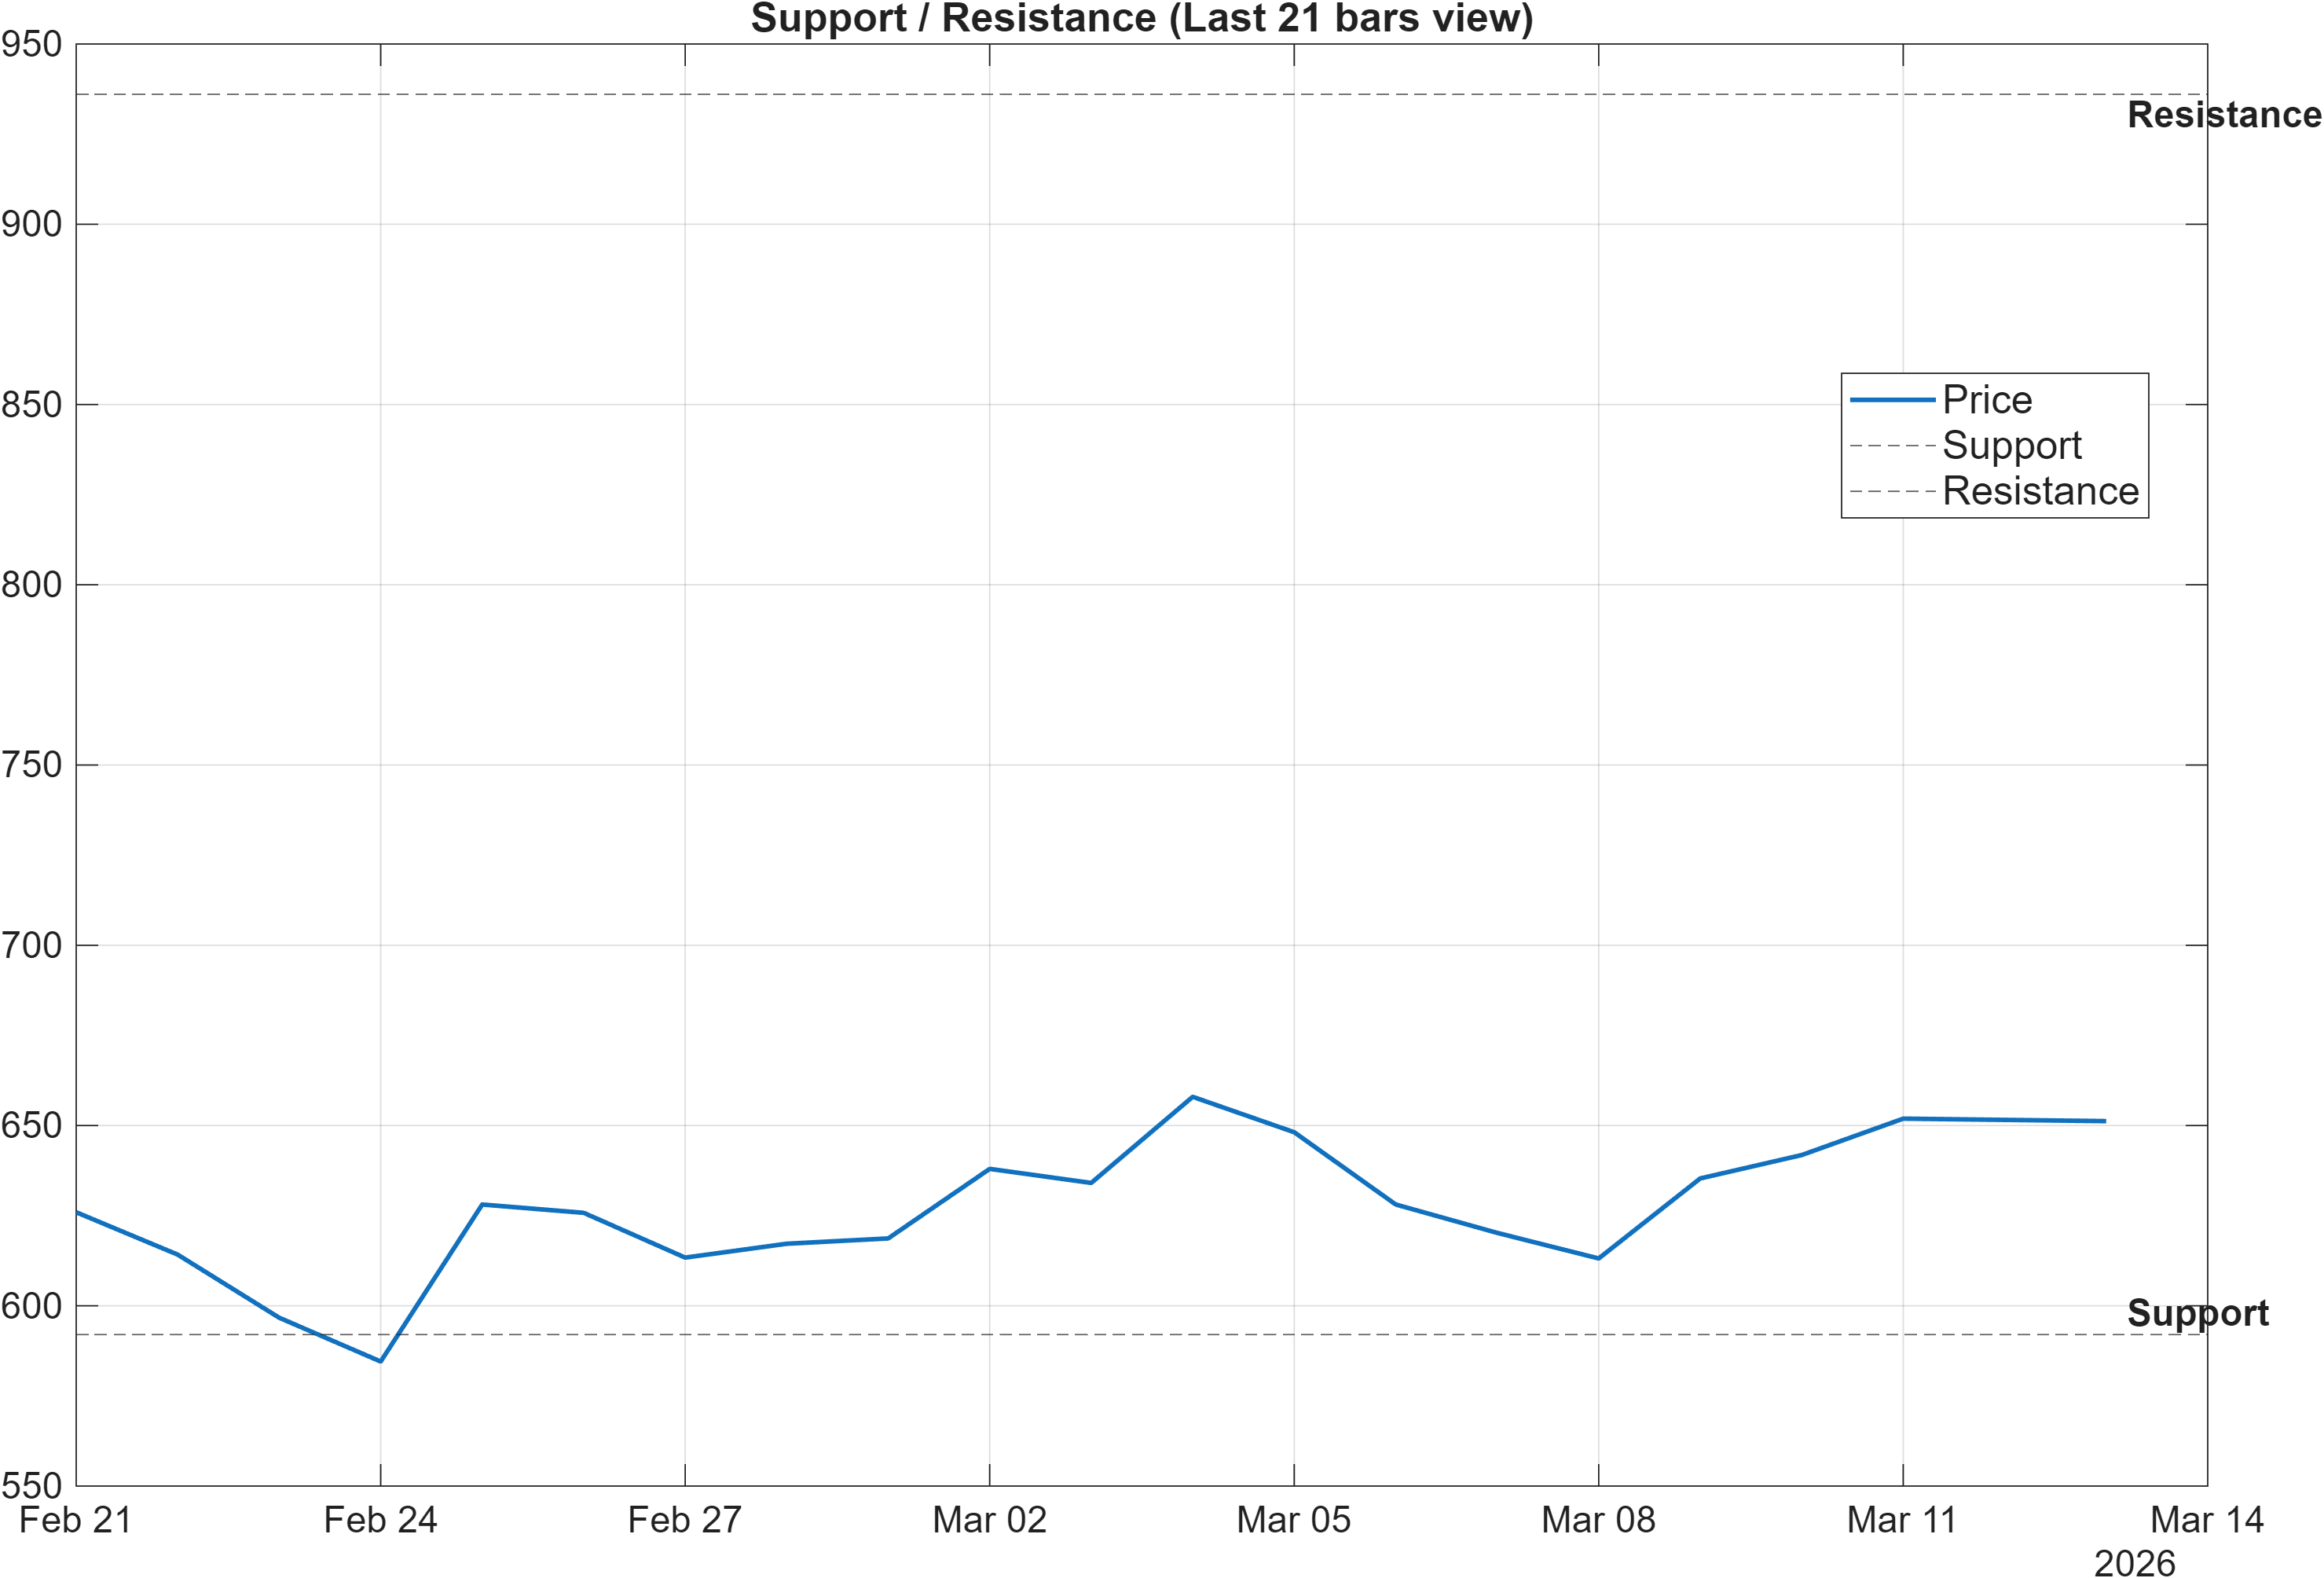
Scenario view: Break above resistance with volume → continuation. Close below support → signal deterioration risk.
The level map frames WBNB-USD as a range-defined market with asymmetric implications. The support band at 592.0222 functions as the primary “risk line” for the bullish technical stack: a close below it would introduce a clear deterioration condition against a backdrop where the longer moving-average filter is still bearish (MA50 vs MA200 = Bearish). In other words, the short-term rank strength (Daily #31; Weekly #34) remains credible above support but becomes harder to defend if that floor fails.
On the upside, resistance at 936.0535 is the principal threshold for continuation. Given that volatility is moderate (bandwidth 0.1231), a break is more analytically meaningful when paired with volume confirmation rather than price alone. Momentum readings—RSI(14) 63.85 and MACD histogram 7.9238—suggest the market has the internal strength to test upper zones, but level resolution remains the arbiter for whether the move evolves into a broader regime shift.
The support/resistance structure also helps reconcile the term-view split: the asset can be short-term Bullish while still mid/long Neutral if it continues to rotate within these decision bands without establishing a durable trend state. That is consistent with the rank distribution, where Monthly is Bullish (#90) but the 3-Monthly rank (#185) is only Neutral.
Practically, these zones provide a clean framework for evaluating whether momentum is being converted into structural progress (above resistance) or whether momentum is being absorbed into a reversal (below support).
5) Quant Technical Dashboard (18 Signals)
KGNAI AI Technical Analysis Score (Deep Reinforcement Learning): Rank #125 out of 800 (Rank 1 represents the strongest technical positioning and a higher probability of favorable price behavior. As ranks increase toward the maximum, the probability of favorable outcomes weakens and bearish positioning becomes more dominant.) | Label: Bullish | Score: 0.688
18-Signal Technical Confluence Score: 0.722 (Bullish)
Overall Technical Score (18-signal confluence + DRL rank blend): 0.712 (Bullish)
Note: The blended score reflects signal strength weighted against broader AI technical ranking, which may temporarily diverge.
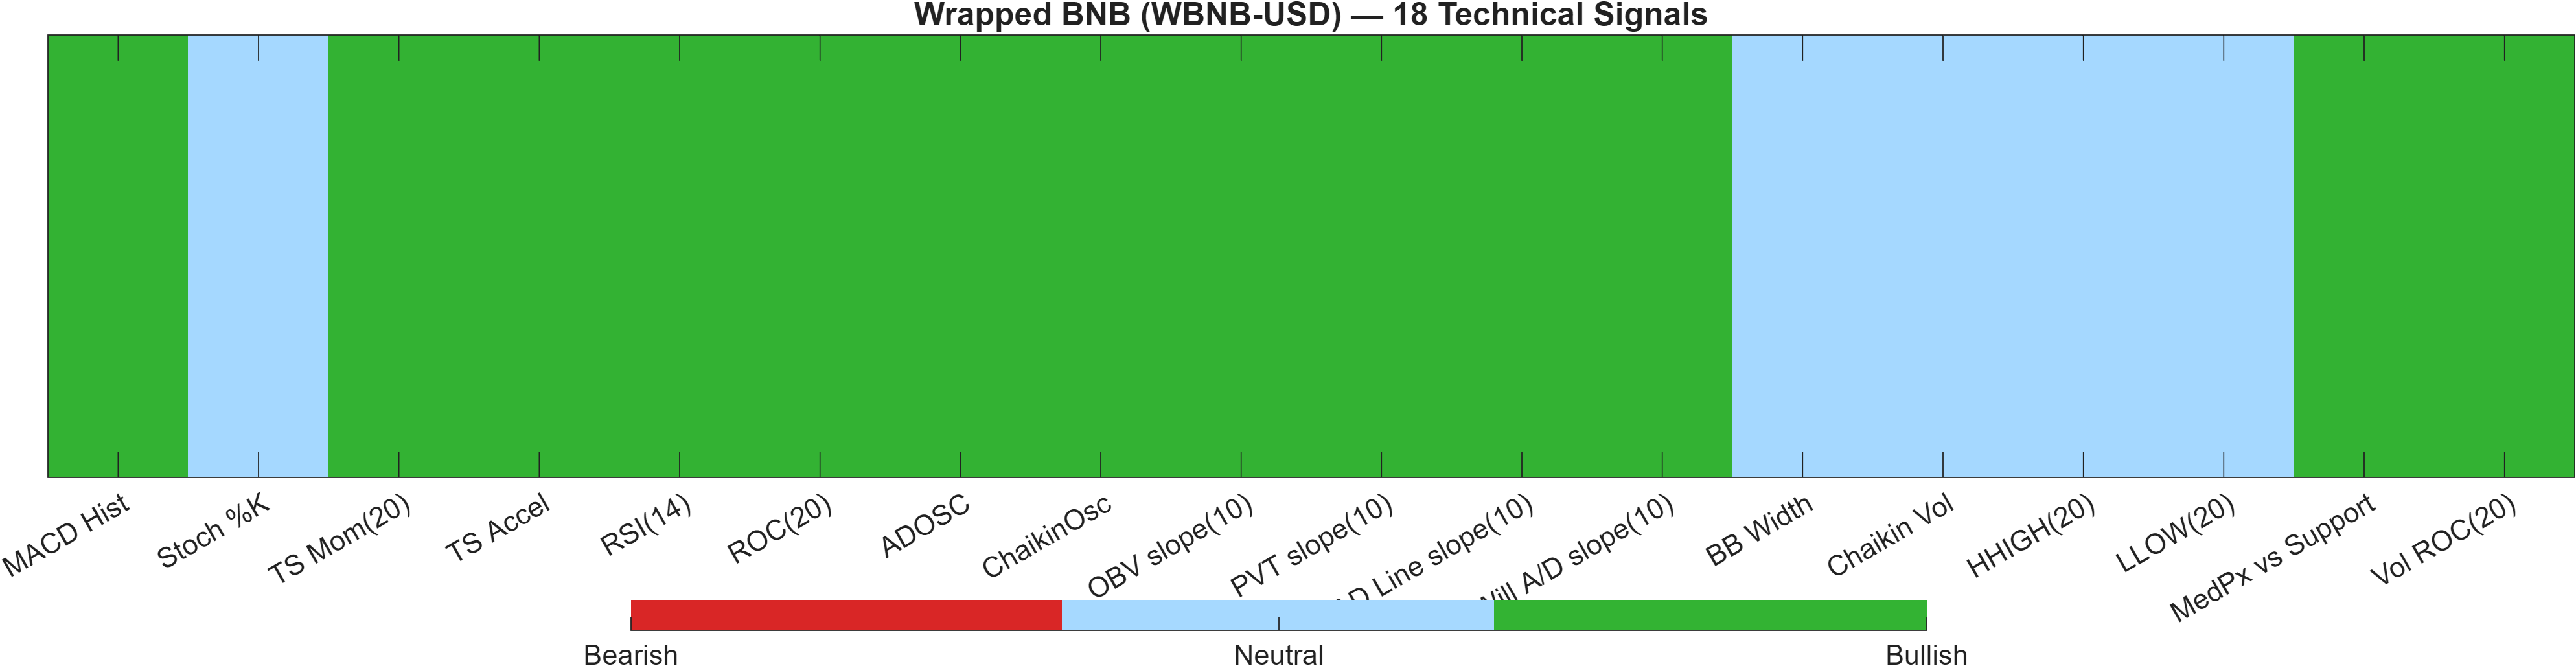
Blended technical score breakdown: 0.712 (Bullish | Bull 13 / Bear 0 / Neutral 5)
Signal alignment: breadth vs. concentration
The technical dashboard is notable for breadth: the blended framework shows Bull 13 / Bear 0 / Neutral 5, yielding a Bullish confluence score of 0.722 and an overall blended technical score of 0.712. This type of distribution tends to be more robust than a narrow signal win driven by one or two indicators, because it implies agreement across momentum, trend, and participation measures.
Momentum components are clearly supportive—RSI(14) at 63.85, ROC(20) at 6.029, and MACD histogram at 7.924. What strengthens the read further is that participation/flow proxies also lean constructive, including ADOSC at 80.02 and a positive OBV slope(10) of 4.538e+08. When price momentum and accumulation-style metrics point the same way, bullish signals are less dependent on short-lived oscillations.
The “Neutral” pocket is concentrated in regime descriptors rather than outright bearish flags: BB Width at 0.1231, Stoch %K at 76.55, and HHIGH(20) at 664.1 are not negative signals in this framework, but they can indicate less one-sided conditions where continuation is possible without forcing immediate volatility expansion.
The Deep Reinforcement Learning (DRL) technical rank is #125 with a score of 0.688 (Bullish). Relative to the confluence score, this suggests the broader technical ranking model is constructive but not extreme, aligning with the report’s horizon split: strong near-term posture, with enough neutrality to keep decision levels (Support 592.0222; Resistance 936.0535) central.
Signal table (Bull/Bear/Neutral)
| Indicator | Value | Signal |
|---|---|---|
| MACD Hist | 7.924 | Bullish |
| Stoch %K | 76.55 | Neutral |
| TS Mom(20) | 37.72 | Bullish |
| TS Accel | 178.4 | Bullish |
| RSI(14) | 63.85 | Bullish |
| ROC(20) | 6.029 | Bullish |
| ADOSC | 80.02 | Bullish |
| ChaikinOsc | 2.859e+08 | Bullish |
| OBV slope(10) | 4.538e+08 | Bullish |
| PVT slope(10) | 2.179e+07 | Bullish |
| AD Line slope(10) | 3.2e+08 | Bullish |
| Will A/D slope(10) | 16.28 | Bullish |
| BB Width | 0.1231 | Neutral |
| Chaikin Vol | -30.61 | Neutral |
| HHIGH(20) | 664.1 | Neutral |
| LLOW(20) | 579.1 | Neutral |
| MedPx vs Support | 53.64 | Bullish |
| Vol ROC(20) | 198.7 | Bullish |
Interpretation: Indicator-level signals form the base confluence, which is then adjusted using a separate AI-driven technical ranking model. The final technical score summarizes this combined view.
6) News sentiment + extractive gist
Note: Instrument-specific news matches were not found, so the digest includes broader market/sector headlines. Links are provided for verification.
Sentiment score (avg): 0.034 | Positive: 12% | Neutral: 81% | Negative: 6%
KGNAI AI News Sentiment Score (normalized -1 to +1): Not available (as of —) | Label: Not available | Overall news score: 0.03
Positive Developments
Recent coverage across major financial outlets indicates a mildly constructive tone for broad crypto risk appetite, with market discussion centered on resilience in benchmark assets and continued participation across major venues. In the context of WBNB-USD, this matters less as a direct catalyst and more as a background condition that can support momentum persistence when technicals are already aligned. That backdrop is consistent with the report’s positive momentum stack (RSI(14) 63.85; MACD histogram 7.9238) and the breadth of bullish technical signals (Bull 13 with Bear 0). With the news mix showing 12% positive and an average sentiment of 0.034, the constructive component appears incremental rather than dominant—supportive for continuation attempts, but not sufficiently strong to replace the need for price/volume confirmation around 936.0535.
Neutral / Mixed Developments
The news distribution is overwhelmingly neutral (81%), implying that most coverage is informational and sector-wide rather than instrument-specific. For positioning, neutral-heavy coverage often coincides with markets that trade primarily on technical structure and liquidity conditions. That framing aligns with the report’s volatility read: Bollinger Bandwidth is 0.1231, suggesting neither panic compression nor runaway expansion. In these environments, price tends to respect defined zones more reliably, making the support area near 592.0222 and resistance near 936.0535 analytically central. The lack of an available normalized KGNAI AI News Sentiment Score is also consistent with the note’s constraint: Not available in the provided data. Overall, the mix reads as a context setter, not a driver.
Negative / Risk Signals
Risk-oriented coverage across the crypto complex has highlighted areas such as shifting derivatives positioning and policy/process uncertainty, which can introduce intermittent volatility even when trend signals are constructive. With negative share at 6% and the average sentiment still slightly positive at 0.034, the risk signal is more about tail outcomes than baseline direction. This is where the report’s horizon split becomes relevant: despite strong Daily/Weekly ranks (#31 / #34), the 3-Monthly rank (#185) remains Neutral, leaving room for quicker pullbacks if sentiment deteriorates or if momentum cools. The clean invalidation marker remains a close below 592.0222, particularly given that MA50 vs MA200 is still Bearish and could amplify downside sensitivity if support fails.
- Whether price action can sustain strength into the 936.0535 resistance zone with confirming volume.
- Any deterioration that pushes price toward (or below) 592.0222, which would pressure the bullish confluence framework.
- Changes in sector-wide risk tone that would shift the currently neutral-heavy sentiment mix (81% neutral).
Snapshot: AI Rank (Short–Mid–Long): Mixed (Bullish–Neutral–Neutral) · Technical Confluence: Bullish · Key Levels: Support ~592.02 | Resistance ~936.05 · News Sentiment: Neutral
Sources referenced: Reuters, Bloomberg, Yahoo Finance, MarketWatch, Investing.com
7) Sources
- Not available in the provided data.
You may also like: How KGNAI AI ranks instruments across global markets
Disclaimer: KGNAI provides AI-generated analytics and educational market commentary only. This is not financial advice. Markets involve risk. Always do your own research.