
DB1.F — Deutsche Börse AG (Germany) | 13-Feb-2026 Technical Ranks & Confluence: Long-Term Bullish, Near-Term Risk Skew Negative
Deutsche Börse AG (DB1.F) presents a split profile across horizons: KGNAI’s Daily rank (#8 of 1427) signals near-term relative strength, while the broader multi-horizon stack remains mostly Neutral (e.g., Weekly #770, Monthly #289, 3-Monthly #663). In contrast, the technical layer leans decisively risk-aware: the 18-signal confluence score is -0.389 (Bearish) and the blended technical score is -0.490 (Bearish), reinforced by a DRL technical rank of #1231/1427. Momentum inputs are mixed-to-soft (e.g., RSI(14) 45.7 with MACD histogram -0.6586), while volatility remains contained with Bollinger Bandwidth 0.0714. Key decision zones are well-defined at Support ~206.7000 and Resistance ~224.1333, where breaks (with volume) become the primary confirmation/invalidation cues. News sentiment is balanced on average (0.042), even as the normalized score reads 0.97 (Bullish).
- Rank stance (Short / Mid / Long): Neutral / Neutral / Bullish (Daily #8; Weekly #770; Yearly #87)
- Technical confluence label: Bearish (Blended score -0.490; DRL rank #1231/1427)
- Key levels: Support ~206.7000; Resistance ~224.1333
- News sentiment bias: Neutral on average (0.042) with a Bullish normalized reading (0.97)
- Confirmation / invalidation: Break above 224.1333 with volume supports continuation; close below 206.7000 increases deterioration risk
KGNAI ranks instruments by relative positioning across large universes, combining multiple AI tests with statistical models to assess how an asset is behaving versus peers. The framework emphasizes signal alignment and regime context (trend, volatility, and volume/flow) rather than single-indicator triggers. Outputs are comparative and designed for consistent cross-market interpretation.
- Ranks are comparative across the 1427-instrument universe, not absolute forecasts.
- Confluence reflects agreement (or disagreement) across multiple technical signals.
- Support/resistance levels are decision zones that help frame risk, not certainties.
- Sentiment adds contextual bias and can diverge from price-based signals.
1) KGNAI AI Analysis
Region: EUROPE
Total universe size: 1427 ranked instruments
- Daily rank: #8 out of 1427 — Bullish
- Weekly rank: #770 out of 1427 — Neutral
- Monthly rank: #289 out of 1427 — Neutral
- 3-Monthly rank: #663 out of 1427 — Neutral
- 6-Monthly rank: #86 out of 1427 — Bullish
- Yearly rank: #87 out of 1427 — Bullish
The rank stack is best read as a timeframe dispersion signal. DB1.F sits in the top decile on the Daily metric (#8), indicating strong near-term relative behavior versus the 1427-instrument European universe. That strength does not fully propagate into the intermediate ranks, where Weekly (#770) and 3-Monthly (#663) remain in the weaker half of the distribution, suggesting the market has not rebuilt persistent momentum across weeks-to-months.
At the longer horizon, the picture improves materially: 6-Monthly (#86) and Yearly (#87) land in the upper tier, consistent with a longer-run bias that remains constructive even if shorter cycles are choppy. This mix often appears when a larger uptrend is intact but is experiencing consolidation or mean-reversion pressures that temporarily suppress intermediate momentum.
Put differently, the model’s cross-horizon view frames DB1.F as long-term supported but tactically sensitive—where entries and risk controls matter more than directionality. With such dispersion, decision-making typically shifts toward confirmation: intermediate ranks need to improve to validate the Daily strength, otherwise the Daily signal can fade quickly.
KGNAI ranks each instrument across large universes using multiple proprietary AI tests and statistical models (millions of data points). Lower ranks generally indicate stronger probability of favorable performance behavior, while higher ranks indicate weaker probability and more bearish positioning.
Term view: Short-term: Neutral. Mid-term: Neutral. Long-term: Bullish.
2) Price & trend overview
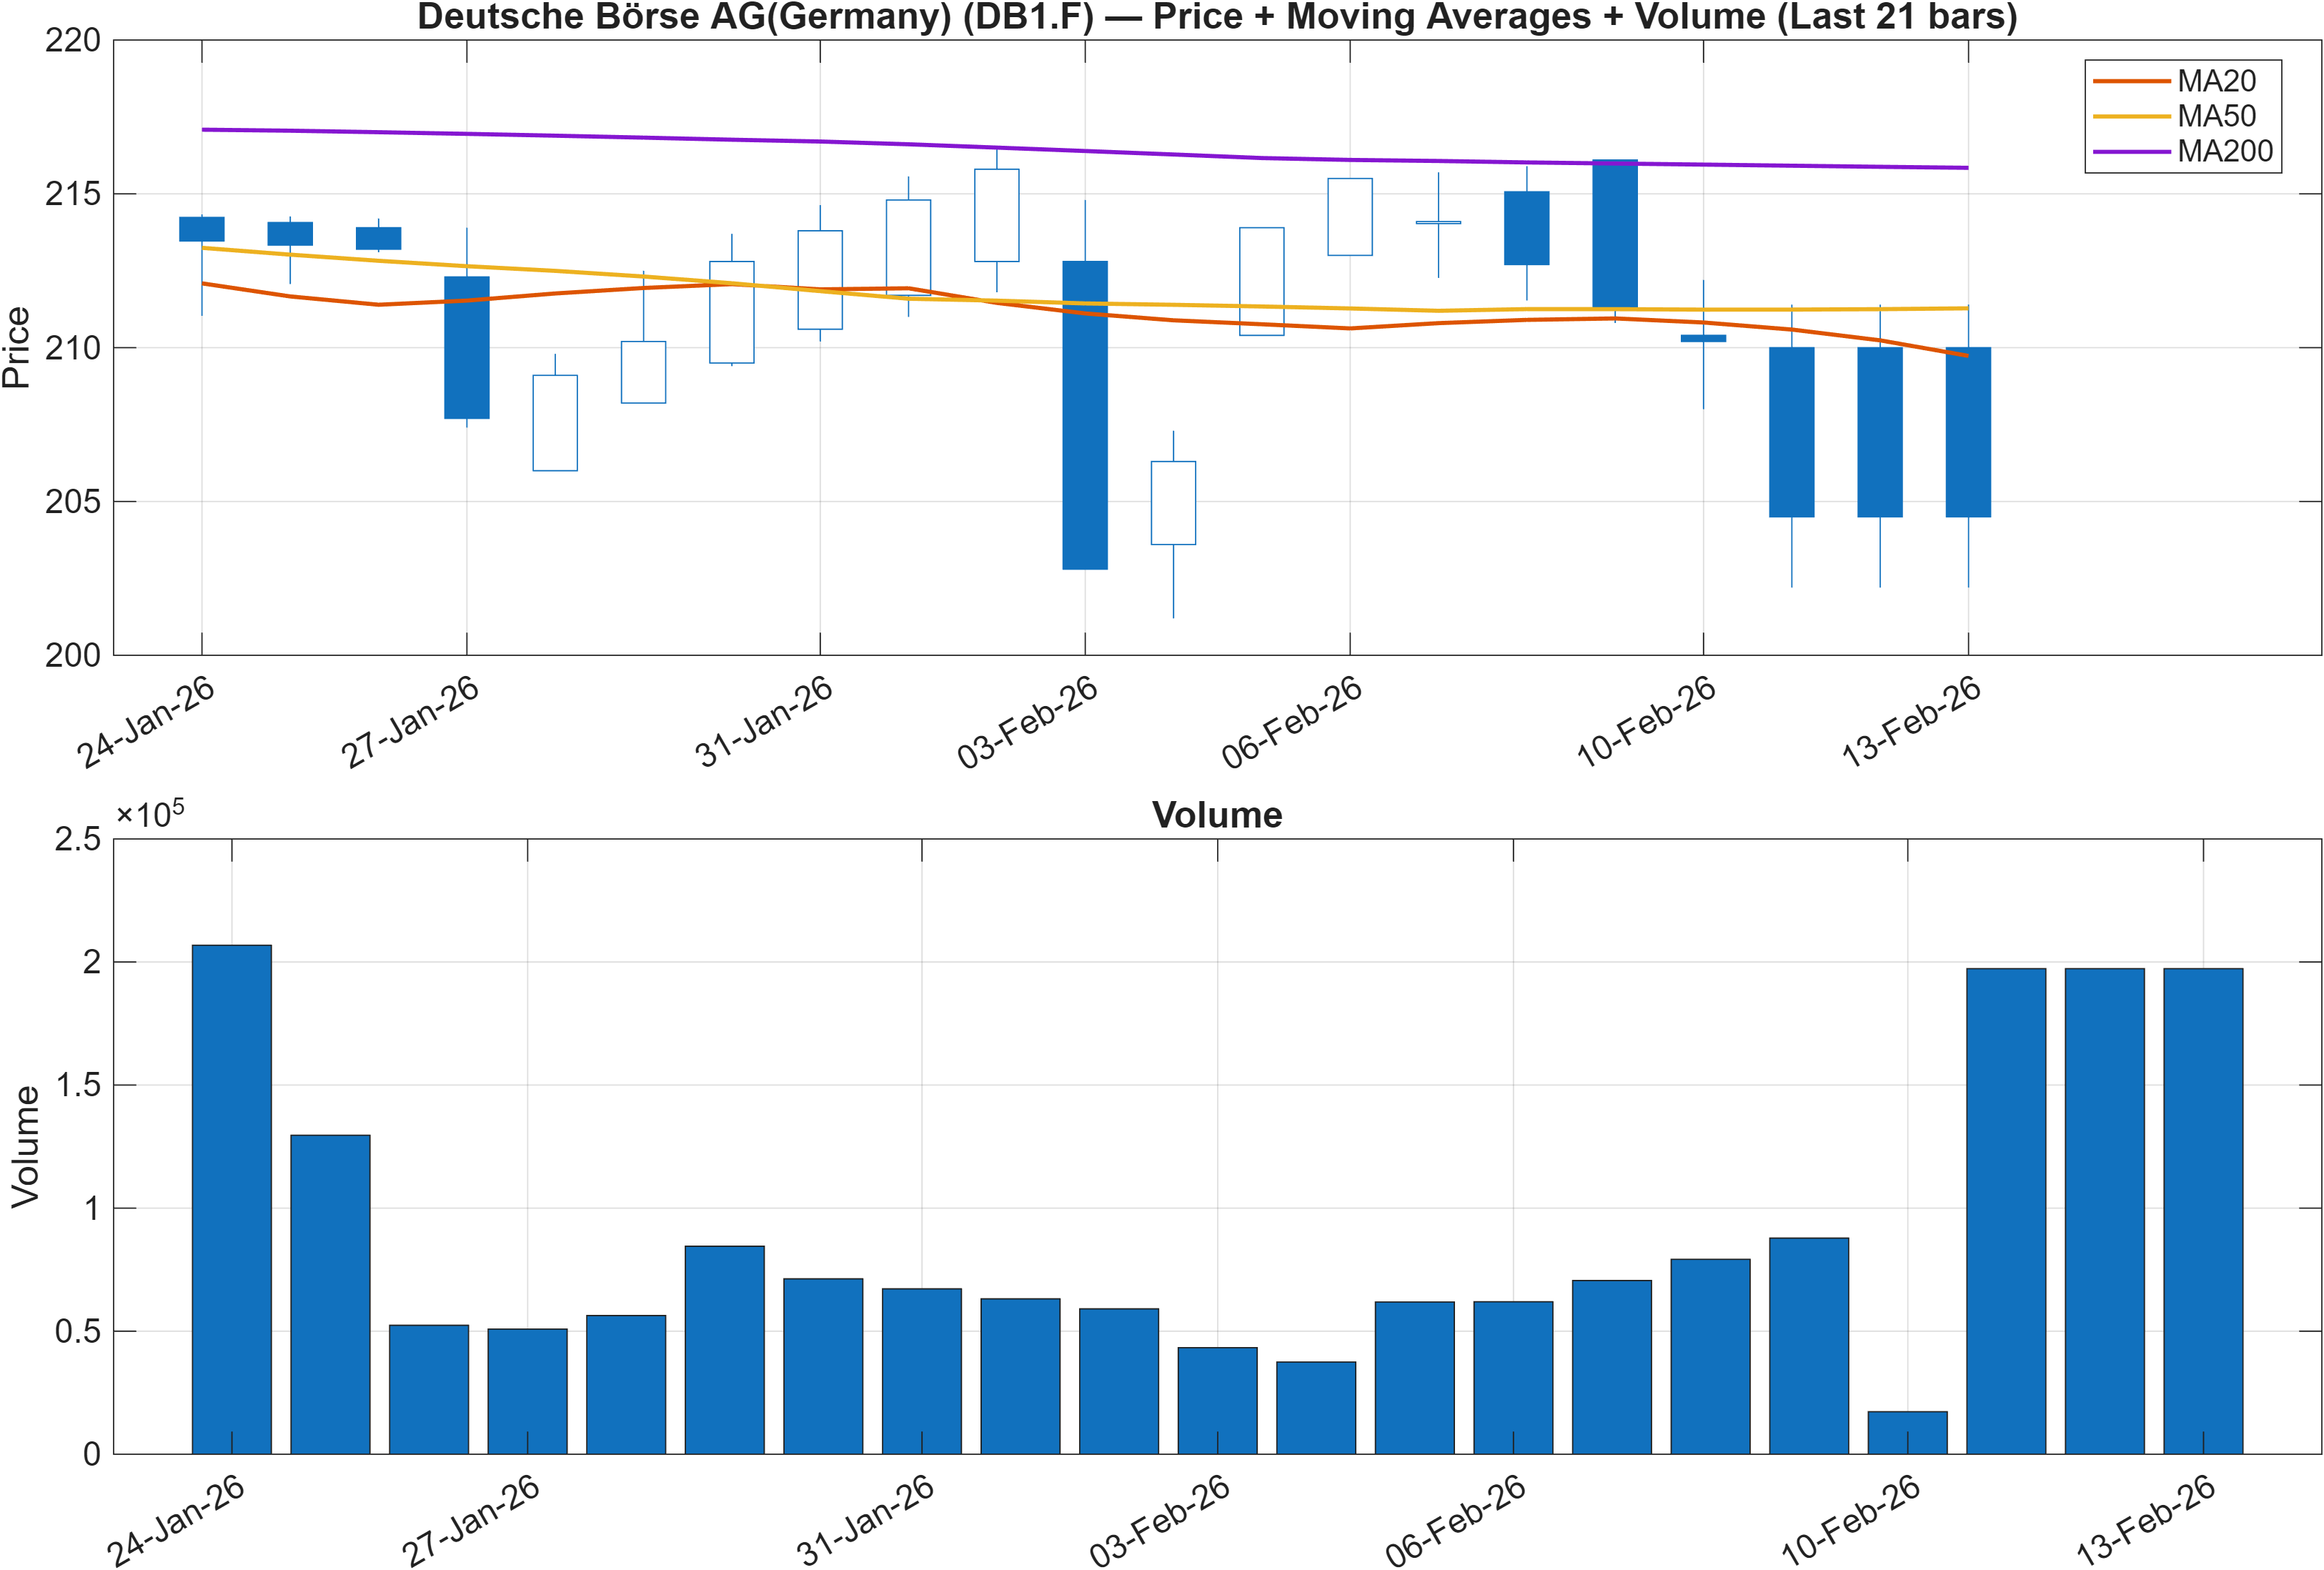
Interpretation: Close vs MA50 = Bearish, MA50 vs MA200 = Bearish.
The trend read is straightforward: price is below the 50-day average, and the 50-day is below the 200-day. That combination is typically associated with a market that is still working through a prior drawdown, even if it periodically rallies. It also helps explain why a very strong Daily rank (#8) can coexist with Neutral ranks on the Weekly (#770) and 3-Monthly (#663): short bursts of relative strength are occurring within a broader structure that remains technically heavy.
This configuration tends to increase the importance of nearby decision levels. With resistance defined at 224.1333 and support at 206.7000, the moving-average posture suggests rallies toward overhead supply may face friction unless accompanied by clear participation (volume confirmation). Conversely, pullbacks that hold above support can keep the longer-horizon ranks (6-Monthly #86 and Yearly #87) aligned with a constructive macro bias.
For positioning, the key is not to treat the moving-average signals as a stand-alone verdict, but as a context filter: the market is asking for stronger evidence before upgrading the intermediate-term stance. Until that evidence appears, the trend backdrop is consistent with a “rallies need confirmation” regime.
3) Momentum & volatility dashboard
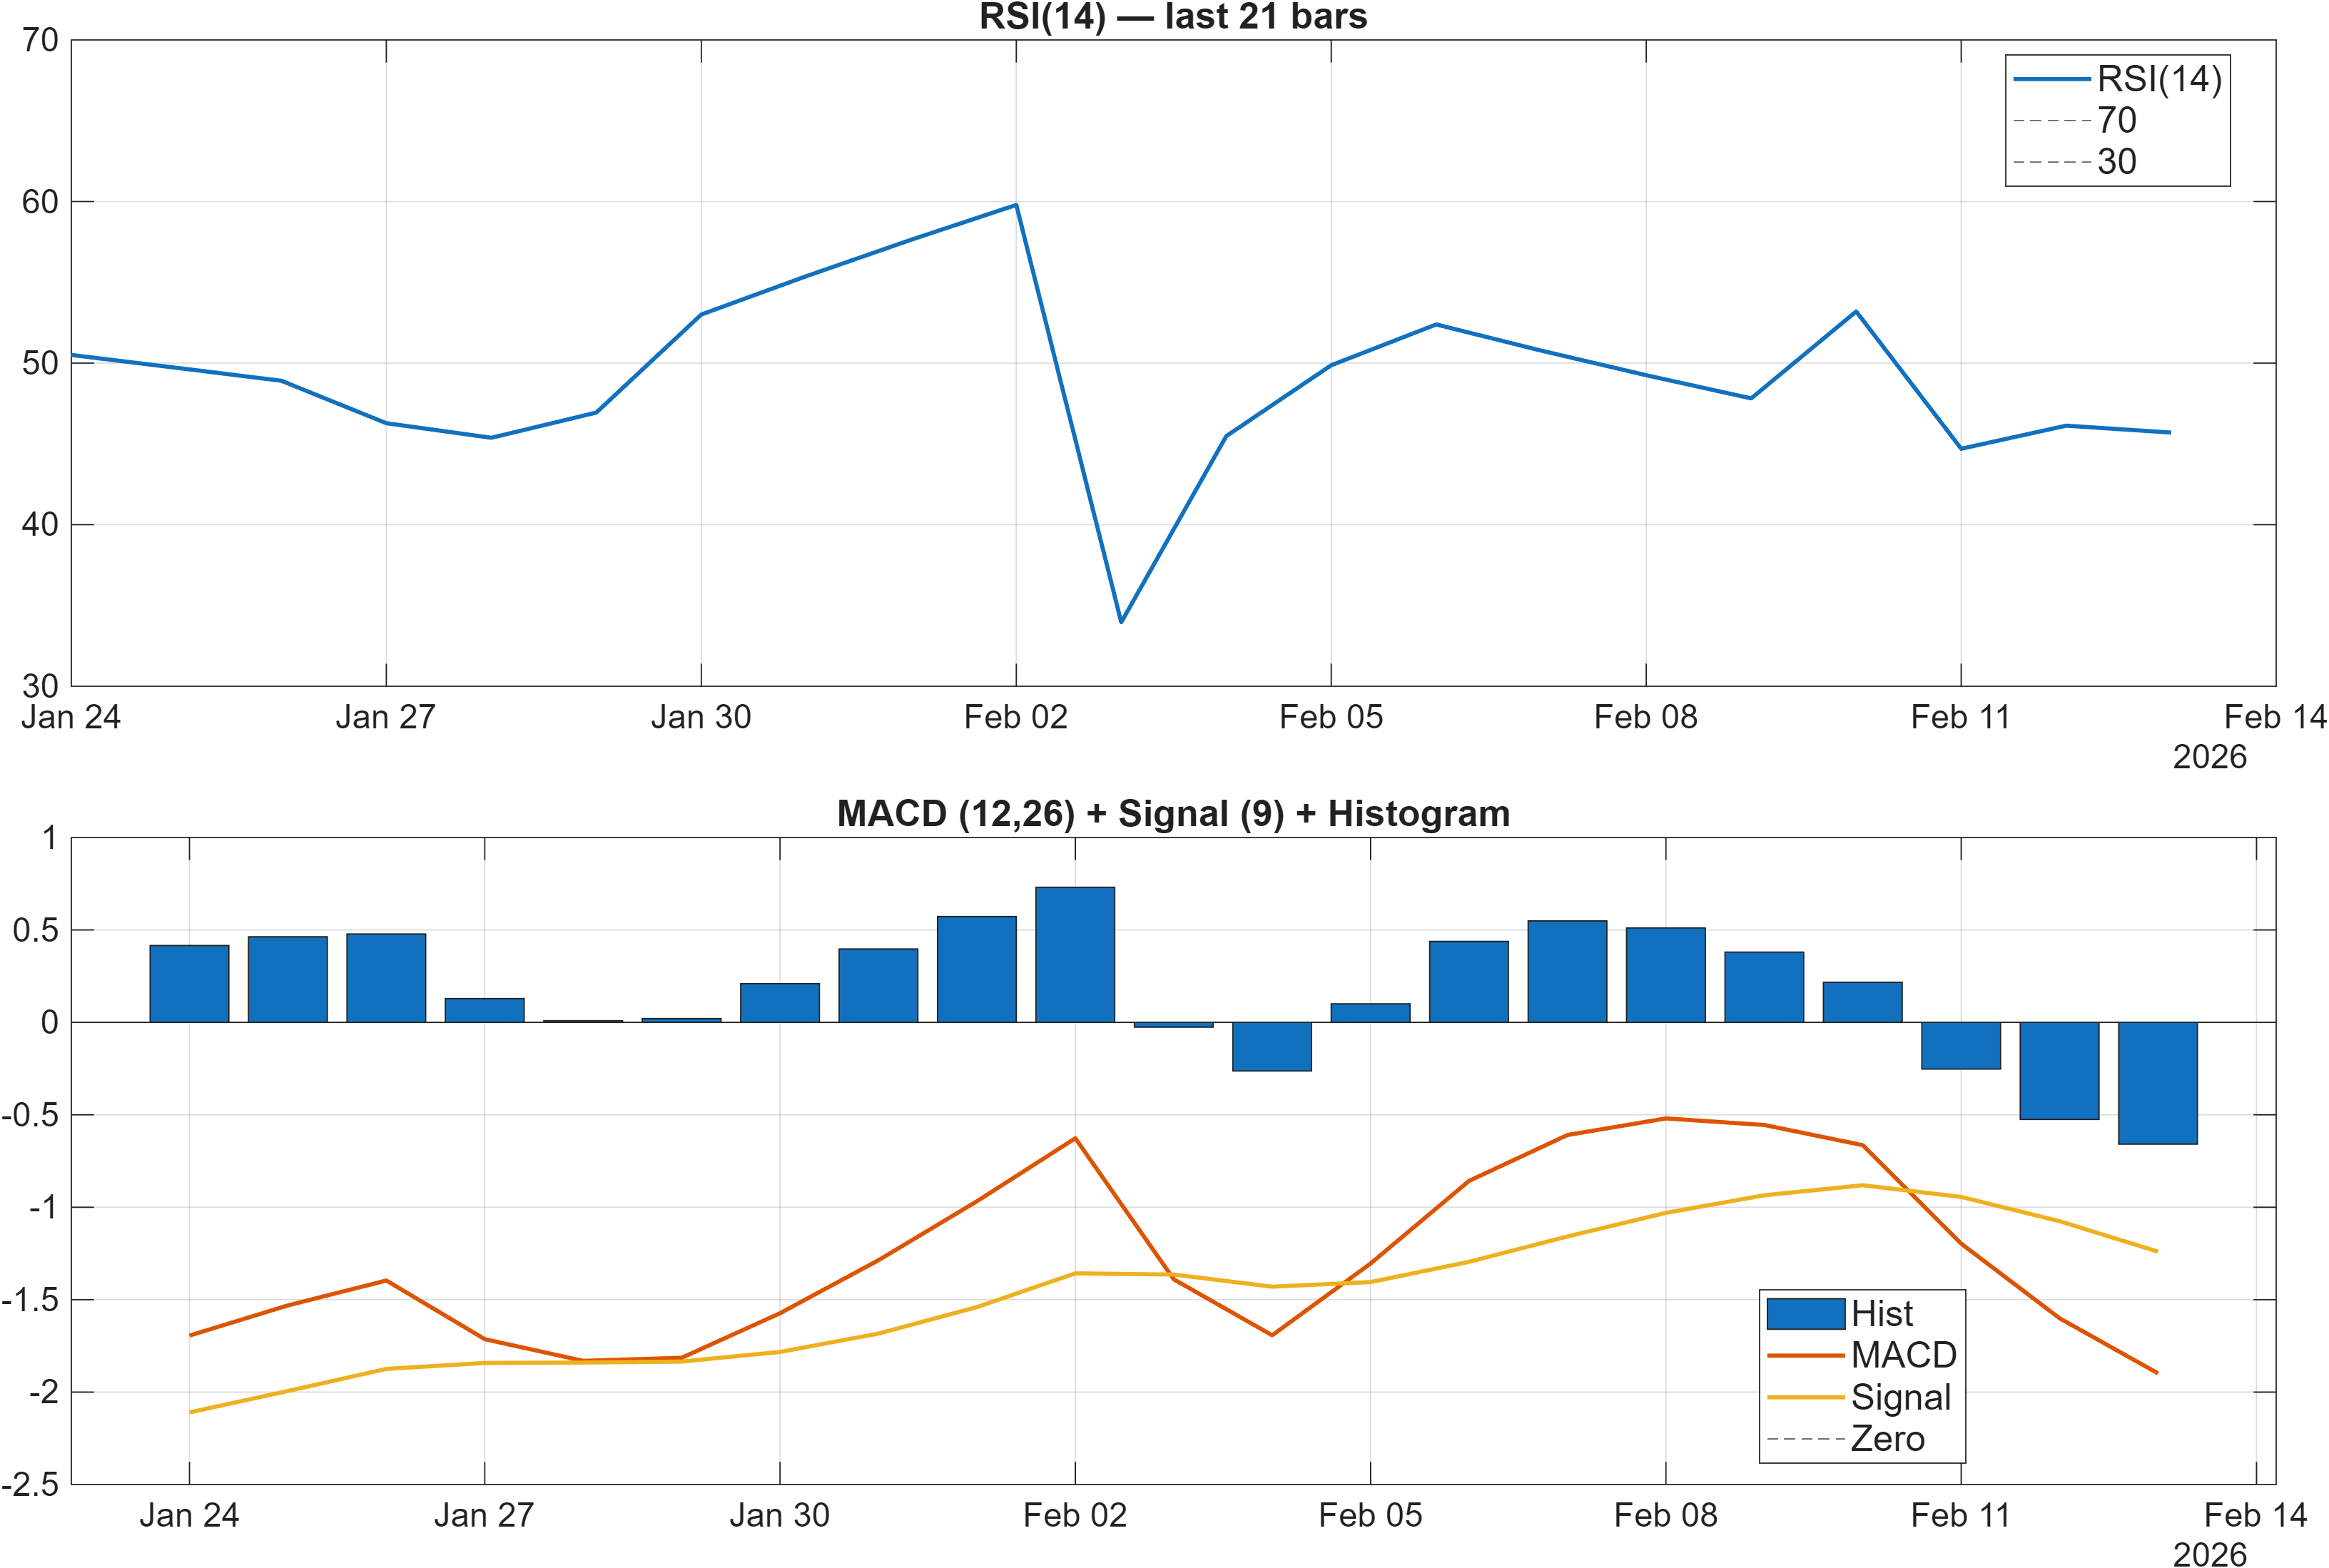
Interpretation: RSI bias = Neutral, MACD hist = -0.6586.
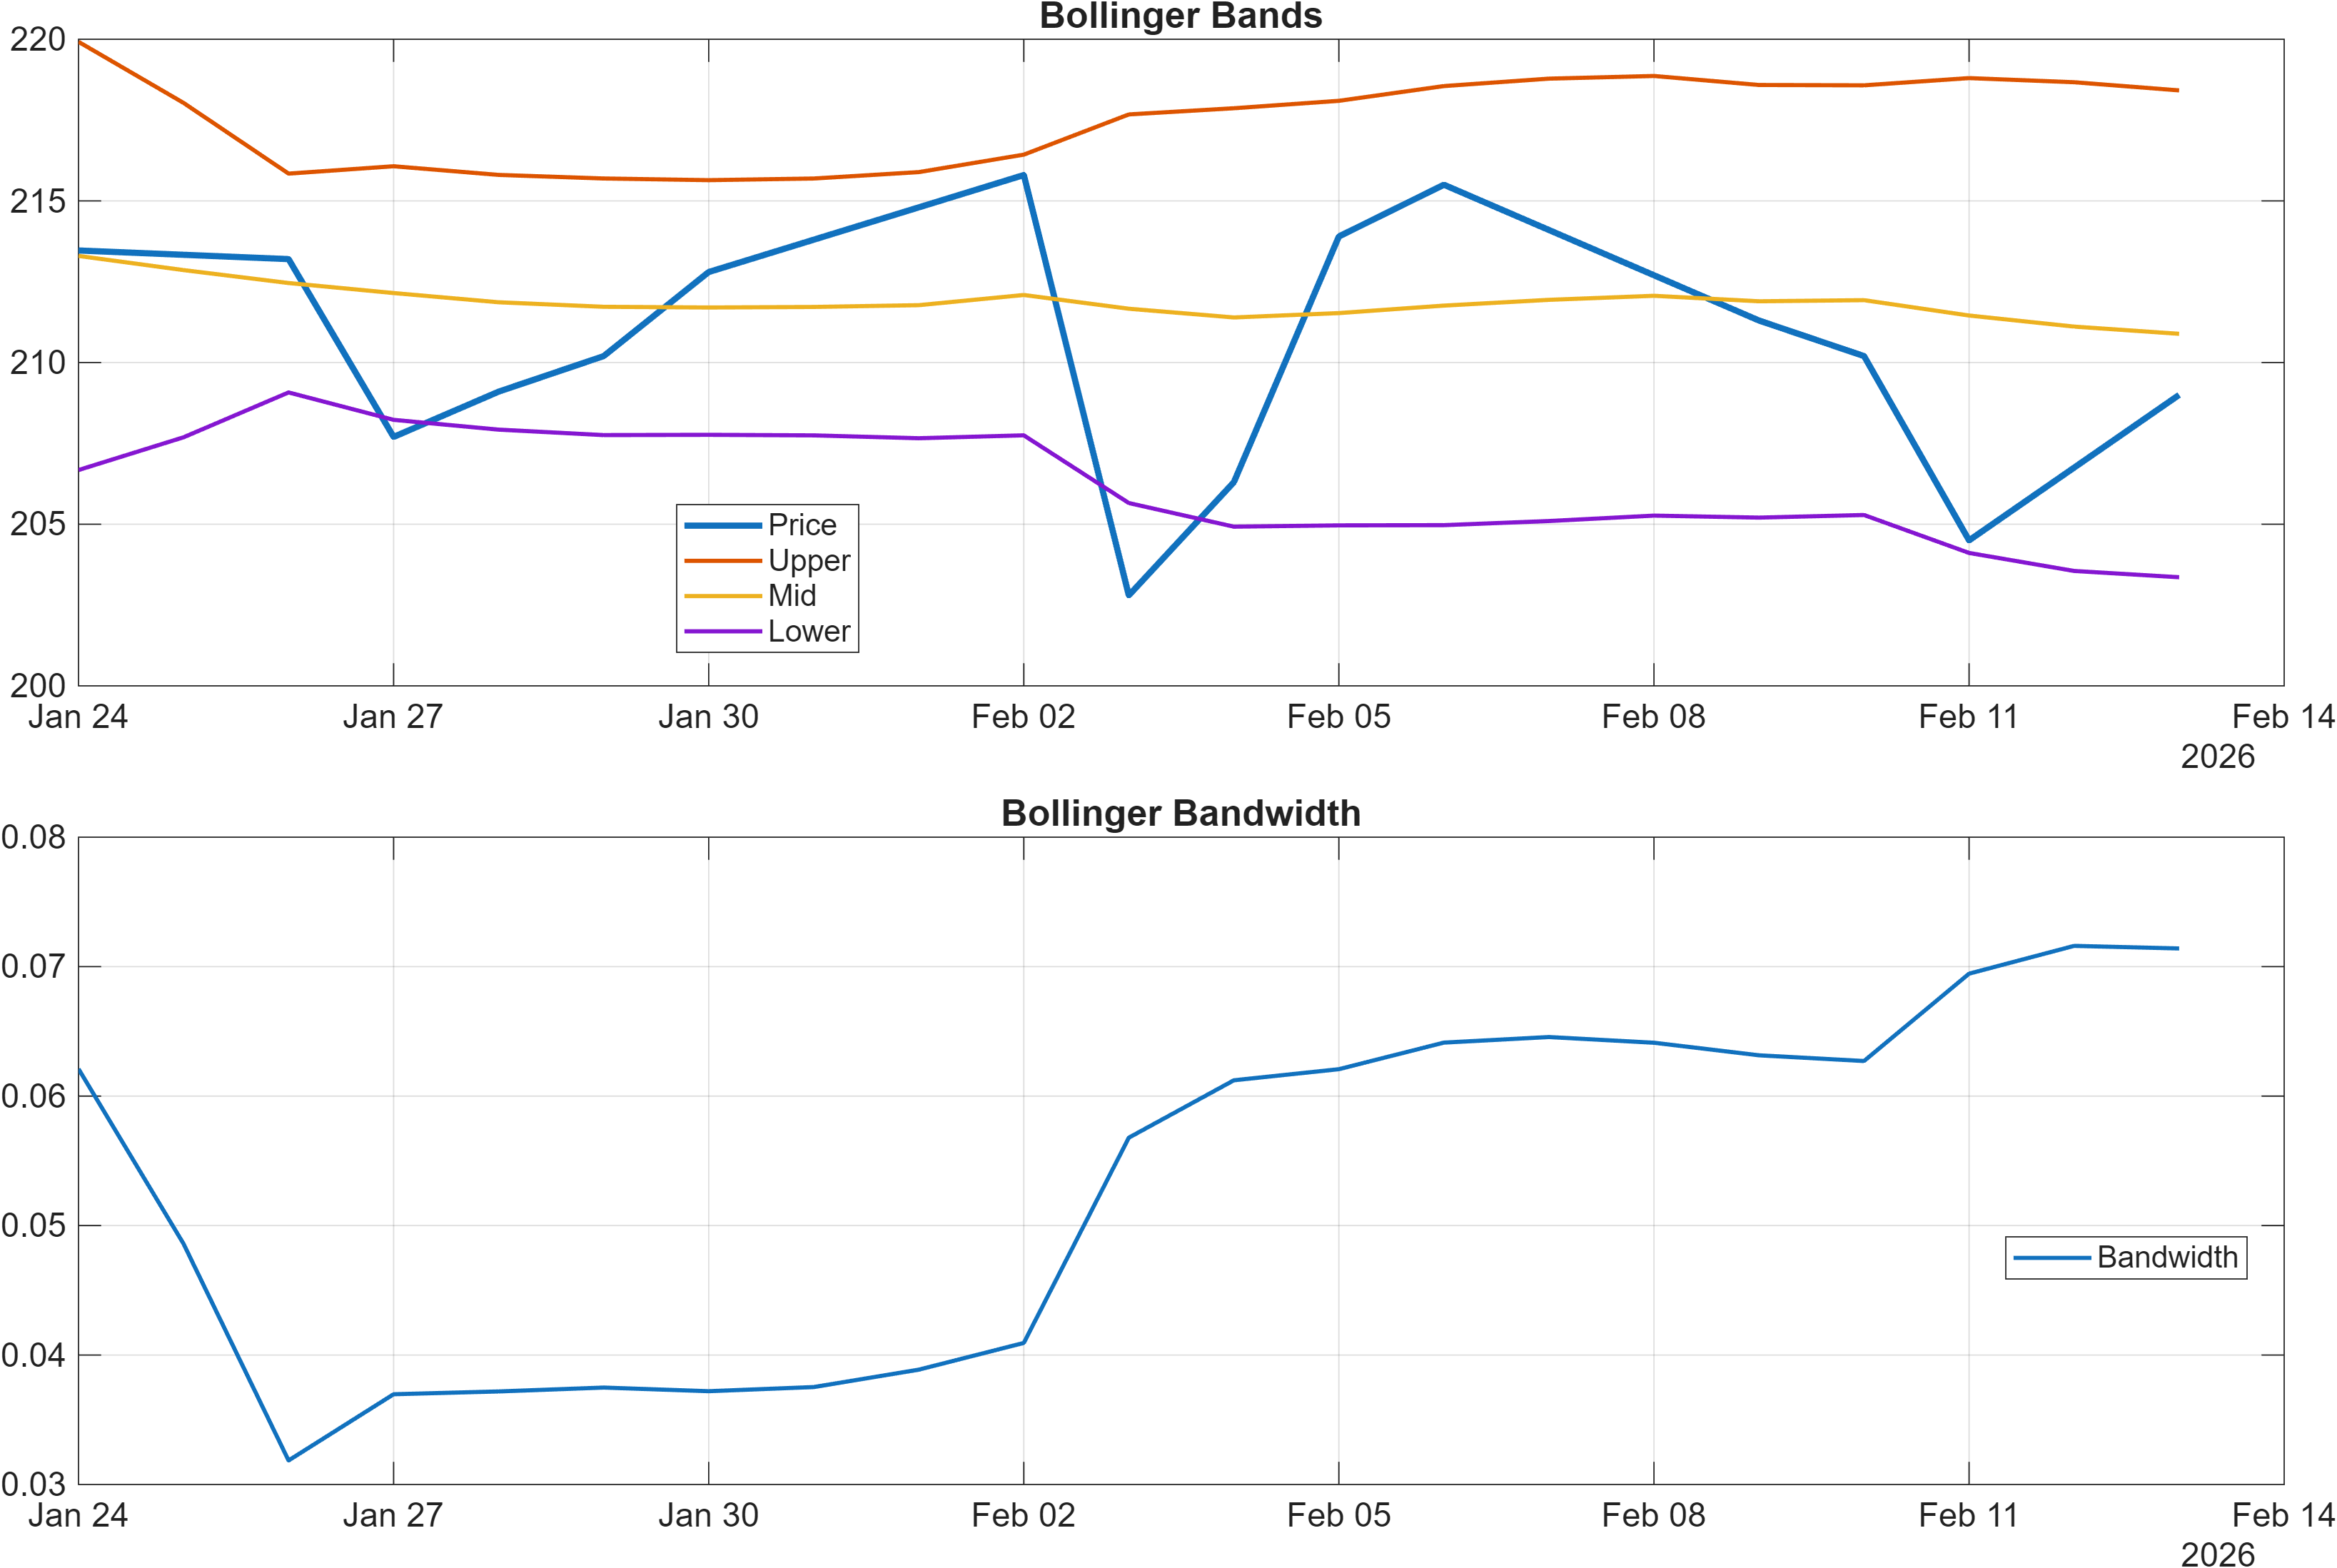
Interpretation: Bandwidth (volatility regime) latest = 0.0714.
Momentum is leaning cautious rather than capitulative. RSI(14) at 45.7 maps cleanly to a Neutral bias—neither stretched to the upside nor washed out. However, the MACD histogram at -0.6586 adds a negative impulse component, consistent with the broader moving-average backdrop that still reads bearish.
Volatility, as proxied by Bollinger Bandwidth 0.0714, sits in a relatively contained regime. When bandwidth is compressed, price often becomes more sensitive to breaks of well-advertised levels—support at 206.7000 and resistance at 224.1333 in this case. Compression does not specify direction, but it increases the value of waiting for confirmation signals (e.g., follow-through candles and supportive volume) rather than pre-empting a move.
The broader dashboard is therefore a “momentum rebuilding but not resolved” read: Daily strength (#8) can persist if MACD begins to improve and the trend structure repairs. If MACD remains negative while RSI stays mid-range, the more likely outcome is continued range behavior—where false starts are common and risk management becomes the edge.
4) Support / Resistance zones
Support ~ 206.7000 | Resistance ~ 224.1333
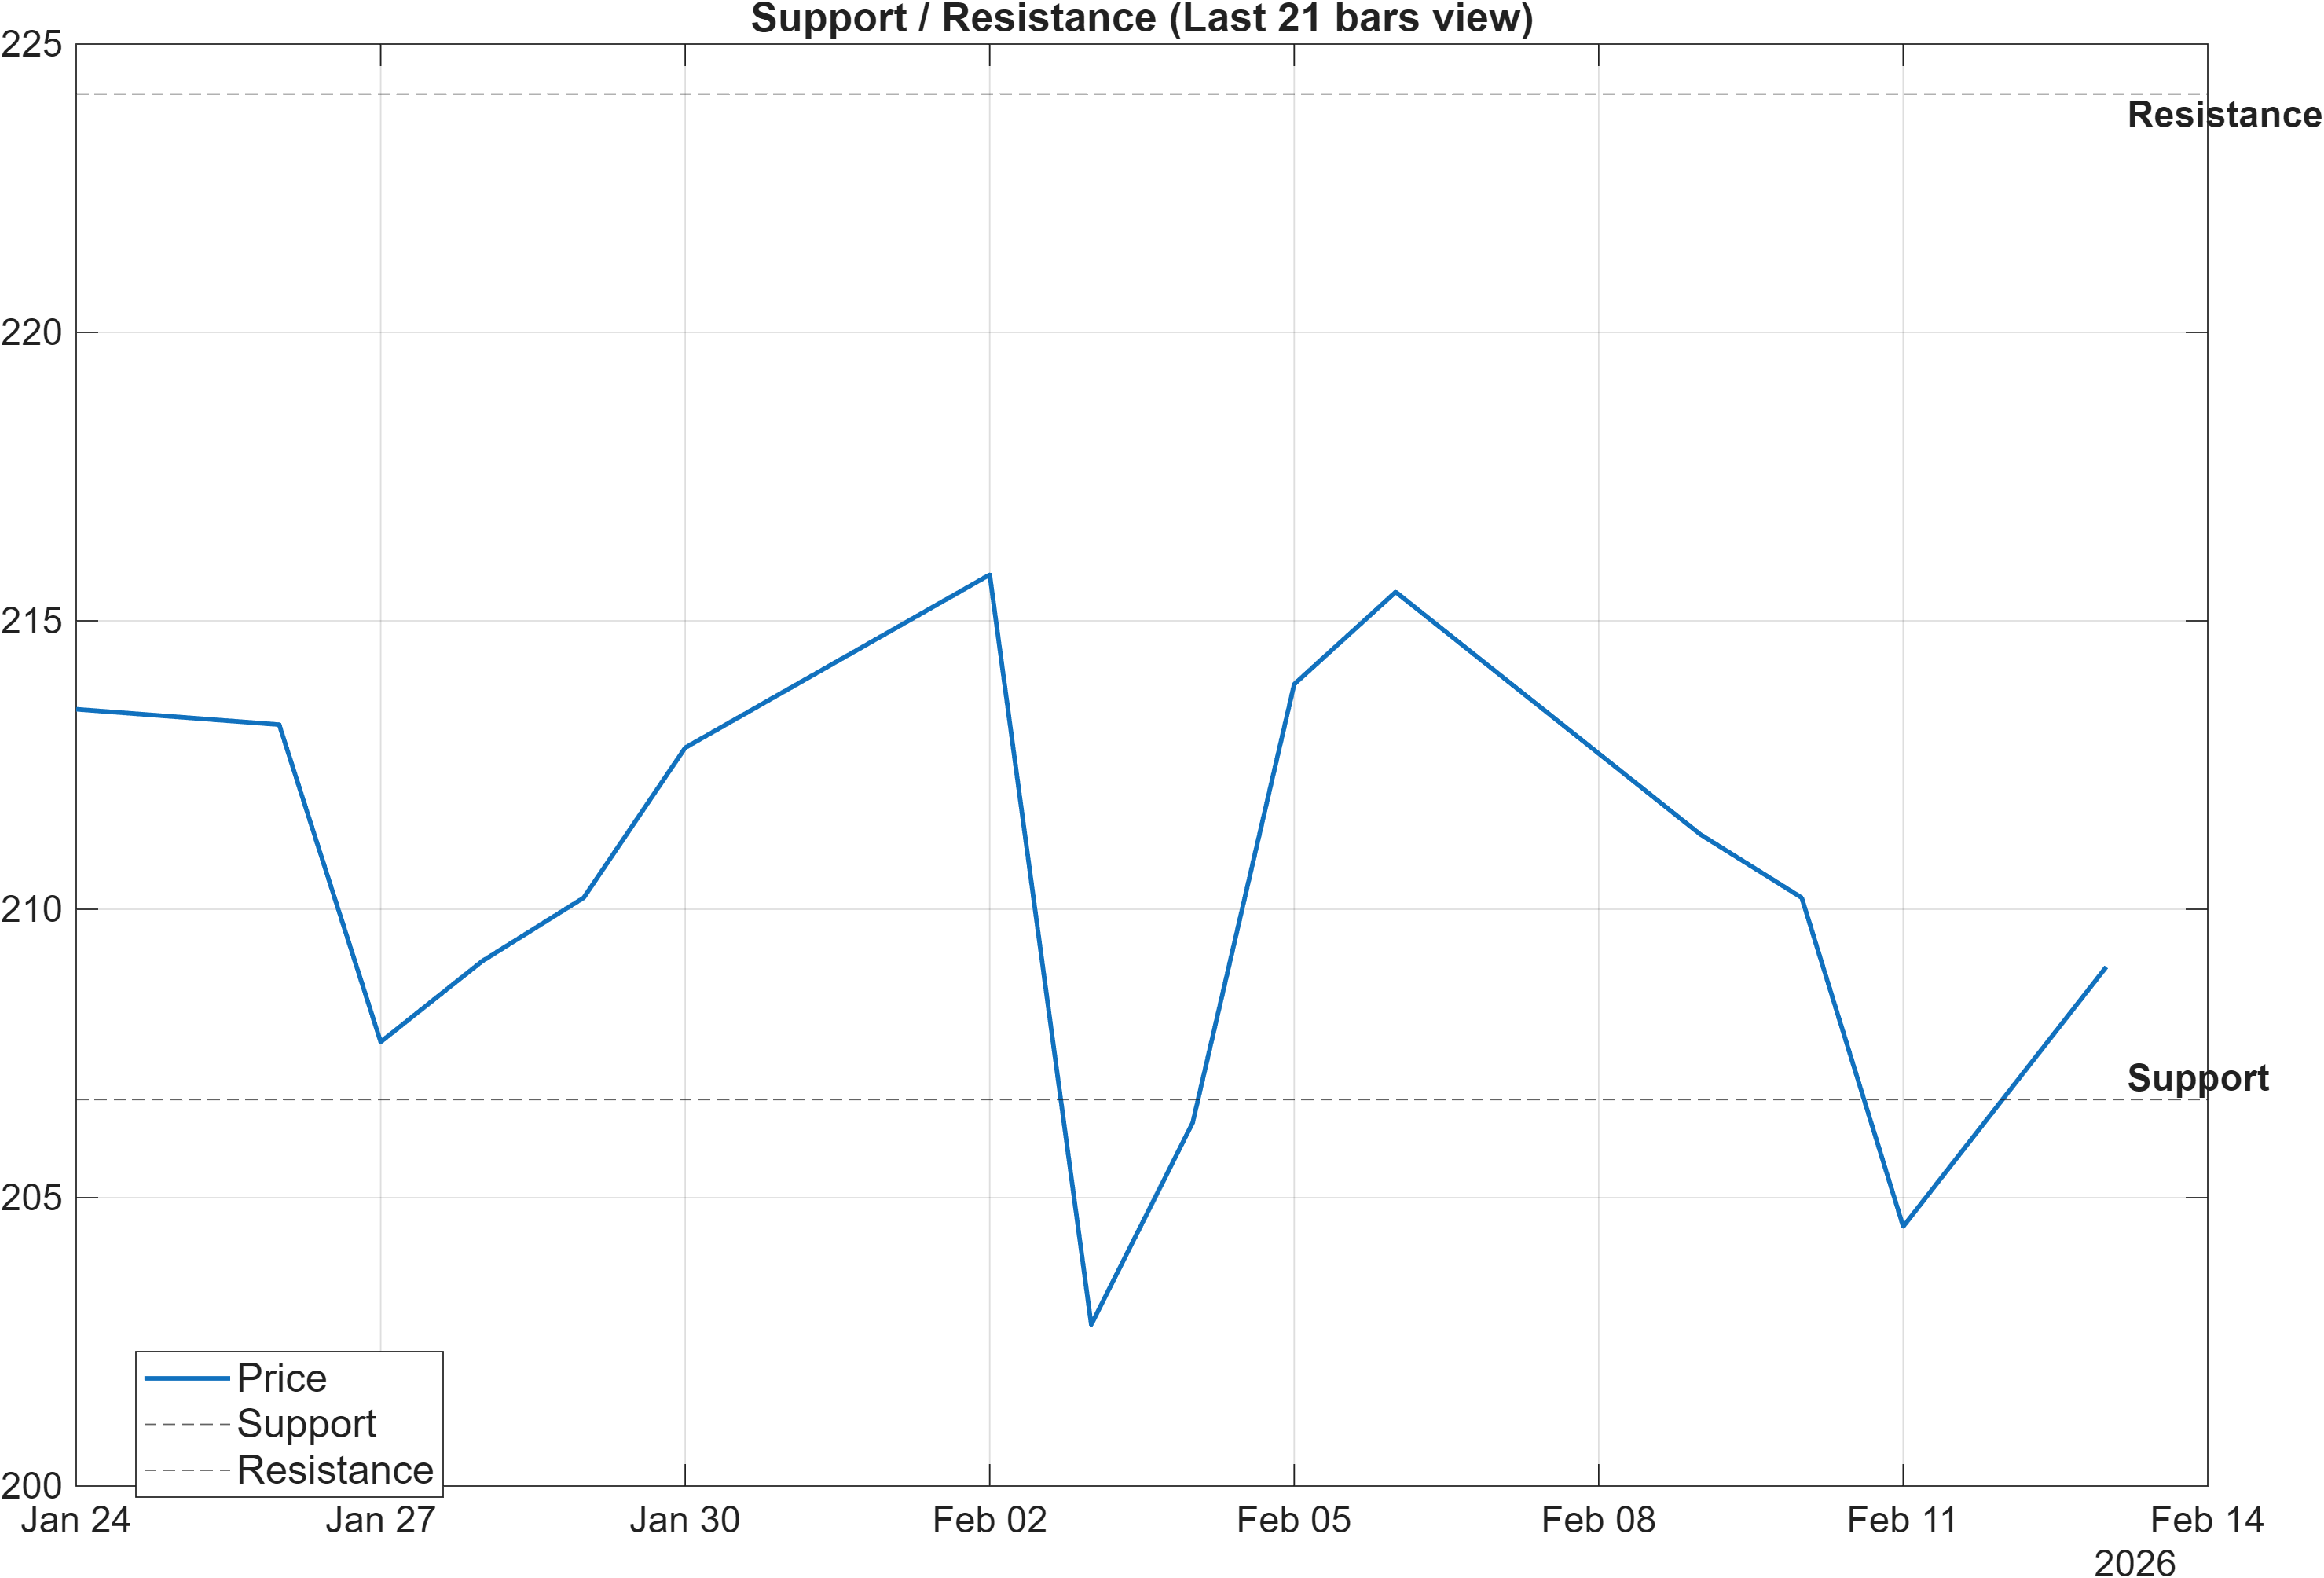
Scenario view: Break above resistance with volume → continuation. Close below support → signal deterioration risk.
The current map is relatively clean: 206.7000 is the primary support reference and 224.1333 the primary resistance reference. With volatility contained (Bandwidth 0.0714), these levels become especially important because compressed regimes can transition quickly once a boundary is breached.
The rank dispersion strengthens the case for level discipline. The Daily rank (#8) argues that buyers have recently expressed relative strength, but the Weekly rank (#770) suggests that strength has not yet matured into a stable intermediate trend. In that context, a break above 224.1333 with volume is the type of confirmation that can help reconcile the short-term and intermediate-term views. Without it, upside attempts may remain susceptible to rejection consistent with the bearish moving-average alignment.
On the downside, a close below 206.7000 carries asymmetric informational value: it would align with the negative technical confluence (blended score -0.490) and would likely reinforce the DRL technical posture (rank #1231/1427) that already sits in the weaker portion of the universe. The most constructive interpretation for longer-horizon holders typically involves support holding while momentum indicators stabilize—rather than requiring immediate upside acceleration.
5) Quant Technical Dashboard (18 Signals)
KGNAI AI Technical Analysis Score (Deep Reinforcement Learning): Rank #1231 out of 1427 (Rank 1 represents the strongest technical positioning and a higher probability of favorable price behavior. As ranks increase toward the maximum, the probability of favorable outcomes weakens and bearish positioning becomes more dominant.) | Label: Bearish | Score: -0.725
18-Signal Technical Confluence Score: -0.389 (Bearish)
Overall Technical Score (18-signal confluence + DRL rank blend): -0.490 (Bearish)
Note: The blended score reflects signal strength weighted against broader AI technical ranking, which may temporarily diverge.
Blended technical score breakdown: -0.490 (Bearish | Bull 3 / Bear 10 / Neutral 5)
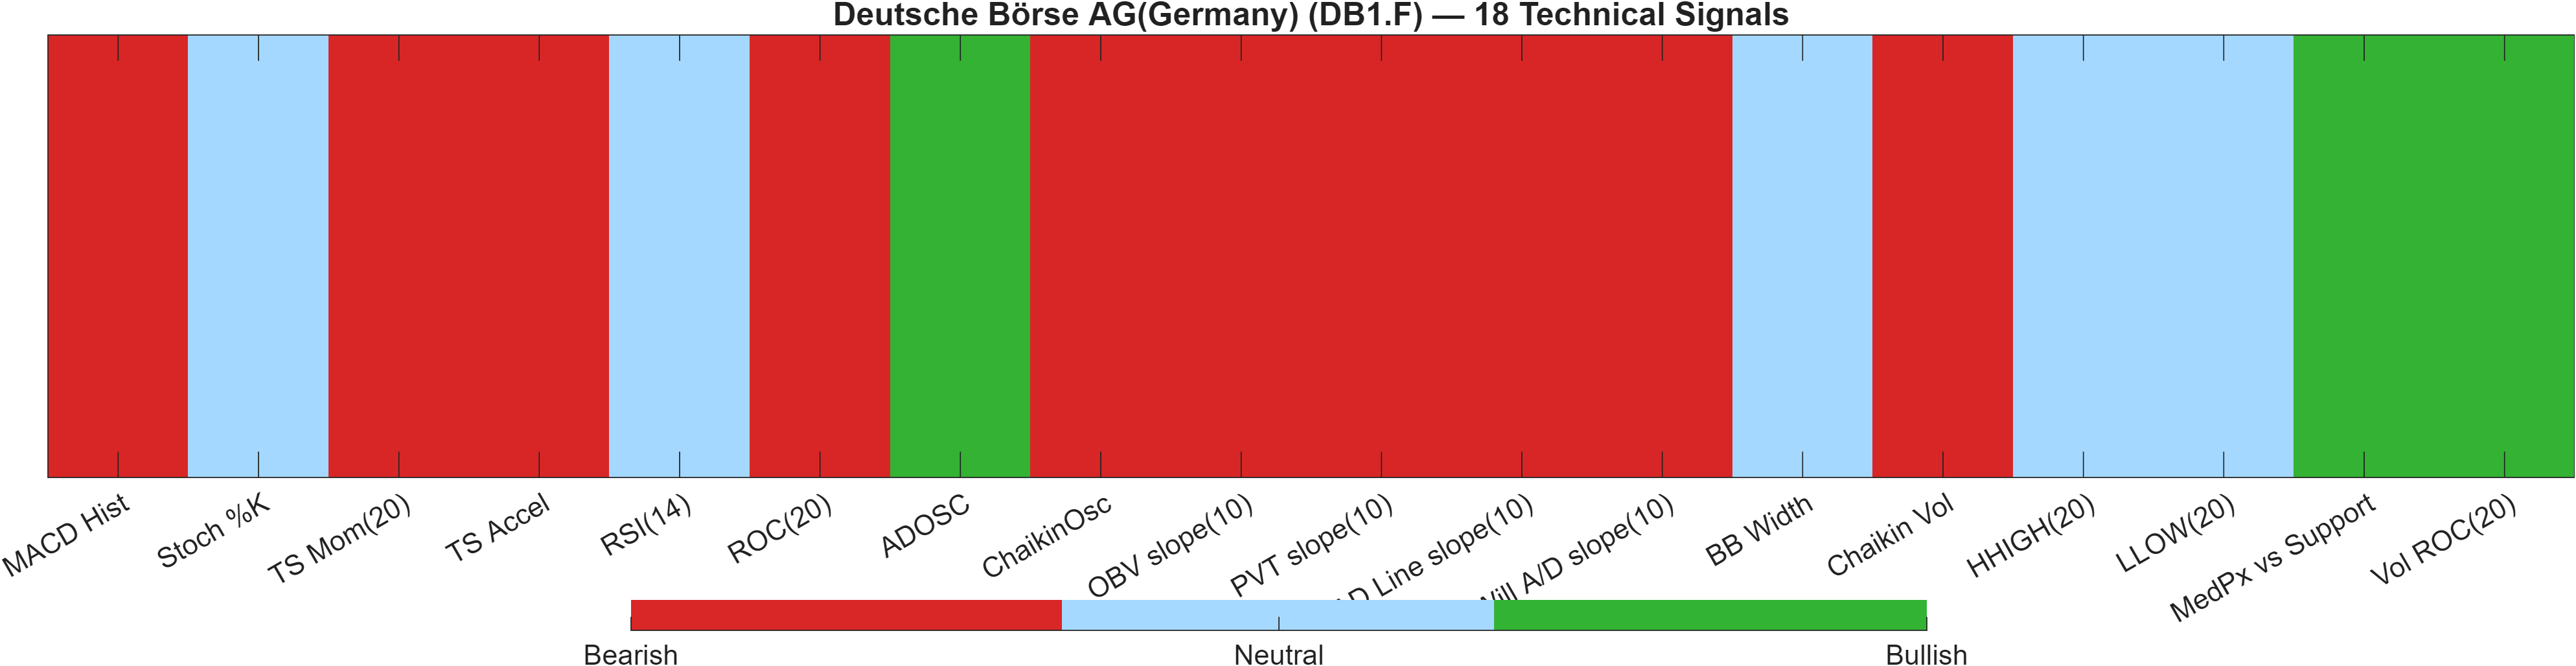
Signal table (Bull/Bear/Neutral)
| Indicator | Value | Signal |
|---|---|---|
| MACD Hist | -0.6586 | Bearish |
| Stoch %K | 22.15 | Neutral |
| TS Mom(20) | -8.833 | Bearish |
| TS Accel | -0.9667 | Bearish |
| RSI(14) | 45.7 | Neutral |
| ROC(20) | -2.031 | Bearish |
| ADOSC | 20.11 | Bullish |
| ChaikinOsc | -1.169e+05 | Bearish |
| OBV slope(10) | -2.909e+05 | Bearish |
| PVT slope(10) | -3607 | Bearish |
| AD Line slope(10) | -2.495e+05 | Bearish |
| Will A/D slope(10) | -3.3 | Bearish |
| BB Width | 0.0714 | Neutral |
| Chaikin Vol | 16.19 | Bearish |
| HHIGH(20) | 216.5 | Neutral |
| LLOW(20) | 201.2 | Neutral |
| MedPx vs Support | 0.1 | Bullish |
| Vol ROC(20) | 52.24 | Bullish |
Interpretation: Indicator-level signals form the base confluence, which is then adjusted using a separate AI-driven technical ranking model. The final technical score summarizes this combined view.
The technical dashboard is the main counterweight to the strong Daily rank. Across the blended framework, DB1.F is labeled Bearish with an overall technical score of -0.490 and a weak DRL technical rank of #1231 out of 1427. The breakdown (Bull 3 / Bear 10 / Neutral 5) indicates that bearish signals are not isolated—they are the plurality across momentum, trend, and several volume/flow measures.
A few readings help characterize the underlying pressure without re-listing the table: TS Mom(20) at -8.833 and ROC(20) at -2.031 point to negative rate-of-change dynamics, while MACD histogram -0.6586 confirms that downside momentum still dominates the short swing. At the same time, select measures remain supportive—ADOSC 20.11 and Vol ROC(20) 52.24 are flagged bullish—suggesting that participation is not uniformly bearish and could be consistent with stabilization attempts.
The practical analytical takeaway is asymmetry: the model’s technical layer requires more evidence before treating the Daily strength as durable. If price can reclaim resistance at 224.1333 with confirmation, the bearish confluence can unwind quickly. If not, the current blend argues that rallies may remain vulnerable within a still-repairing trend structure.
6) News sentiment + extractive gist
Sentiment score (avg): 0.042 | Positive: 50% | Neutral: 0% | Negative: 50%
KGNAI AI News Sentiment Score (normalized -1 to +1): 0.97 (as of 2026-02-06) | Label: Bullish | Overall news score: 0.91
Positive Developments
Recent coverage across major financial outlets indicates a constructive narrative around Deutsche Börse’s operating momentum and investor attention returning after a softer patch in price action. Discussion has highlighted prior reporting of growth across key financial metrics, alongside commentary that the stock’s longer-run profile continues to attract institutional focus. From a market-structure perspective, that backdrop can act as a stabilizer when technicals are mixed: a strong normalized sentiment score of 0.97 (labelled Bullish) and an overall news score of 0.91 suggest language skew has been favorable even as the purely price-driven technical blend remains Bearish. In this setting, the best “positive” confirmation is not the headlines themselves but whether sentiment tailwinds coincide with a reclaim of the 224.1333 resistance zone and improving intermediate ranks beyond Weekly #770.
Neutral / Mixed Developments
The aggregate sentiment mix is not one-directional. The average sentiment score is only 0.042, with 50% positive and 50% negative, implying a balanced flow of supportive and cautionary narratives. This split aligns with the broader KGNAI positioning: strong near-term relative behavior (Daily #8) sits alongside a mostly Neutral medium-horizon stance (Monthly #289, 3-Monthly #663). In practical read-through, mixed coverage often corresponds to a market still negotiating valuation, positioning, and risk premia rather than repricing one dominant thesis. With Bollinger Bandwidth 0.0714 indicating a relatively contained volatility regime, neutral/mixed news flow can keep price oscillating between 206.7000 and 224.1333 until a catalyst (or technical break) resolves the range.
Negative / Risk Signals
Risk commentary has focused on regulatory and oversight uncertainty, including references to antitrust-related scrutiny involving Deutsche Börse and other market infrastructure providers. Even without assigning claims to a single outlet, the common thread is that regulatory investigations can introduce headline sensitivity and widen outcome distributions—particularly relevant when the technical model already leans bearish (blended score -0.490; DRL rank #1231/1427). For traders and longer-horizon holders alike, the key risk is not “bad news” in isolation but whether it appears alongside technical deterioration—most notably a close below 206.7000—which would align narrative risk with the existing negative technical confluence. Given the 50/50 positive-negative split and the 0.042 average score, the news tape currently reads as a contextual factor rather than a dominant driver.
What to monitor next
- Whether price action can clear 224.1333 with confirmatory volume versus failing at the level.
- Whether MACD histogram (-0.6586) improves alongside a shift in intermediate ranks (e.g., Weekly #770).
- Whether support at 206.7000 holds during any risk-driven headline volatility.
Sources referenced: Reuters, Bloomberg, Yahoo Finance, MarketWatch, Investing.com
Snapshot: AI Rank (Short–Mid–Long): Mixed (Neutral–Neutral–Bullish) · Technical Confluence: Bearish · Key Levels: Support ~206.70 | Resistance ~224.13 · News Sentiment: Neutral
7) Sources
- Institutional owners may take dramatic actions as Deutsche Börse AG's (ETR:DB1) recent 3.9% drop adds to one-year losses — https://finance.yahoo.com/news/institutional-owners-may-dramatic-actions-041550597.html?.tsrc=rss
- Deutsche Börse (XTRA:DB1): Is the Market Undervaluing Its Rebuilding Momentum and Long-Term Earnings Power? — https://finance.yahoo.com/news/deutsche-b-rse-xtra-db1-050651026.html?.tsrc=rss
- Antitrust Probe Could Be a Game Changer for Deutsche Börse (XTRA:DB1) — https://finance.yahoo.com/news/antitrust-probe-could-game-changer-070955773.html?.tsrc=rss
- Deutsche Börse (XTRA:DB1): Assessing Valuation After Q3 Revenue and Net Income Growth — https://finance.yahoo.com/news/deutsche-b-rse-xtra-db1-031656479.html?.tsrc=rss
You may also like: How KGNAI AI ranks instruments across global markets
Disclaimer: KGNAI provides AI-generated analytics and educational market commentary only. This is not financial advice. Markets involve risk. Always do your own research.