
HTRO.ST (Hexatronic Group AB) Technical Outlook — Bullish Multi-Horizon Ranks With Overbought Momentum (15-Feb-2026)
Hexatronic Group AB (HTRO.ST) screens with broadly constructive positioning across KGNAI’s multi-horizon rank stack, supported by an overall Bullish technical blend. Within EUROPE’s 1427-instrument universe, the longer-horizon placement remains notably strong (including #1 over 6 months and #3 monthly), while short-run ranks (#228 daily and #244 weekly) also sit in the upper segment of the distribution. Price structure is aligned with trend measures (Close vs MA50 = Bullish; MA50 vs MA200 = Bullish), while momentum is clearly elevated (RSI(14) = 84.45; MACD histogram = 0.1963). Volatility, by contrast, reads more balanced than momentum (Bollinger Bandwidth = 0.3174), suggesting the current move may be driven more by directional persistence than by a broad volatility expansion. Key decision levels remain Support ~21.8600 and Resistance ~28.2950, with continuation vs deterioration conditions defined by how price behaves around those zones. News sentiment in the provided digest is one-sided positive (avg 0.605; 100% positive).
- Short / Mid / Long rank stance: Bullish / Bullish / Bullish (Daily #228; Weekly #244; 6-Monthly #1).
- Technical confluence label: Bullish (Overall Technical Score 0.611; Confluence 0.556; Bull 12 / Bear 2 / Neutral 4).
- Key levels: Support ~ 21.8600 | Resistance ~ 28.2950.
- News sentiment bias: Positive (avg 0.605; Positive 100%).
- Confirmation / invalidation: A break above 28.2950 with volume supports continuation; a close below 21.8600 increases deterioration risk.
KGNAI evaluates relative positioning across large instrument universes by combining cross-sectional ranks with independent technical confirmations. The goal is to identify regimes where multiple signals align, while also flagging divergences that historically precede transitions. Outputs are probabilistic and comparative, designed for consistency across time horizons rather than single-indicator emphasis.
- Ranks are comparative: they reflect placement within a 1427-instrument universe, not a guaranteed outcome.
- Confluence reflects agreement: multiple signals pointing in the same direction generally increases robustness.
- Levels are decision zones: Support/Resistance mark areas where behavior often changes, not exact turning points.
- Sentiment adds context: it can reinforce or conflict with technical conditions.
1) KGNAI AI Analysis
Region: EUROPE
Total universe size: 1427 ranked instruments
- Daily rank: #228 out of 1427 — Bullish
- Weekly rank: #244 out of 1427 — Bullish
- Monthly rank: #3 out of 1427 — Bullish
- 3-Monthly rank: #4 out of 1427 — Bullish
- 6-Monthly rank: #1 out of 1427 — Bullish
- Yearly rank: #30 out of 1427 — Bullish
The rank profile is notable for its time-horizon consistency: HTRO.ST is Bullish across daily, weekly, monthly, and multi-month windows. The longer-horizon placements are especially strong—#1 over 6 months and #3 monthly—which typically signals broad participation rather than a single-session impulse. At the same time, the short-term ranks (#228 daily and #244 weekly) remain constructive rather than stretched into the weakest buckets, implying the recent strength is not solely a late-stage spike within the KGNAI framework.
When short, mid, and long all read Bullish, the analytical question shifts from “direction” to “durability.” Here, the risk is less about an outright bearish reversal signal in the ranks and more about whether momentum becomes too extended versus price structure. The yearly placement (#30) adds a stabilizing backdrop: it suggests this is not a purely short-lived anomaly relative to the broader European universe, even if near-term oscillators may fluctuate.
Term view: Short-term: Bullish. Mid-term: Bullish. Long-term: Bullish.
KGNAI ranks each instrument across large universes using multiple proprietary AI tests and statistical models (millions of data points). Lower ranks generally indicate stronger probability of favorable performance behavior, while higher ranks indicate weaker probability and more bearish positioning.
Want the full universe and complete rank tables? Unlock full access on KGNAI: https://www.kgnai.com/pricing
2) Price & trend overview
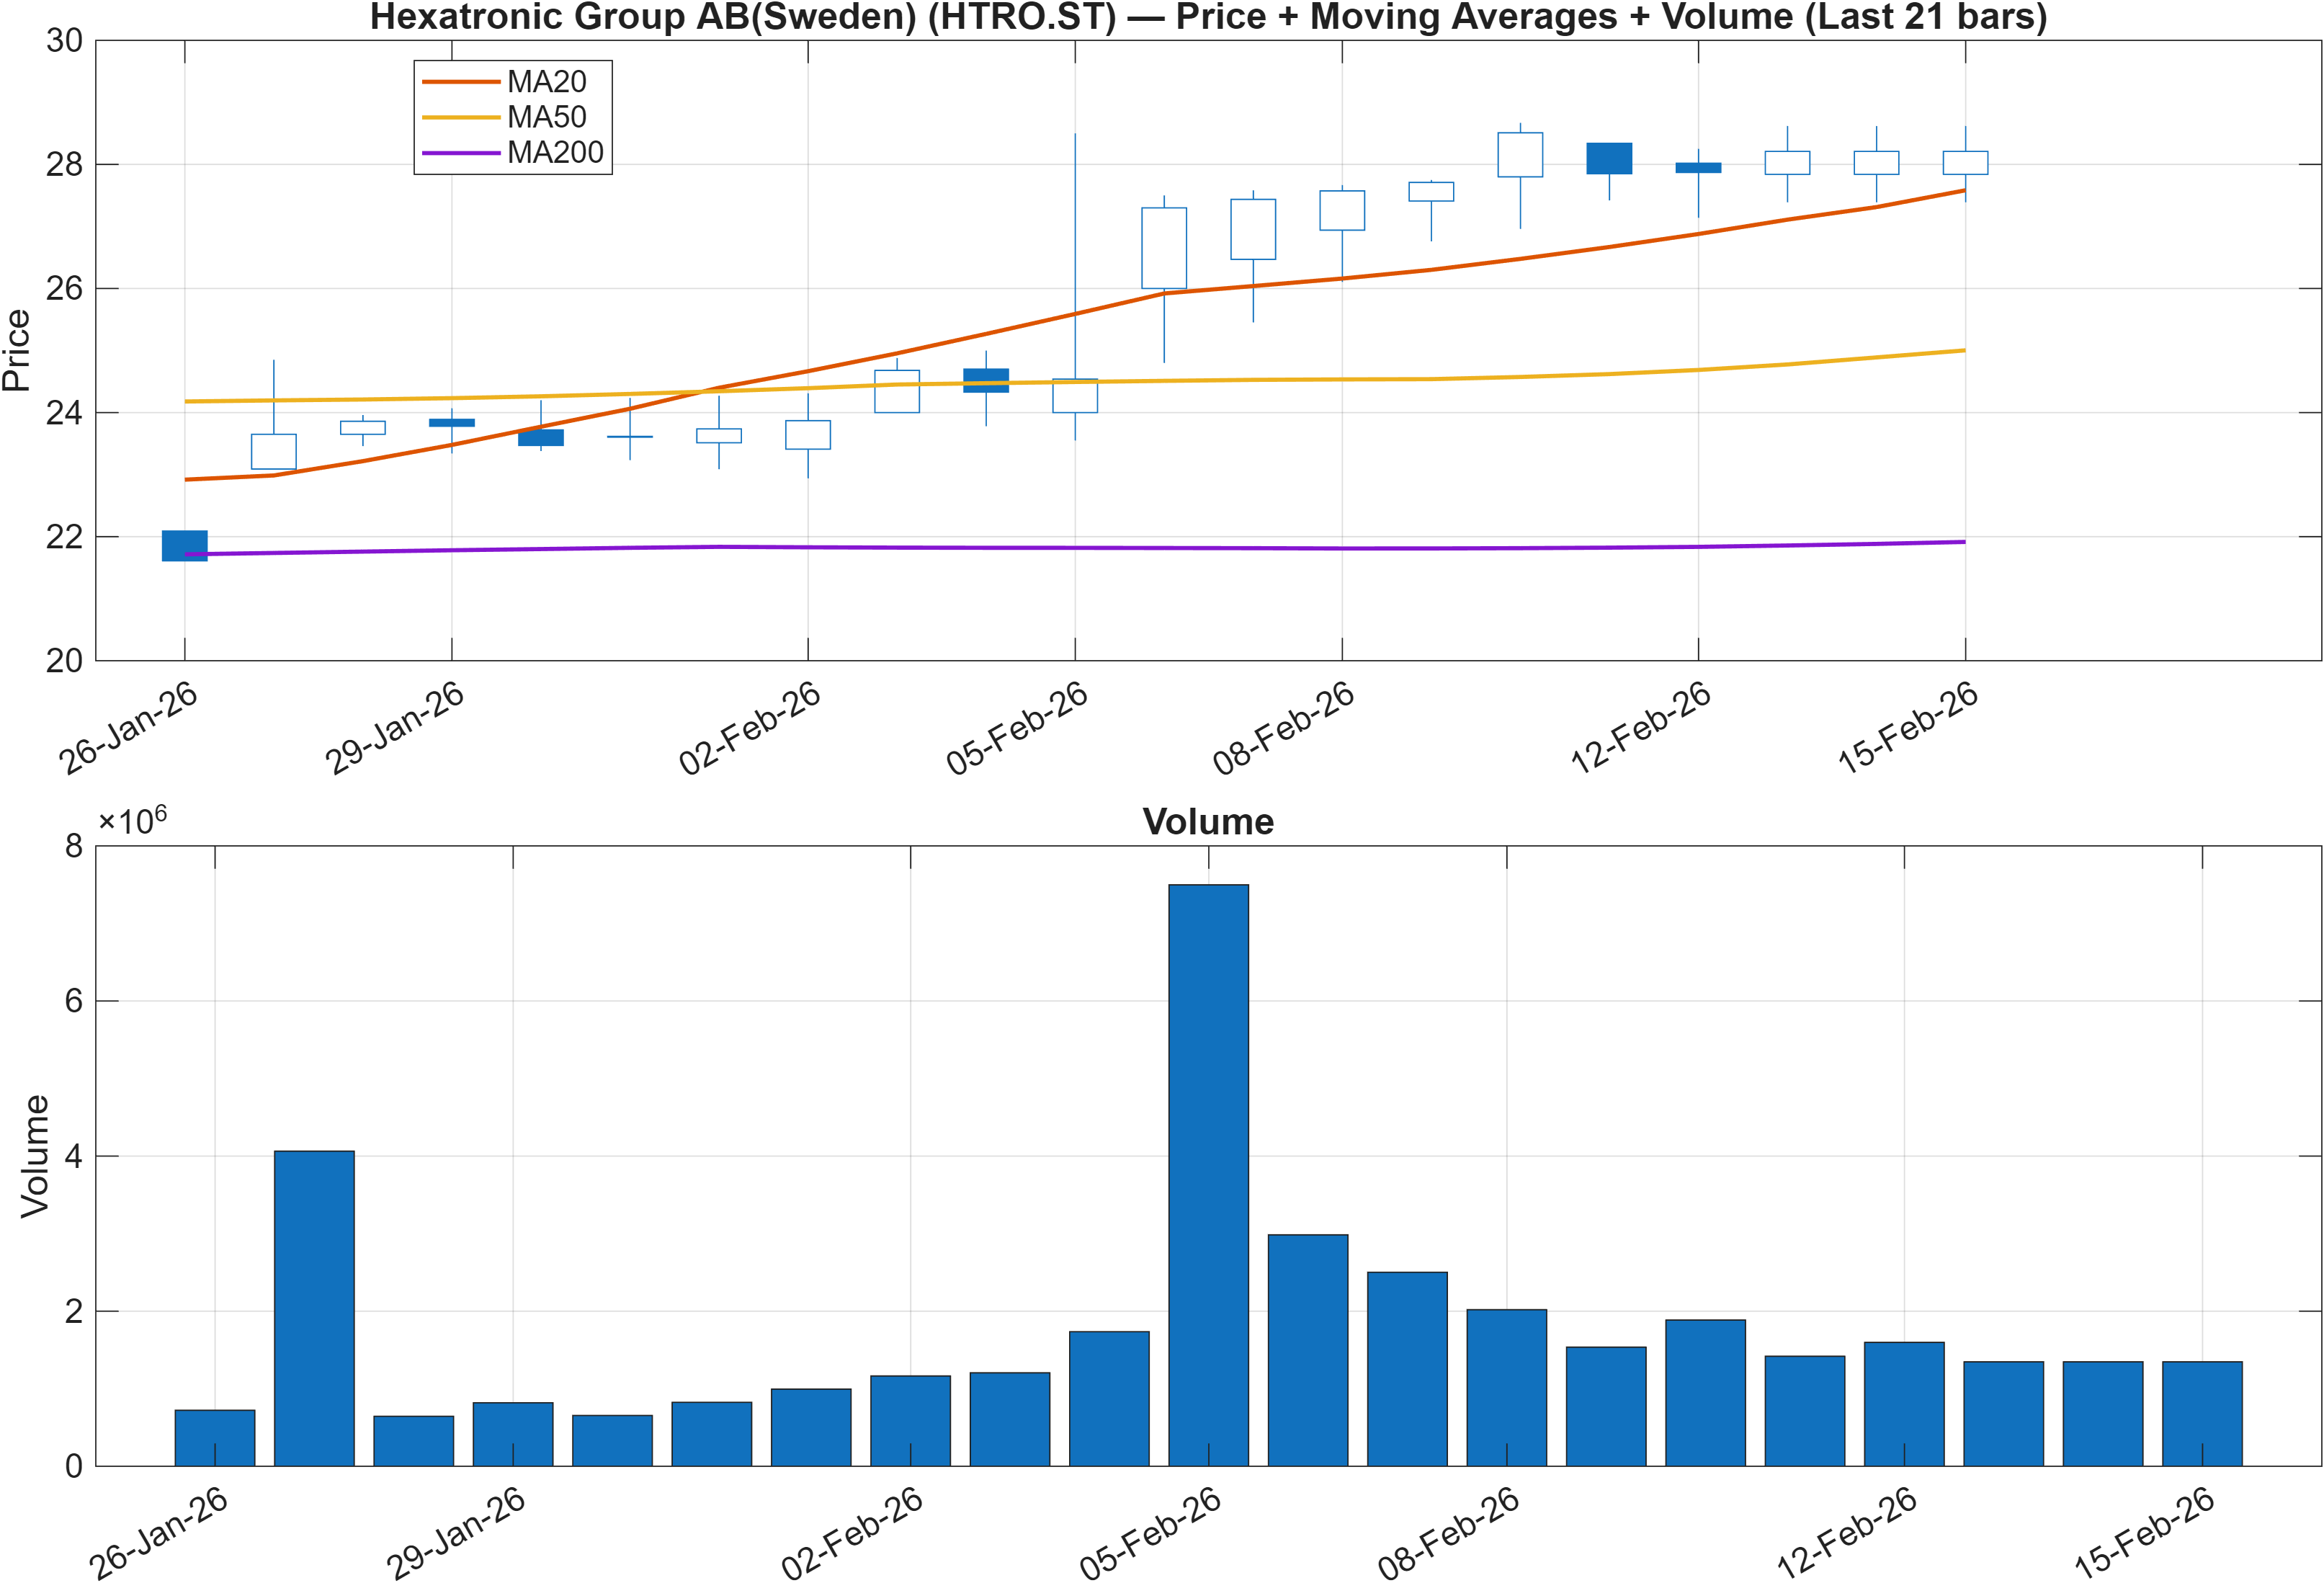
Trend conditions remain internally aligned: Close vs MA50 = Bullish and MA50 vs MA200 = Bullish. That combination typically characterizes a market where the shorter moving average is rising and the longer trend filter is supportive, reducing the probability that strength is purely mean-reversion. In practical chart terms, it indicates price is holding above the intermediate trend while the intermediate trend itself remains above the long-term baseline.
The rank stack complements this trend picture. With #3 monthly, #4 3-monthly, and #1 6-monthly, the broader regime reads as persistent rather than fleeting. This matters because moving-average alignment can sometimes lag; the rank persistence helps validate that the trend signal is not isolated to one methodology. Conversely, the daily and weekly ranks (#228 and #244) suggest the shorter-term layer is constructive but not the dominant driver of the thesis—important context when monitoring for sharp pullbacks inside an otherwise upward regime.
The key analytical tension is whether price remains “trend-supported” while momentum stays elevated. If price holds above trend measures yet momentum begins to cool, the regime can transition into consolidation without breaking the larger structure. If price loses its trend supports while the longer-horizon ranks begin to slip, that would represent a more meaningful change in state.
Interpretation: Close vs MA50 = Bullish, MA50 vs MA200 = Bullish.
3) Momentum & volatility dashboard
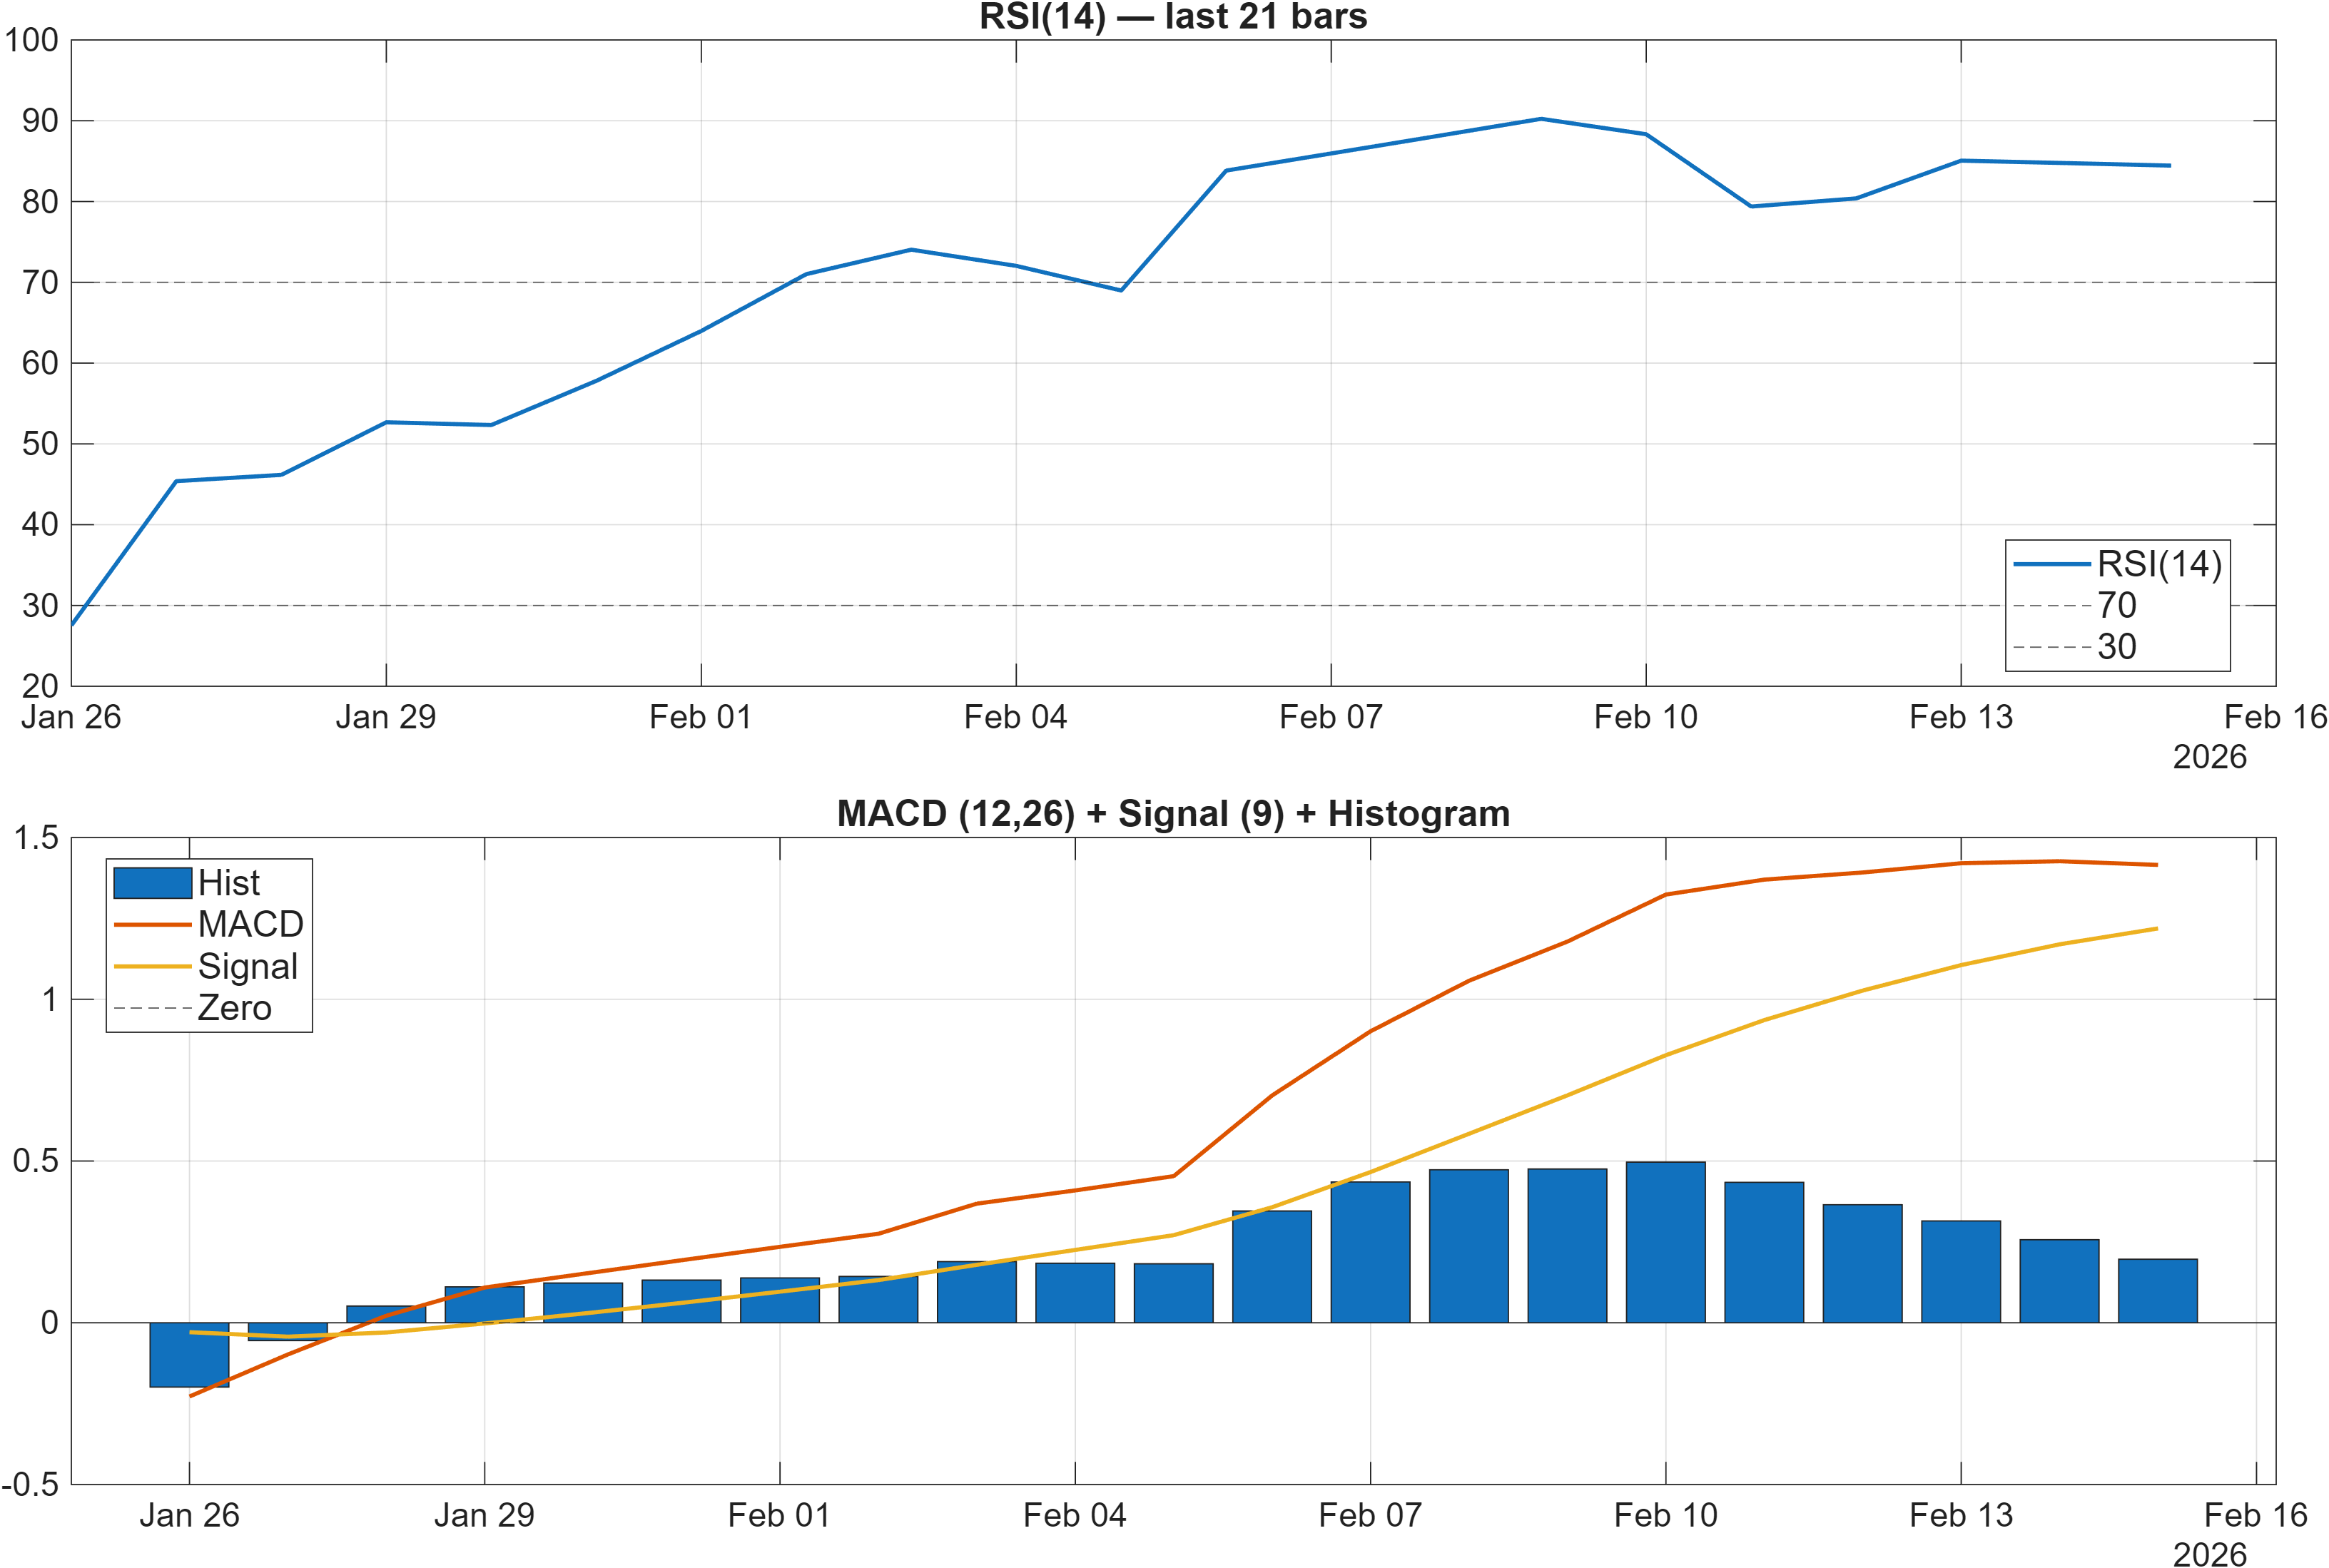
Momentum indicators are decisively positive, but they also indicate a potentially extended short-run state. The RSI bias is Bullish and RSI(14) = 84.45, a level that often coincides with strong directional persistence but can also precede pauses or pullbacks as buyers become crowded. At the same time, trend-following momentum remains supportive: MACD histogram = 0.1963, reinforcing that upside impulse is still present rather than fading into a bearish divergence signal within this dataset.
The broader 18-signal layer reinforces this reading. ROC(20) = 19.28 and TS Mom(20) = 4.56 are Bullish, while a short-term overextension warning shows up in Stoch %K = 88.11 (Bearish). That combination—trend-positive but oscillator-stretched—frequently maps to either (a) continued grind higher with intermittent dips, or (b) sideways compression that “works off” the overbought condition without breaking trend.
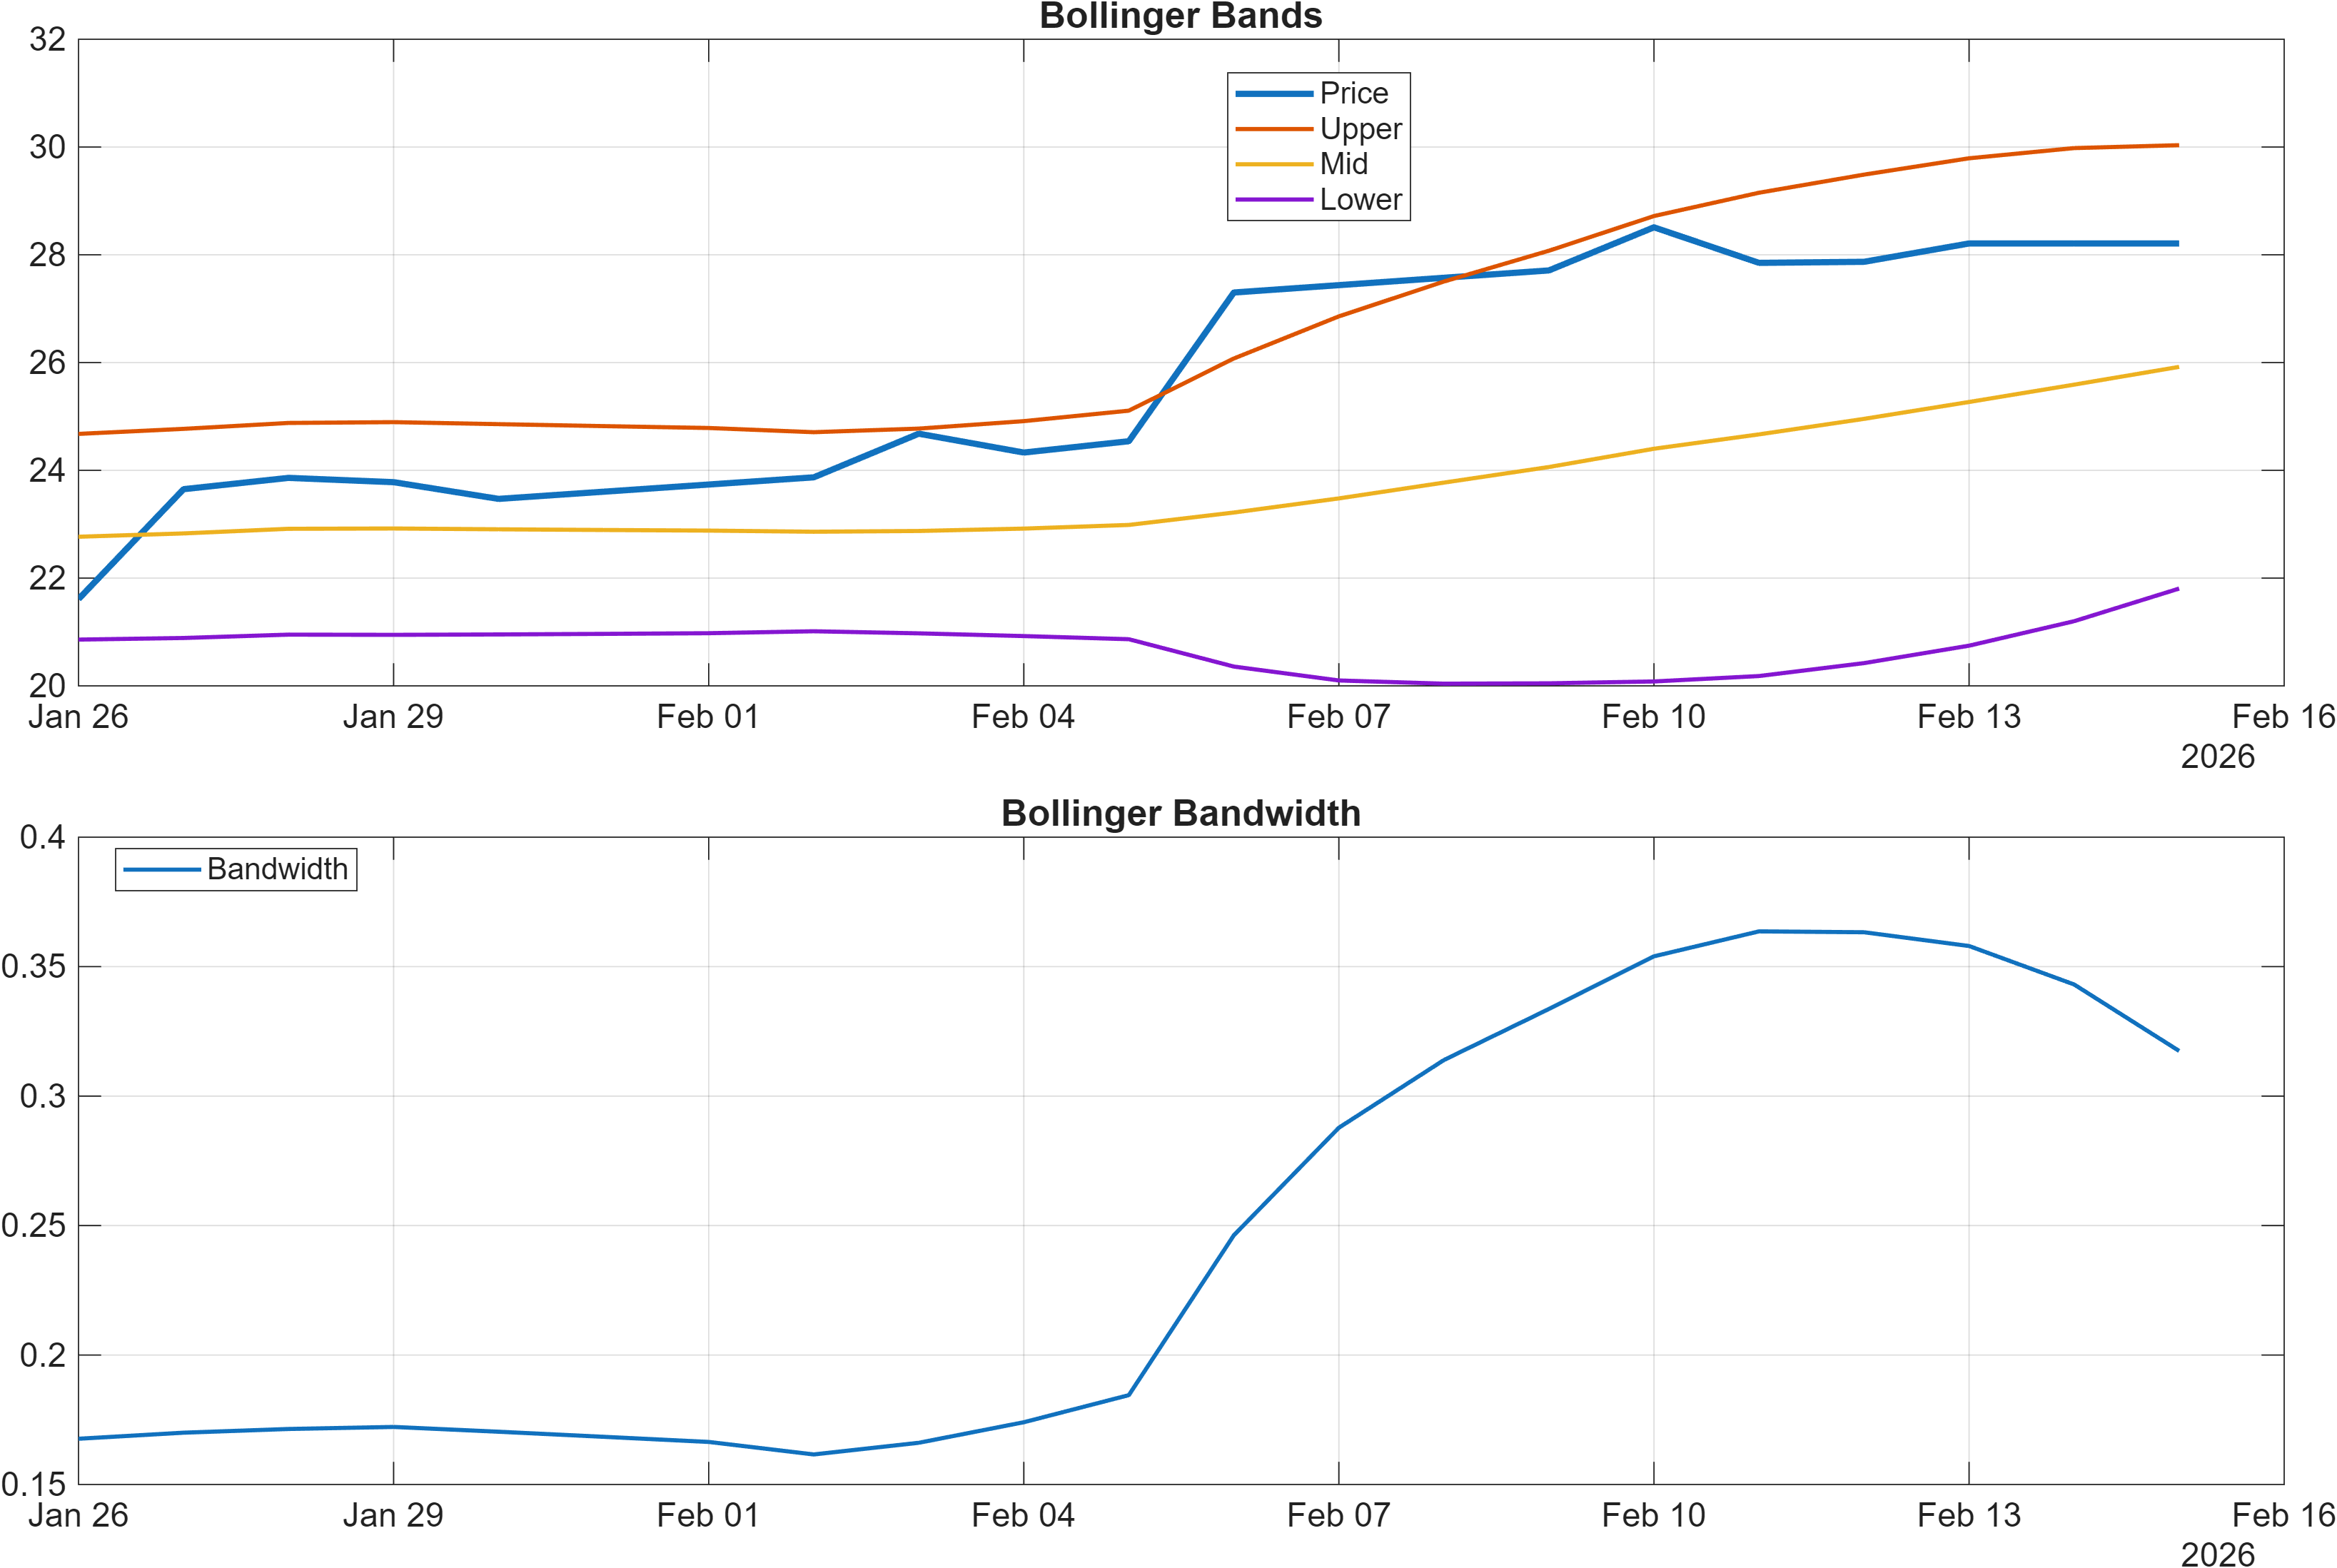
Volatility appears more measured than momentum. Bandwidth (volatility regime) latest = 0.3174 and BB Width is Neutral, suggesting the move is not necessarily accompanied by an outsized volatility expansion. If volatility begins to rise while momentum stays elevated, the market can become more fragile to sharp swings. If volatility stays contained while RSI cools, consolidation becomes a more plausible path than reversal.
Interpretation: RSI bias = Bullish, MACD hist = 0.1963.
Interpretation: Bandwidth (volatility regime) latest = 0.3174.
4) Support / Resistance zones
Support ~ 21.8600 | Resistance ~ 28.2950
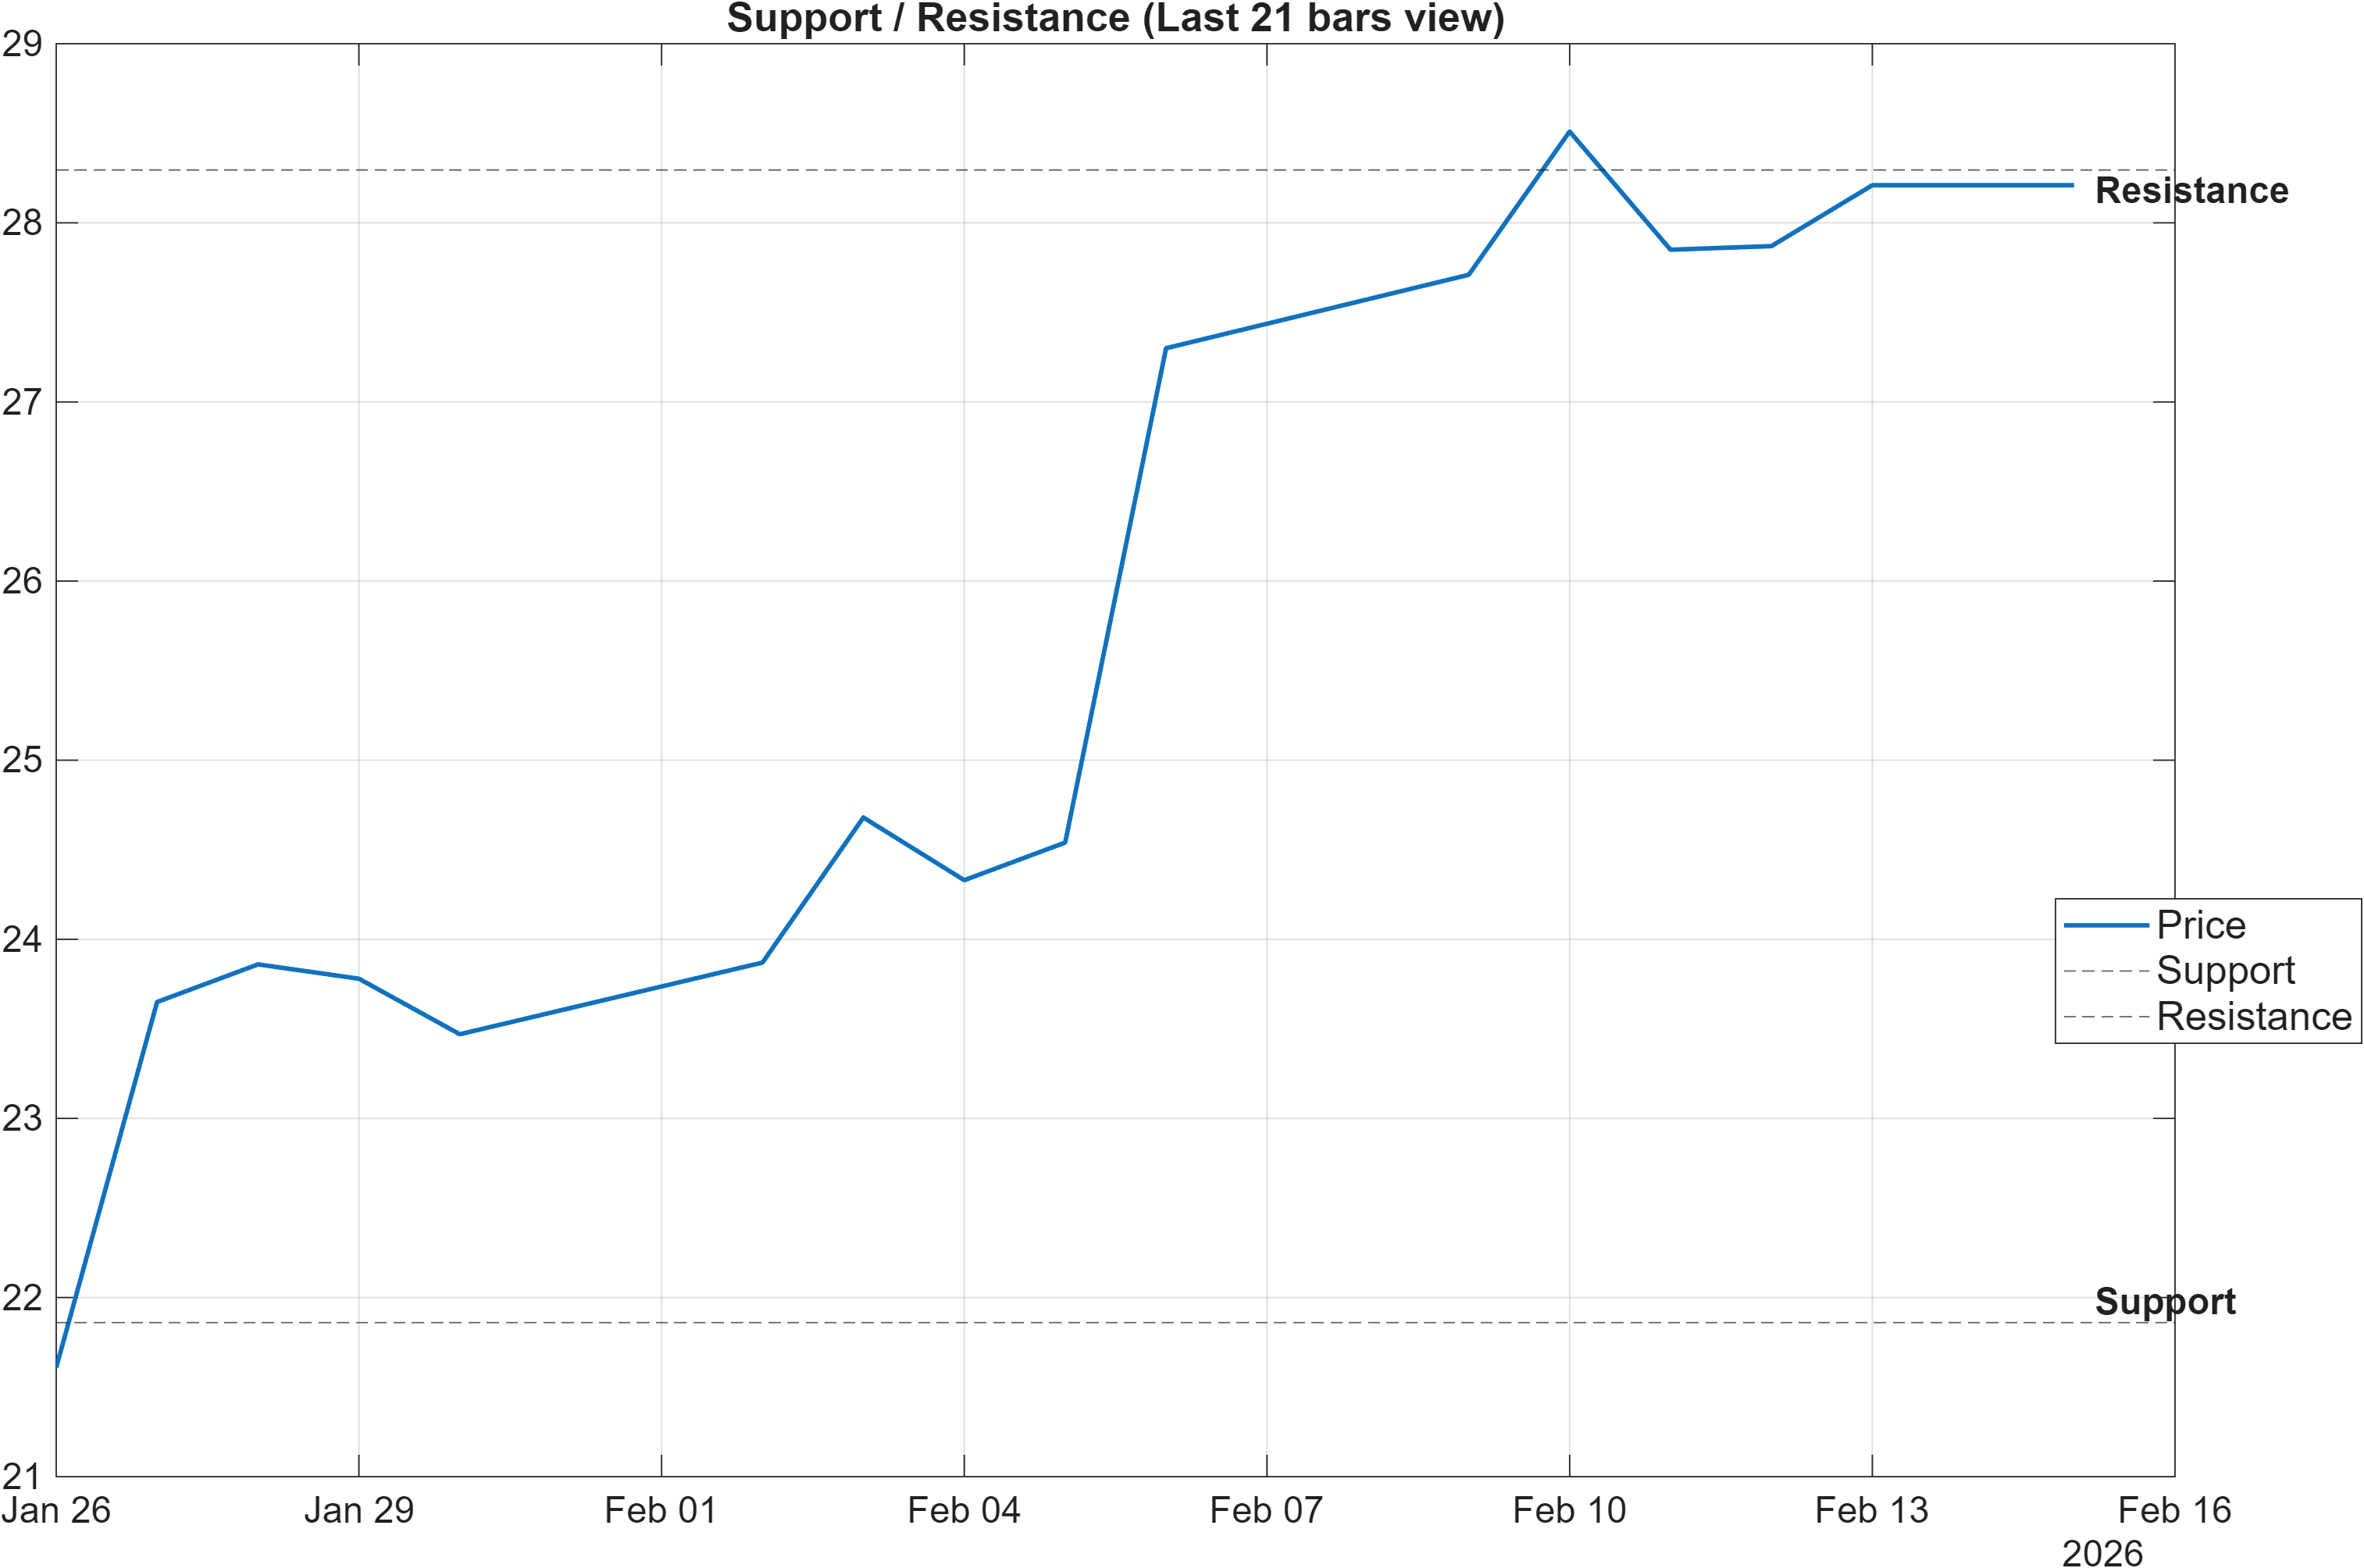
The current map is clean: 21.8600 acts as the main downside reference, while 28.2950 is the primary upside gate. With momentum elevated (RSI(14) at 84.45) and the trend filters Bullish, the resistance zone becomes the more immediate test of whether upside pressure can convert into continuation. A convincing move through resistance tends to matter most when participation confirms; notably, volume change is mixed in the signal set, as Vol ROC(20) = -66.87 (Bearish) can flag uneven follow-through even when price remains strong.
On the downside, support functions as the line between “healthy consolidation” and “regime risk.” The signal table adds context here: MedPx vs Support = 6.145 (Bullish) implies current price context is still comfortably oriented above the support reference in this framework. If price begins compressing toward support while momentum cools (for example, MACD histogram drifting lower from 0.1963), that can still be constructive—until a close below support shifts the balance toward deterioration.
In this setup, levels are best treated as decision zones rather than precise pivots: resistance is the continuation validator, while support is the structural integrity check. A market can remain Bullish across ranks yet experience sharp mean-reversion if resistance rejects and overbought conditions unwind quickly.
Scenario view: Break above resistance with volume → continuation. Close below support → signal deterioration risk.
5) Quant Technical Dashboard (18 Signals)
KGNAI AI Technical Analysis Score (Deep Reinforcement Learning): Rank #185 out of 1427 (Rank 1 represents the strongest technical positioning and a higher probability of favorable price behavior. As ranks increase toward the maximum, the probability of favorable outcomes weakens and bearish positioning becomes more dominant.) | Label: Bullish | Score: 0.741
18-Signal Technical Confluence Score: 0.556 (Bullish)
Overall Technical Score (18-signal confluence + DRL rank blend): 0.611 (Bullish)
Note: The blended score reflects signal strength weighted against broader AI technical ranking, which may temporarily diverge.
Blended technical score breakdown: 0.611 (Bullish | Bull 12 / Bear 2 / Neutral 4)
The technical layer is constructive across both the discrete-signal framework and the reinforcement-learning overlay. The DRL technical rank is #185 out of 1427 with a Bullish label and score 0.741, which fits an upper-quartile style placement rather than an average profile. Meanwhile, the 18-signal confluence prints 0.556 (Bullish) and the blended Overall Technical Score is 0.611 (Bullish), with Bull 12 / Bear 2 / Neutral 4—a breadth profile that typically supports trend persistence until key levels fail.
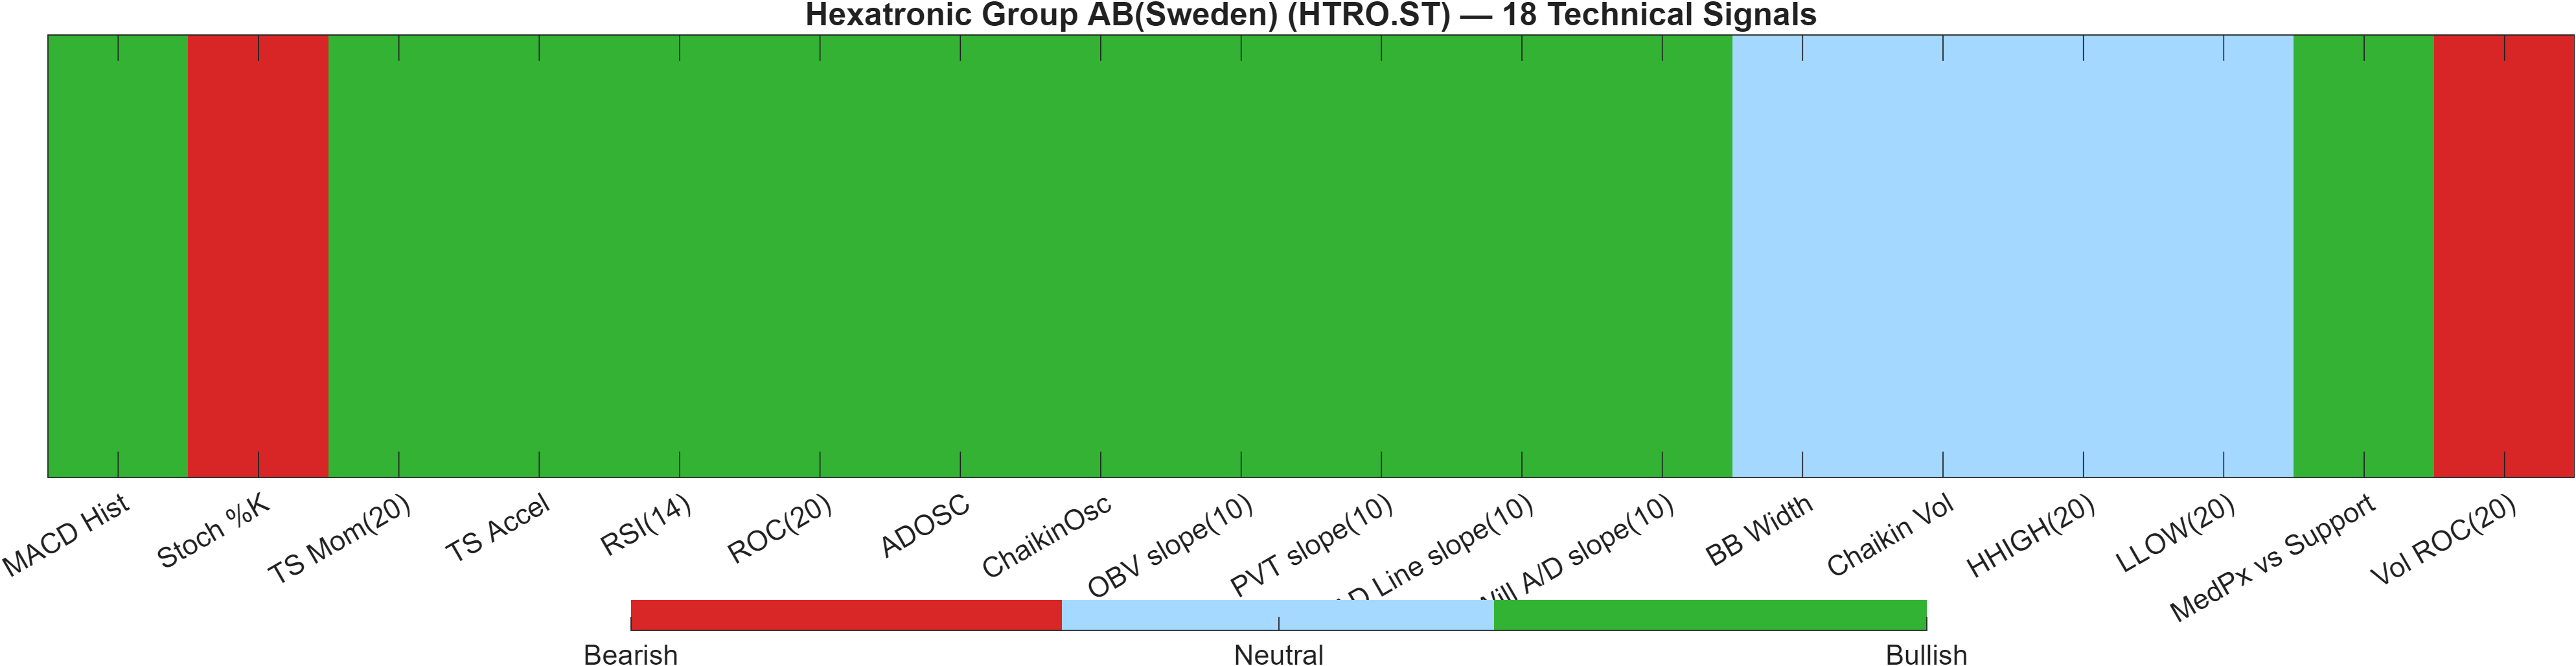
The internal composition matters: momentum and participation proxies are largely supportive (e.g., ADOSC = 65.04, OBV slope(10) = 1.245e+07, AD Line slope(10) = 1.118e+07 are Bullish), which argues that strength is not purely “thin tape” in this dataset. However, there is a meaningful caution flag in the volume change measure (Vol ROC(20) = -66.87, Bearish), suggesting that recent price advances may be occurring with uneven incremental volume, or that volume is not accelerating alongside price.
Neutral readings in volatility and range framing—such as BB Width = 0.3174 (Neutral) and HHIGH(20) = 28.67 (Neutral)—are consistent with a market that is strong but approaching areas where new highs need confirmation. If the Bullish majority remains intact while the neutral group shifts positive, continuation becomes more plausible. If the bearish minority expands beyond oscillator/volume warnings into trend measures, that would be a more material shift than ordinary consolidation.
Signal table (Bull/Bear/Neutral)
| Indicator | Value | Signal |
|---|---|---|
| MACD Hist | 0.1963 | Bullish |
| Stoch %K | 88.11 | Bearish |
| TS Mom(20) | 4.56 | Bullish |
| TS Accel | 3.05 | Bullish |
| RSI(14) | 84.45 | Bullish |
| ROC(20) | 19.28 | Bullish |
| ADOSC | 65.04 | Bullish |
| ChaikinOsc | 1.98e+06 | Bullish |
| OBV slope(10) | 1.245e+07 | Bullish |
| PVT slope(10) | 4.05e+05 | Bullish |
| AD Line slope(10) | 1.118e+07 | Bullish |
| Will A/D slope(10) | 9.6 | Bullish |
| BB Width | 0.3174 | Neutral |
| Chaikin Vol | -28.46 | Neutral |
| HHIGH(20) | 28.67 | Neutral |
| LLOW(20) | 22.94 | Neutral |
| MedPx vs Support | 6.145 | Bullish |
| Vol ROC(20) | -66.87 | Bearish |
Interpretation: Indicator-level signals form the base confluence, which is then adjusted using a separate AI-driven technical ranking model. The final technical score summarizes this combined view.
6) News sentiment + extractive gist
Sentiment score (avg): 0.605 | Positive: 100% | Neutral: 0% | Negative: 0%
KGNAI AI News Sentiment Score (normalized -1 to +1): Not available (as of —) | Label: Not available | Overall news score: 0.61
Positive Developments
Recent coverage across major financial outlets leans constructive in tone for Hexatronic Group AB, with the provided digest scoring 0.605 on average and showing 100% positive classification in the captured items. The narrative emphasis is broadly consistent with a market that is rewarding momentum and relative strength: KGNAI’s ranks are Bullish across horizons, including #3 monthly and #1 6-monthly, while technical confirmation remains supportive via an Overall Technical Score of 0.611 (Bullish). In this context, bullish coverage tends to act as a reinforcement mechanism rather than the primary driver, especially when trend filters are already aligned (Close vs MA50 = Bullish; MA50 vs MA200 = Bullish). The most actionable implication is whether sentiment remains supportive as price approaches the resistance zone at 28.2950, where confirmation typically requires follow-through beyond optimistic framing.
Neutral / Mixed Developments
The same digest also contains elements that read as informational rather than directional, which fits with a technical profile that is strong but potentially stretched. Momentum is clearly elevated (RSI(14) 84.45; MACD histogram 0.1963), while volatility is comparatively moderate (Bandwidth 0.3174 and BB Width Neutral). That mix can produce a “pause-and-hold” regime where price consolidates without breaking the broader uptrend. On the data side, the news sentiment normalization field is Not available (as of —), which limits how precisely the platform can benchmark the tone against broader corpora beyond the simple average score and classification. As a result, the most neutral stance is to treat sentiment as contextual bias, with primary weight remaining on support/resistance behavior and indicator confirmation.
Negative / Risk Signals
Despite the positive classification in the provided items, the risk layer for HTRO.ST is more technical than narrative in this snapshot. Overbought-style conditions can be fragile: Stoch %K is 88.11 (Bearish) while RSI(14) sits at 84.45, and these conditions can amplify downside reactions if price fails near 28.2950. A second, more subtle caution is participation quality—Vol ROC(20) = -66.87 is Bearish even as multiple accumulation proxies are Bullish, a combination that can appear when rallies persist but incremental volume does not accelerate. The key invalidation level remains the support zone at 21.8600; a close below that level would shift the discussion from consolidation risk to deterioration risk, regardless of whether headline tone stays positive.
- Acceptance vs rejection around 28.2950, ideally with improving participation relative to Vol ROC(20) = -66.87.
- Whether momentum cools without structural damage (RSI(14) easing from 84.45 while trend alignment remains Bullish).
- Any downside break that challenges 21.8600, which would raise deterioration risk versus ordinary consolidation.
Snapshot: AI Rank (Short–Mid–Long): Bullish (Bullish–Bullish–Bullish) · Technical Confluence: Bullish · Key Levels: Support ~21.86 | Resistance ~28.30 · News Sentiment: Positive
Sources referenced: Reuters, Bloomberg, Yahoo Finance, MarketWatch, Investing.com
7) Sources
Not available in the provided data.
You may also like: How KGNAI AI ranks instruments across global markets
Disclaimer: KGNAI provides AI-generated analytics and educational market commentary only. This is not financial advice. Markets involve risk. Always do your own research.