
DG.PA (Vinci S.A.) — Neutral, confirmation-dependent setup as of 24-Apr-2026
Vinci S.A. (DG.PA) currently screens as a neutral opportunity across KGNAI’s cross-sectional rank system, with short-, mid-, and long-horizon ranks clustered near the middle of the 1420-instrument European universe. Price structure shows a constructive moving-average configuration (close vs MA50 bullish; MA50 vs MA200 bullish), while momentum is less decisive: RSI is neutral at 47.06 and MACD histogram is negative at -0.7047. Volatility remains relatively compressed with Bollinger Band width at 0.0632, a regime that often coincides with tighter ranges and higher sensitivity to level breaks. In this context, the analytically clean decision points are the defined zones: support ~124.8250 and resistance ~139.2917. News sentiment is quantitatively positive (sentiment score avg 0.139; normalized score 1.00), but the technical confluence stays slightly negative (-0.056), reinforcing a “wait for confirmation” posture rather than a one-sided read.
- Short / Mid / Long rank stance: Neutral / Neutral / Neutral (daily #563, weekly #631, yearly #509 out of 1420).
- Technical confluence label: Neutral (18-signal confluence -0.056; blended technical score -0.016).
- Key levels: Support 124.8250 and resistance 139.2917 remain the primary decision zones.
- News sentiment bias: Bullish (normalized 1.00; positive share 67%, negative 0%).
- Confirmation / invalidation condition: A break and hold above 139.2917 with volume favors continuation; a close below 124.8250 increases deterioration risk.
What KGNAI Measures
KGNAI evaluates assets using large cross-sectional datasets built from millions of structured data points. Inputs incorporate fundamental metrics, technical structures, and systematically processed news sentiment. Statistical models, machine learning, and AI frameworks are used to assess relative positioning, signal alignment, and probabilistic behavior across broad universes.
How to Read This Report
- Ranks are comparative across the tracked universe, not absolute price targets.
- Confluence reflects alignment among independent signal groups.
- Support/resistance levels are probabilistic decision zones, not guarantees.
- Sentiment provides contextual bias within the broader analytical framework.
1) KGNAI AI Analysis
Region: EUROPE
Total universe size: 1420 ranked instruments
- Daily rank: #563 out of 1420 — Neutral
- Weekly rank: #631 out of 1420 — Neutral
- Monthly rank: #467 out of 1420 — Neutral
- 3-Monthly rank: #455 out of 1420 — Neutral
- 6-Monthly rank: #367 out of 1420 — Neutral
- Yearly rank: #509 out of 1420 — Neutral
DG.PA’s rank distribution is notably consistent across horizons: the daily rank at #563, weekly at #631, and monthly at #467 all sit near the middle of a 1420-instrument universe. That clustering signals low dispersion in the model’s multi-test output—neither strong accumulation characteristics nor persistent technical weakness dominate across timeframes.
The most constructive aspect of the rank stack is the 6-month reading (#367), which is closer to the upper quartile boundary than the shorter-term ranks. When a longer horizon is firmer than the short horizon, it often reflects a market that has improved structurally but is currently digesting gains or reacting to nearer-term flows. Conversely, the weekly lag (#631) suggests the recent tape has not fully confirmed that longer-horizon strength.
Term labels remain Neutral across short-, mid-, and long-term views, aligning with the “conservative in the absence of strong confirmation” framework. Practically, this is the regime where level-based validation matters more than narrative. With ranks not strongly directional, the most reliable edge typically comes from observing whether price can translate supportive conditions (e.g., constructive trend structure) into follow-through through resistance, or whether weakness presses into defined support.
KGNAI ranks each instrument across large universes using multiple proprietary AI tests and statistical models (millions of data points). Lower ranks generally indicate stronger probability of favorable performance behavior, while higher ranks indicate weaker probability and more bearish positioning.
Term view: Short-term: Neutral. Mid-term: Neutral. Long-term: Neutral.
2) Price & trend overview
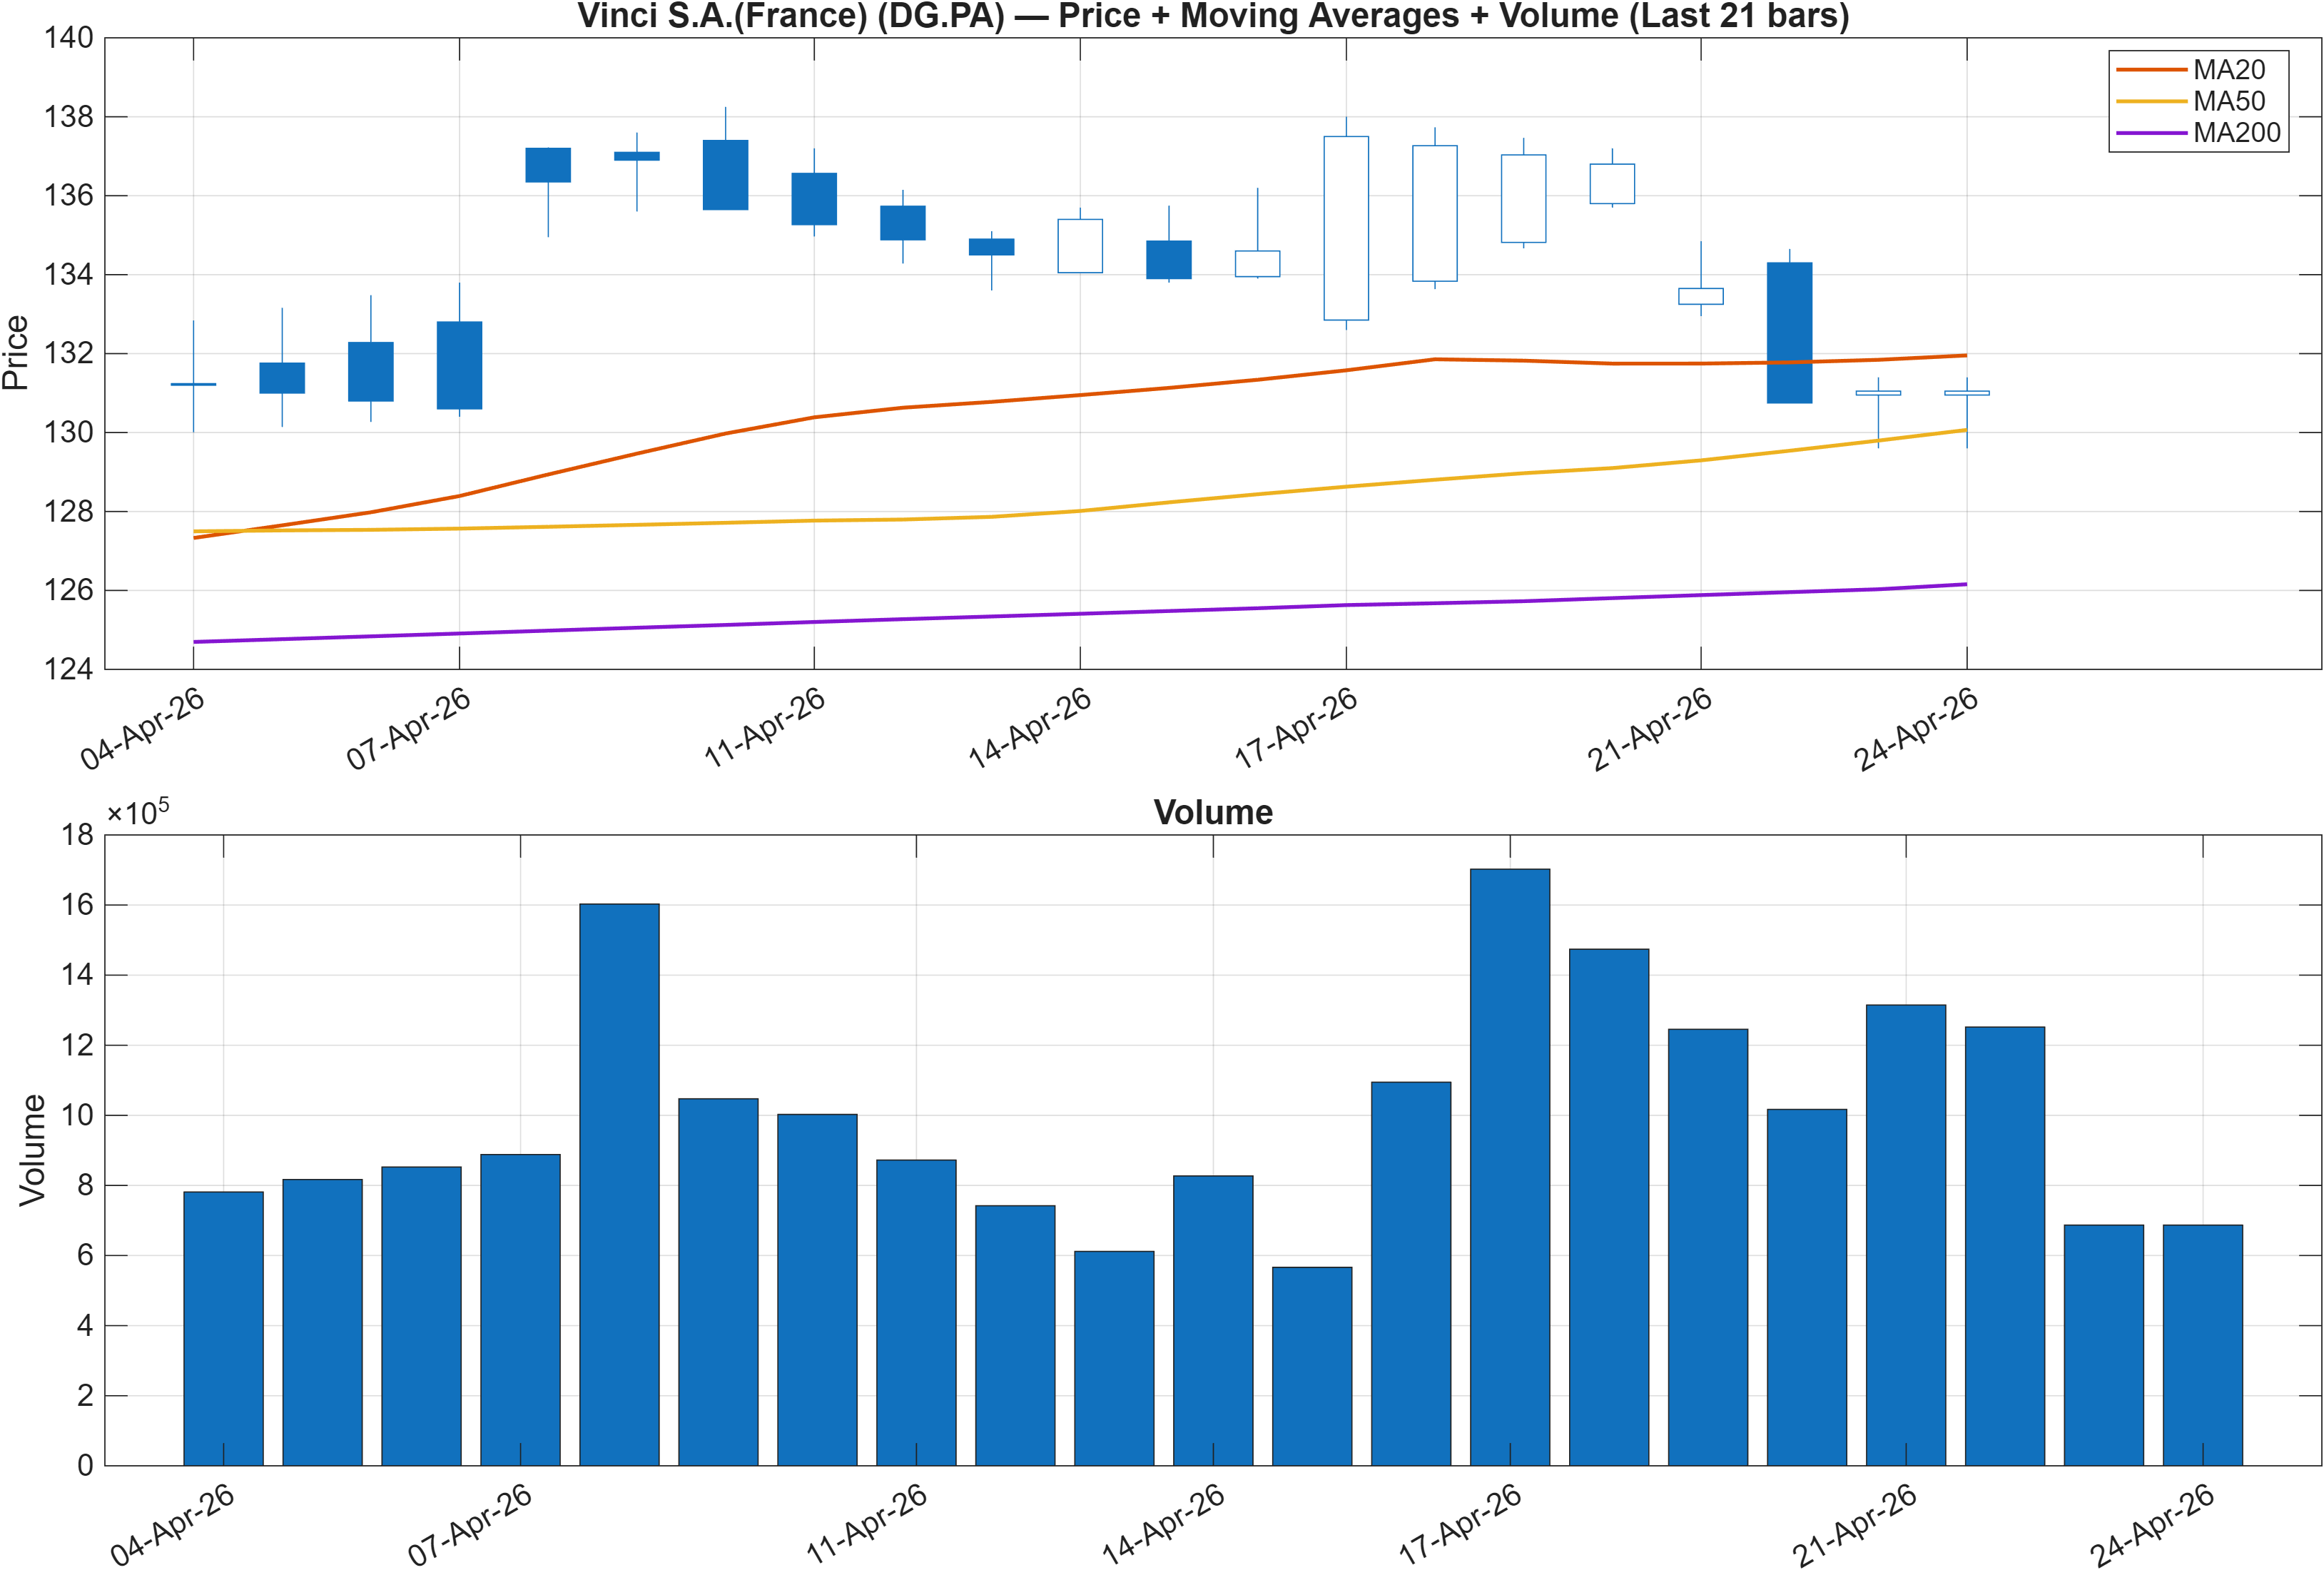
Interpretation: Close vs MA50 = Bullish, MA50 vs MA200 = Bullish.
Trend structure is currently the cleanest supportive input: both close above MA50 and MA50 above MA200 indicate that the intermediate and longer trend filters are aligned in a constructive configuration. That alignment often limits the durability of downside moves unless support breaks with persistence, because trend-following flows and mean-reversion buyers can become active on pullbacks.
However, trend alignment alone is not sufficient for directional conviction in this snapshot because other modules are less confirmatory. The broader technical stack is still neutral: the 18-signal confluence is -0.056 and the blended technical score is -0.016. When moving averages are supportive while the broader confluence is near-flat, it tends to describe a market in trend maintenance rather than trend acceleration—price can remain elevated, but progress may be incremental and sensitive to resistance.
This is consistent with the defined range structure: resistance is set at 139.2917 and support at 124.8250. In practical market-structure terms, the MA configuration suggests pullbacks may stabilize before reaching support, but the absence of strong momentum confirmation increases the risk that rallies stall below resistance.
Volume is presented in Figure 1 but specific volume values are not available in the provided data. As a result, confirmation is best framed qualitatively: the “break above resistance with volume” condition remains the higher-quality continuation trigger, while trend alignment without participation can be more vulnerable to reversal when volatility expands.
3) Momentum & volatility dashboard
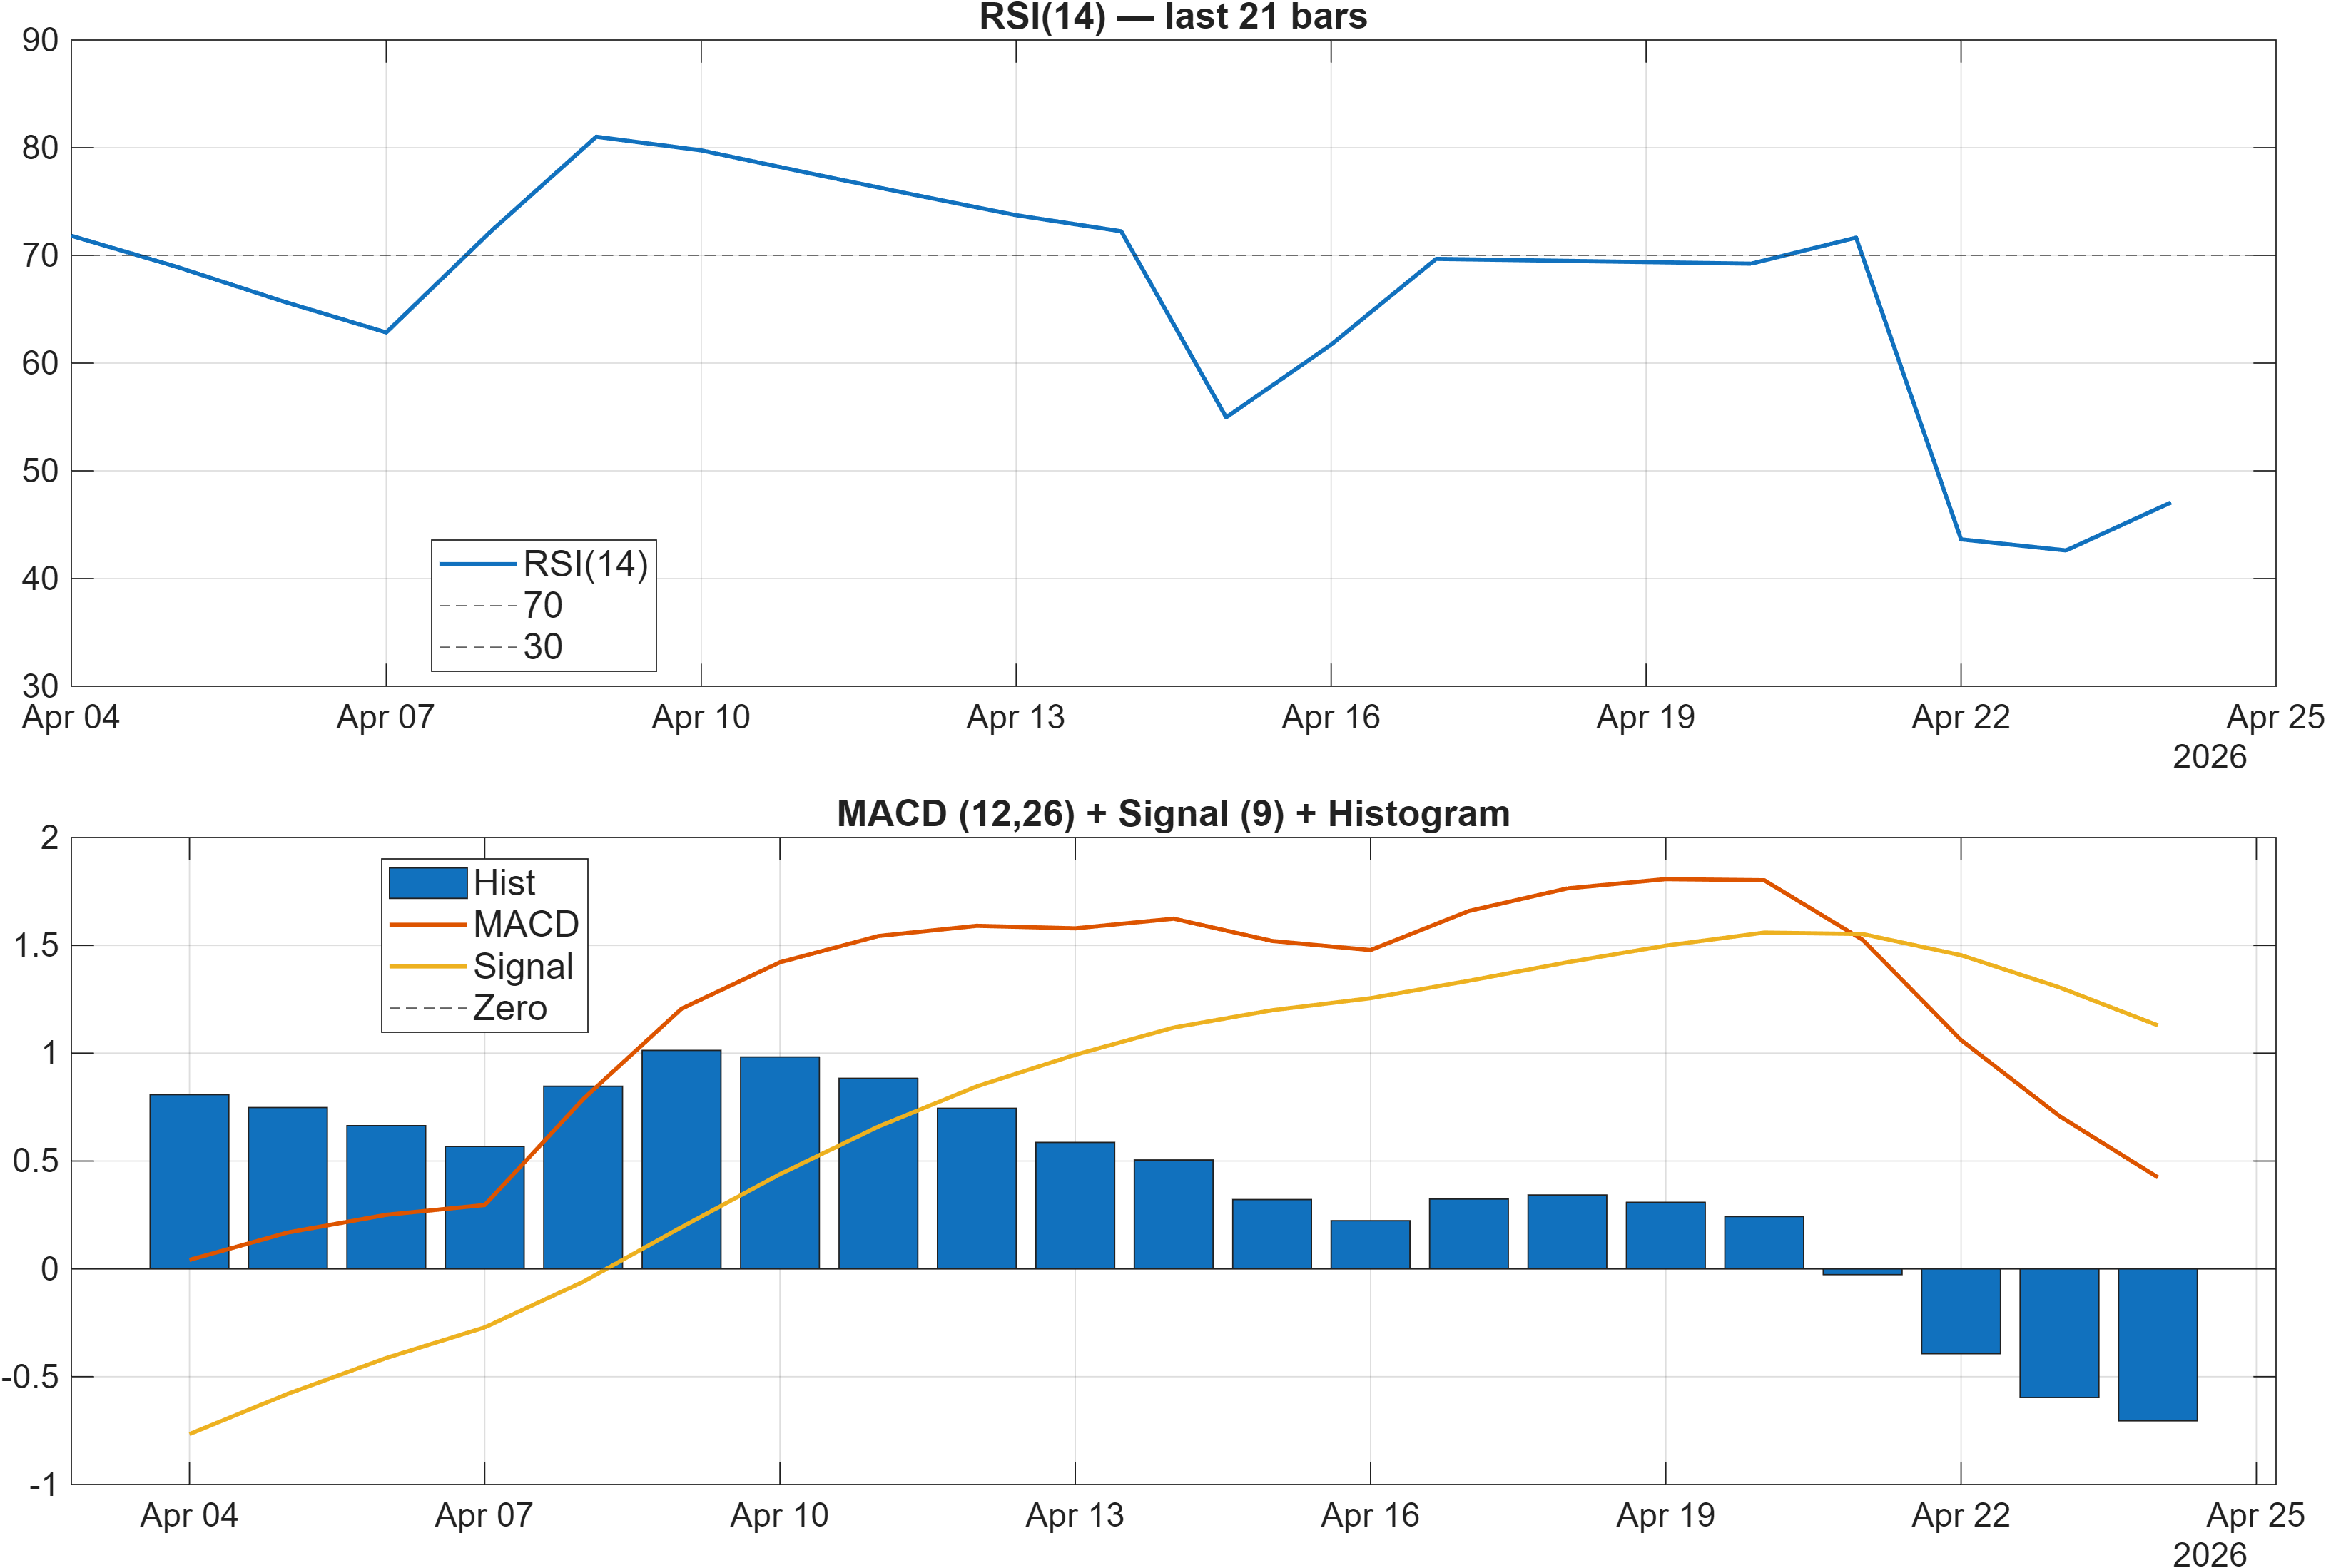
Interpretation: RSI bias = Neutral, MACD hist = -0.7047.
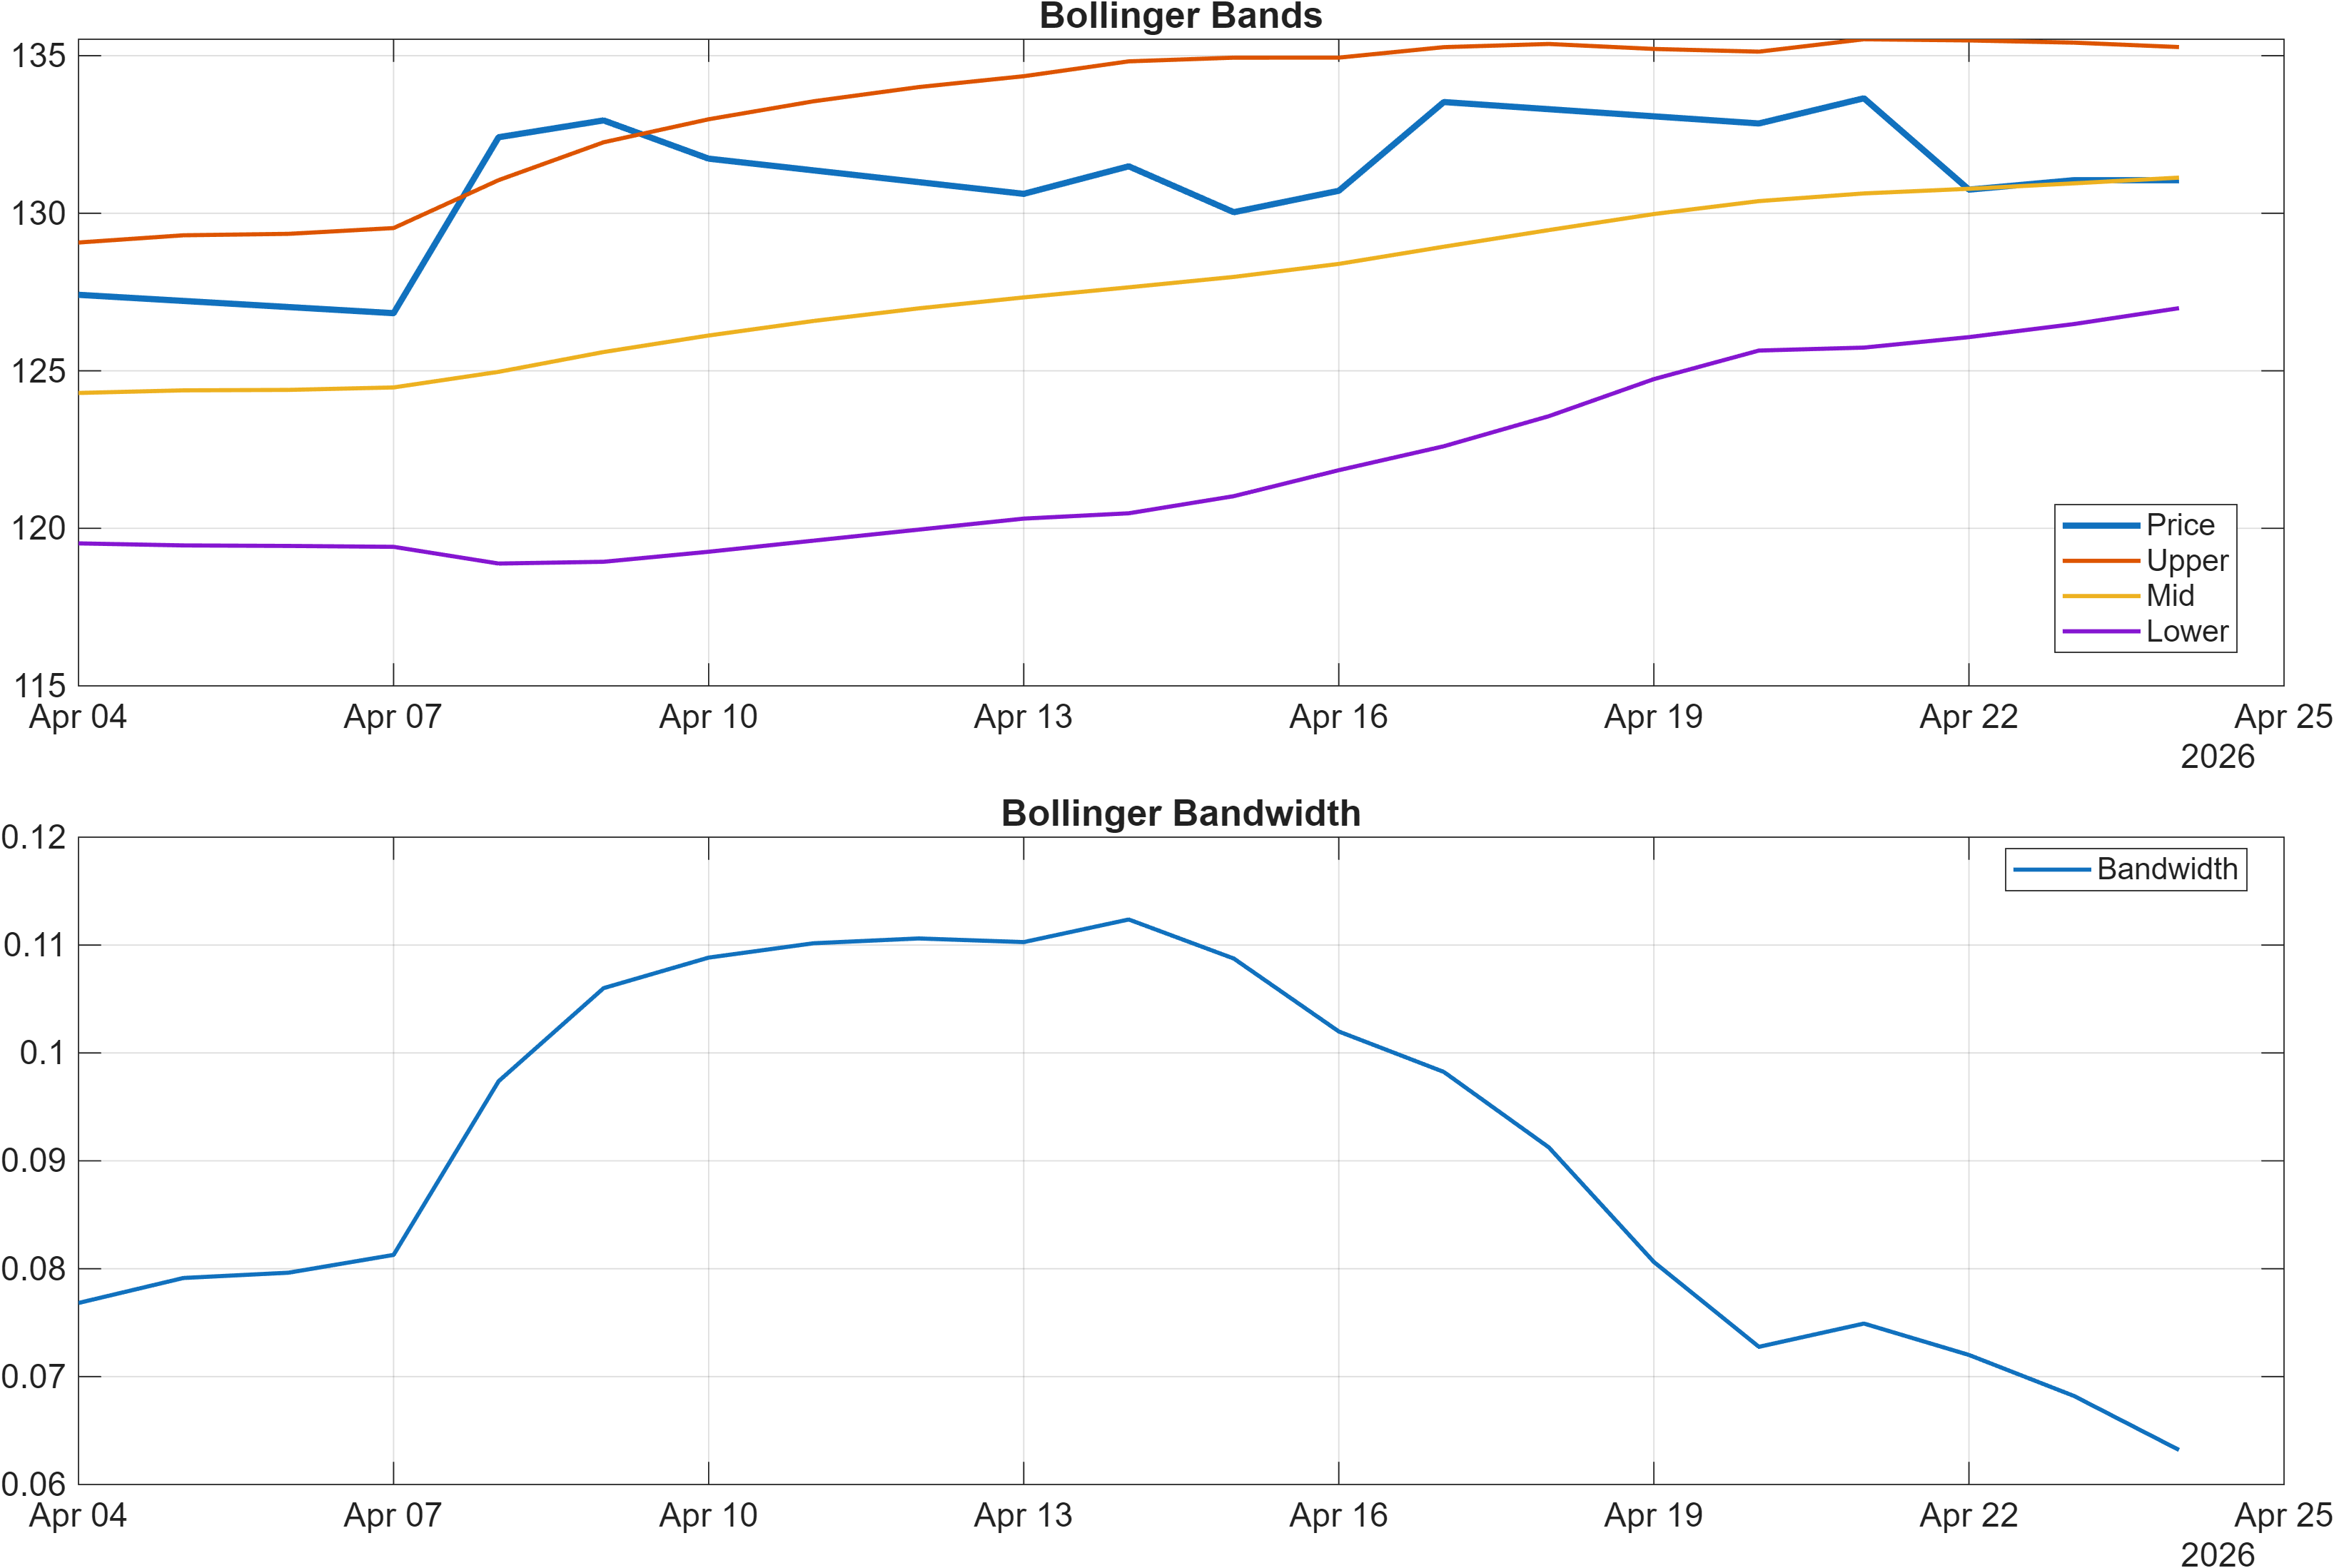
Interpretation: Bandwidth (volatility regime) latest = 0.0632.
Momentum and volatility are sending a mixed message that supports a “confirmation-first” stance. The RSI(14) at 47.06 sits near the midline, consistent with a market that is not extended in either direction. At the same time, the MACD histogram at -0.7047 leans bearish, implying that the most recent marginal momentum has softened even though the broader trend filter (moving averages) remains constructive.
This divergence matters because it can define two distinct regimes: (1) a healthy pullback within an uptrend where momentum later re-accelerates, or (2) an early-stage loss of upside impulse that eventually challenges support. The dashboard adds a third context layer via volatility: Bollinger Bandwidth at 0.0632 indicates a comparatively tight regime. Tight regimes do not determine direction, but they tend to increase the informational value of subsequent breaks, because expansions can amplify follow-through once price leaves a range.
Cross-checks inside the signal set reinforce the mixed momentum read. Stochastic %K is 17.26 (bullish), while TS Accel is -0.45 (bearish). In combination, that often describes a market where short-term mean reversion is plausible, but the medium-term impulse may be fading unless buyers reassert control. The result is a setup where level confirmation (near 139.2917 or 124.8250) is more actionable than interpreting any single oscillator in isolation.
4) Support / Resistance zones
Support ~ 124.8250 | Resistance ~ 139.2917
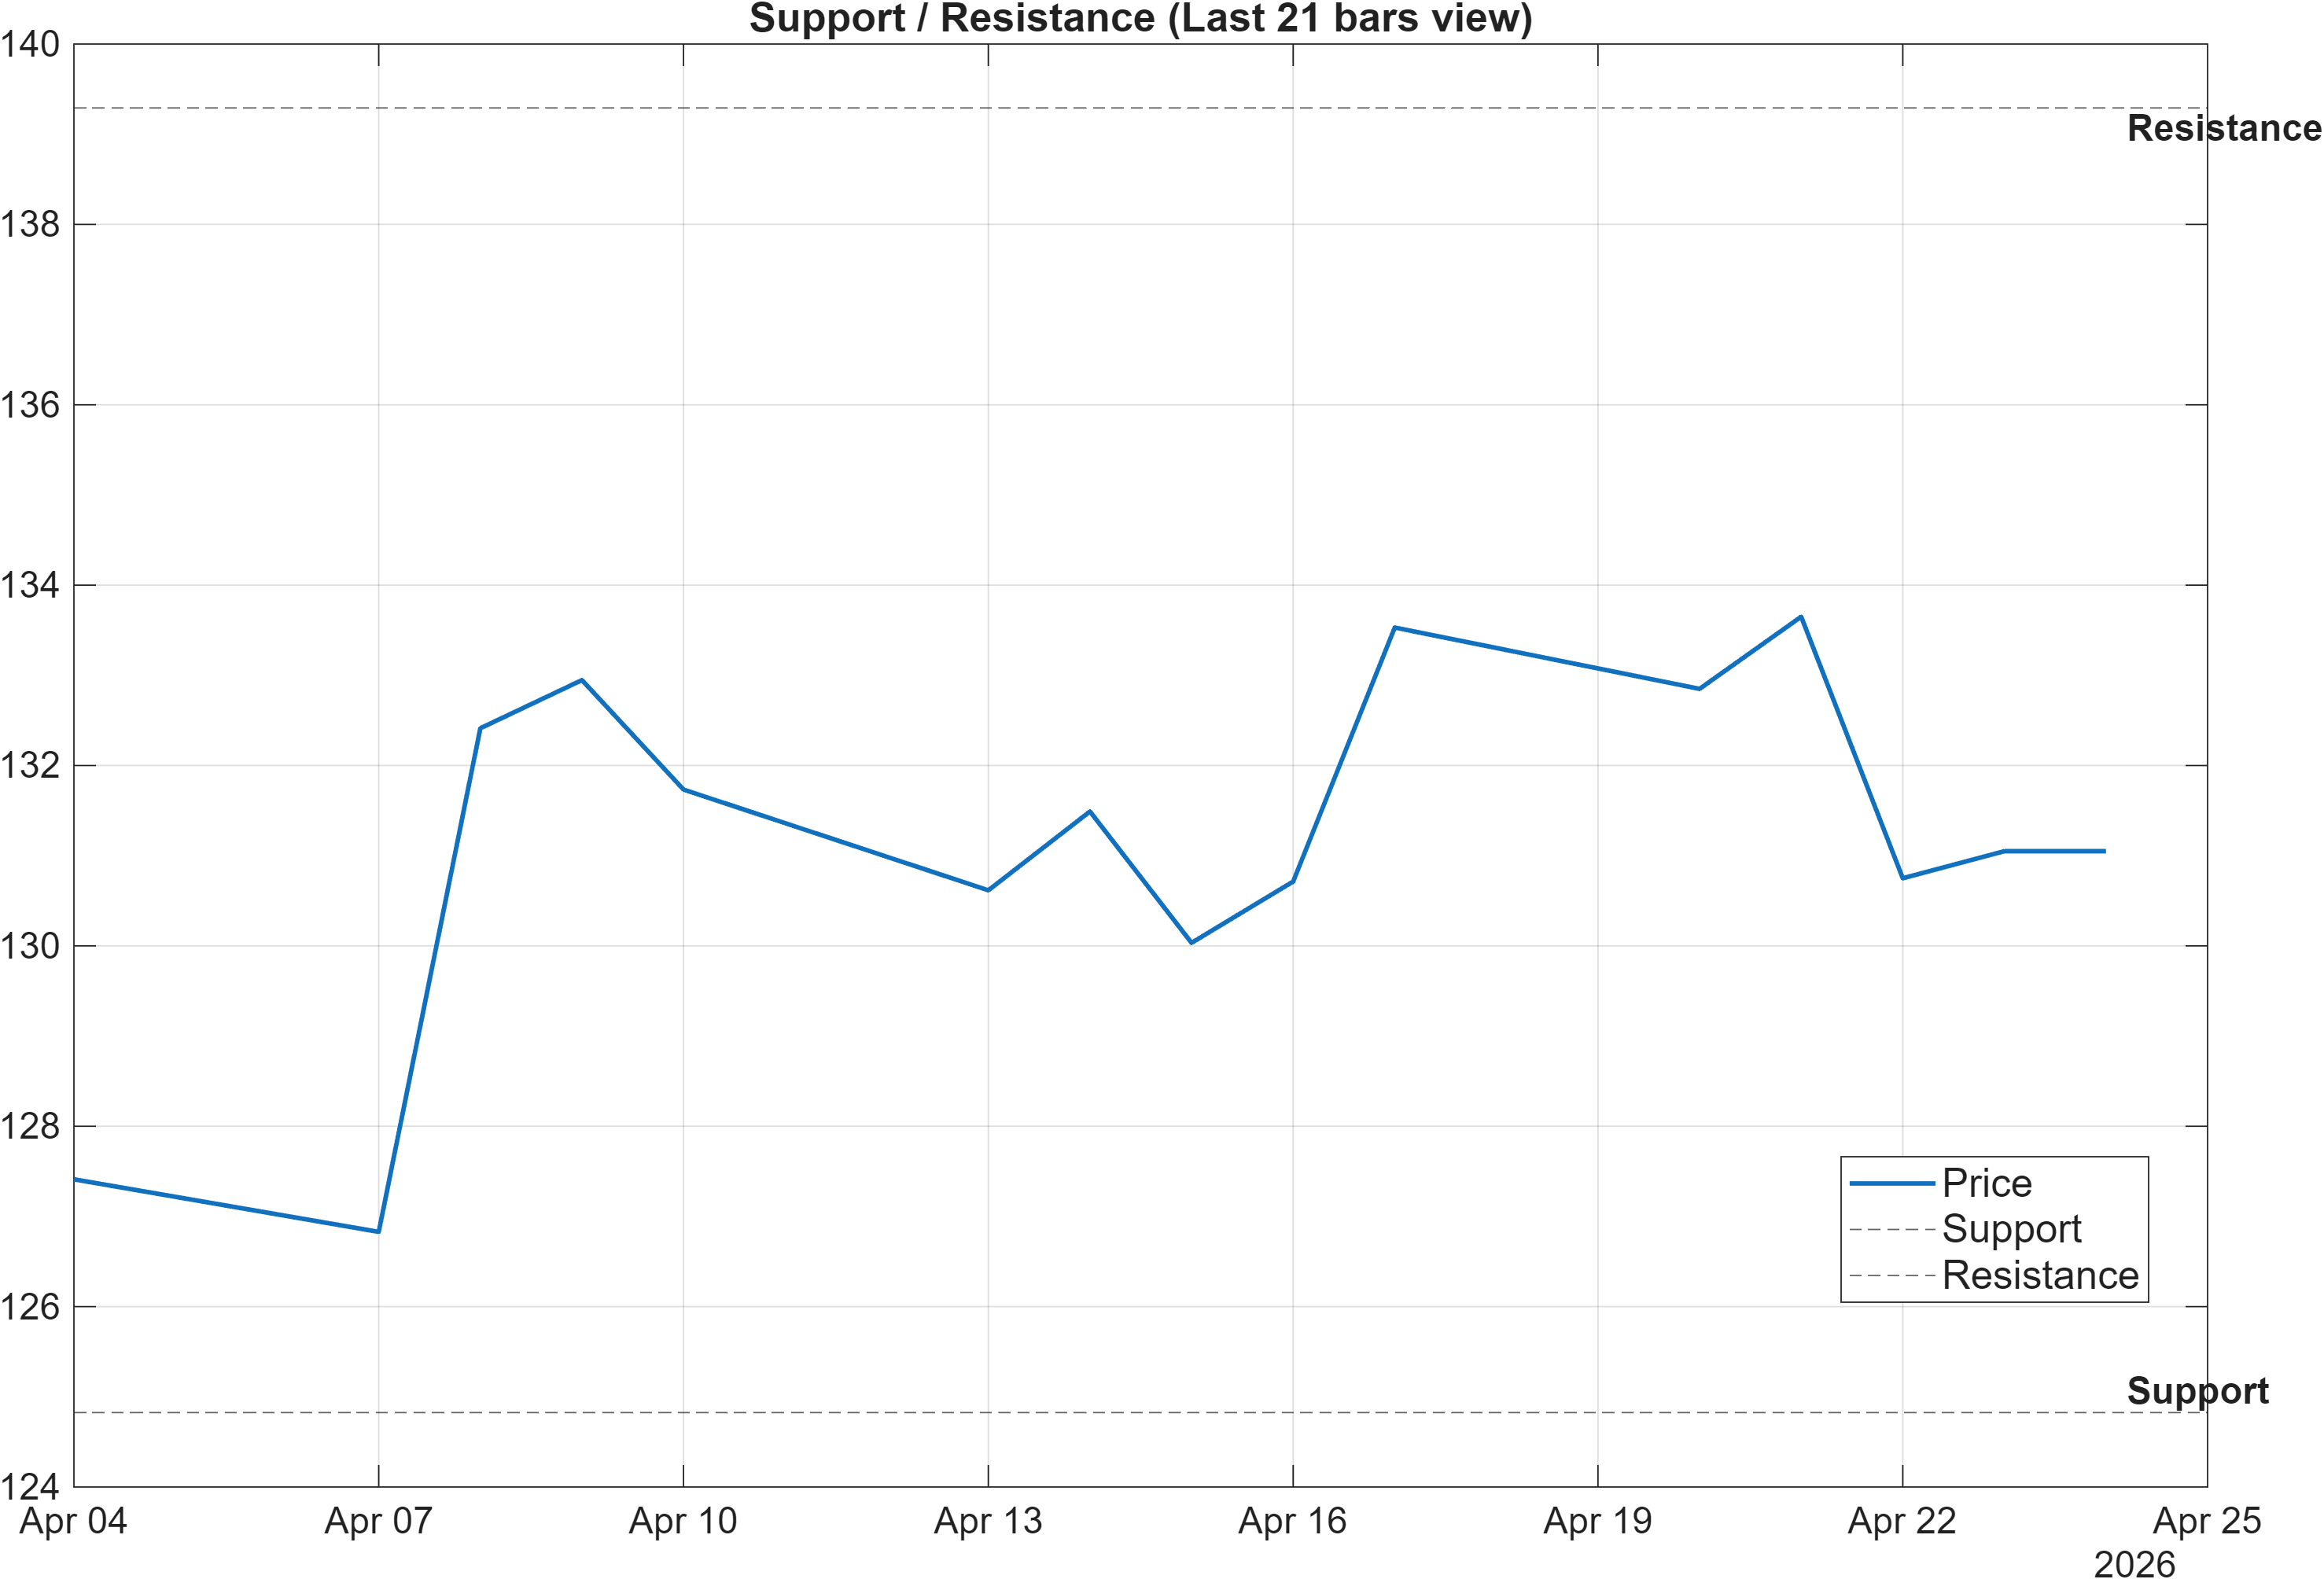
Scenario view: Break above resistance with volume → continuation. Close below support → signal deterioration risk.
The current framework is defined by a relatively clear trading corridor between 124.8250 (support) and 139.2917 (resistance). With volatility tight (bandwidth 0.0632), these zones take on added importance: price is more likely to oscillate around established liquidity pools until a catalyst (technical or narrative) forces expansion.
From a market-structure perspective, the resistance zone is not only a ceiling; it is the point where the uptrend filter (bullish MA stack) must translate into breakout acceptance. A decisive move above 139.2917 paired with stronger participation is the more robust continuation pathway, consistent with the stated scenario condition.
On the downside, a close below 124.8250 would be meaningful precisely because other components are not strongly bullish. Momentum is already mixed (RSI 47.06 neutral, MACD histogram -0.7047 bearish), and the blended technical score is slightly negative at -0.016. In such a configuration, losing support can shift the system from “neutral consolidation” to “deterioration risk” quickly.
Between the two levels, the signal mix suggests a higher likelihood of range behavior than a one-way trend. That makes the zones useful as probabilistic decision points rather than targets: reactions near support/resistance will likely provide more information than mid-range price action while volatility remains compressed.
5) Quant Technical Dashboard (18 Signals)
KGNAI AI Technical Analysis Score (Deep Reinforcement Learning): Rank #655 out of 1420 (Rank 1 represents the strongest technical positioning and a higher probability of favorable price behavior. As ranks increase toward the maximum, the probability of favorable outcomes weakens and bearish positioning becomes more dominant.) | Label: Neutral | Score: 0.077
18-Signal Technical Confluence Score: -0.056 (Neutral)
Overall Technical Score (18-signal confluence + DRL rank blend): -0.016 (Neutral)
Note: The blended score reflects signal strength weighted against broader AI technical ranking, which may temporarily diverge.
Blended technical score breakdown: -0.016 (Neutral | Bull 7 / Bear 8 / Neutral 3)
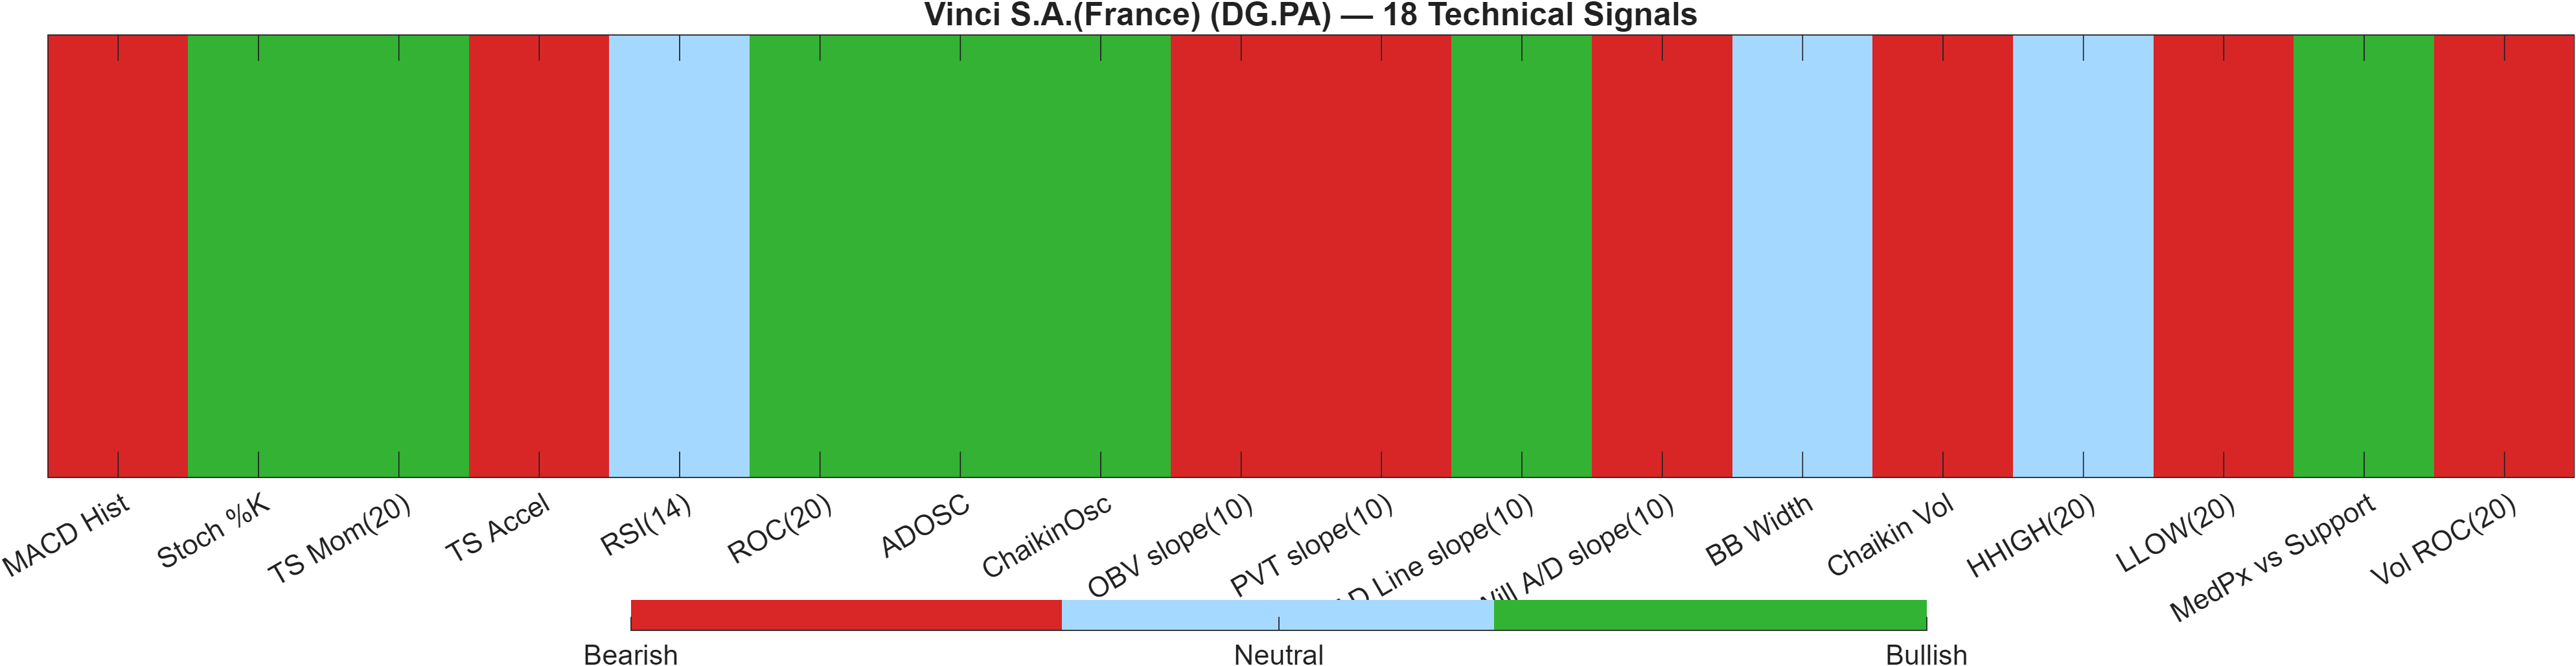
Signal table (Bull/Bear/Neutral)
| Indicator | Value | Signal |
|---|---|---|
| MACD Hist | -0.7047 | Bearish |
| Stoch %K | 17.26 | Bullish |
| TS Mom(20) | 0.05 | Bullish |
| TS Accel | -0.45 | Bearish |
| RSI(14) | 47.06 | Neutral |
| ROC(20) | 3.013 | Bullish |
| ADOSC | 52.78 | Bullish |
| ChaikinOsc | 4.094e+05 | Bullish |
| OBV slope(10) | -3.385e+06 | Bearish |
| PVT slope(10) | -2.608e+04 | Bearish |
| AD Line slope(10) | 2.165e+06 | Bullish |
| Will A/D slope(10) | -3.15 | Bearish |
| BB Width | 0.0632 | Neutral |
| Chaikin Vol | 16.74 | Bearish |
| HHIGH(20) | 138.2 | Neutral |
| LLOW(20) | 129.6 | Bearish |
| MedPx vs Support | 5.675 | Bullish |
| Vol ROC(20) | -15.91 | Bearish |
Interpretation: Indicator-level signals form the base confluence, which is then adjusted using a separate AI-driven technical ranking model. The final technical score summarizes this combined view.
The technical dashboard describes a high-friction environment: signals are nearly balanced (Bull 7 / Bear 8 / Neutral 3), producing a neutral confluence at -0.056. The blended technical score remains close to flat at -0.016, meaning the aggregate evidence is only marginally tilted to the downside despite a supportive moving-average structure.
The tension is clearest in momentum and participation proxies. MACD histogram is explicitly bearish at -0.7047, while RSI(14) is neutral at 47.06. Meanwhile, several accumulation-style measures lean constructive (e.g., ADOSC 52.78 bullish), yet volume-related momentum is weaker (Vol ROC(20) -15.91 bearish). When these disagree, rallies can occur but may lack the breadth needed to sustain a clean breakout unless volume conditions improve.
The Deep Reinforcement Learning (DRL) technical rank at #655 (score 0.077) also sits in the neutral band for the 1420-instrument universe. Importantly, a neutral DRL read combined with a near-zero confluence score tends to favor reactive decision-making: waiting for price to prove itself at key levels rather than pre-committing to a trend narrative.
Overall, the dashboard is consistent with a market that can still resolve higher (trend filters are constructive), but where the near-term evidence base is not sufficiently aligned to treat that outcome as dominant without the resistance break above 139.2917.
6) News sentiment + extractive gist
Sentiment score (avg): 0.139 | Positive: 67% | Neutral: 33% | Negative: 0%
KGNAI AI News Sentiment Score (normalized -1 to +1): 1.00 (as of 2026-04-23) | Label: Bullish | Overall news score: 0.98
Positive Developments
Recent coverage across major financial outlets indicates a broadly constructive tone around Vinci, with commentary frequently emphasizing recent price momentum and ongoing investor attention. The quantitative mix is supportive: the average sentiment score is 0.139 with 67% of items classified as positive and 0% negative, while the normalized sentiment score prints 1.00 (as of 2026-04-23). This backdrop can act as a stabilizer during consolidations, particularly when volatility is contained (Bollinger bandwidth 0.0632). In a neutral technical regime, positive sentiment tends to matter most when it coincides with observable confirmation—such as a clean push into the 139.2917 resistance area—because it can improve follow-through once the market transitions out of range behavior.
Neutral / Mixed Developments
The same coverage also reflects a more two-sided interpretation of “fair value” and the extent of upside left after a strong month. This is consistent with the technical evidence: RSI(14) is neutral at 47.06, and the blended technical score is near-flat at -0.016, both of which align with a digestion phase rather than a trend acceleration phase. Neutral news classification still accounts for 33% of items, suggesting that the information flow is not uniformly supportive and may not be sufficient—on its own—to resolve the price structure. In this context, market participants often defer to price-level validation, with support at 124.8250 and resistance at 139.2917 serving as the practical reference points.
Negative / Risk Signals
While the quantified news stream contains 0% explicitly negative items, “risk” in this snapshot is better framed as a sentiment–price misalignment risk: sentiment is bullish (normalized 1.00), yet momentum is not confirming (MACD histogram -0.7047) and confluence remains slightly negative (-0.056). When sentiment is positive but technical participation is uneven (e.g., Vol ROC(20) -15.91 bearish), upside attempts can fail at resistance and revert back into the range. The clearest technical risk signal remains structural: a close below 124.8250 would likely force a reassessment, because it would imply that supportive trend filters are no longer protecting the downside despite favorable narrative tone.
- Whether price can hold above 139.2917 on an expansion in activity (breakout acceptance vs rejection).
- Whether momentum improves from mixed readings (RSI 47.06, MACD histogram -0.7047) during any push higher.
- Whether volatility expands from bandwidth 0.0632 and which side of the range captures the expansion.
Sources referenced: Reuters, Bloomberg, Yahoo Finance, MarketWatch, Investing.com
Snapshot: AI Rank (Short–Mid–Long): Neutral (Neutral–Neutral–Neutral) · Technical Confluence: Neutral · Key Levels: Support ~124.83 | Resistance ~139.29 · News Sentiment: Neutral
7) Sources
Not available in the provided data.
You may also like: How KGNAI AI ranks instruments across global markets
Disclaimer: KGNAI provides AI-generated analytics and educational market commentary only. This is not financial advice. Markets involve risk. Always do your own research.