
ELUX-A.ST — AB Electrolux (publ) (Sweden) on 26-Apr-2026: No Dominant Trend Present
AB Electrolux (publ) (ELUX-A.ST) currently screens as a mixed-regime setup: short-horizon ranks are conflicted against stronger medium-term positioning, while the technical dashboard remains broadly bearish. Cross-sectional ranks show a top-decile profile on a 3-month basis (#17 out of 1419) and strong monthly standing (#32), yet the weekly rank sits in the lower quartile (#1138), consistent with unstable near-term behavior. Price structure also leans defensive with the close below the 50-day moving average and the 50-day below the 200-day (both flagged bearish). Momentum is weak (RSI(14) at 15.15; MACD histogram -1.7220), while volatility conditions (Bollinger bandwidth 0.3753) suggest the market is not in a compressed “breakout-ready” state. Structurally, the framework focuses on the 60.0000 support and 76.7500 resistance zones as decision areas rather than targets.
Key Takeaways
- Rank stance: Short-term Bearish | Mid-term Bullish | Long-term Neutral
- Technical confluence: Bearish (18-signal confluence -0.556; overall technical score -0.533)
- Key levels: Support ~ 60.0000 | Resistance ~ 76.7500
- News sentiment bias: Neutral distribution (94% neutral; avg -0.013) alongside a model score labeled bullish (0.99)
- Confirmation / invalidation: A sustained push above 76.7500 with volume supports continuation; a close below 60.0000 increases deterioration risk per the scenario framework.
What KGNAI Measures
KGNAI evaluates assets using large cross-sectional datasets built from millions of structured data points. Inputs incorporate fundamental metrics, technical structures, and systematically processed news sentiment. Statistical models, machine learning, and AI frameworks are used to assess relative positioning, signal alignment, and probabilistic behavior across broad universes.
How to Read This Report
- Ranks are comparative across the tracked universe, not absolute price targets.
- Confluence reflects alignment among independent signal groups.
- Support/resistance levels are probabilistic decision zones, not guarantees.
- Sentiment provides contextual bias within the broader analytical framework.
1) KGNAI AI Analysis
Region: EUROPE
Total universe size: 1419 ranked instruments
- Daily rank: #216 out of 1419 — Bullish
- Weekly rank: #1138 out of 1419 — Bearish
- Monthly rank: #32 out of 1419 — Bullish
- 3-Monthly rank: #17 out of 1419 — Bullish
- 6-Monthly rank: #445 out of 1419 — Neutral
- Yearly rank: #345 out of 1419 — Neutral
ELUX-A.ST presents a horizon divergence profile: strength is concentrated in the intermediate windows while near-term behavior is unstable. The contrast between the 3-month rank (#17) and the weekly rank (#1138) is the most informative feature in this snapshot, implying that whatever supported relative performance over recent months has not translated cleanly into the most recent weekly regime.
The monthly rank (#32) adds to the mid-term constructive view, yet the yearly standing (#345) and 6-month rank (#445) sit closer to the center of the universe, aligning with the headline stance of no dominant trend. This mix often corresponds to a market that can oscillate between mean-reversion and trend attempts depending on whether price can re-attach to key moving averages and whether momentum indicators stabilize.
In practical portfolio terms (without treating ranks as targets), this configuration is consistent with a selective risk posture: mid-term relative strength exists, but it is not confirmed by short-horizon positioning. The daily rank (#216) being bullish while the weekly rank remains bearish is a classic signal of tactical bounce potential inside a still-challenged near-term structure—something that typically requires confirmation from price/volume behavior and momentum repair.
KGNAI ranks each instrument across large universes using multiple proprietary AI tests and statistical models (millions of data points). Lower ranks generally indicate stronger probability of favorable performance behavior, while higher ranks indicate weaker probability and more bearish positioning.
Term view: Short-term: Bearish. Mid-term: Bullish. Long-term: Neutral.
Want the full universe and complete rank tables? Unlock full access on KGNAI: https://www.kgnai.com/pricing
2) Price & trend overview
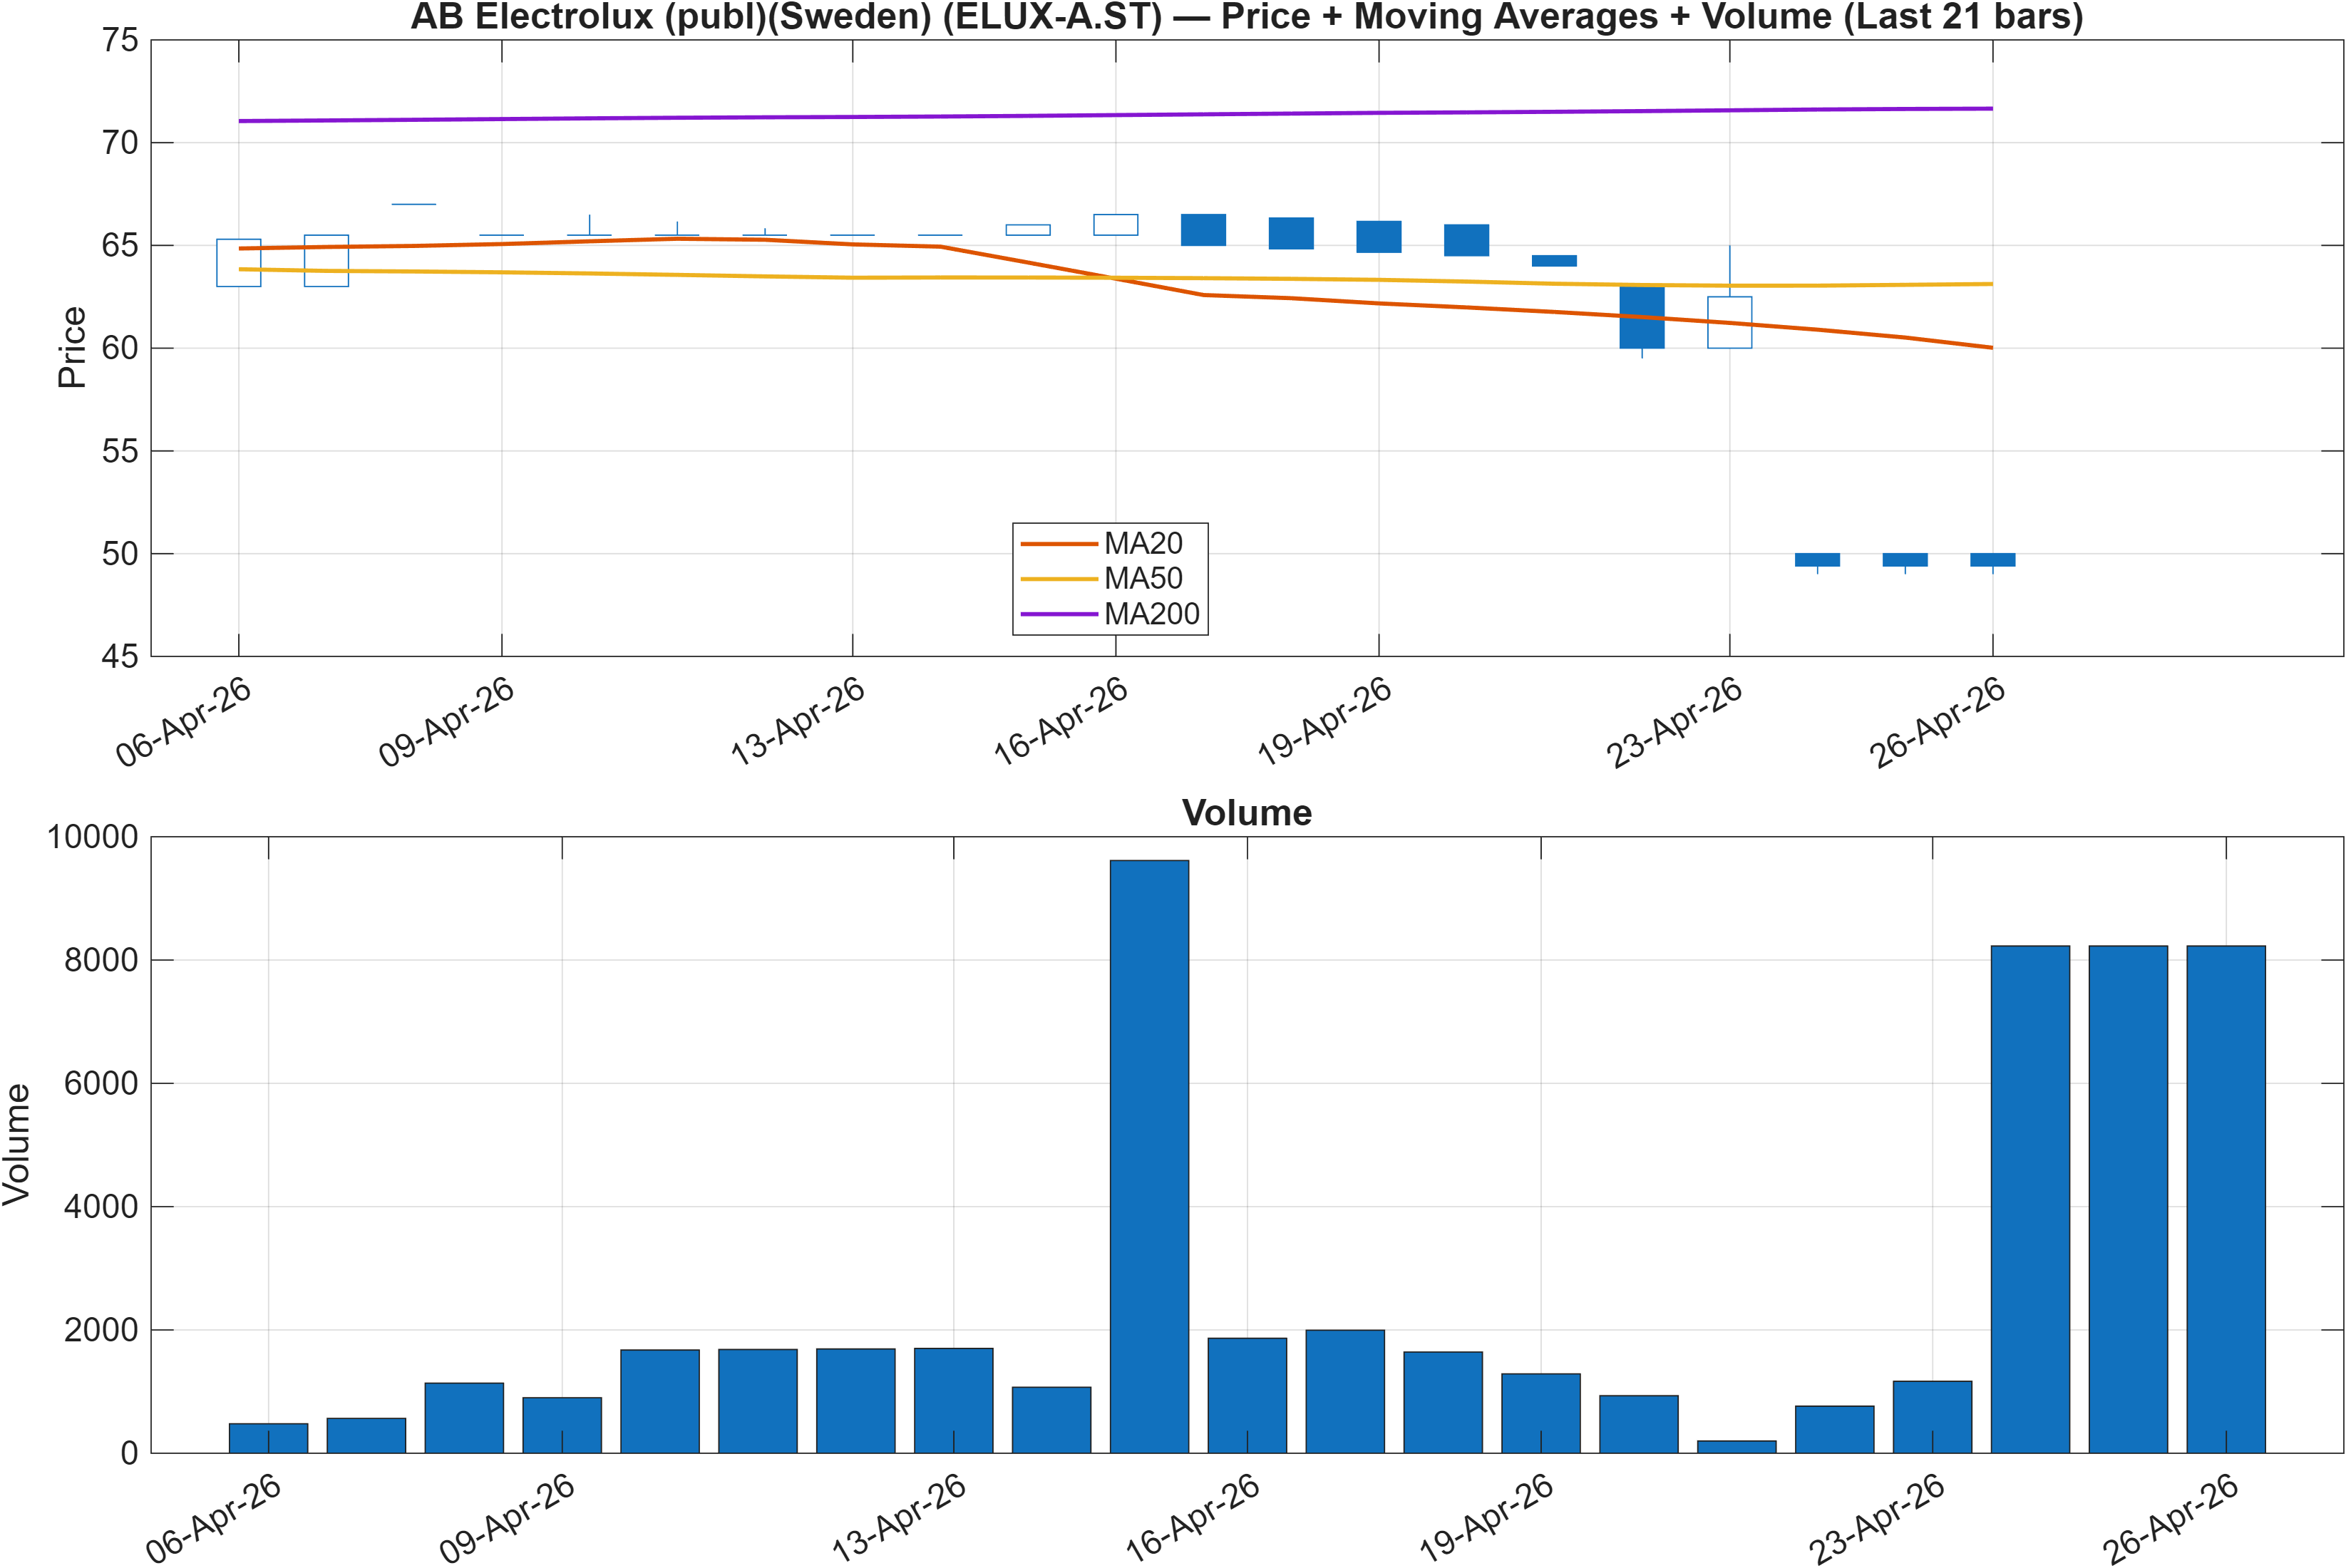
Interpretation: Close vs MA50 = Bearish, MA50 vs MA200 = Bearish.
The trend layer is currently defined by two concurrent bearish relationships: price is below the 50-day moving average, and the 50-day is below the 200-day. That alignment tends to keep rallies corrective unless there is clear evidence of re-accumulation via volume and a sustained reclaim of the shorter average. Within the context of the ranks, this is an important tension: the mid-term cross-sectional strength (notably #32 monthly and #17 3-month) is not yet echoed by the moving-average structure shown in Figure 1.
This is a regime where “no dominant trend” is a practical description rather than a neutral statement. When a market exhibits mid-horizon relative strength but remains below key averages, outcomes often depend on whether the instrument can convert relative positioning into trend repair—or whether the bearish MA stack continues to cap rebounds. The daily rank (#216) being bullish can coexist with a bearish MA structure, but that usually implies a shorter-lived rotation unless price action improves meaningfully.
Volume context in Figure 1 is best read as confirmation rather than a primary signal: trend shifts typically require a sustained change in participation. Absent that, the structure suggests a market still negotiating its downside hangover rather than cleanly transitioning to a higher-trend state.
From a risk framing perspective, this section anchors the rest of the report: the technical dashboard and support/resistance zones are most actionable when interpreted as tests of whether price can re-enter or remain below key trend references. In short, the trend layer is not yet aligned with the strongest ranks, which elevates the importance of confirmation elsewhere (momentum repair, breadth/volume stabilization, and behavior around the 60.0000–76.7500 structure).
3) Momentum & volatility dashboard
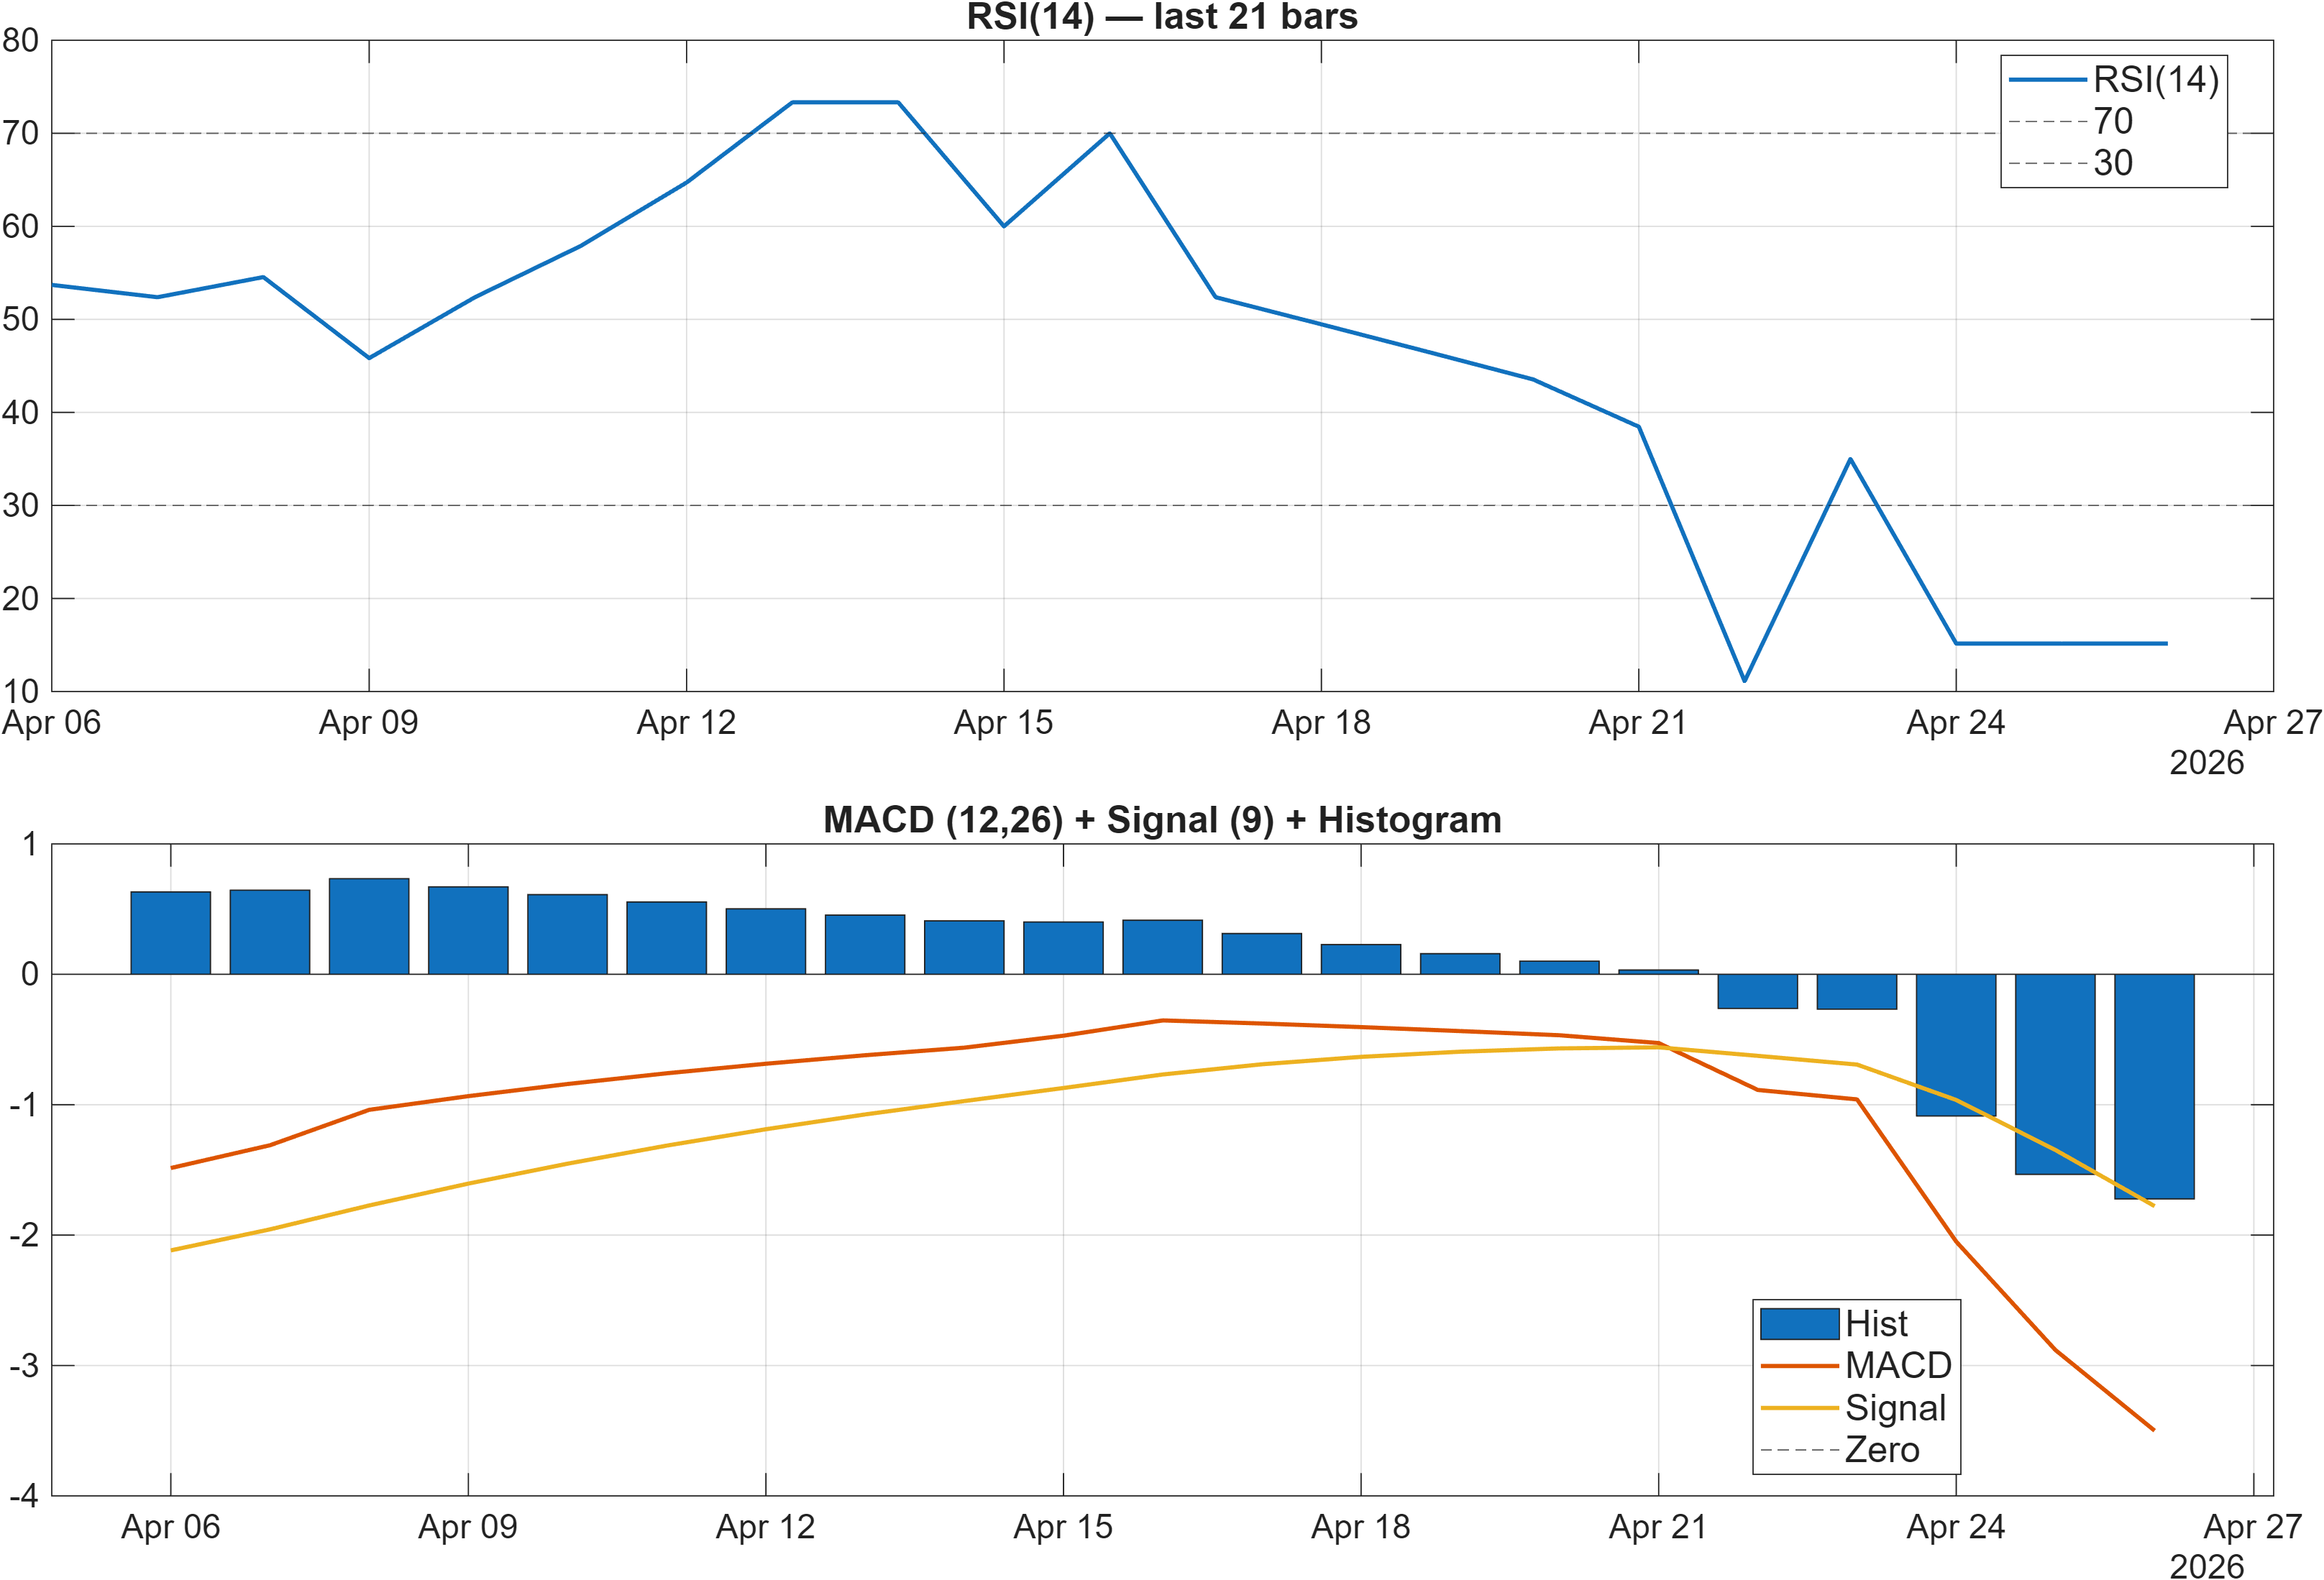
Interpretation: RSI bias = Bearish, MACD hist = -1.7220.
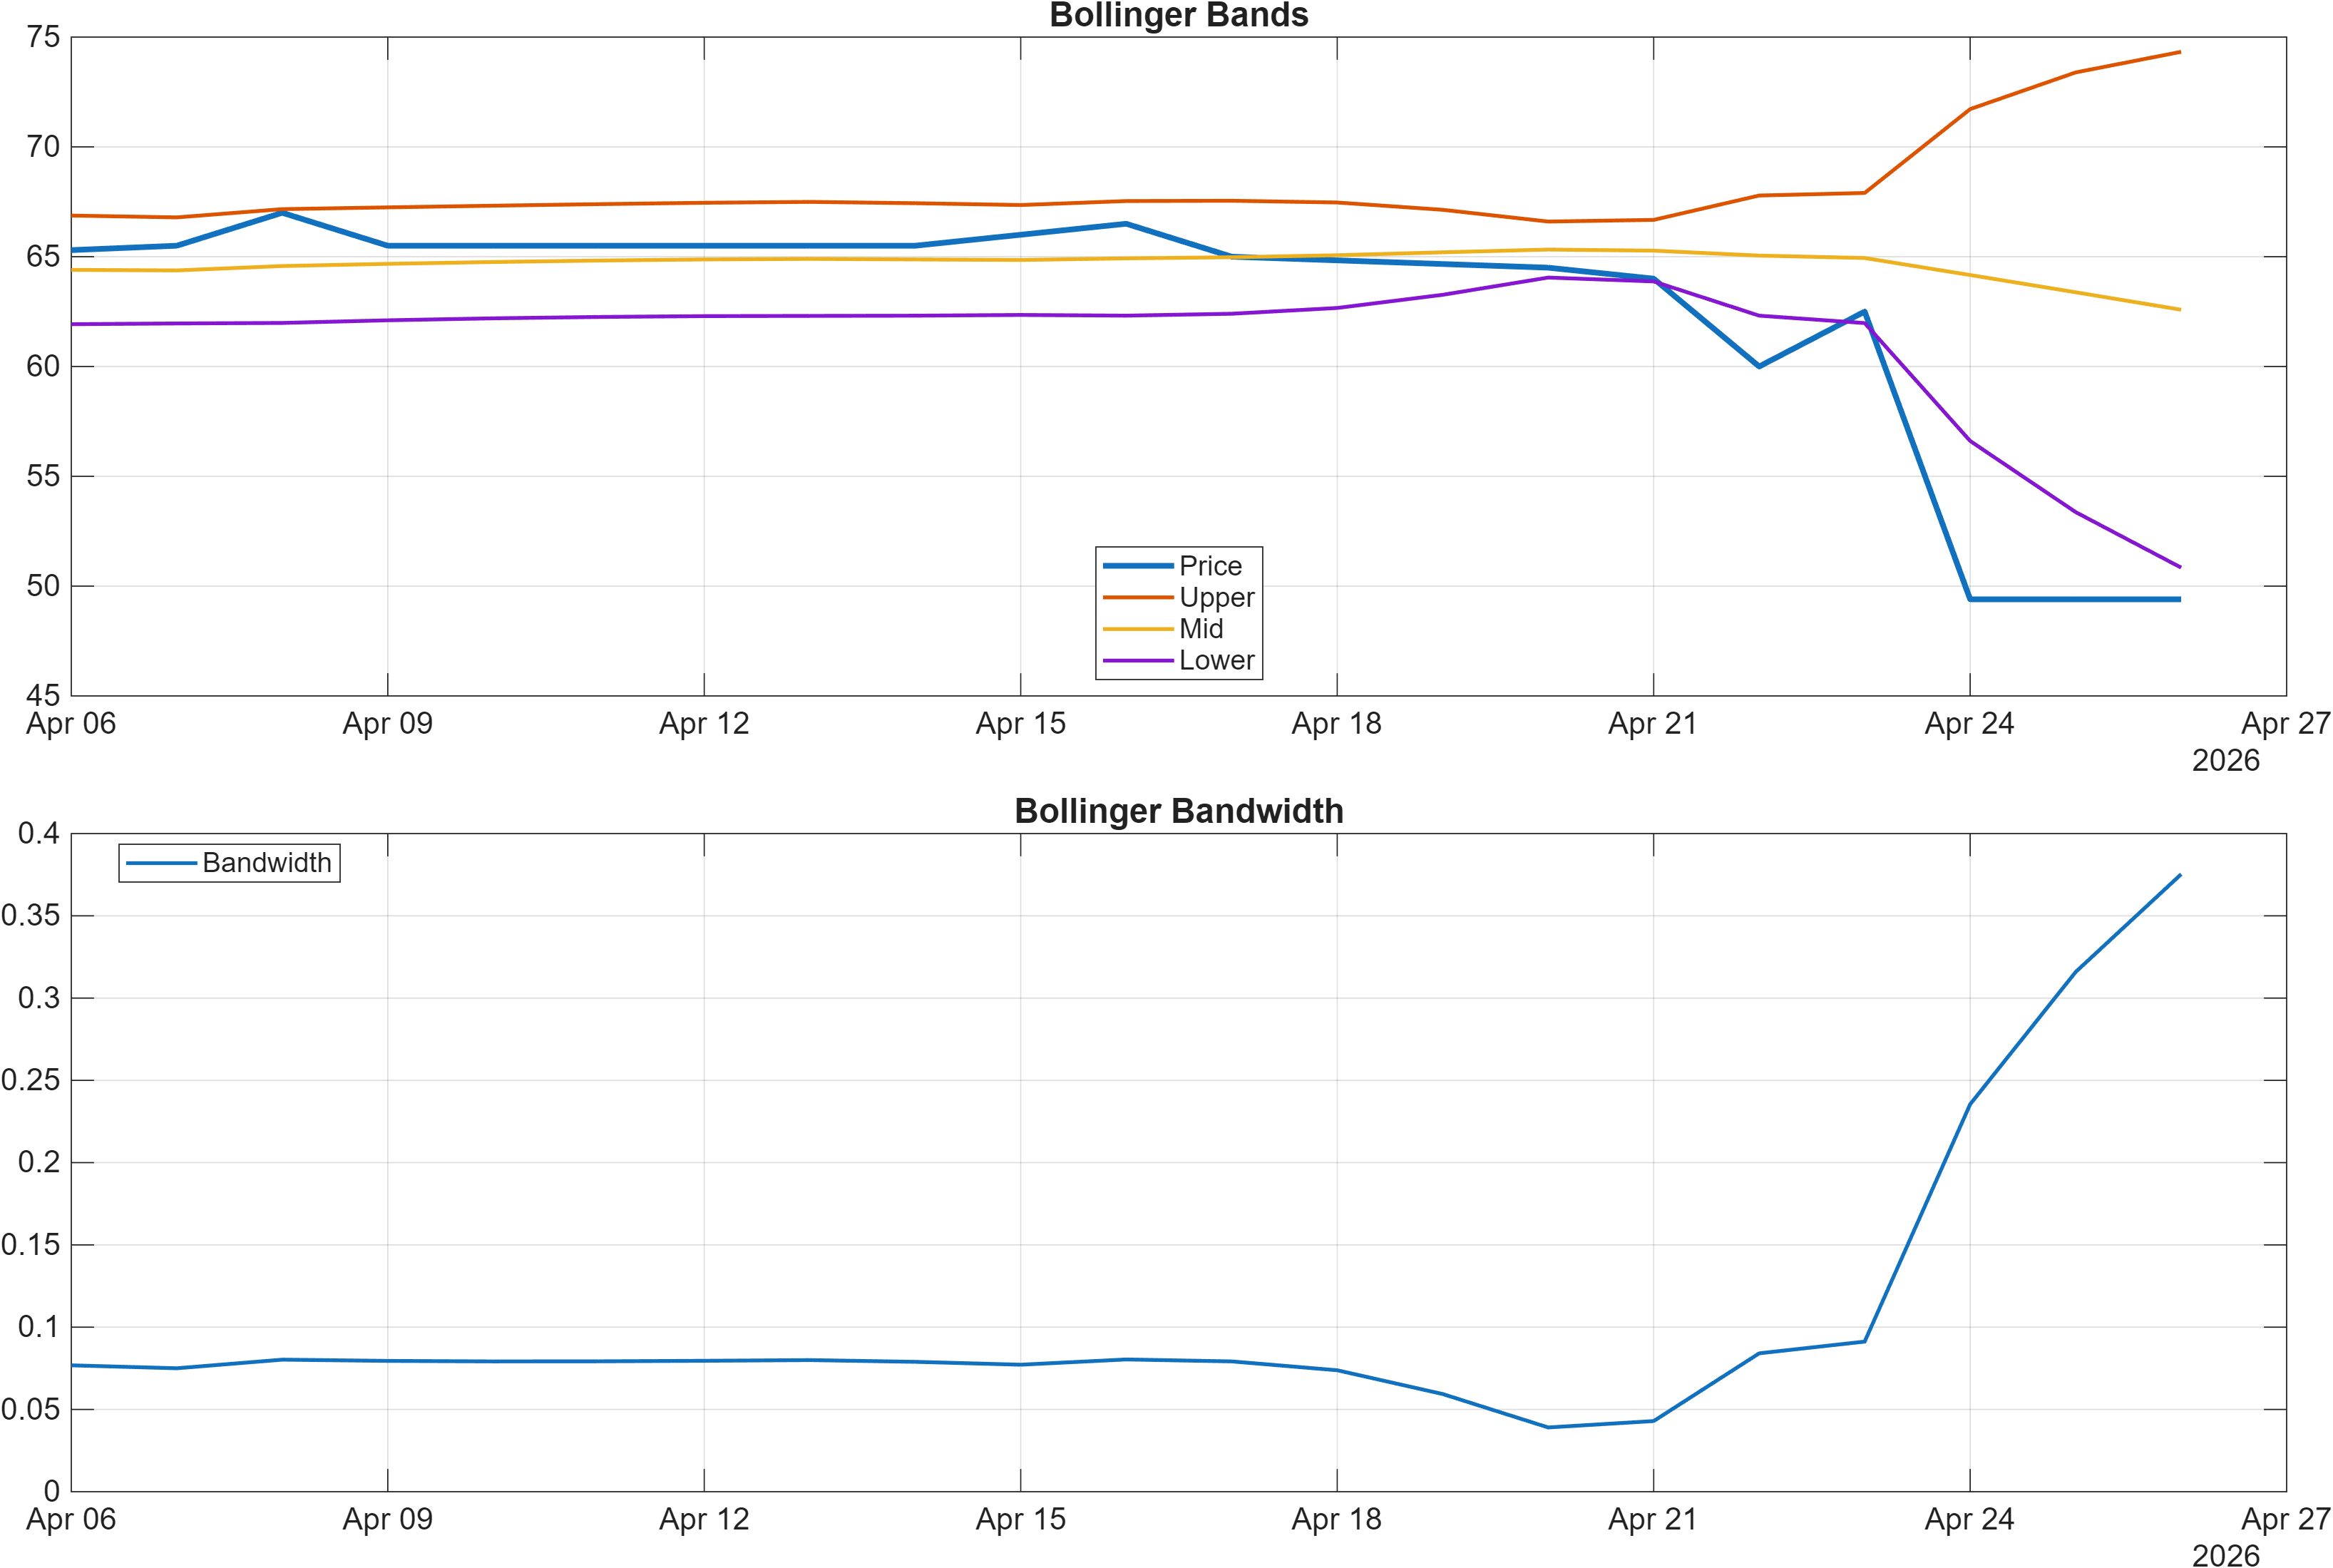
Interpretation: Bandwidth (volatility regime) latest = 0.3753.
The momentum layer is decisively weak, which helps explain why the moving-average structure remains bearish despite constructive mid-term ranks. RSI(14) at 15.15 is consistent with a strongly oversold condition rather than a balanced trend state. In isolation, that can precede rebounds; however, the MACD histogram at -1.7220 indicates downside momentum is still dominant, meaning any rebound would need to show improving momentum characteristics (e.g., histogram rising toward zero) to shift from a mechanical bounce into a more durable turn.
Volatility conditions add nuance. Bollinger bandwidth at 0.3753 suggests the market is not in an extremely compressed regime. That matters because many sustained trend transitions begin from compression expansions; here, the setup is less about “tight coil breakout” and more about whether price can stabilize after a downswing while volatility remains active. If bandwidth stays elevated while momentum is negative, the instrument can remain prone to sharp countertrend moves that do not necessarily change the broader structure.
These readings also contextualize the rank divergence. A top-decile 3-month rank (#17) alongside an RSI this low implies that the recent momentum shock has been severe enough to overwhelm short-term signals while leaving the broader comparative window still favorable. In research terms, that is a classic time-scale mismatch: the longer lookback retains earlier strength, while the latest impulse is negative.
Operationally, the momentum/volatility dashboard is best used as a confirmation lens for the structural zones. If price approaches key support while RSI remains deeply depressed and MACD stops deteriorating, the odds of stabilization improve. If MACD continues to deepen while bandwidth stays elevated, the market is signaling that the down move may still be in progress rather than ending.
4) Support / Resistance zones
Support ~ 60.0000 | Resistance ~ 76.7500
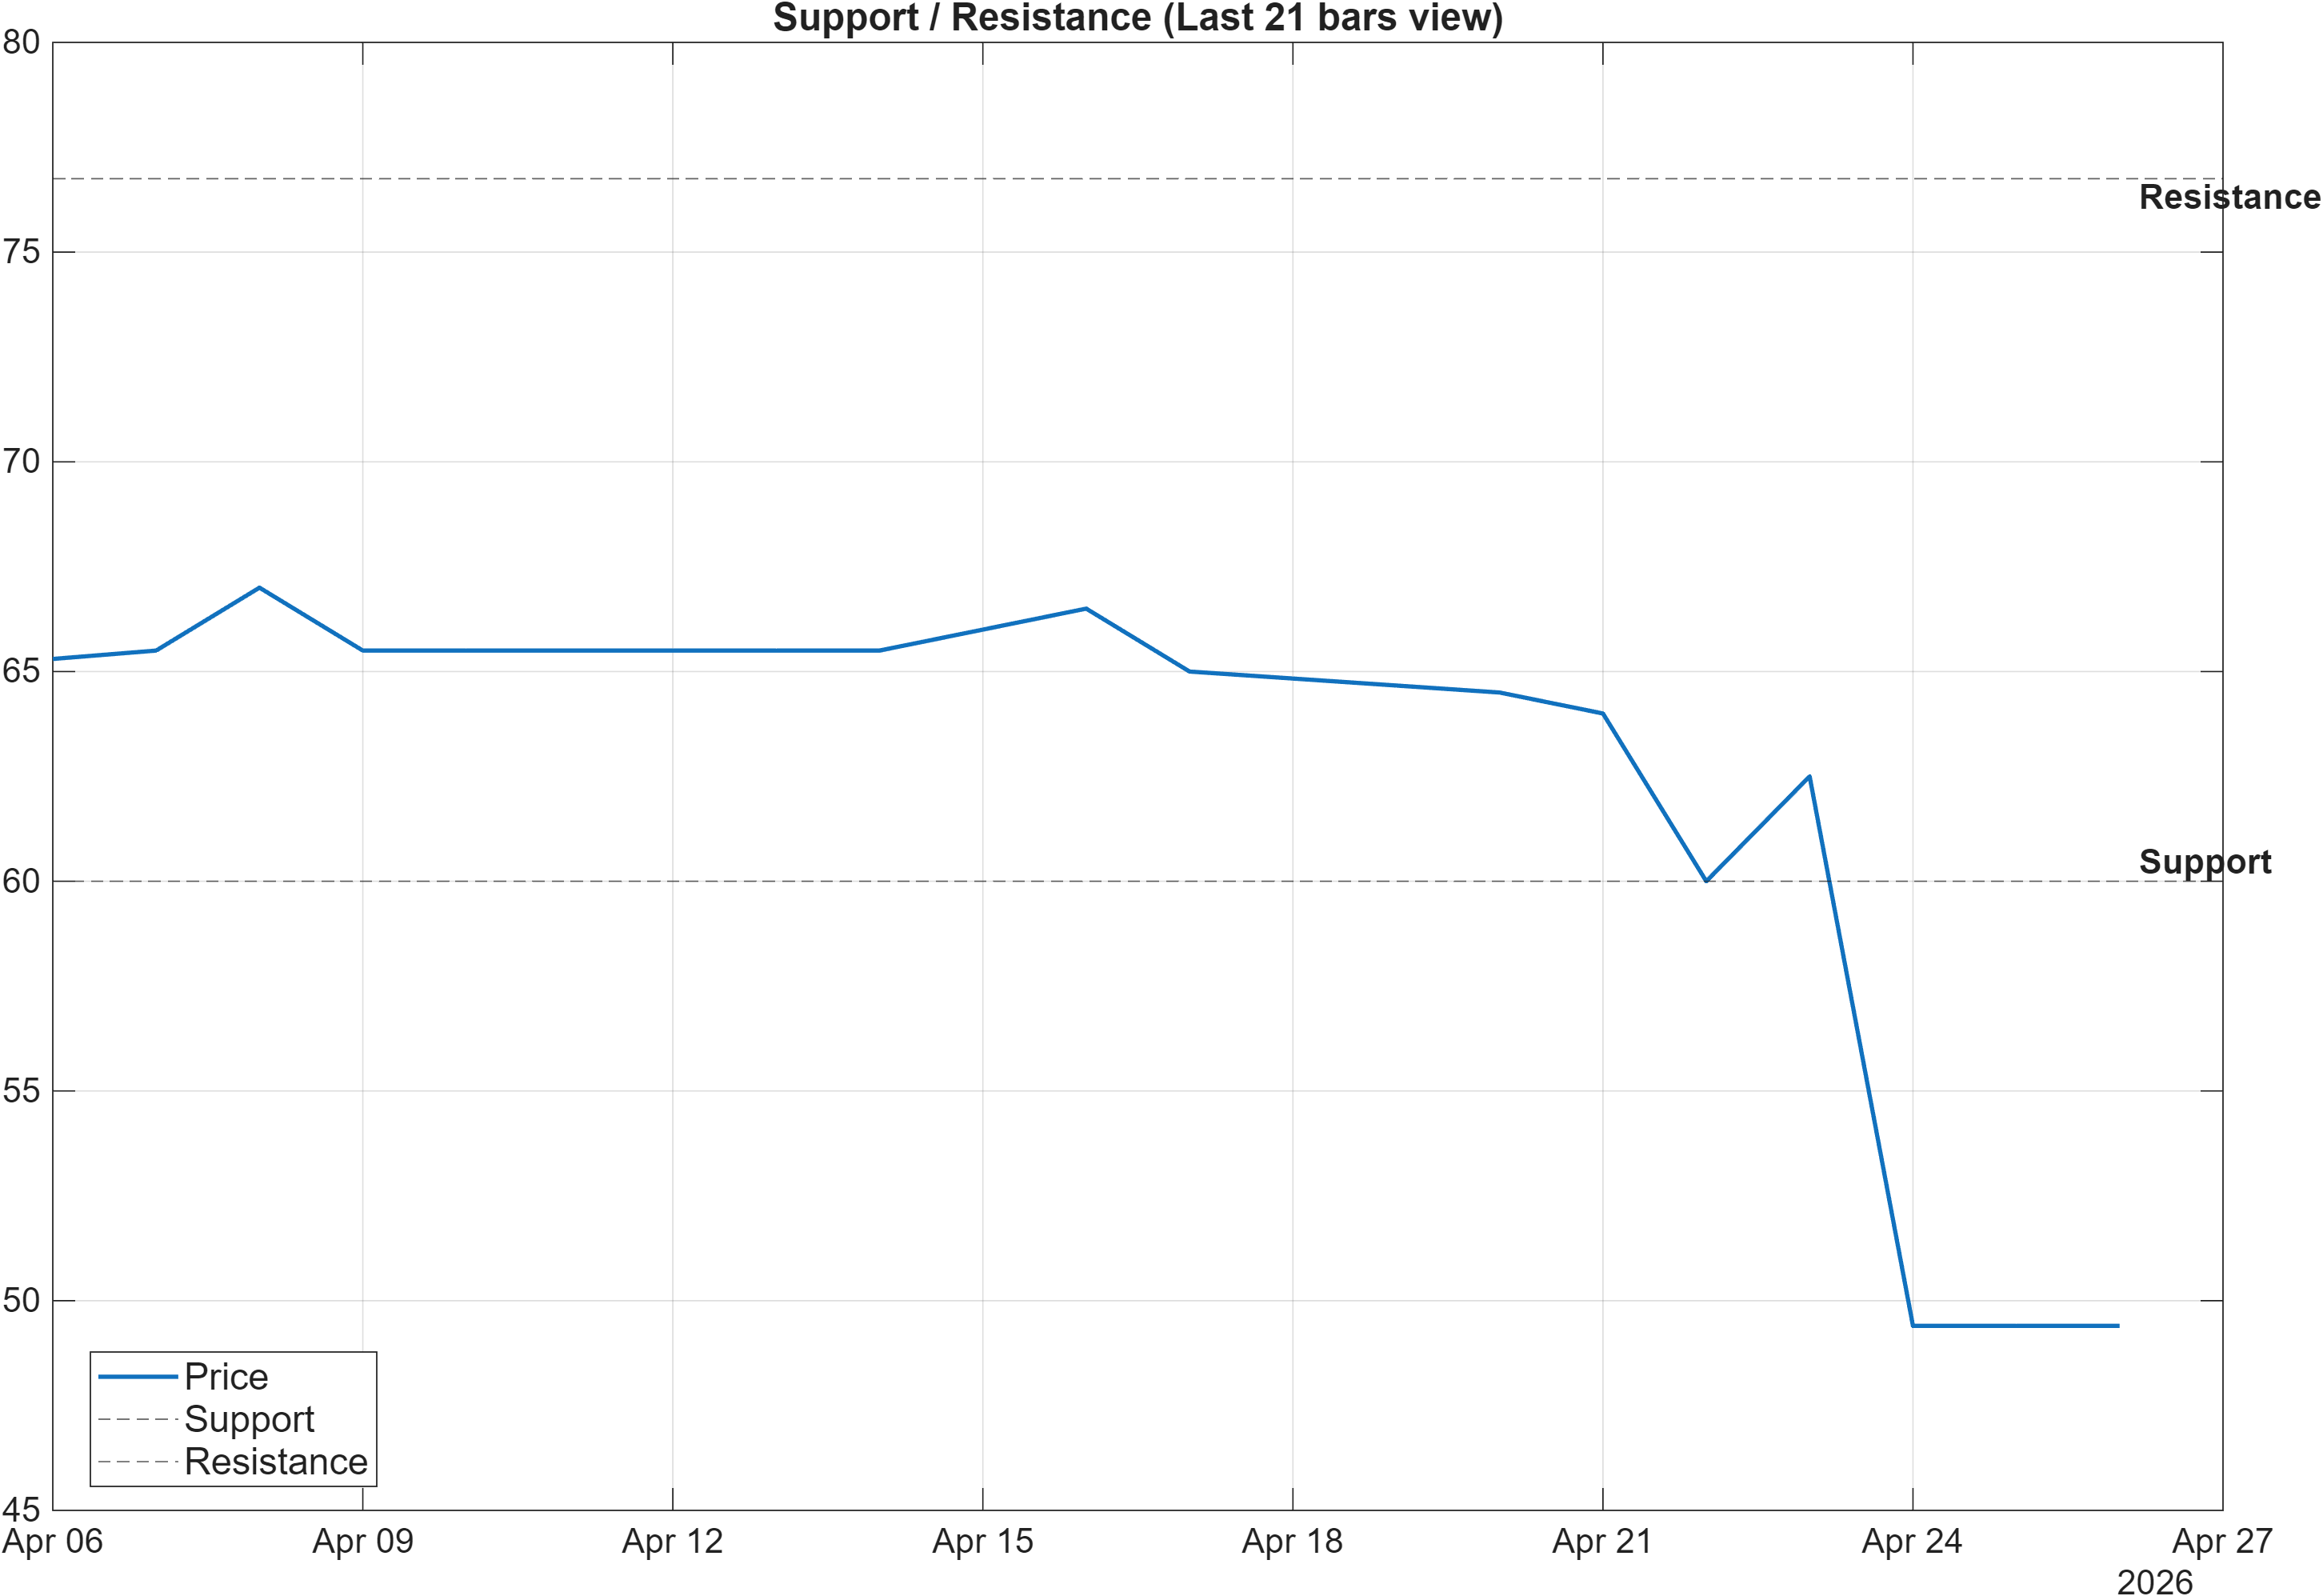
Scenario view: Break above resistance with volume → continuation. Close below support → signal deterioration risk.
The support/resistance framework is unusually central for this ticker in the current snapshot because so many signals point to transition risk rather than a clean trend. The market’s decision map is anchored at 60.0000 (support) and 76.7500 (resistance). With the trend layer bearish (close below MA50; MA50 below MA200) and momentum deeply negative (RSI(14) 15.15; MACD histogram -1.7220), the support zone becomes the primary reference for whether downside pressure is being absorbed or accelerating.
Support is not a “floor,” but it is a probabilistic area where behavior changes become measurable: failed breakdown attempts, reduced downside follow-through, or improving participation can all signal stabilization even if the broader moving-average stack has not repaired yet. Conversely, the scenario explicitly flags that a close below 60.0000 would increase deterioration risk—consistent with the broader bearish technical confluence discussed later.
On the upside, 76.7500 functions as a confirmation threshold for regime improvement. A break above resistance with volume is framed as “continuation,” but in analytical terms it is also the point where the instrument would begin to reconcile the bullish mid-term ranks (#32 monthly; #17 3-month) with the currently bearish price/MA structure. In other words, resistance is the gate for trend repair, not merely a level to trade against.
Given bandwidth at 0.3753, price can traverse zones with less “compression friction” than in tight-band regimes, increasing the value of waiting for confirmation (closes and volume) rather than reacting to intraday probes. As long as the instrument remains between 60.0000 and 76.7500, the “no dominant trend” description remains structurally intact—movement inside the range is informative, but it is not a decisive regime signal without follow-through.
5) Quant Technical Dashboard (18 Signals)
KGNAI AI Technical Analysis Score (Deep Reinforcement Learning): Rank #1051 out of 1419 (Rank 1 represents the strongest technical positioning and a higher probability of favorable price behavior. As ranks increase toward the maximum, the probability of favorable outcomes weakens and bearish positioning becomes more dominant.) | Label: Neutral | Score: -0.481
18-Signal Technical Confluence Score: -0.556 (Bearish)
Overall Technical Score (18-signal confluence + DRL rank blend): -0.533 (Bearish)
Note: The blended score reflects signal strength weighted against broader AI technical ranking, which may temporarily diverge.
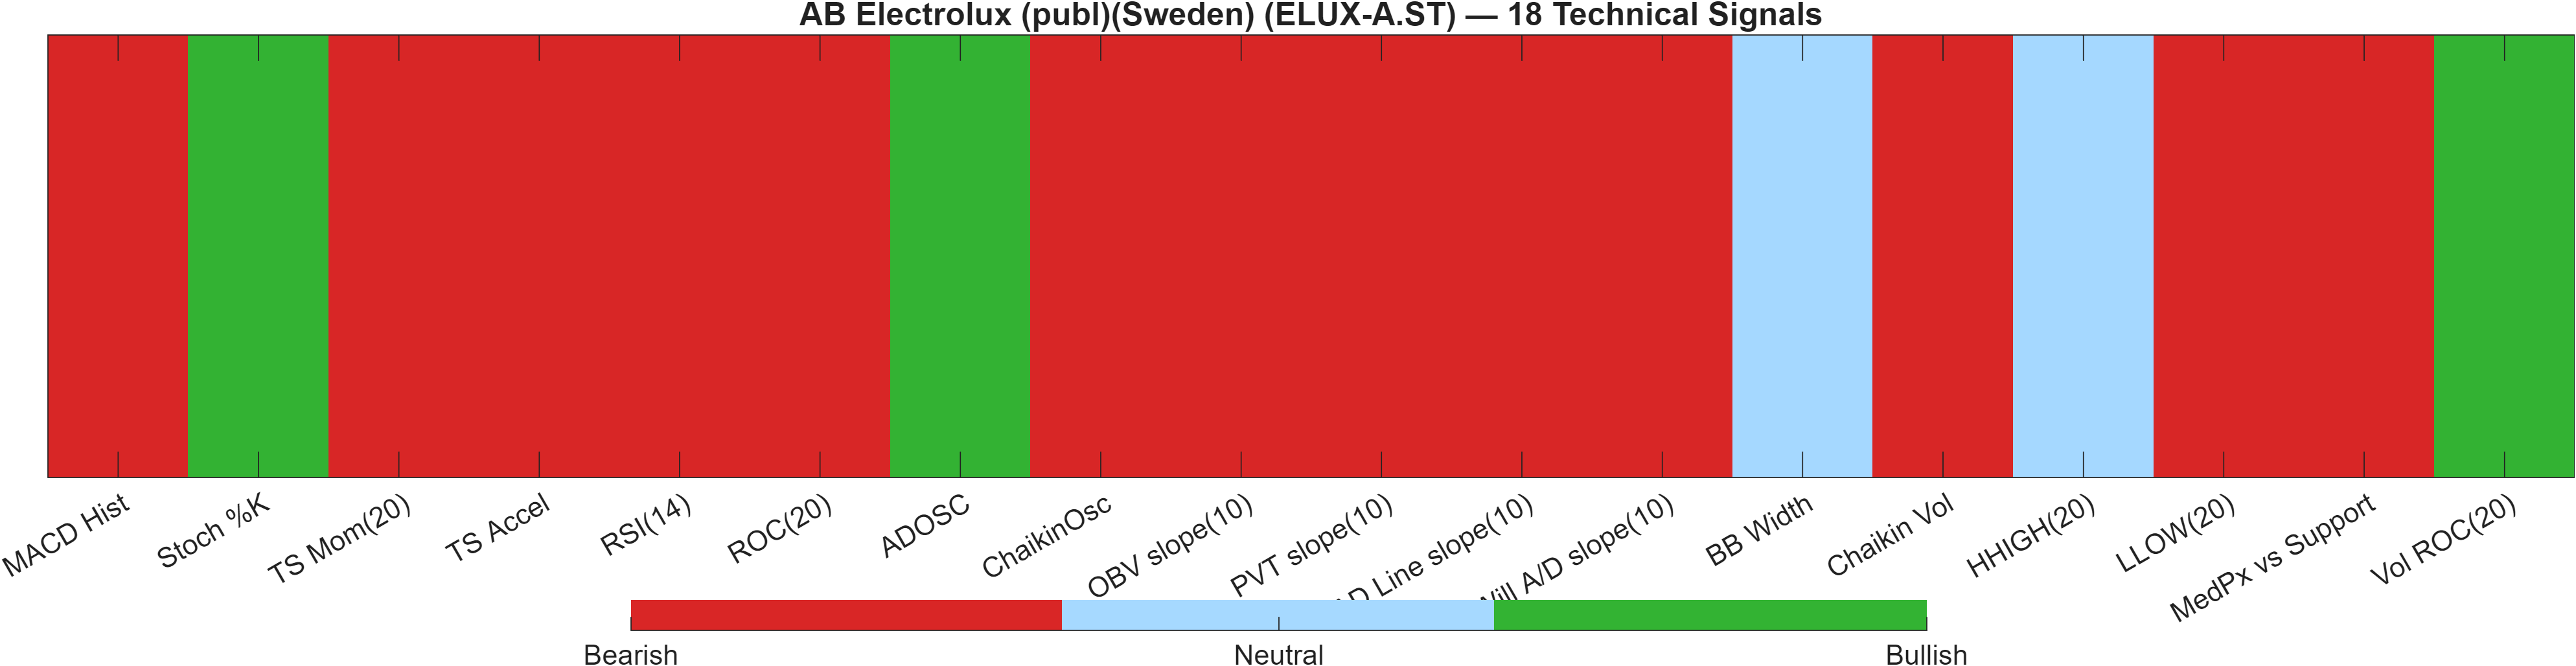
Blended technical score breakdown: -0.533 (Bearish | Bull 3 / Bear 13 / Neutral 2)
Signal-level alignment vs divergence
The technical dashboard is dominated by bearish readings even though the separate DRL model is labeled neutral. The 18-signal confluence score of -0.556 and the overall technical score of -0.533 both land in bearish territory, with the breadth of signals skewed heavily negative (Bear 13 versus Bull 3). That imbalance matters more than any single indicator because it implies downside pressure is not isolated to one dimension (e.g., momentum only) but is spread across multiple families (momentum, trend, and participation proxies).
The DRL technical rank (#1051 out of 1419) sits in a weaker relative band, yet the label remains neutral with a score of -0.481. This is a useful illustration of model blending: the DRL layer can soften the categorical label even when a majority of component signals are bearish, especially when the model detects non-linear stabilization patterns that are not fully captured by classic indicators.
Three indicator points help explain the bearish confluence without re-listing the table: the RSI(14) at 15.15 reflects extreme downside momentum; the MACD histogram at -1.722 indicates the downswing has not yet mean-reverted; and the BB Width at 0.3753 is neutral, meaning volatility is not collapsing in a way that would normally signal a quiet basing process. Together, they argue for caution when interpreting bullish mid-term ranks as immediate technical strength.
At the same time, the dashboard does contain selective counter-signals (only three bullish marks), which aligns with the daily rank being bullish (#216). In practice, this mixture tends to produce sharp, tradable rotations inside a broader technically weak environment. The most robust improvement would come from signal migration: bearish momentum measures rising, participation metrics stabilizing, and price reclaiming key moving averages—conditions that would also need to be consistent with behavior around 60.0000 and 76.7500.
Signal table (Bull/Bear/Neutral)
| Indicator | Value | Signal |
|---|---|---|
| MACD Hist | -1.722 | Bearish |
| Stoch %K | 2.286 | Bullish |
| TS Mom(20) | -16.1 | Bearish |
| TS Accel | -18.6 | Bearish |
| RSI(14) | 15.15 | Bearish |
| ROC(20) | -24.58 | Bearish |
| ADOSC | 20 | Bullish |
| ChaikinOsc | -2270 | Bearish |
| OBV slope(10) | -1.388e+04 | Bearish |
| PVT slope(10) | -1780 | Bearish |
| AD Line slope(10) | -1.154e+04 | Bearish |
| Will A/D slope(10) | -21.1 | Bearish |
| BB Width | 0.3753 | Neutral |
| Chaikin Vol | 80.46 | Bearish |
| HHIGH(20) | 67 | Neutral |
| LLOW(20) | 49 | Bearish |
| MedPx vs Support | -10.5 | Bearish |
| Vol ROC(20) | 1356 | Bullish |
Interpretation: Indicator-level signals form the base confluence, which is then adjusted using a separate AI-driven technical ranking model. The final technical score summarizes this combined view.
6) News sentiment + extractive gist
Note: Instrument-specific news matches were not found, so the digest includes broader market/sector headlines. Links are provided for verification.
Sentiment score (avg): -0.013 | Positive: 0% | Neutral: 94% | Negative: 6%
KGNAI AI News Sentiment Score (normalized -1 to +1): 0.99 (as of 2026-04-25) | Label: Bullish | Overall news score: 0.96
Positive Developments
Recent coverage across major financial outlets skews toward contextual optimism rather than instrument-specific catalysts. The model’s normalized news sentiment reading is 0.99 (labeled bullish), while the broader score remains elevated at 0.96. That said, the underlying distribution is heavily neutral (94%) with 0% positive and only 6% negative, implying that the bullish label likely reflects the weighting of limited high-signal items rather than a broad positive narrative. In practice, this type of sentiment configuration tends to act as a bias modifier—slightly supportive of stabilization—rather than a standalone driver. For ELUX-A.ST specifically, the absence of company-matched items means sentiment should be interpreted as a macro/sector backdrop that can influence risk appetite, but it does not substitute for confirmation from price structure and indicator repair.
Neutral / Mixed Developments
The average sentiment score sits near flat at -0.013, consistent with the dominance of neutral classification in the sample. This is a “low-impulse” information environment: narratives appear more descriptive than directional, and the signal is less likely to overwhelm technical constraints such as the bearish moving-average configuration and negative momentum readings (e.g., MACD histogram -1.7220). For readers, the key is to treat the news layer as context—a potential amplifier of moves around major levels like 60.0000 and 76.7500—rather than a catalyst map. With instrument-specific matches not available, the most robust use of this section is monitoring whether the sentiment distribution shifts away from neutrality alongside any technical inflection.
Negative / Risk Signals
Risk signals are present but limited in share (6% negative), which is not large enough to define the regime on its own. However, when technical conditions are already fragile—RSI(14) at 15.15 and a bearish blended technical score of -0.533—even a modest increase in negative tone can coincide with sharper downside continuation, particularly if price weakens toward structural support. The most relevant risk interpretation here is asymmetry: the news dataset is not strongly negative today, but the chart-based error bars are wider due to weak momentum and a bearish moving-average stack. As a result, downside sensitivity can remain elevated even without a clearly negative headline flow, making confirmation around support/resistance more critical than the day-to-day news mix.
What to monitor next
- Whether sentiment stays predominantly neutral (94%) or begins shifting toward a higher negative share.
- Any concurrent improvement in momentum (MACD histogram rising from -1.7220) during tests of 60.0000 support.
- News-flow changes coinciding with attempts to reclaim and hold above 76.7500 resistance.
Sources referenced: Reuters, Bloomberg, Yahoo Finance, MarketWatch, Investing.com
Snapshot: AI Rank (Short–Mid–Long): Mixed (Bearish–Bullish–Neutral) · Technical Confluence: Bearish · Key Levels: Support ~60.00 | Resistance ~76.75 · News Sentiment: Neutral
7) Sources
Not available in the provided data.
You may also like: How KGNAI AI ranks instruments across global markets
Disclaimer: KGNAI provides AI-generated analytics and educational market commentary only. This is not financial advice. Markets involve risk. Always do your own research.