
NMAN.ST — Nederman Holding AB (Sweden) | 19-Apr-2026 | Ranks Strong, Technicals Bearish: Validation Pending
Nederman Holding AB (NMAN.ST) presents a split profile where cross-horizon KGNAI ranks lean constructive, yet the technical confluence remains bearish on several core measures. In a 1,420-instrument European universe, the longer-duration ranks sit in the upper tier (notably the 3‑Monthly view), while the 18-signal dashboard and the DRL technical rank sit near the weakest end of the distribution. This combination often reflects a market in transition: longer-window relative strength can coexist with shorter-window momentum loss. From a pure charting standpoint, moving-average positioning is flagged as bearish (close vs MA50 and MA50 vs MA200), and momentum gauges such as RSI(14) at 37.38 and MACD histogram at -0.9962 reinforce downside pressure. Key decision levels remain well-defined at 130.4000 (support) and 147.8000 (resistance), with news sentiment skewing positive.
Key Takeaways
- Rank stance (Short / Mid / Long): Neutral / Bullish / Bullish (3‑Monthly rank is #7, indicating top-tier relative positioning in the 1,420 universe).
- Technical confluence label: Bearish (18-signal confluence -0.444; overall blended technical score -0.610).
- Key levels: Support ~ 130.4000 | Resistance ~ 147.8000.
- News sentiment bias: Bullish (avg sentiment 0.495; normalized score 1.00 as of 2026-04-17).
- Confirmation vs invalidation condition: A break above 147.8000 with volume supports continuation; a close below 130.4000 increases signal deterioration risk.
What KGNAI Measures
KGNAI evaluates assets using large cross-sectional datasets built from millions of structured data points. Inputs incorporate fundamental metrics, technical structures, and systematically processed news sentiment. Statistical models, machine learning, and AI frameworks are used to assess relative positioning, signal alignment, and probabilistic behavior across broad universes.
How to Read This Report
- Ranks are comparative across the tracked universe, not absolute price targets.
- Confluence reflects alignment among independent signal groups.
- Support/resistance levels are probabilistic decision zones, not guarantees.
- Sentiment provides contextual bias within the broader analytical framework.
1) KGNAI AI Analysis
Region: EUROPE
Total universe size: 1420 ranked instruments
- Daily rank: #88 out of 1420 — Bullish
- Weekly rank: #676 out of 1420 — Neutral
- Monthly rank: #81 out of 1420 — Bullish
- 3-Monthly rank: #7 out of 1420 — Bullish
- 6-Monthly rank: #13 out of 1420 — Bullish
- Yearly rank: #102 out of 1420 — Bullish
The rank stack for NMAN.ST is notable for time-horizon asymmetry. The weekly rank (#676) sits around the middle of the universe, while the 3‑Monthly rank (#7) and 6‑Monthly rank (#13) place the name firmly in the top tier on a relative basis. This pattern frequently appears when an instrument has been a strong relative performer over multi-month windows but is experiencing short-window consolidation or drawdown that temporarily dampens near-term leadership.
The daily rank (#88) and monthly rank (#81) both remain in the stronger segment of the 1,420-instrument set, suggesting that weakness is not uniformly distributed across horizons. However, the presence of a neutral weekly view alongside bullish daily and monthly readings can indicate a market that is rotation-sensitive: small changes in price/volume behavior can shift short-window models more quickly than longer-window components.
KGNAI’s stated term view summarizes this directly: Short-term Neutral, Mid-term Bullish, Long-term Bullish. From a risk-management perspective, that mix generally places more weight on confirmation rather than anticipation—especially given that later sections show bearish technical confluence. In other words, the ranks argue for continued relevance in the broader universe, but the timing layer (technical signals) needs to stabilize before the multi-month strength can be treated as fully reasserted.
Want the full universe and complete rank tables? Unlock full access on KGNAI: https://www.kgnai.com/pricing
2) Price & trend overview
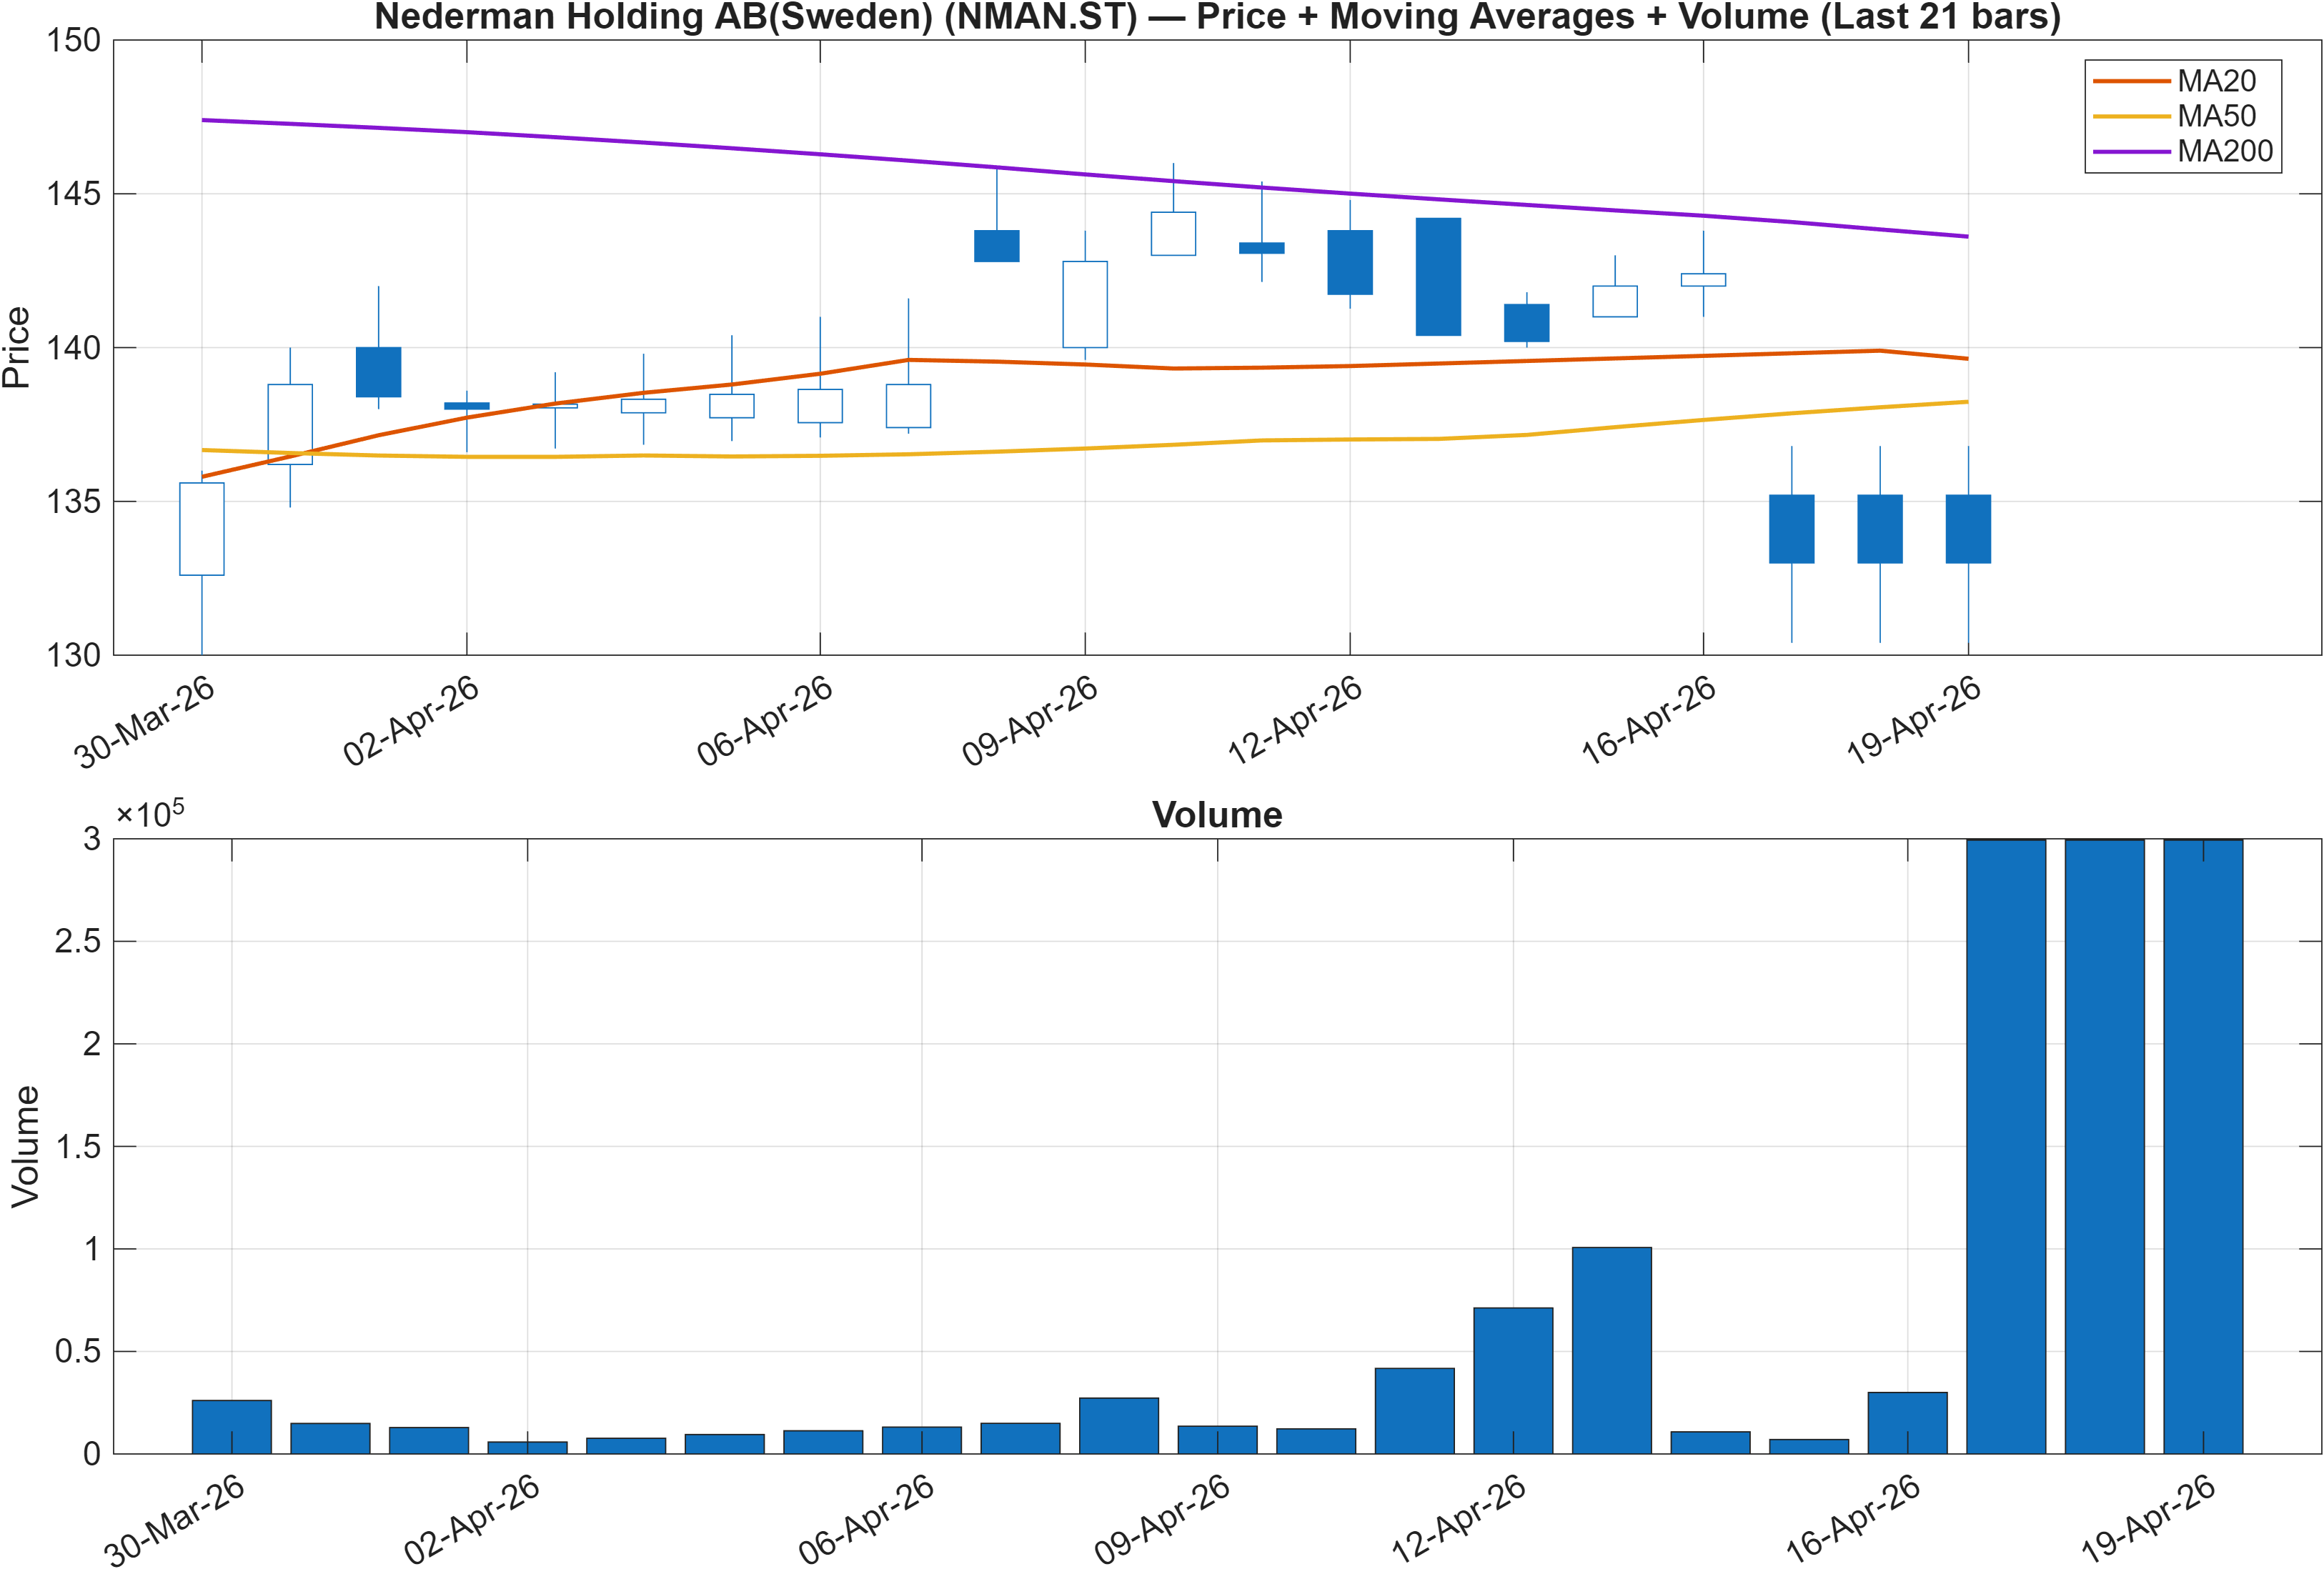
Interpretation: Close vs MA50 = Bearish, MA50 vs MA200 = Bearish.
The trend layer is currently defined by moving-average pressure. A bearish “close vs MA50” reading indicates price is trading below the intermediate trend reference, while “MA50 vs MA200” bearish suggests the medium trend remains below the longer trend—often associated with a fragile trend regime where rallies face overhead supply. This positioning is directionally consistent with the negative momentum readings seen elsewhere (e.g., RSI(14) 37.38 and MACD histogram -0.9962), reinforcing that the market is not yet exhibiting sustained upside impulse.
The more interesting tension is that the rank framework still flags longer-window strength (3‑Monthly rank #7; 6‑Monthly rank #13). When longer-window ranks stay elevated while trend indicators remain bearish, the market is often testing the durability of the prior advance. In that setting, participants typically watch whether price can reclaim trend references (such as the MA50) without requiring volatility expansion.
From a structure standpoint, the nearby mapped range—support near 130.4000 and resistance near 147.8000—becomes the practical boundary for determining whether this is a pause within a stronger multi-month trend, or a transition into a more persistent downswing. Until price behavior improves versus the MA50 and the MA50 begins to stabilize relative to the MA200, the trend signal set remains more consistent with defensive positioning than outright continuation.
3) Momentum & volatility dashboard
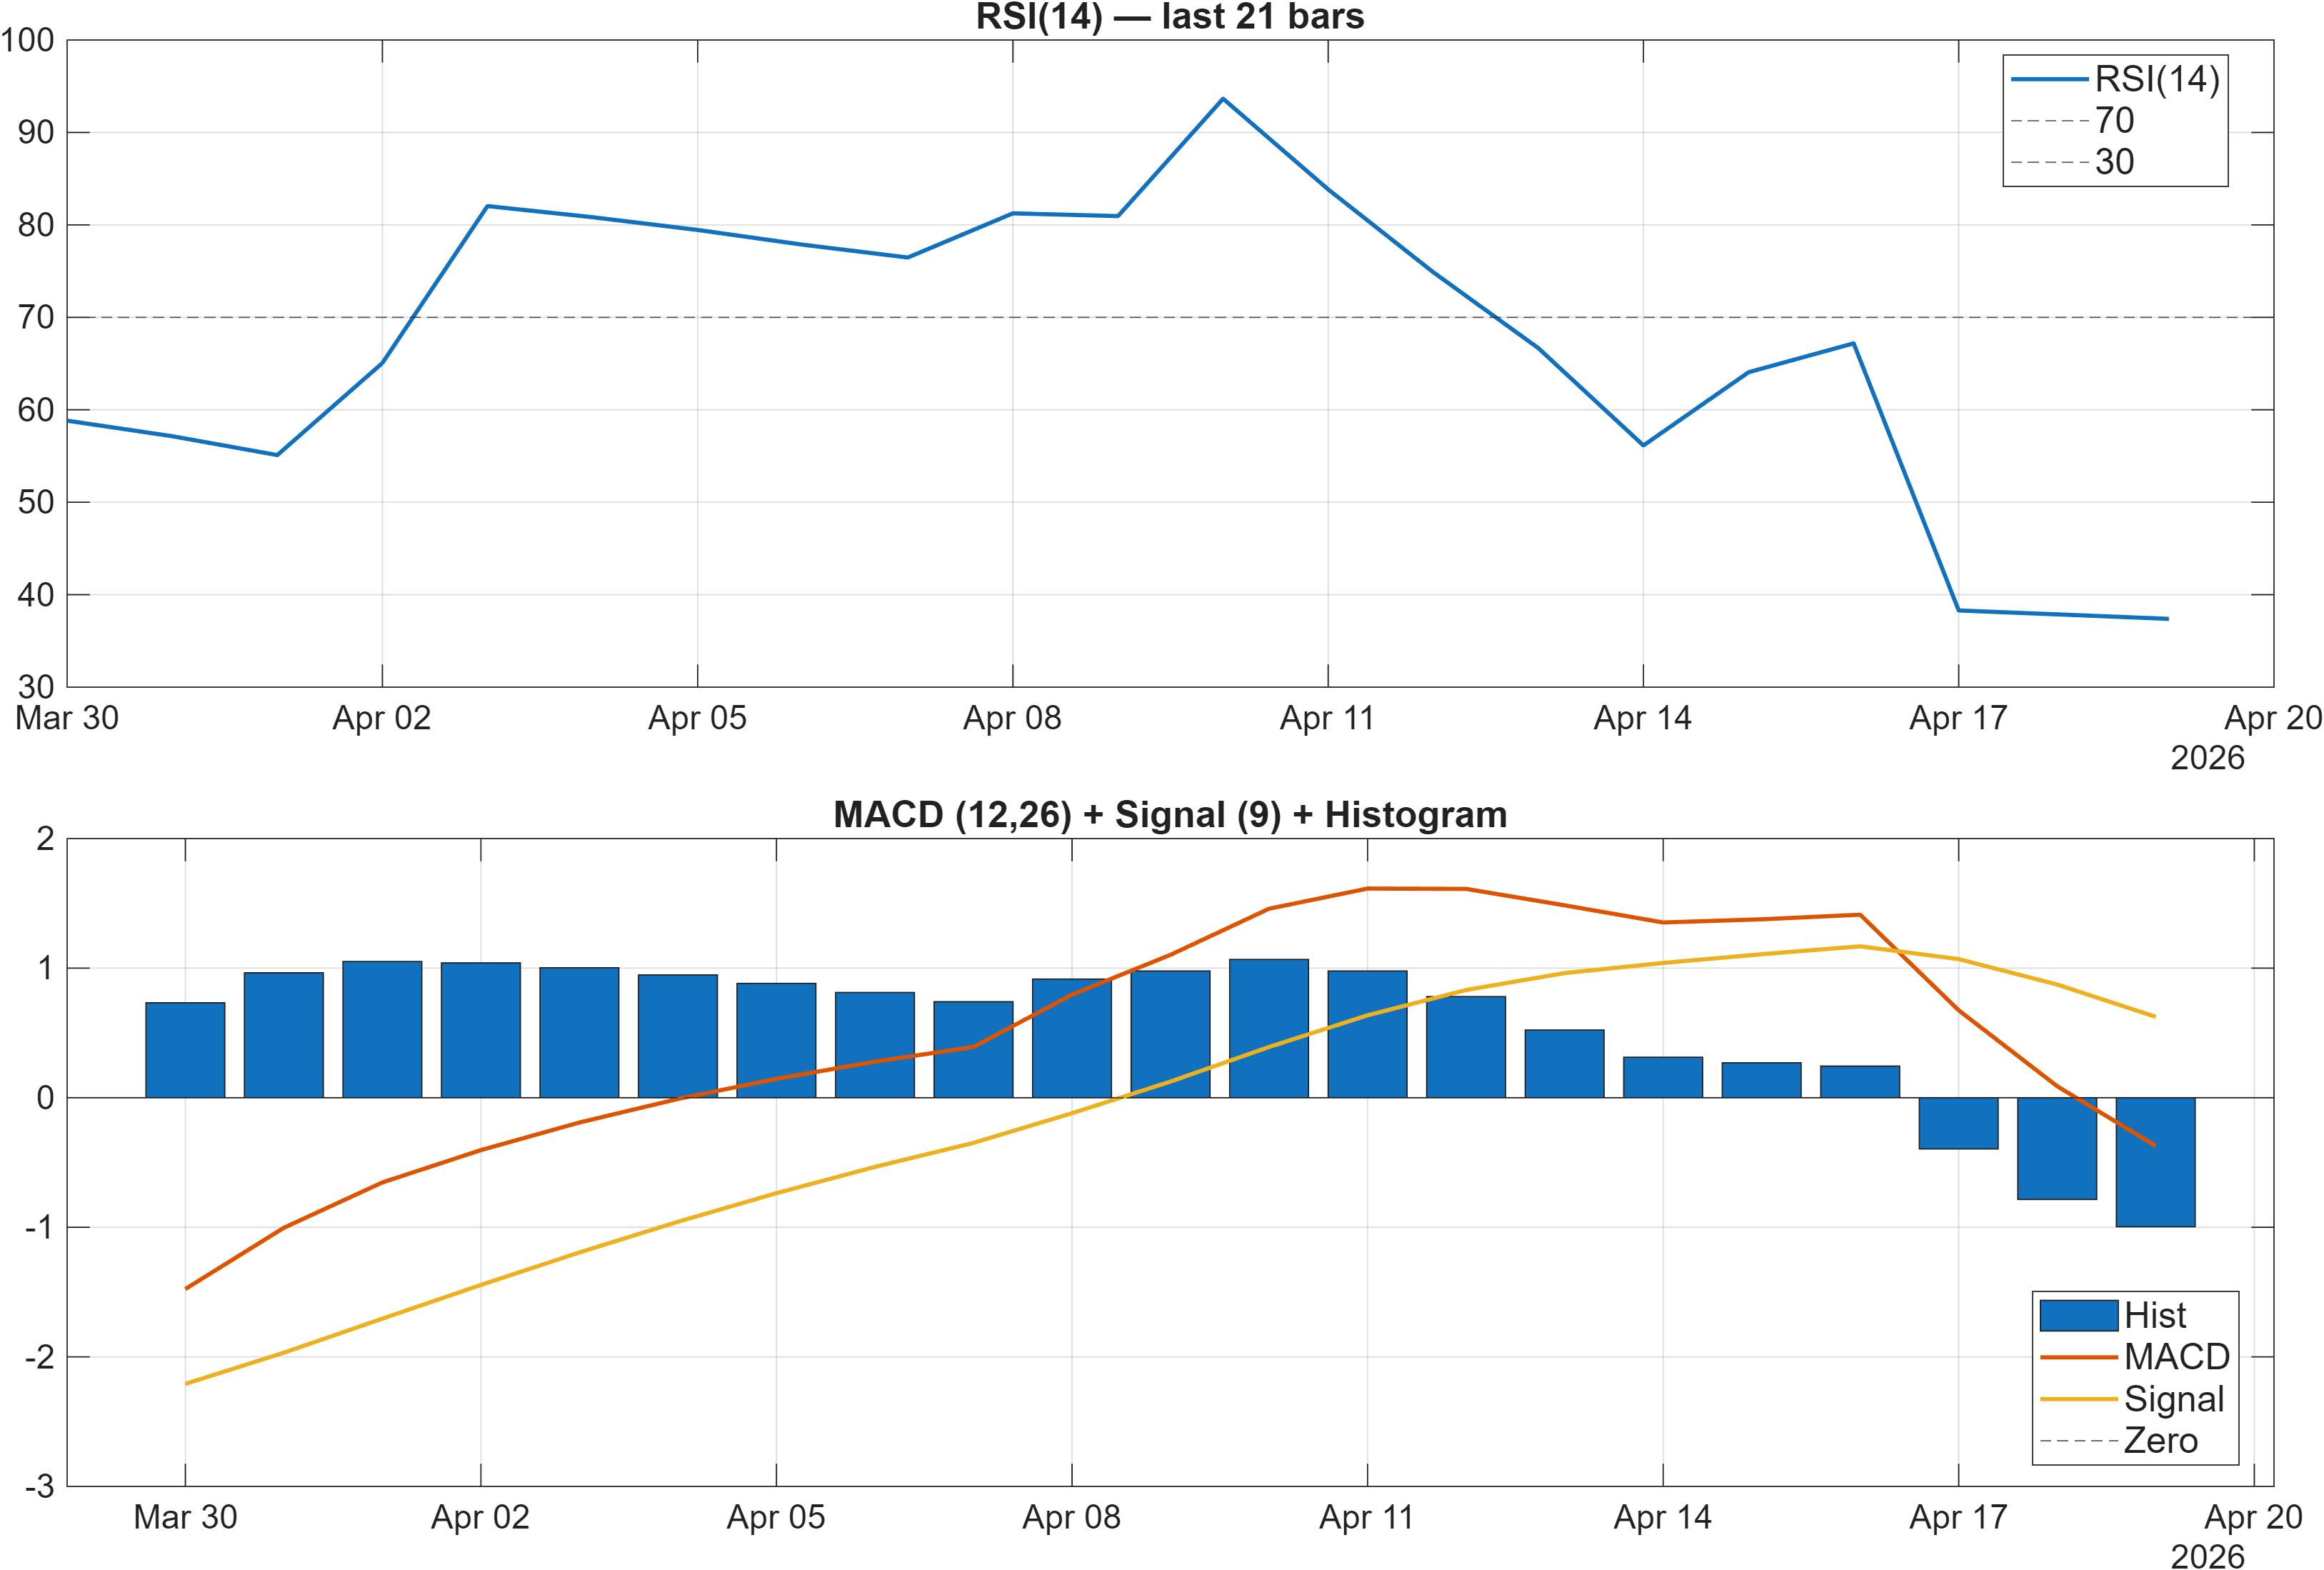
Interpretation: RSI bias = Bearish, MACD hist = -0.9962.
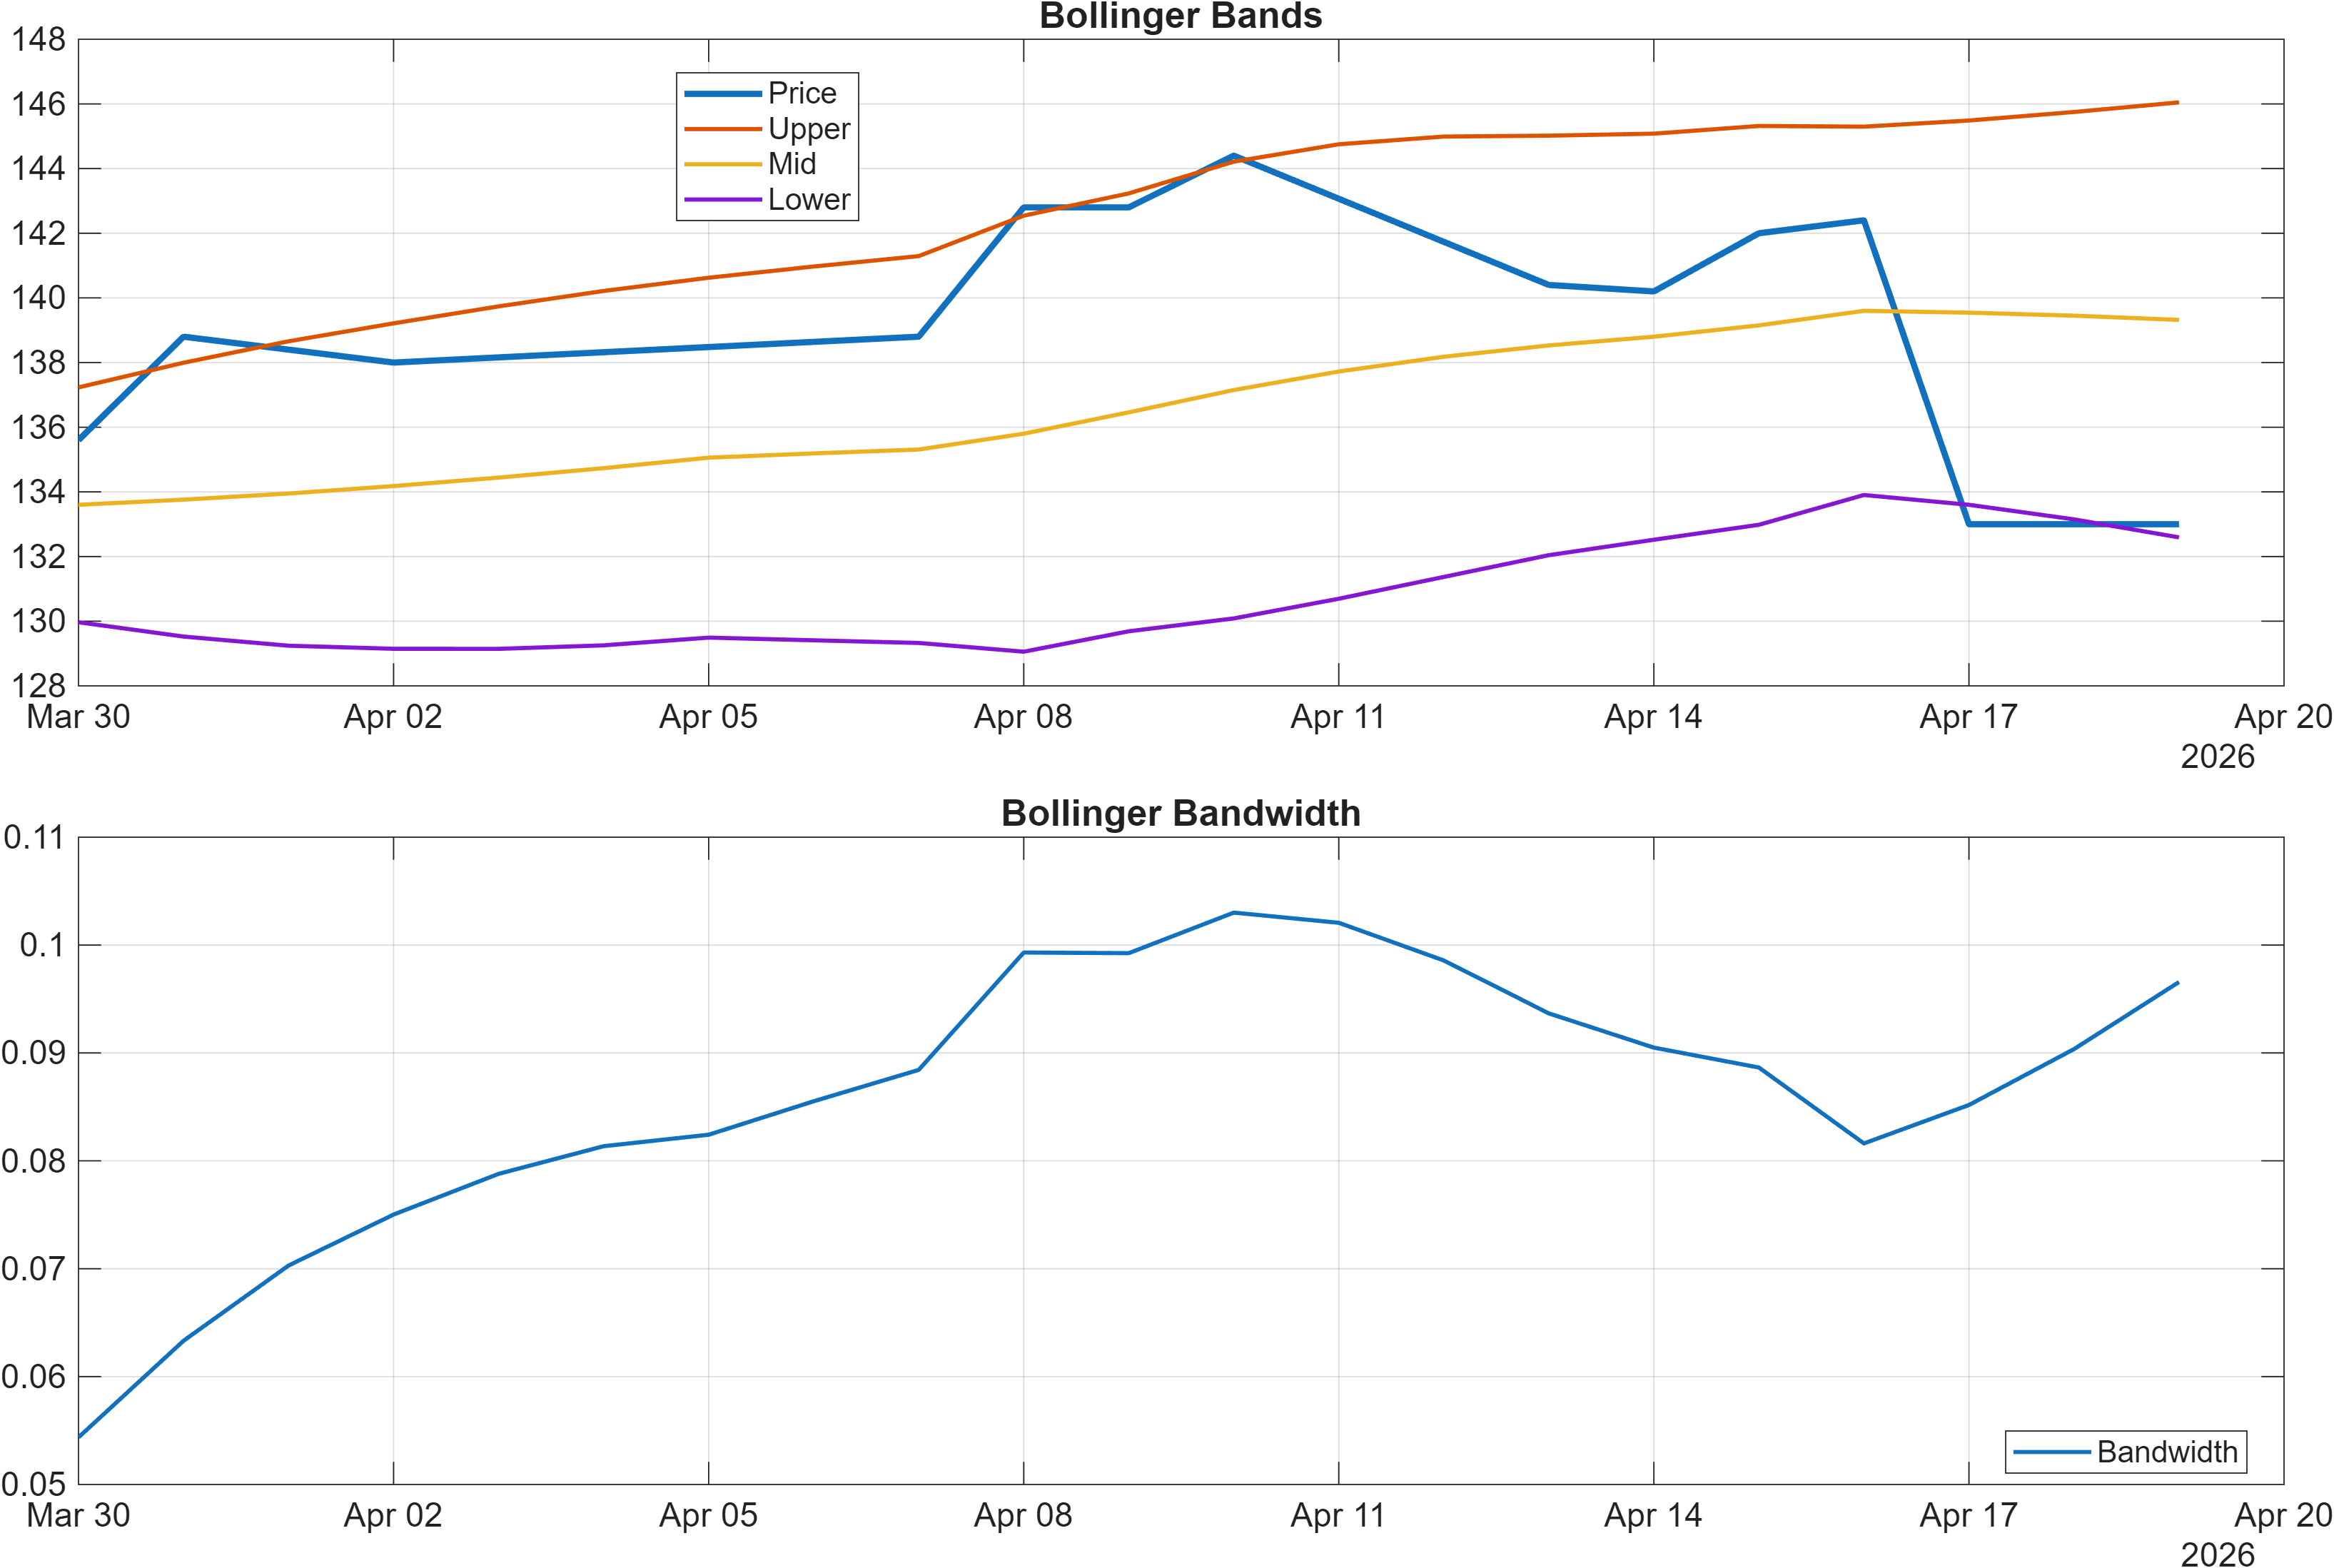
Interpretation: Bandwidth (volatility regime) latest = 0.0966.
Momentum readings lean negative and, importantly, appear internally consistent across families. RSI(14) at 37.38 sits below the midline and aligns with a bearish RSI bias, indicating that average gains have not meaningfully offset average losses over the lookback. The MACD histogram at -0.9962 adds a second, independent confirmation that downside momentum is still present rather than merely a low-volatility drift.
Volatility context is more restrained. Bollinger Bandwidth at 0.0966 points to a relatively contained regime versus what would be expected during a disorderly selloff. That matters because bearish momentum in a contained volatility environment can resolve in two distinct ways: either a gradual base forms (with momentum improving before price breaks out), or price experiences a later volatility expansion that forces a faster re-pricing. The bandwidth reading suggests that, for now, the market is not in the latter state.
From a signal-design standpoint, this “bearish momentum + contained volatility” mix is a common precursor to a decision point at mapped levels. In the next leg, analysts typically focus on whether momentum improves while price holds above support (~130.4000), or whether downside momentum persists and begins to pressure the range floor. Given the longer-horizon rank strength (3‑Monthly rank #7), a stabilization in RSI and MACD would be the cleaner pathway to reconcile ranks with the technical dashboard.
4) Support / Resistance zones
Support ~ 130.4000 | Resistance ~ 147.8000
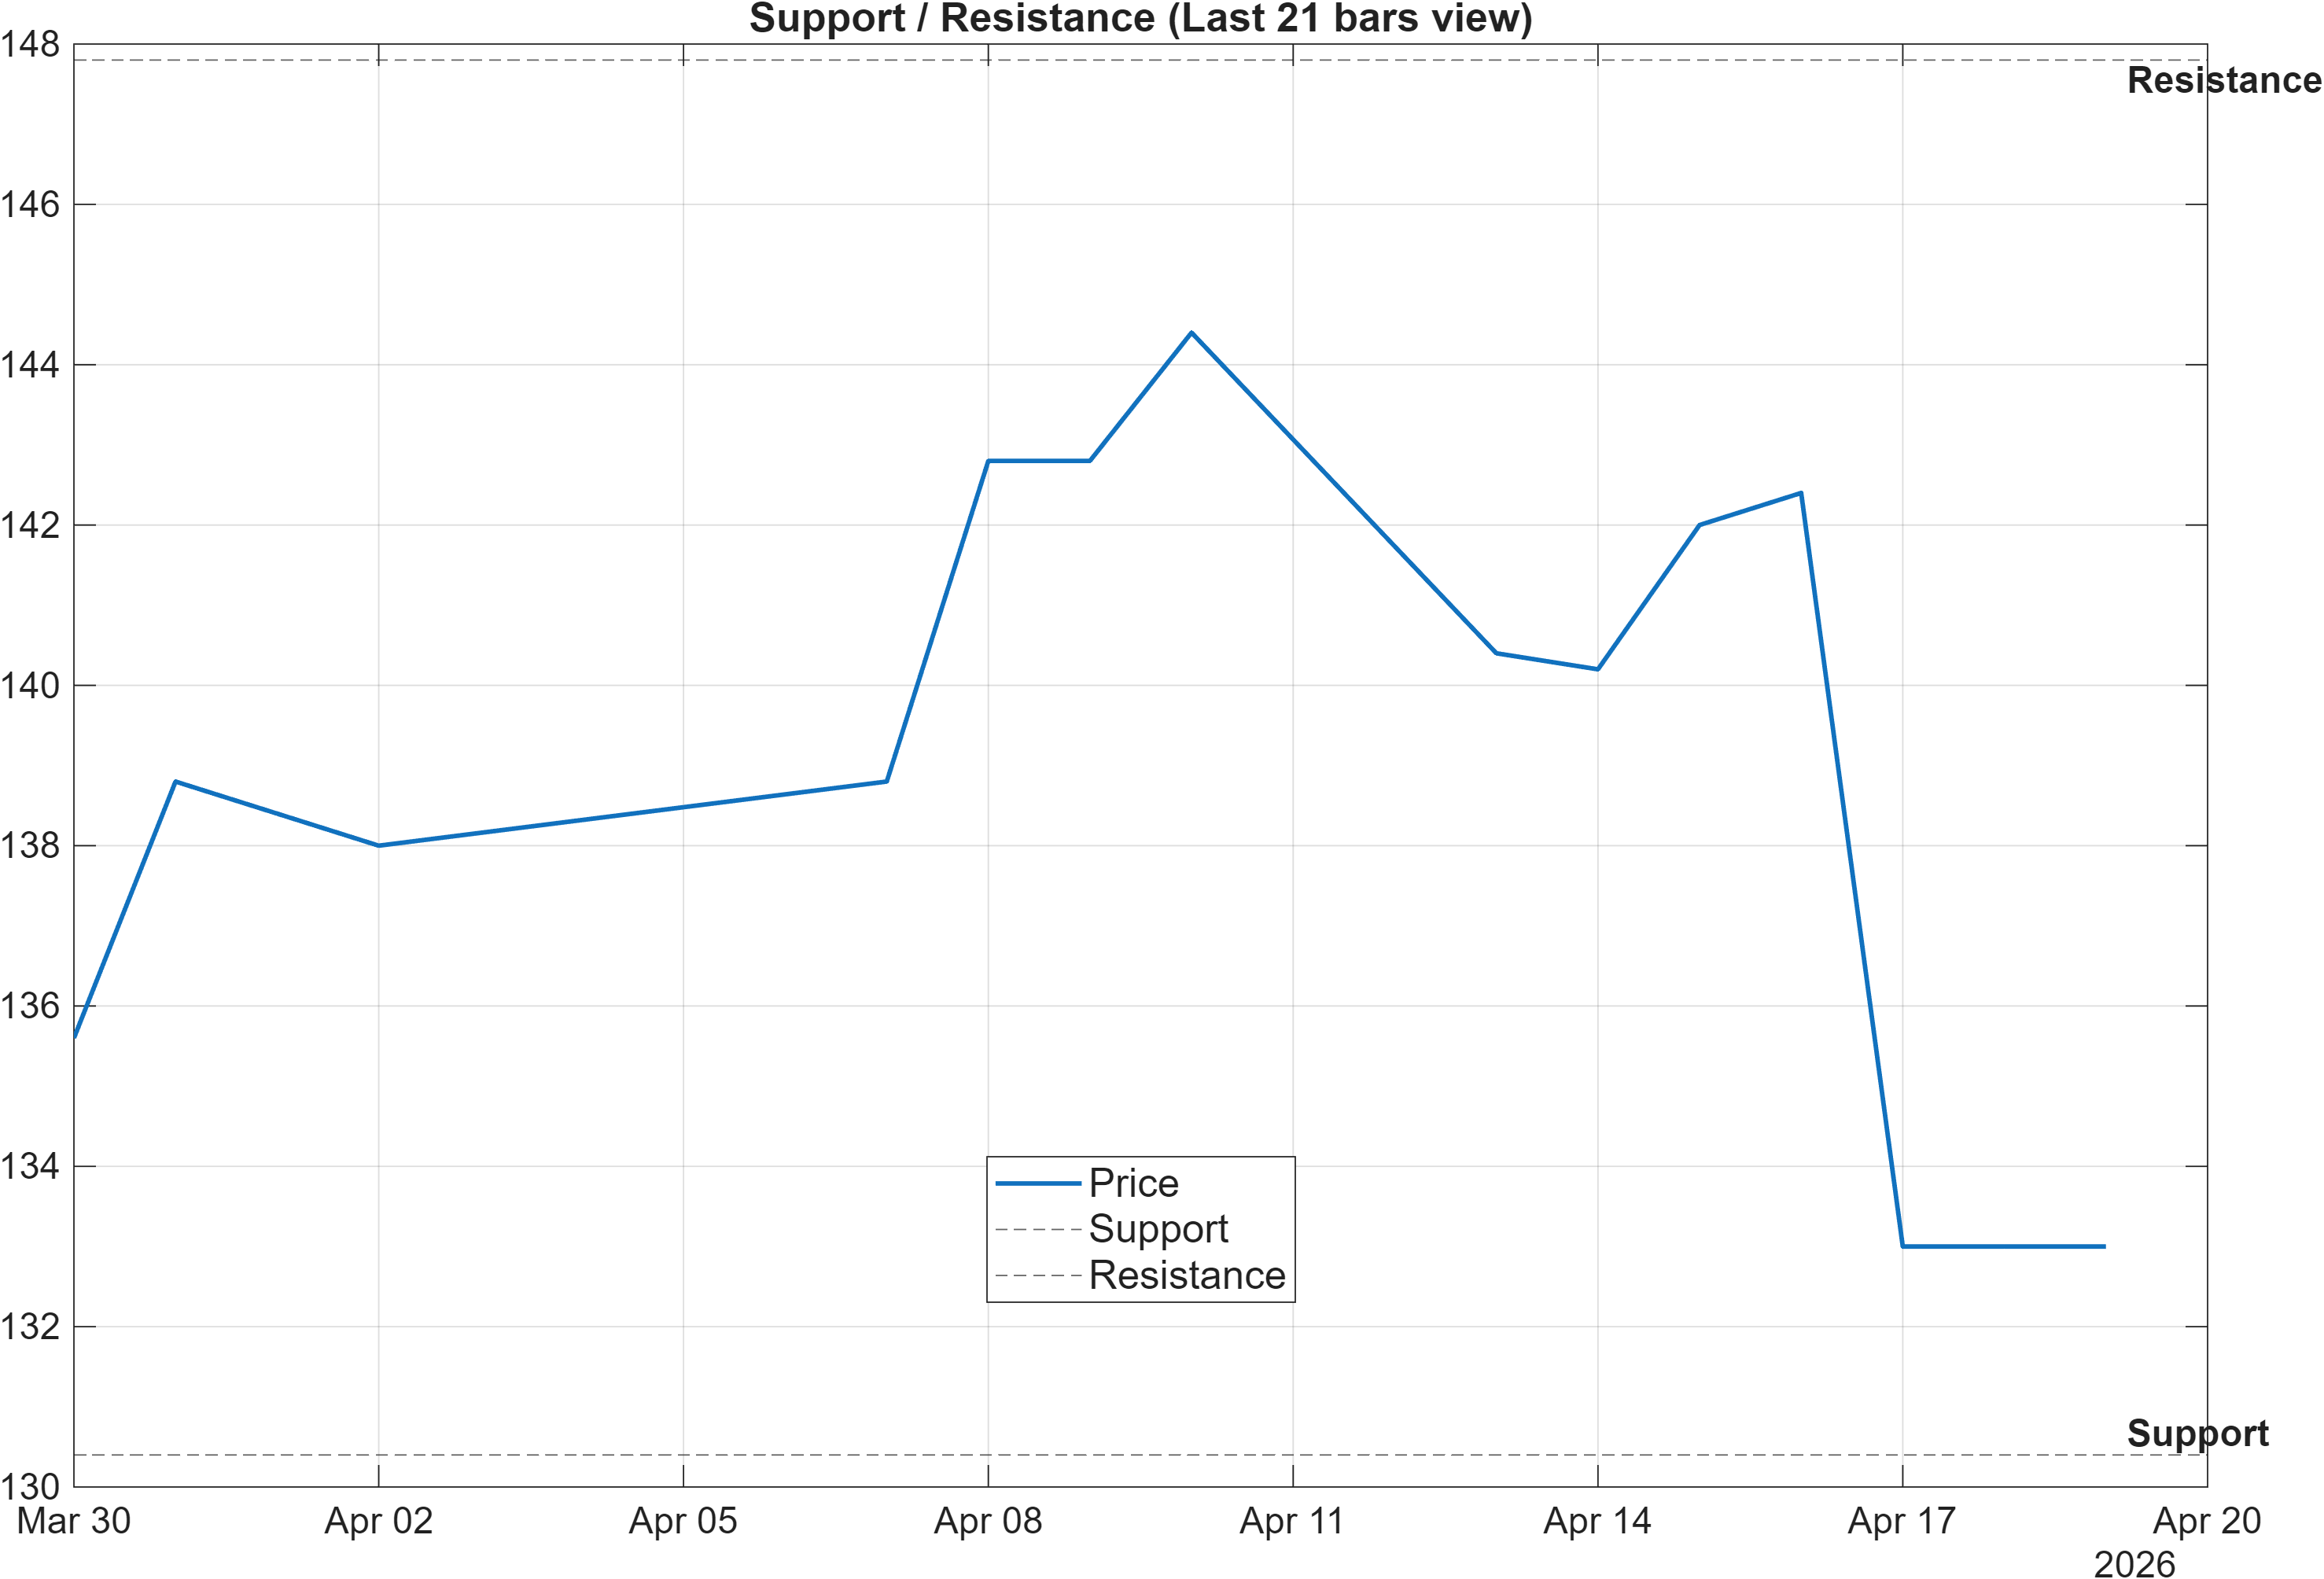
Scenario view: Break above resistance with volume → continuation. Close below support → signal deterioration risk.
The current map provides a clean framework for separating range behavior from trend reassertion. Resistance near 147.8000 acts as the obvious upside checkpoint: a break above, particularly if accompanied by volume confirmation (as noted in the scenario view), would help validate that multi-month rank strength (3‑Monthly #7, 6‑Monthly #13) is translating back into actionable price leadership. In that outcome, the bearish moving-average configuration becomes less dominant as price begins to reclaim key trend references.
Support near 130.4000 is the downside boundary that matters most for risk control. With RSI(14) already at 37.38 and MACD histogram at -0.9962, a close below support would align price structure with the bearish momentum regime and would likely increase the probability that the weak technical composite (overall technical score -0.610) is not merely a timing artifact.
Because Bollinger Bandwidth is relatively contained at 0.0966, moves into either boundary can be especially informative. Breakouts from lower-volatility conditions tend to be more sensitive to confirmation: follow-through matters more than the initial breach. Practically, the range between 130.4000 and 147.8000 should be treated as the primary decision zone where the market reveals whether it is stabilizing (momentum improves while holding support) or transitioning (support fails and trend pressure persists).
5) Quant Technical Dashboard (18 Signals)
KGNAI AI Technical Analysis Score (Deep Reinforcement Learning): Rank #1417 out of 1420 (Rank 1 represents the strongest technical positioning and a higher probability of favorable price behavior. As ranks increase toward the maximum, the probability of favorable outcomes weakens and bearish positioning becomes more dominant.) | Label: Bearish | Score: -0.996
18-Signal Technical Confluence Score: -0.444 (Bearish)
Overall Technical Score (18-signal confluence + DRL rank blend): -0.610 (Bearish)
Note: The blended score reflects signal strength weighted against broader AI technical ranking, which may temporarily diverge.
Blended technical score breakdown: -0.610 (Bearish | Bull 4 / Bear 12 / Neutral 2)
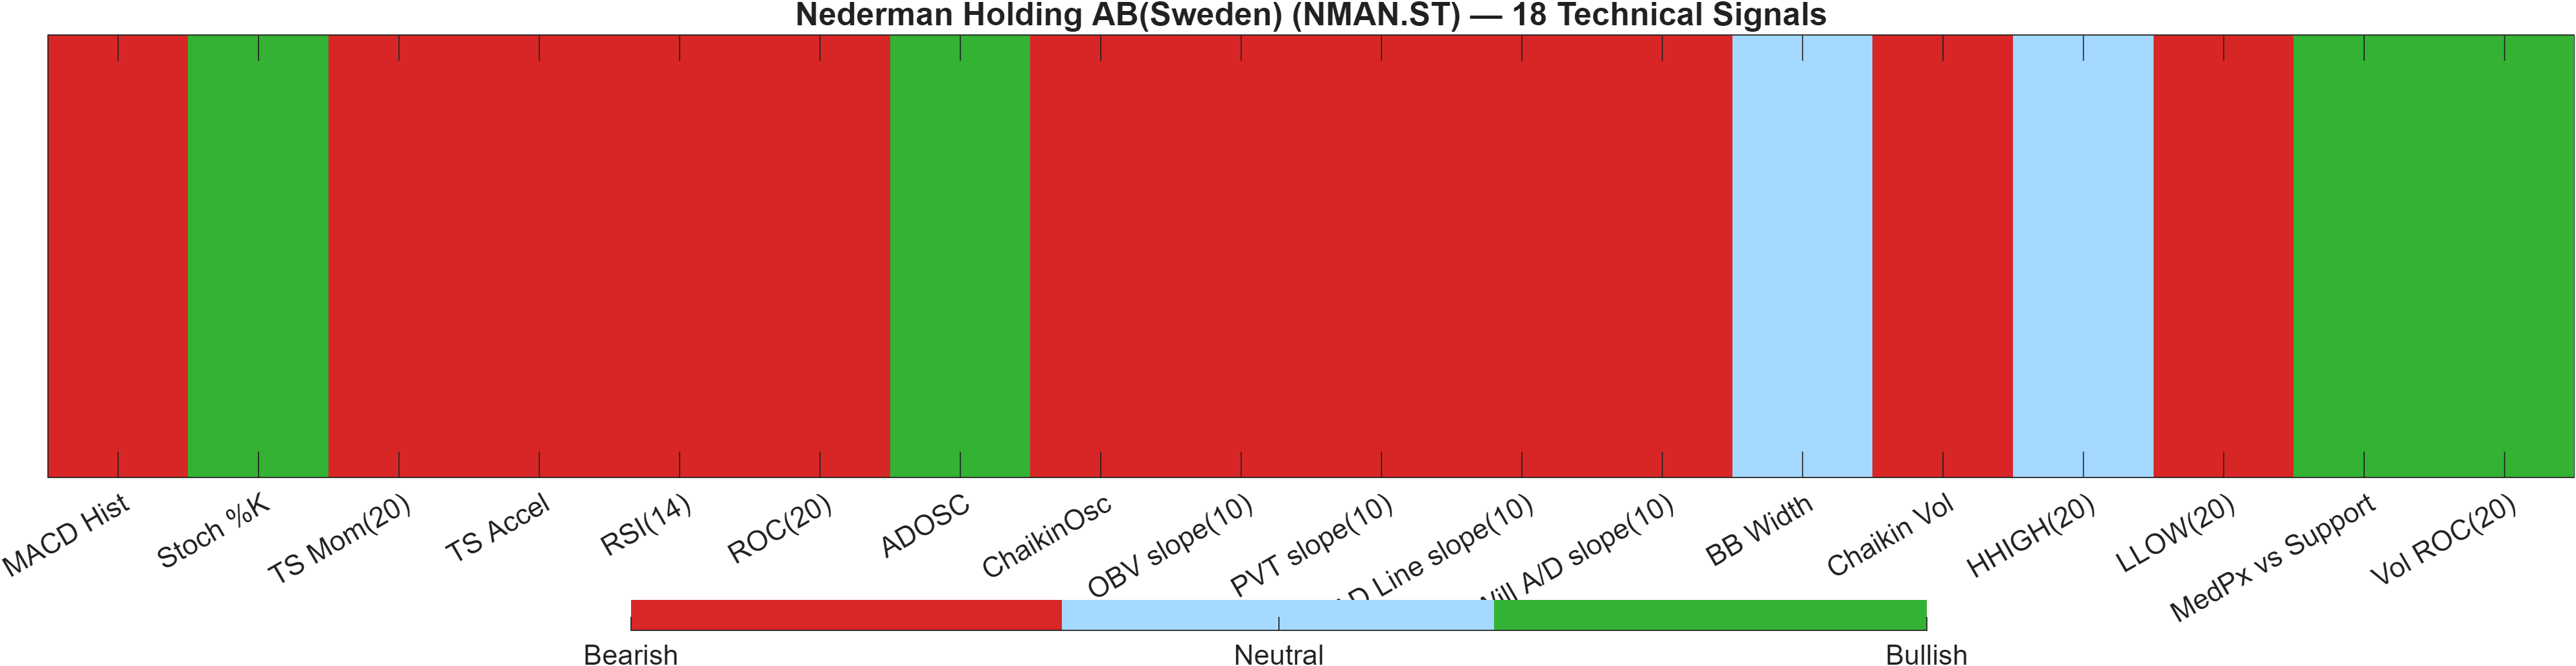
The technical dashboard is unusually decisive on the bearish side. The Deep Reinforcement Learning technical rank is #1417 out of 1420 with a score of -0.996, placing NMAN.ST near the weakest tail of the model’s technical opportunity set. The 18-signal confluence score of -0.444 and the blended overall technical score of -0.610 both reinforce that the majority of independently computed signals are not aligned with an immediate upside bias.
The breadth detail (Bull 4 / Bear 12 / Neutral 2) suggests the bearish read is not coming from a single indicator family. Momentum and rate-of-change measures are negative (e.g., MACD histogram -0.9962; RSI(14) 37.38), while multiple volume/accumulation slopes are also flagged bearish in the signal table. That combination matters because bearish momentum without bearish participation can sometimes reverse quickly; here, the participation layer is not clearly supportive.
At the same time, a minority of bullish signals exist and should be treated as potential early stabilization cues rather than confirmations. For example, Stoch %K at 16.67 is tagged bullish—often associated with short-window oversold behavior—while Vol ROC(20) at 1913 is also bullish, indicating notable volume change. These can occur in both bottoms and breakdowns; their informational value rises only if price holds above 130.4000 and momentum begins to improve.
Signal table (Bull/Bear/Neutral)
| Indicator | Value | Signal |
|---|---|---|
| MACD Hist | -0.9962 | Bearish |
| Stoch %K | 16.67 | Bullish |
| TS Mom(20) | -5.8 | Bearish |
| TS Accel | -10 | Bearish |
| RSI(14) | 37.38 | Bearish |
| ROC(20) | -4.179 | Bearish |
| ADOSC | 32.81 | Bullish |
| ChaikinOsc | -1.062e+05 | Bearish |
| OBV slope(10) | -4.745e+05 | Bearish |
| PVT slope(10) | -2.146e+04 | Bearish |
| AD Line slope(10) | -3.486e+05 | Bearish |
| Will A/D slope(10) | -15.4 | Bearish |
| BB Width | 0.09657 | Neutral |
| Chaikin Vol | 25.8 | Bearish |
| HHIGH(20) | 146 | Neutral |
| LLOW(20) | 130.4 | Bearish |
| MedPx vs Support | 3.2 | Bullish |
| Vol ROC(20) | 1913 | Bullish |
Interpretation: Indicator-level signals form the base confluence, which is then adjusted using a separate AI-driven technical ranking model. The final technical score summarizes this combined view.
6) News sentiment + extractive gist
Sentiment score (avg): 0.495 | Positive: 100% | Neutral: 0% | Negative: 0%
KGNAI AI News Sentiment Score (normalized -1 to +1): 1.00 (as of 2026-04-17) | Label: Bullish | Overall news score: 1.00
Positive Developments
Recent coverage across major financial outlets indicates a consistently constructive tone around Nederman Holding AB, reflected in a normalized news sentiment score of 1.00 and an average sentiment reading of 0.495. The commentary emphasizes operational resilience and continued progress themes, which can help explain why longer-horizon ranks remain strong (for example, the 3‑Monthly rank #7 and 6‑Monthly rank #13). In market structure terms, uniformly positive sentiment can support risk appetite during consolidations by reducing the likelihood of abrupt de-risking on incremental updates. That said, sentiment alone is not a timing tool; its main analytical value here is as a contextual tailwind while price navigates a technically bearish configuration. If price can hold above 130.4000 as momentum stabilizes, the positive sentiment backdrop becomes more relevant as a reinforcement layer rather than a contradiction.
Neutral / Mixed Developments
The dataset shows sentiment dispersion is effectively absent (Positive 100%, Neutral 0%, Negative 0%), which is itself a form of “mixed” signal from an analytical standpoint: it reduces informational diversity and can mask incremental shifts until they appear in price. When news tone is uniformly constructive while the technical composite is bearish (overall technical score -0.610; DRL rank #1417), the market often becomes more sensitive to confirmation thresholds—particularly the resistance zone near 147.8000. In that environment, investors may focus less on additional upbeat narratives and more on whether price behavior begins to corroborate the optimism through improving RSI and MACD dynamics.
Negative / Risk Signals
No negative items are represented in the provided sentiment breakdown (Negative 0%), so the primary “risk signal” in the news layer is the potential for sentiment-price divergence. With momentum indicators leaning bearish (RSI(14) 37.38; MACD histogram -0.9962) and moving-average structure also bearish, the market is currently not validating the uniformly positive narrative through technical confirmation. That gap can matter because when positioning shifts, price typically moves first; sentiment measures may remain elevated until a new information cluster enters the feed. If price were to close below 130.4000, the absence of negative sentiment would not mitigate the technical deterioration—rather, it would highlight that the dominant risk control should remain anchored to the chart-defined levels and the confluence score.
What to monitor next
- Whether sentiment remains uniformly positive if price fails to reclaim resistance near 147.8000.
- Any shift away from Positive 100% that coincides with a test of support at 130.4000.
- Whether momentum (RSI/MACD) improves alongside continued positive coverage.
Sources referenced: Reuters, Bloomberg, Yahoo Finance, MarketWatch, Investing.com
7) Sources
Not available in the provided data.
You may also like: How KGNAI AI ranks instruments across global markets
Disclaimer: KGNAI provides AI-generated analytics and educational market commentary only. This is not financial advice. Markets involve risk. Always do your own research.