
JSW.WAR (Jastrzebska Spotka Weglowa SA) — 15-Apr-2026 Technicals Skew Bearish as Structural Risks Increase
SEO summary: Jastrzebska Spotka Weglowa SA (JSW.WAR) screens as weak within KGNAI’s Europe universe as of 15-Apr-2026, with ranks clustered in the lower tail of the 1,410-instrument cross-section. The daily rank (#1384/1410) and monthly rank (#1403/1410) remain firmly risk-off, while the weekly and yearly horizons register Neutral rather than outright improvement—suggesting stabilization attempts that have not translated into durable strength. Technically, the 18-signal confluence score (-0.278, Neutral) is overshadowed by a much weaker DRL technical rank (#1334/1410; score -0.892), pulling the blended assessment to -0.462 (Bearish). Momentum readings (e.g., RSI(14) 28.33 and MACD histogram -0.72) point to downside pressure with only selective volume/accumulation offsets. Key decision zones are defined by support ~25.6450 and resistance ~35.0900, with news sentiment largely neutral and non-specific to the instrument.
- Rank stance: Short Bearish (daily #1384/1410) · Mid Bearish (monthly #1403/1410) · Long Bearish (6-monthly #1158/1410; yearly Neutral)
- Technical confluence: 18-signal score Neutral (-0.278), but blended technical score Bearish (-0.462) as AI rank remains weak (#1334/1410)
- Key levels: Support ~25.6450 · Resistance ~35.0900
- News sentiment bias: Neutral (avg 0.026; 88% neutral; instrument-specific matches not found)
- Confirmation / invalidation: A sustained move above 35.0900 with volume supports continuation; a close below 25.6450 increases deterioration risk per the stated scenario framing.
KGNAI evaluates assets using large cross-sectional datasets built from millions of structured data points. Inputs incorporate fundamental metrics, technical structures, and systematically processed news sentiment. Statistical models, machine learning, and AI frameworks are used to assess relative positioning, signal alignment, and probabilistic behavior across broad universes.
- Ranks are comparative across the tracked universe, not absolute price targets.
- Confluence reflects alignment among independent signal groups.
- Support/resistance levels are probabilistic decision zones, not guarantees.
- Sentiment provides contextual bias within the broader analytical framework.
1) KGNAI AI Analysis
Region: EUROPE
Total universe size: 1410 ranked instruments
- Daily rank: #1384 out of 1410 — Bearish
- Weekly rank: #1076 out of 1410 — Neutral
- Monthly rank: #1403 out of 1410 — Bearish
- 3-Monthly rank: #1264 out of 1410 — Bearish
- 6-Monthly rank: #1158 out of 1410 — Bearish
- Yearly rank: #1126 out of 1410 — Neutral
Cross-sectionally, JSW.WAR sits in the bottom tail of the tracked universe on most horizons, with the daily (#1384) and monthly (#1403) ranks indicating persistently weak relative behavior. The weekly and yearly readings shift to Neutral (#1076 and #1126), which is more consistent with stabilization risk than with a trend reversal: the asset may be less directionally extreme on those windows, but it remains far from upper-quartile strength.
The time-structure matters. The intermediate ranks—3-monthly #1264 and 6-monthly #1158—keep the distribution skewed bearish, implying that the weakness is not confined to a brief drawdown. Instead, the model’s relative tests are capturing a longer regime where downside behavior (or underperformance versus peers) dominates. In this framing, the Neutral weekly/yearly reads are better interpreted as signal dispersion across horizons rather than confirmation of improvement.
KGNAI ranks are probabilistic: higher rank numbers reflect weaker conditions in the framework rather than deterministic outcomes. Here, the concentration of high (weak) ranks across multiple windows aligns with the stated term view—Short-term: Bearish; Mid-term: Bearish; Long-term: Bearish—and sets a demanding bar for any technical recovery to become “rank-valid,” i.e., to translate into improved relative positioning against the 1,410-instrument universe.
Term view: Short-term: Bearish. Mid-term: Bearish. Long-term: Bearish.
Want the full universe and complete rank tables? Unlock full access on KGNAI: https://www.kgnai.com/pricing
2) Price & trend overview
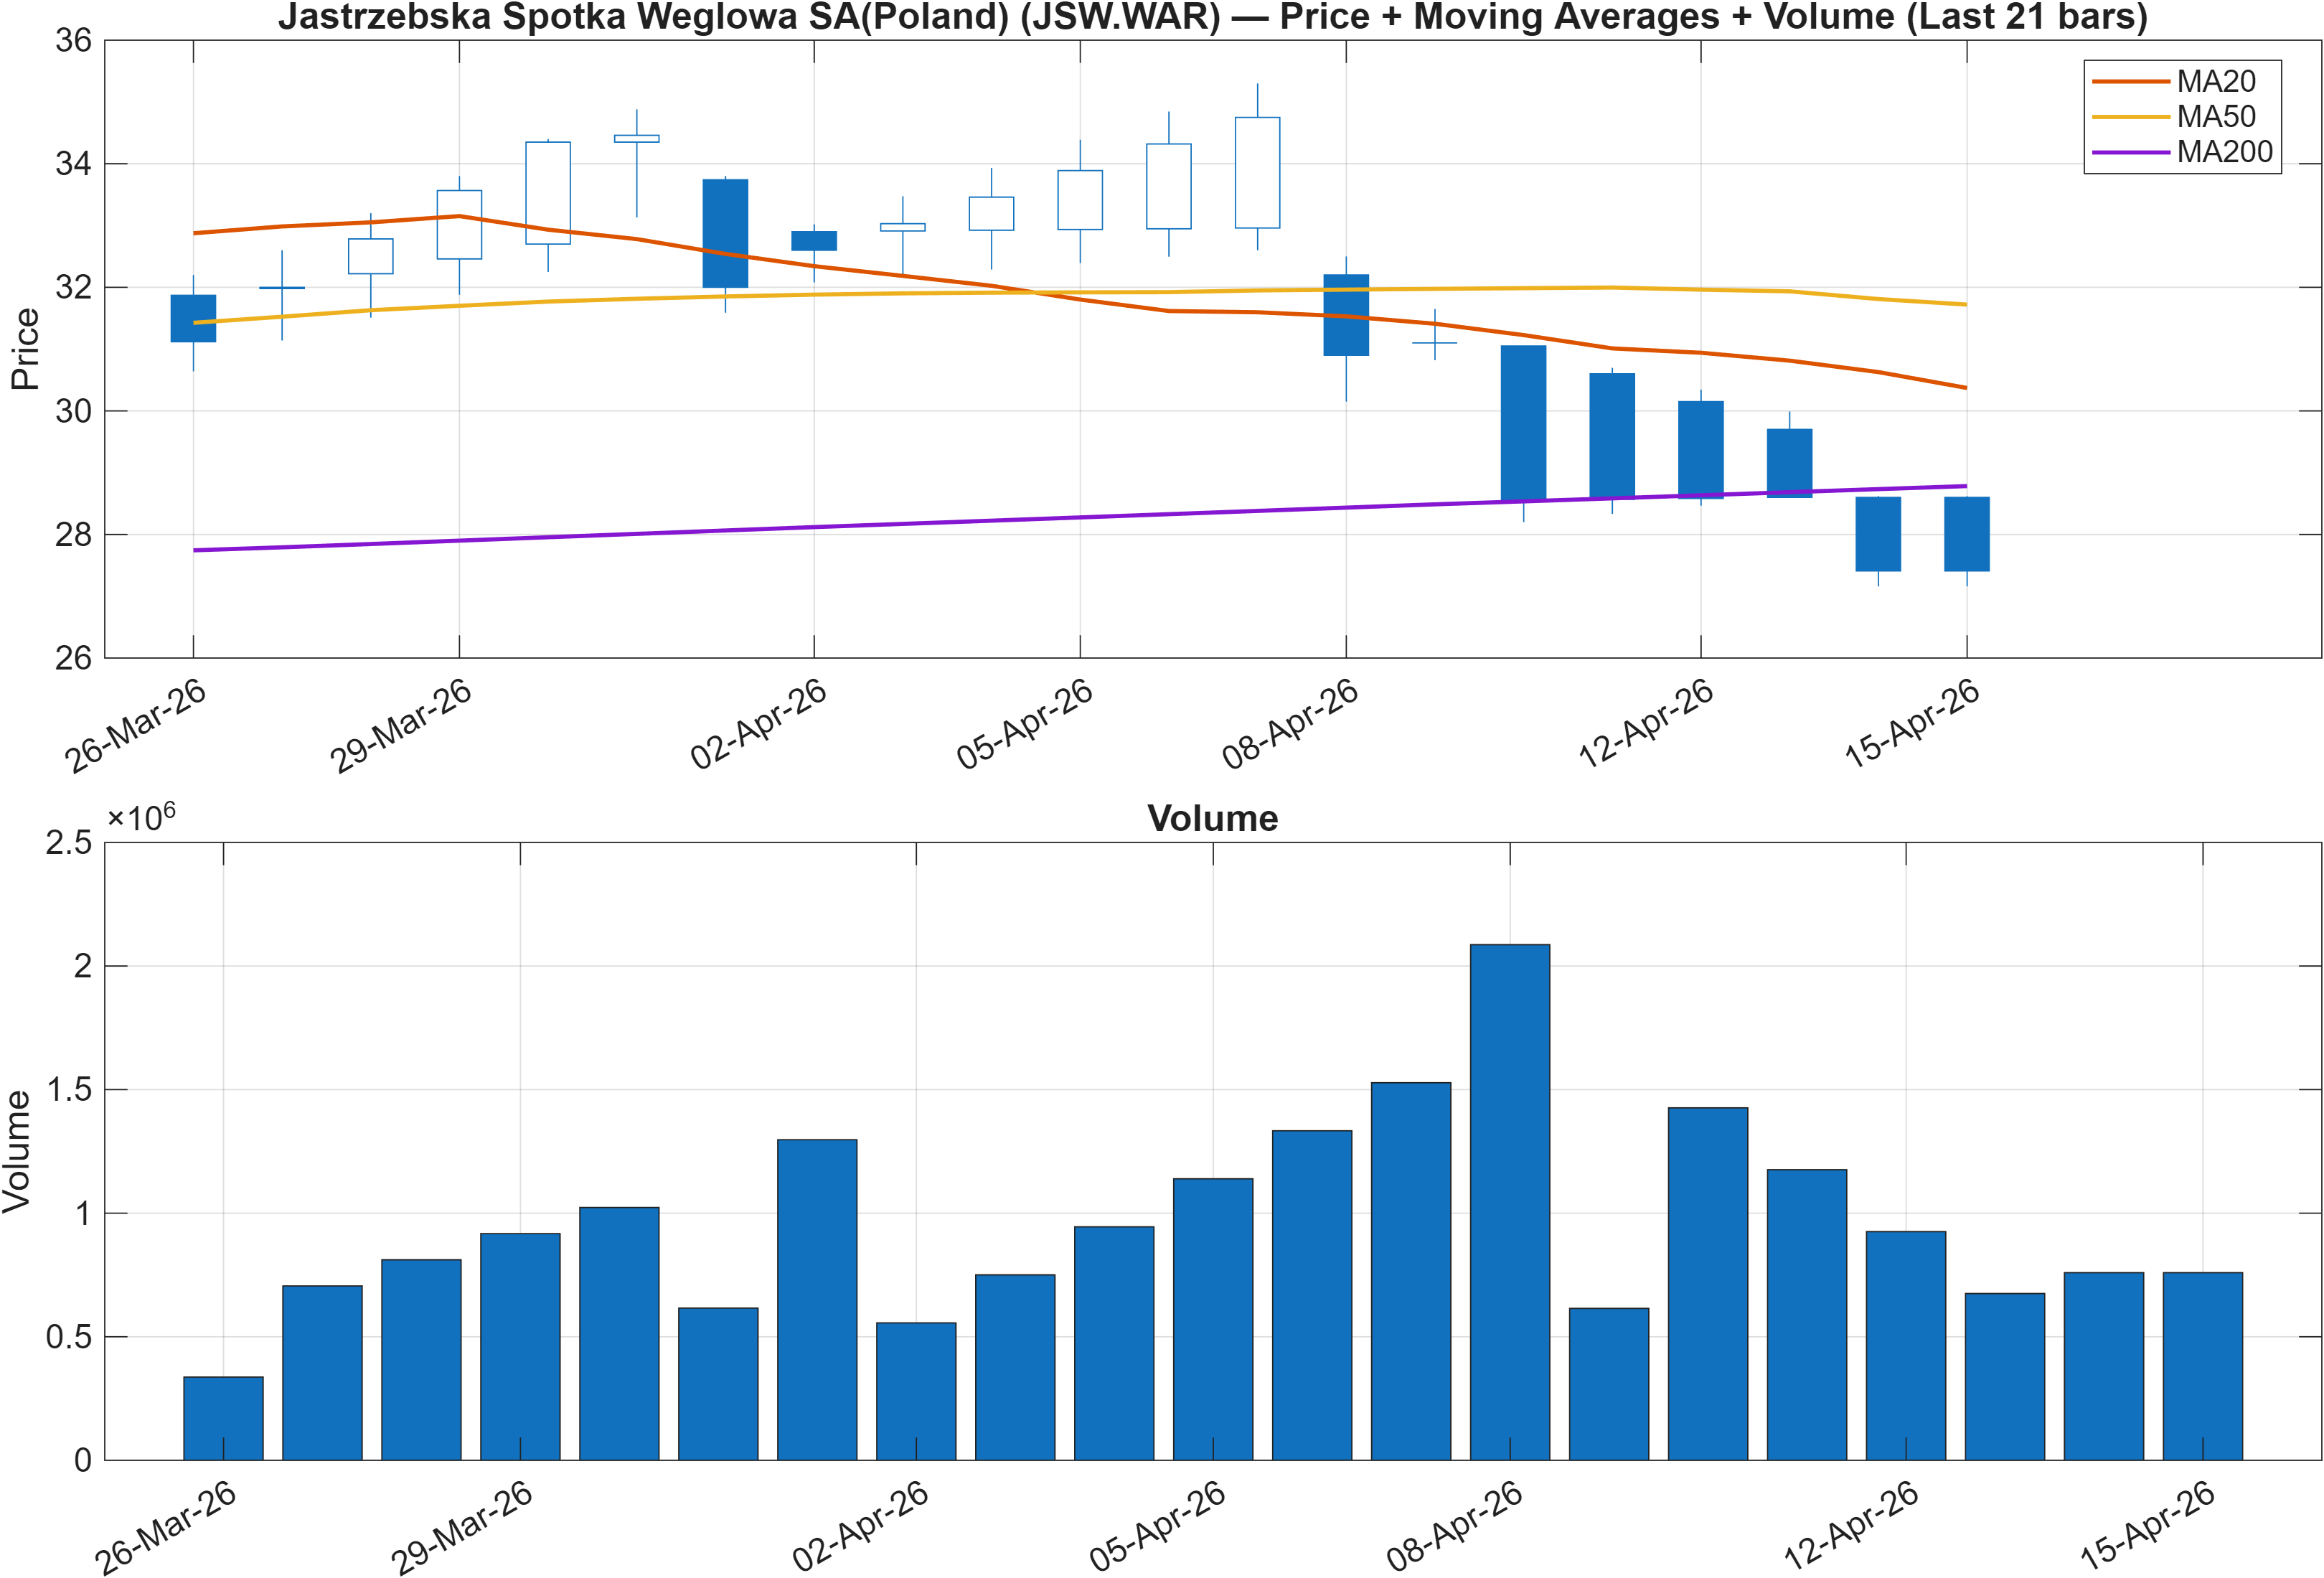
Interpretation: Close vs MA50 = Bearish, MA50 vs MA200 = Bullish.
The moving-average configuration is split, which often reflects a market in transition rather than a clean trend state. The close being below the MA50 (Bearish) indicates near-term pressure and weak tactical momentum, while MA50 above MA200 (Bullish) suggests the longer baseline has not fully rolled over. When these two conditions coexist, the analytical question becomes whether the pullback is a mean-reversion phase within a still-intact longer structure, or whether it is the early stage of a deeper regime shift.
In JSW.WAR’s case, the broader KGNAI rank profile reinforces the second interpretation: extreme weakness in the daily (#1384) and monthly (#1403) ranks increases the probability that the “close vs MA50” weakness is not merely noise. The market is, at minimum, failing to sustain price above the intermediate trend proxy. This aligns with later momentum readings (e.g., RSI(14) 28.33) that often coincide with stressed tape conditions.
From a market-structure perspective, the MA split also implies that rallies toward the MA50 can act as dynamic supply until the close can reclaim and hold it. Conversely, the longer MA condition (MA50 vs MA200 = bullish) argues against treating every bounce as reflexively bearish without confirmation: the setup can produce sharp countertrend moves, especially if volatility expands from a compressed state. That said, the subsequent volatility and signal blend (overall technical score -0.462) indicates that JSW.WAR has not yet earned a “trend repair” classification in the model’s standardized framework.
3) Momentum & volatility dashboard
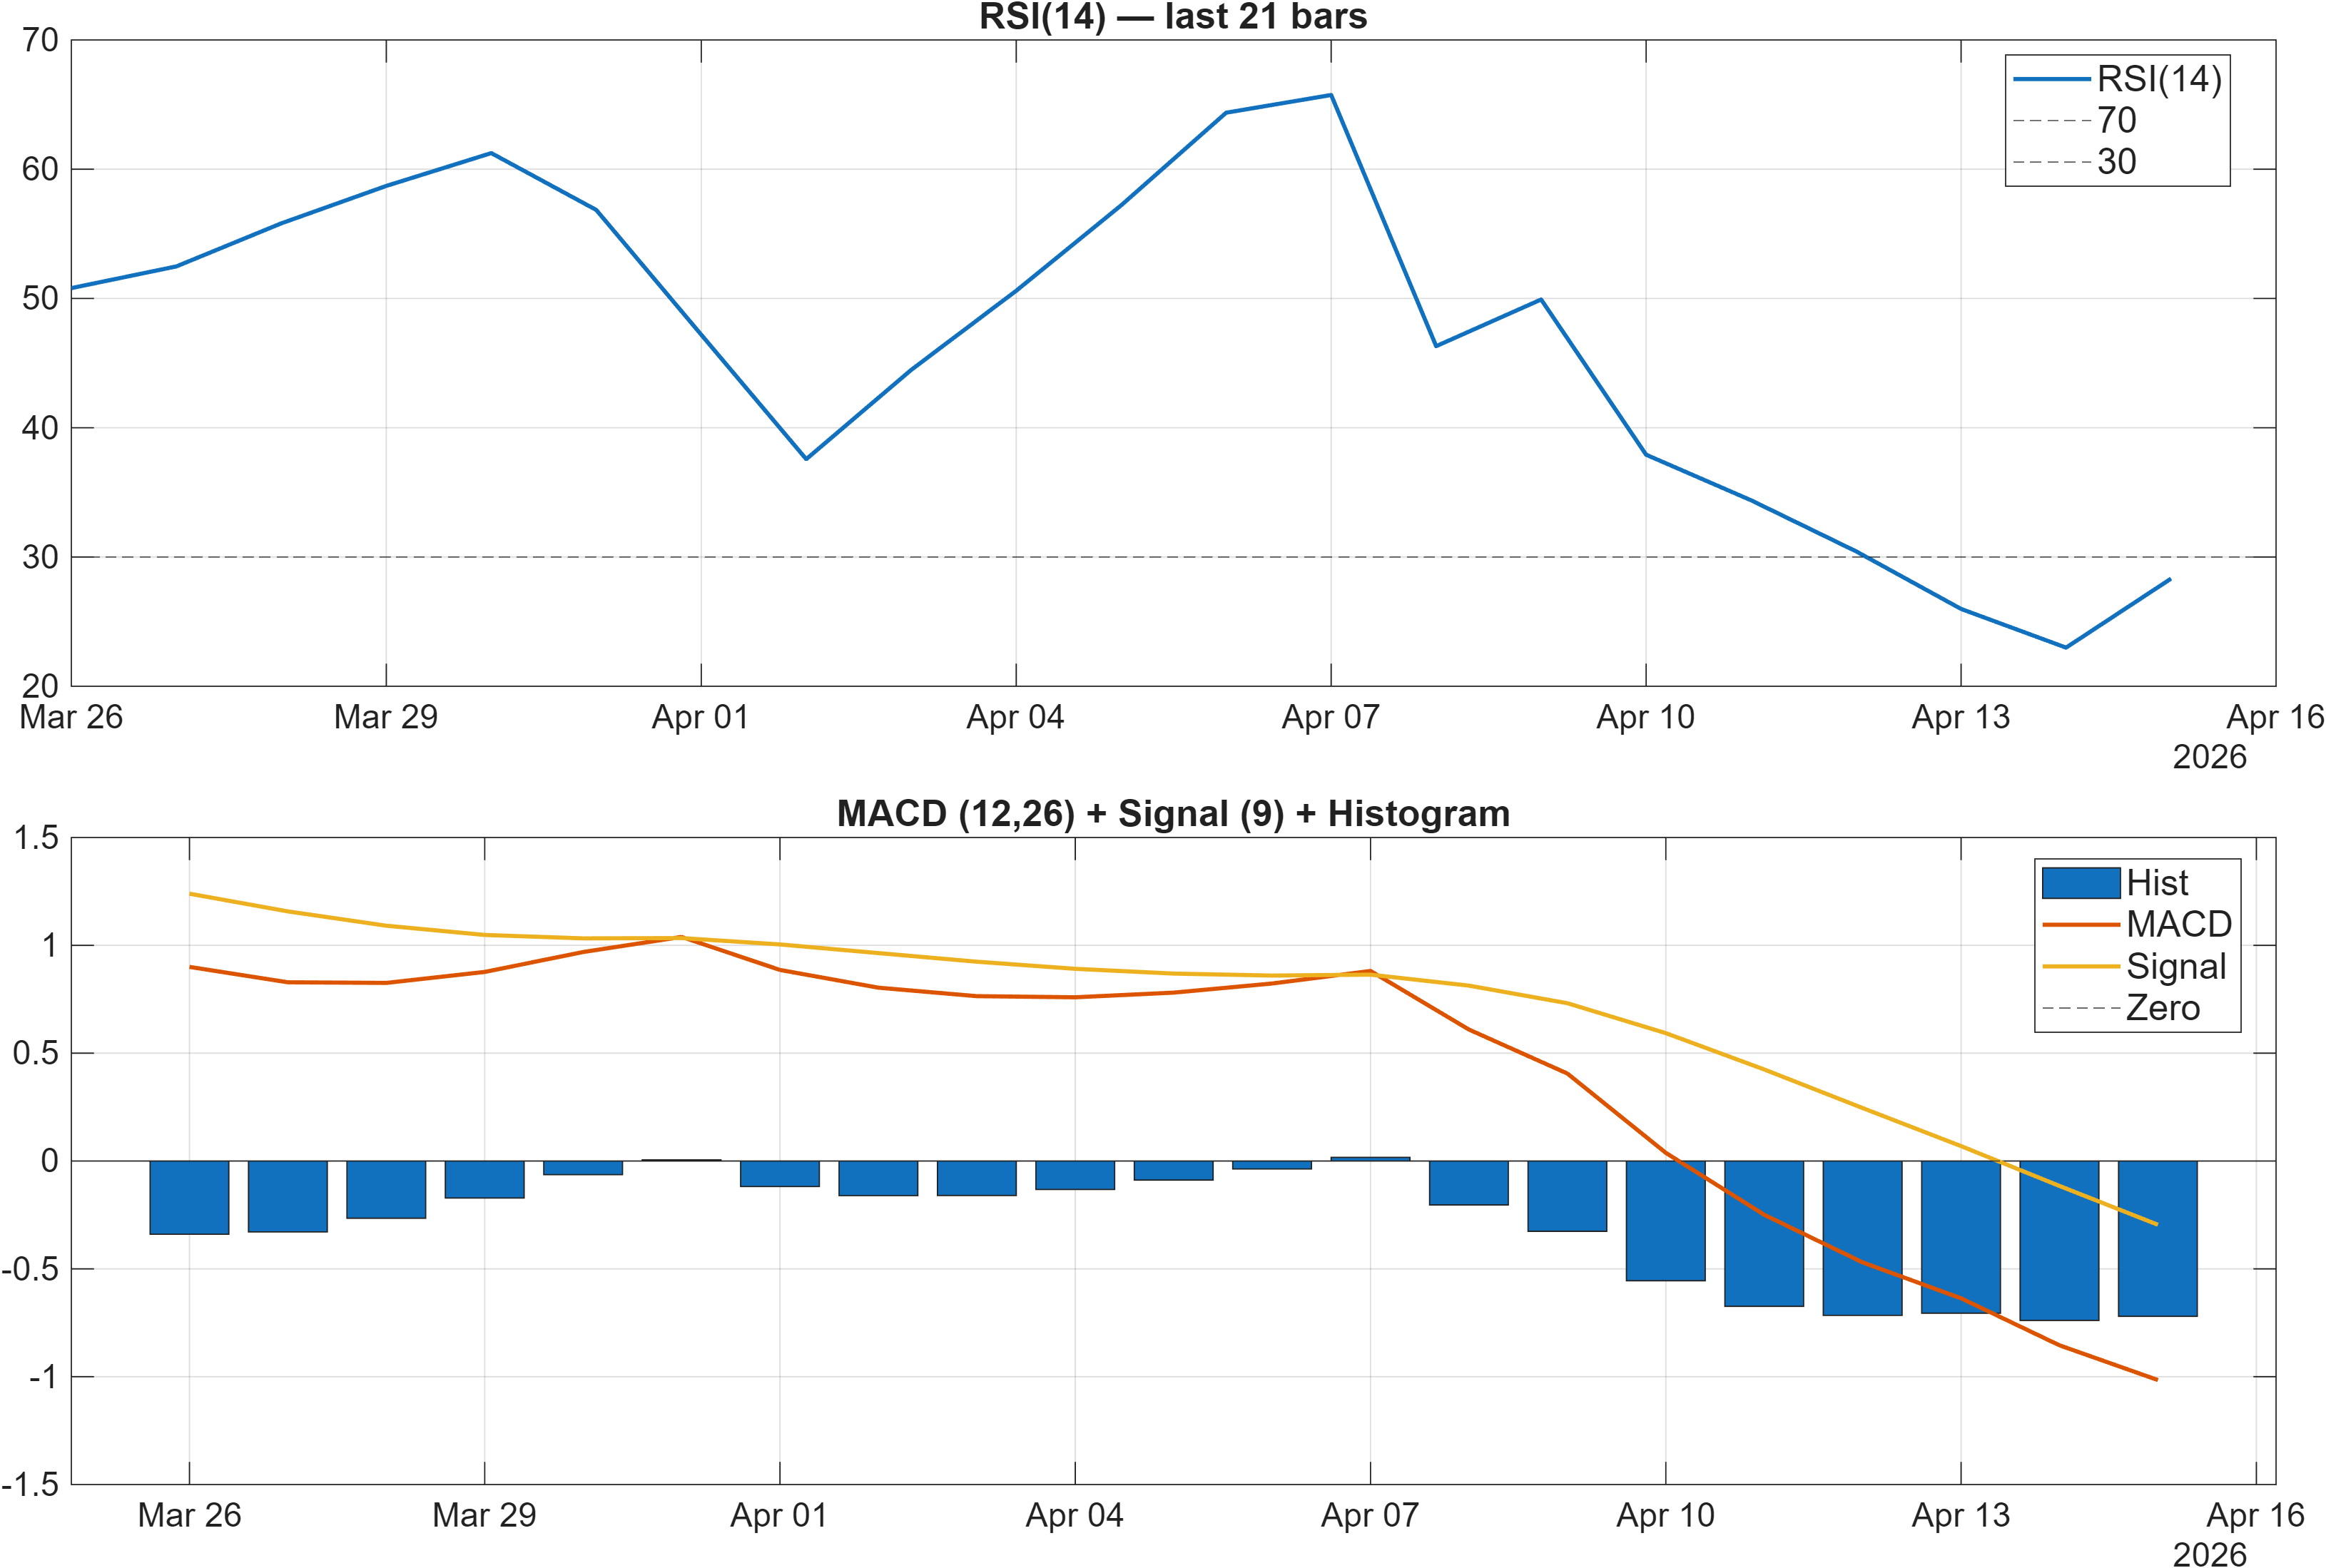
Interpretation: RSI bias = Bearish, MACD hist = -0.7200.
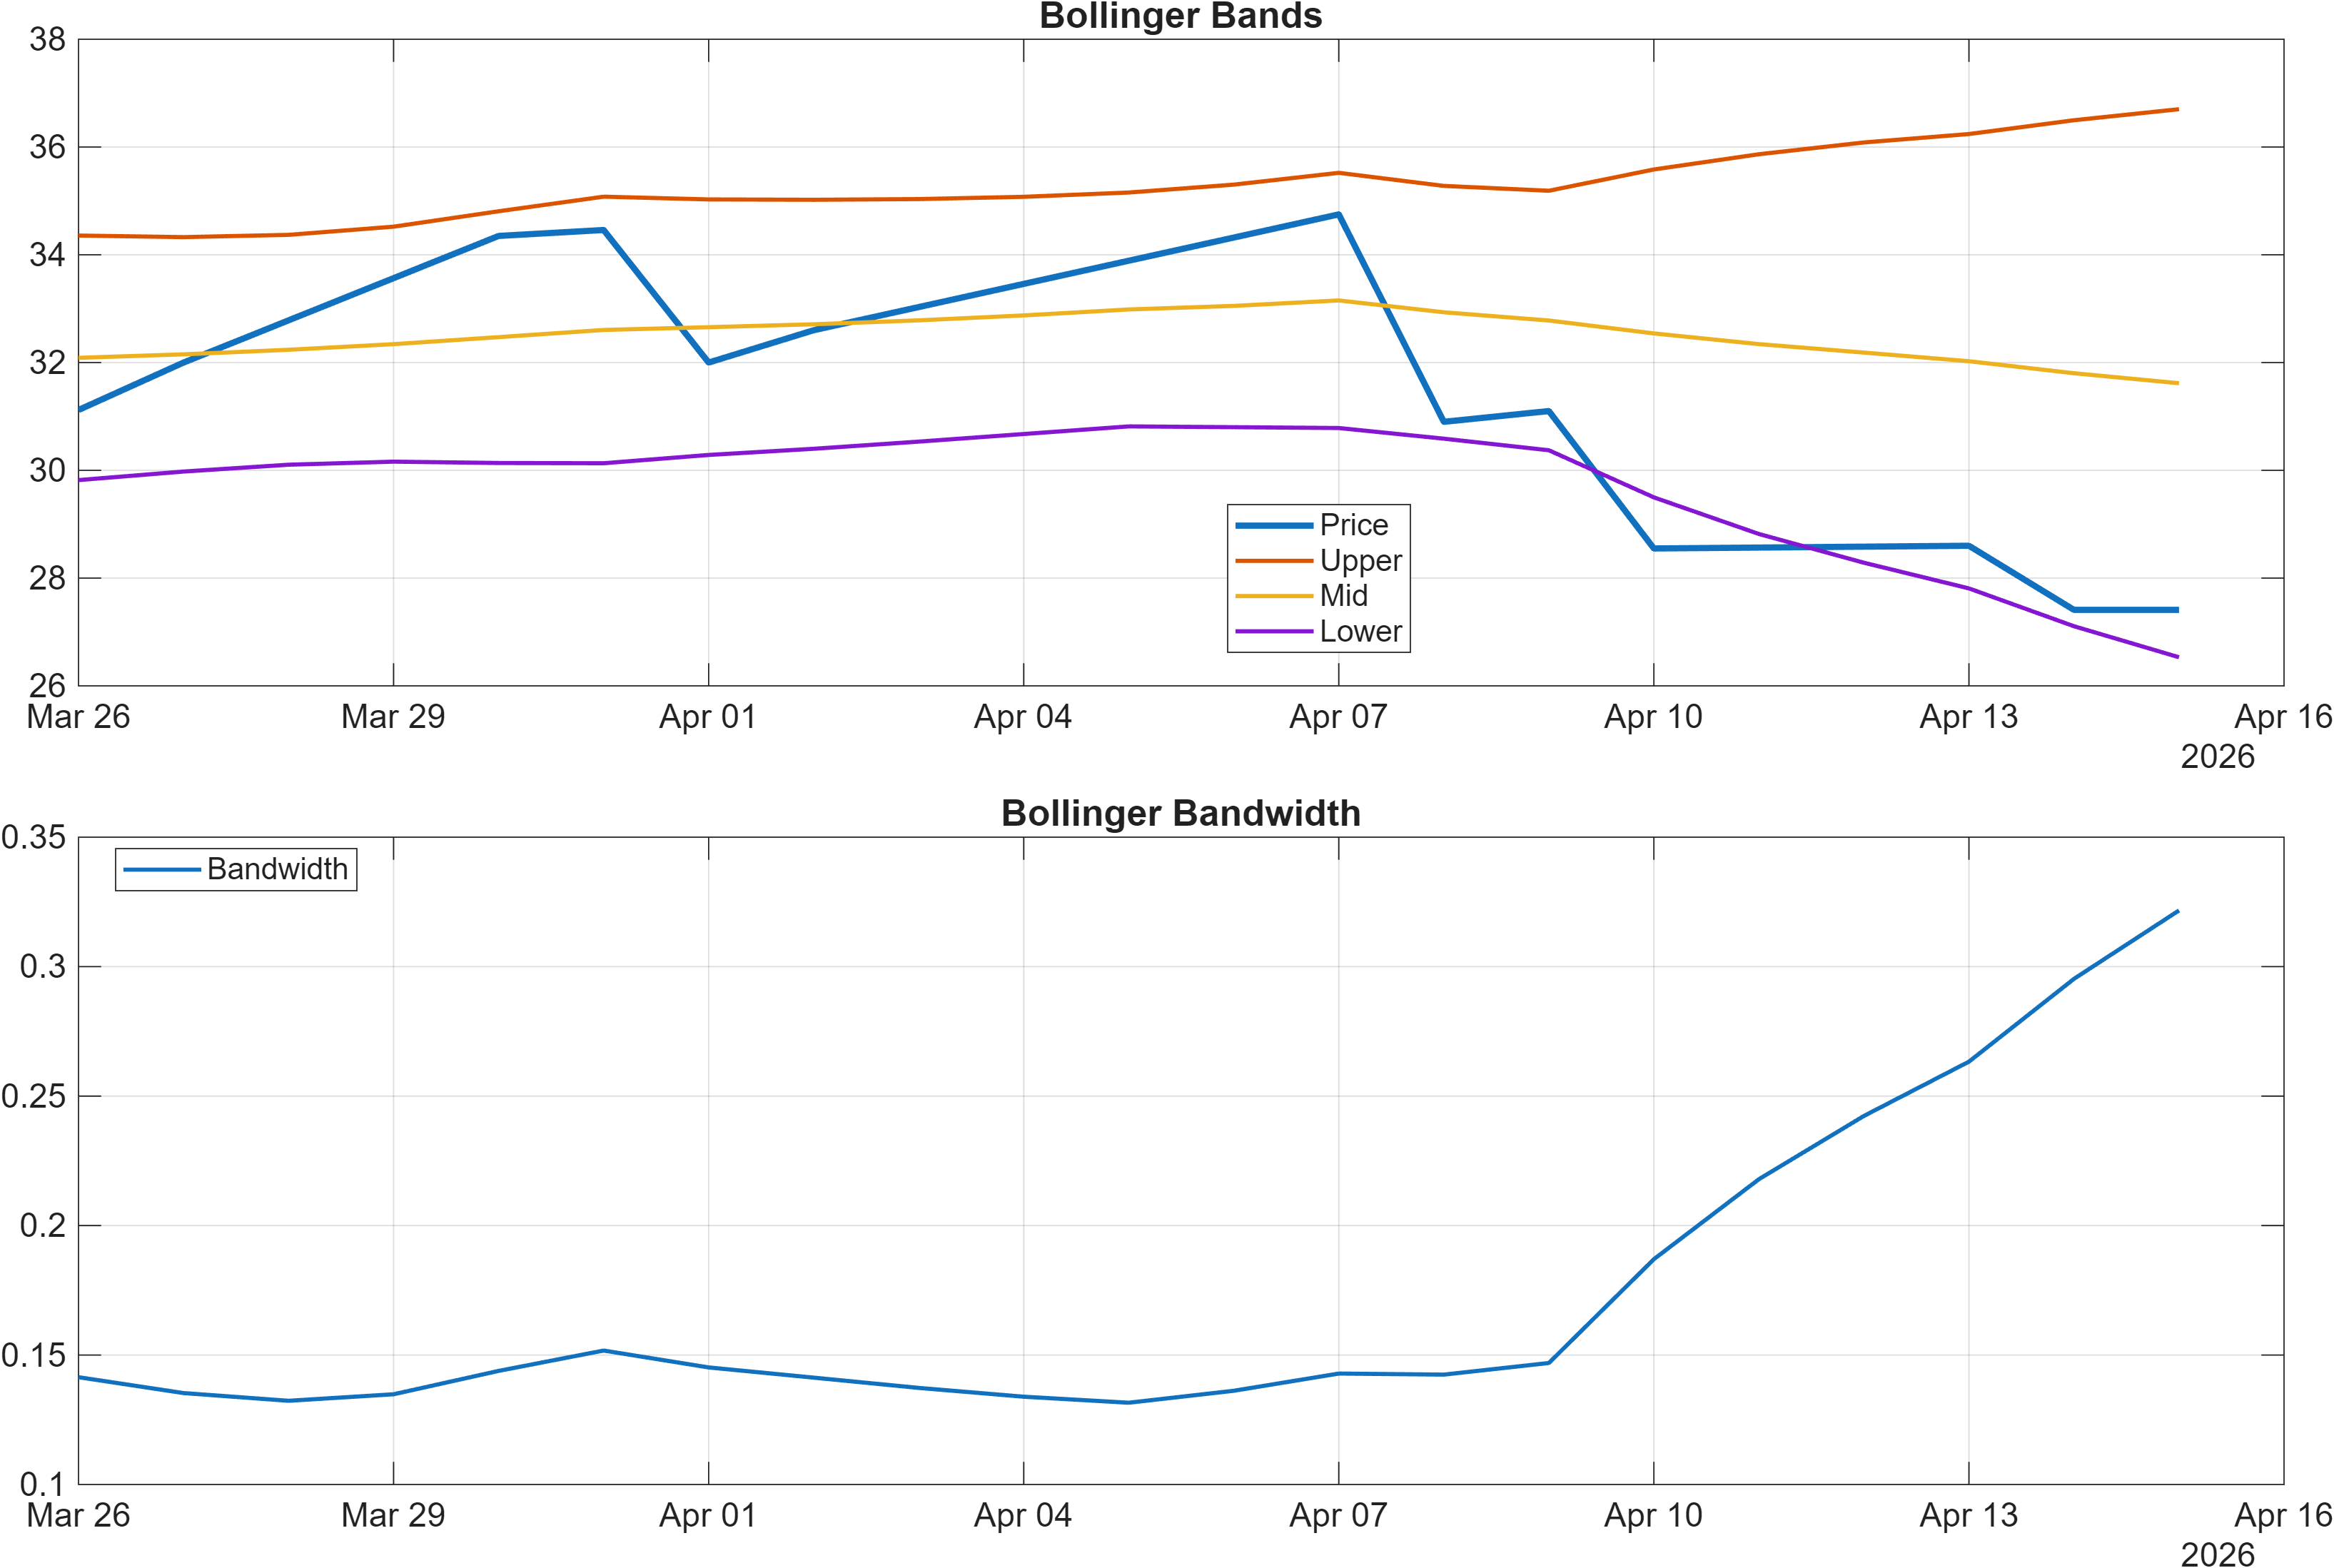
Interpretation: Bandwidth (volatility regime) latest = 0.3217.
Momentum signals lean risk-off. The RSI(14) at 28.33 sits in a typically oversold zone, but within a probabilistic framework that is not automatically bullish—oversold can persist in downtrends. The MACD histogram at -0.7200 reinforces that downside momentum remains dominant, implying that any bounce attempts still face a negative impulse backdrop.
The more informative layer is the alignment (or lack thereof) between momentum stress and volatility regime. Bollinger bandwidth at 0.3217 reads as neither an extreme contraction nor an obvious blowout in the provided context; the key is that momentum is bearish while volatility is not presenting an unambiguous capitulation signature. In such cases, selling pressure can remain “orderly,” and recovery often requires confirmation through trend metrics (e.g., reclaiming intermediate moving averages) rather than expecting volatility-driven snapbacks.
Cross-checking with the 18-signal panel supports this: ROC(20) at -14.34 and TS Mom(20) at -4.59 are consistent with a drawdown phase, while the very low Stoch %K at 3.071 prints as a localized bullish/mean-reversion flag. That mix is a classic example of signal divergence: oscillators can turn first, but trend-following momentum (MACD/ROC) often governs whether those turns become sustained.
Practically, the model’s stance is that momentum is weak enough to warrant caution, and volatility is not (yet) providing a strong “reset” cue. Confirmation would typically be sought via price behavior around defined decision zones and a measurable improvement in rank/technical blend rather than by oscillator readings alone.
4) Support / Resistance zones
Support ~ 25.6450 | Resistance ~ 35.0900
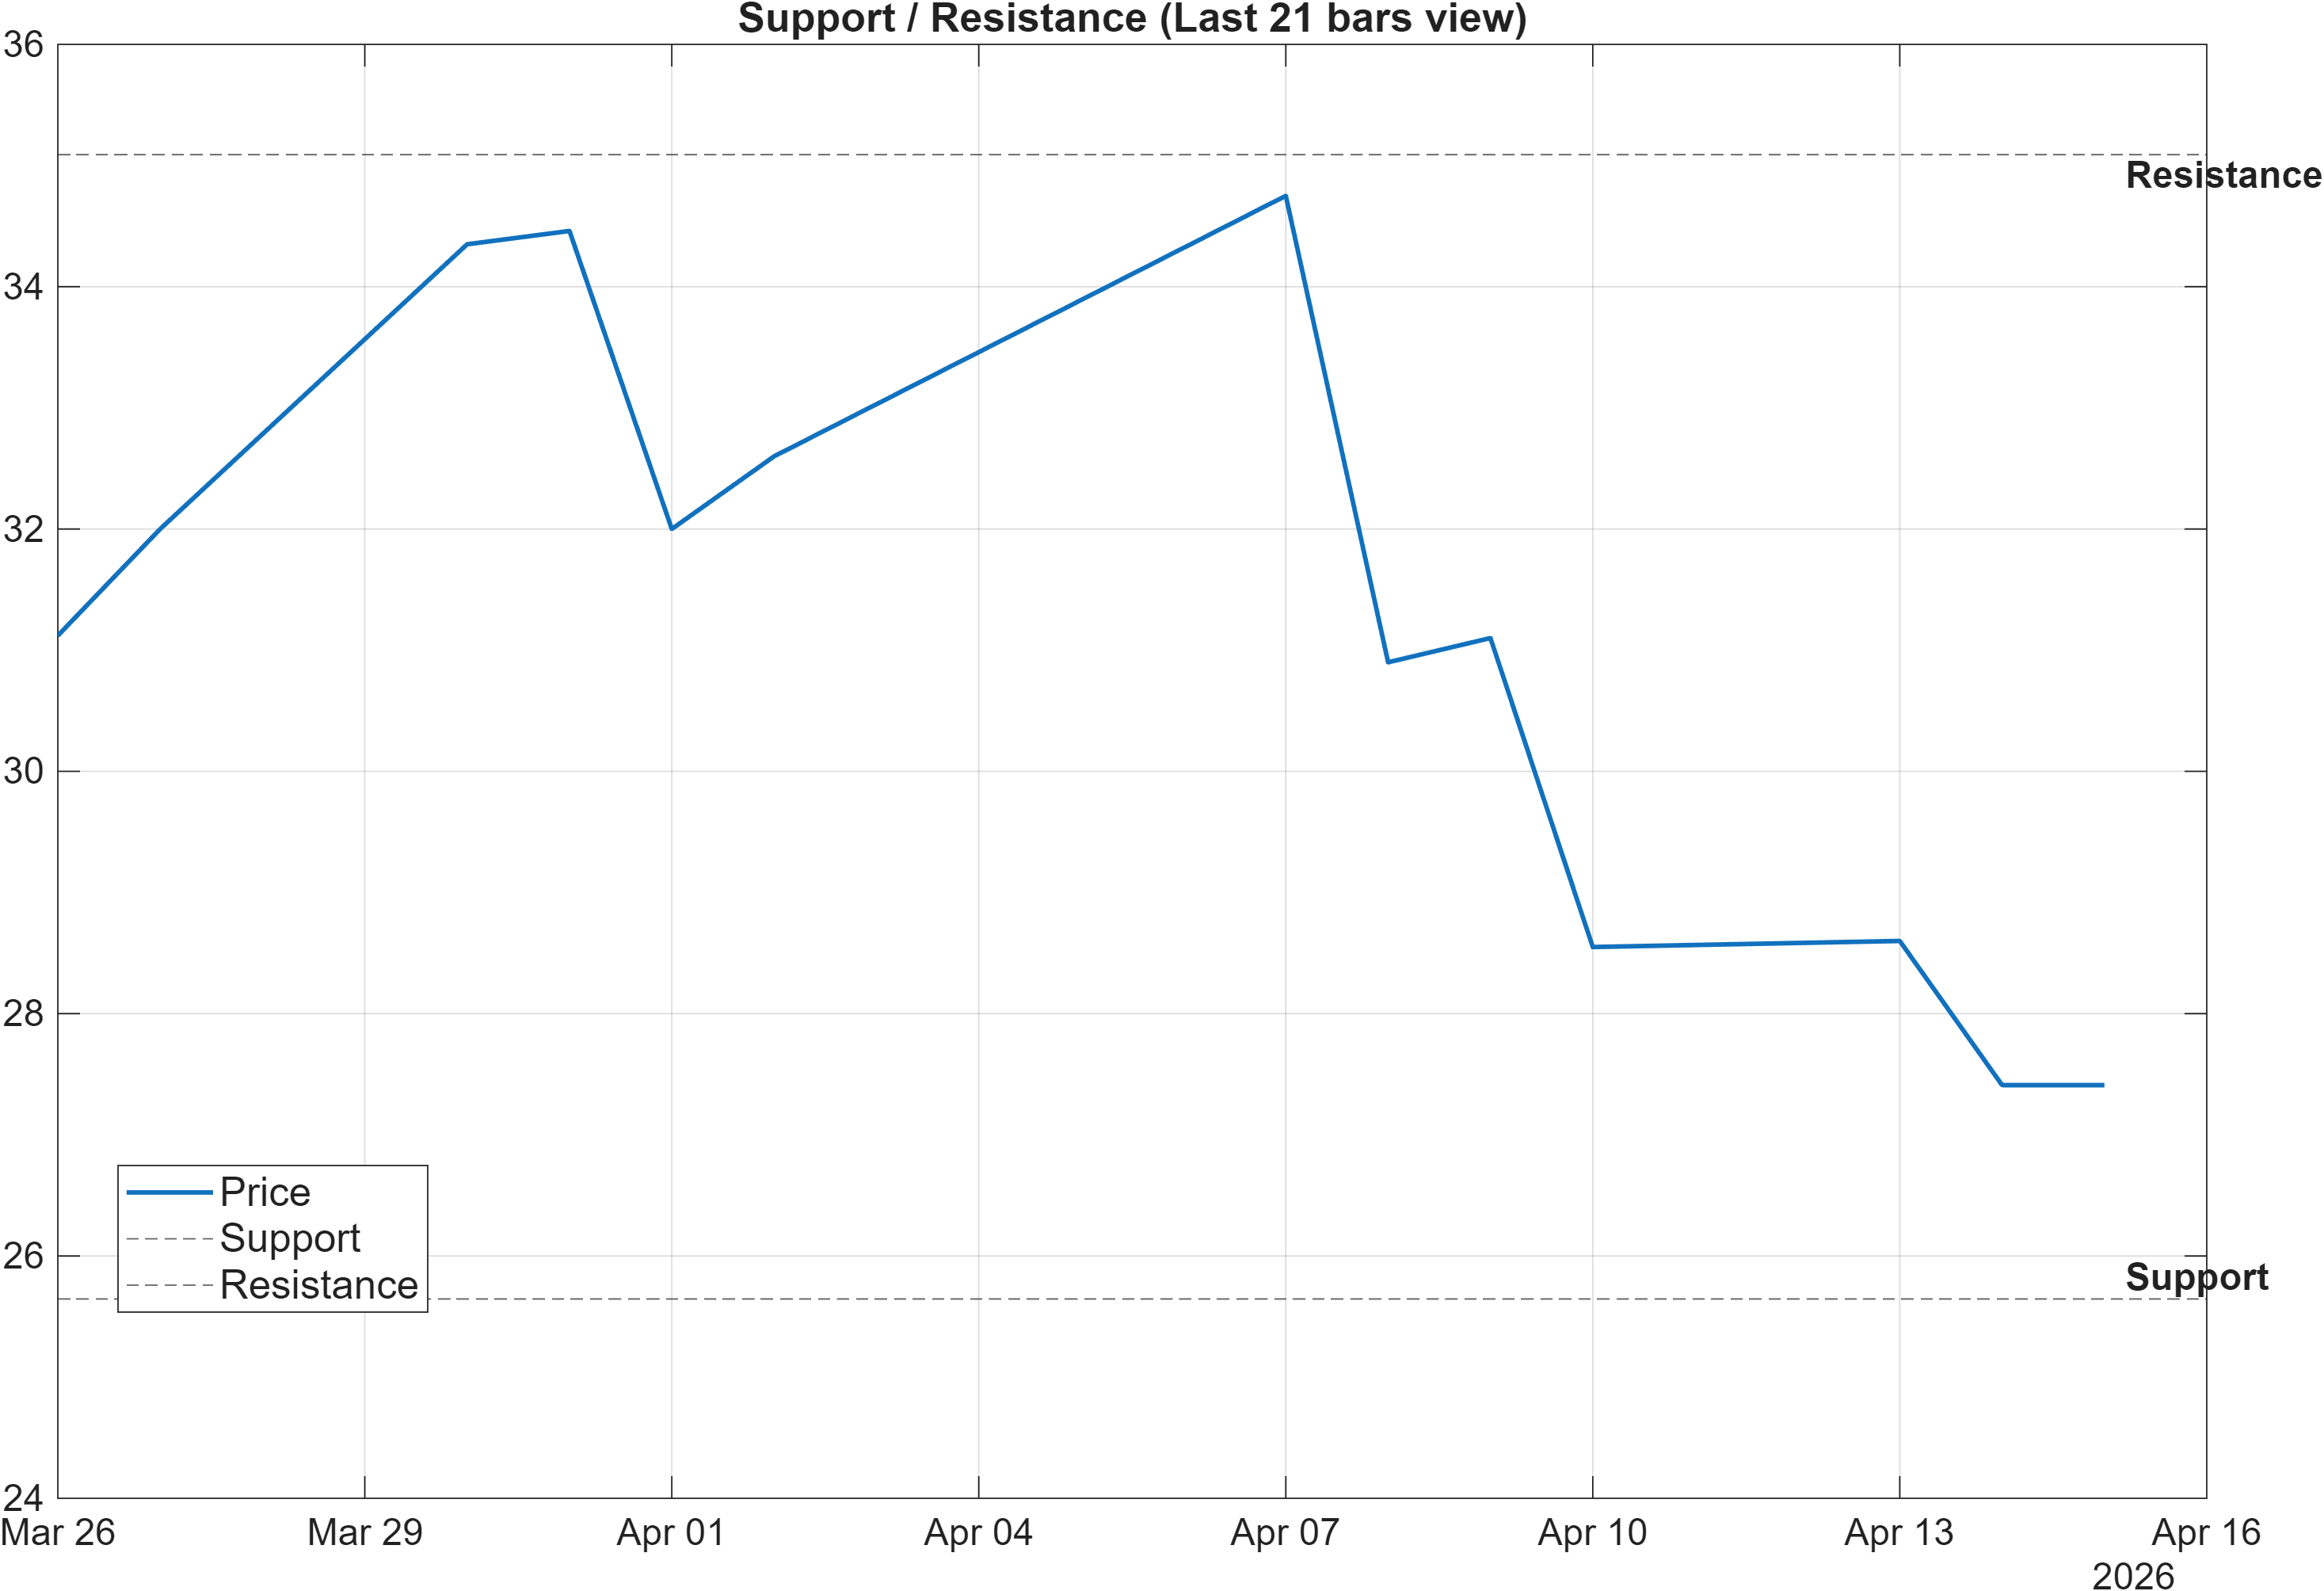
Scenario view: Break above resistance with volume → continuation. Close below support → signal deterioration risk.
The level map is tight and decision-oriented: 25.6450 acts as the primary support reference, while 35.0900 defines the overhead resistance that must be reclaimed to change the market’s tactical posture. With momentum already bearish (RSI 28.33, MACD histogram -0.7200), the support level becomes more than a line—it becomes the zone where bearish continuation can be validated or where stabilization can begin to form.
Two regime paths are implied by the scenario language. First, a close below 25.6450 would be consistent with deterioration risk, because it would add price-based confirmation to already weak ranks (e.g., daily #1384, monthly #1403) and a bearish blended technical score (-0.462). In a probabilistic sense, that alignment across rank, momentum, and levels tends to reduce the need for interpretive flexibility: the framework would treat breaks as higher-confidence weakness rather than isolated noise.
Second, a break above 35.0900 with volume is framed as continuation. Within this report’s context, that would also function as a stress test of the bearish signal stack: for a resistance break to carry analytical weight, it would ideally be accompanied by improvement in intermediate momentum measures (MACD histogram moving toward zero; RSI exiting the bearish zone) and, over time, less punitive ranks. Without those corroborations, resistance breaks can fail back into the range—particularly when the longer-term rank stack remains weak.
Net: these levels are best viewed as decision zones that help separate short-lived mean reversion from a more durable trend repair, especially given the current divergence between a Neutral 18-signal confluence and a Bearish AI technical rank.
5) Quant Technical Dashboard (18 Signals)
KGNAI AI Technical Analysis Score (Deep Reinforcement Learning): Rank #1334 out of 1410 (Rank 1 represents the strongest technical positioning and a higher probability of favorable price behavior. As ranks increase toward the maximum, the probability of favorable outcomes weakens and bearish positioning becomes more dominant.) | Label: Bearish | Score: -0.892
18-Signal Technical Confluence Score: -0.278 (Neutral)
Overall Technical Score (18-signal confluence + DRL rank blend): -0.462 (Bearish)
Note: The blended score reflects signal strength weighted against broader AI technical ranking, which may temporarily diverge.
Blended technical score breakdown: -0.462 (Bearish | Bull 5 / Bear 10 / Neutral 3)
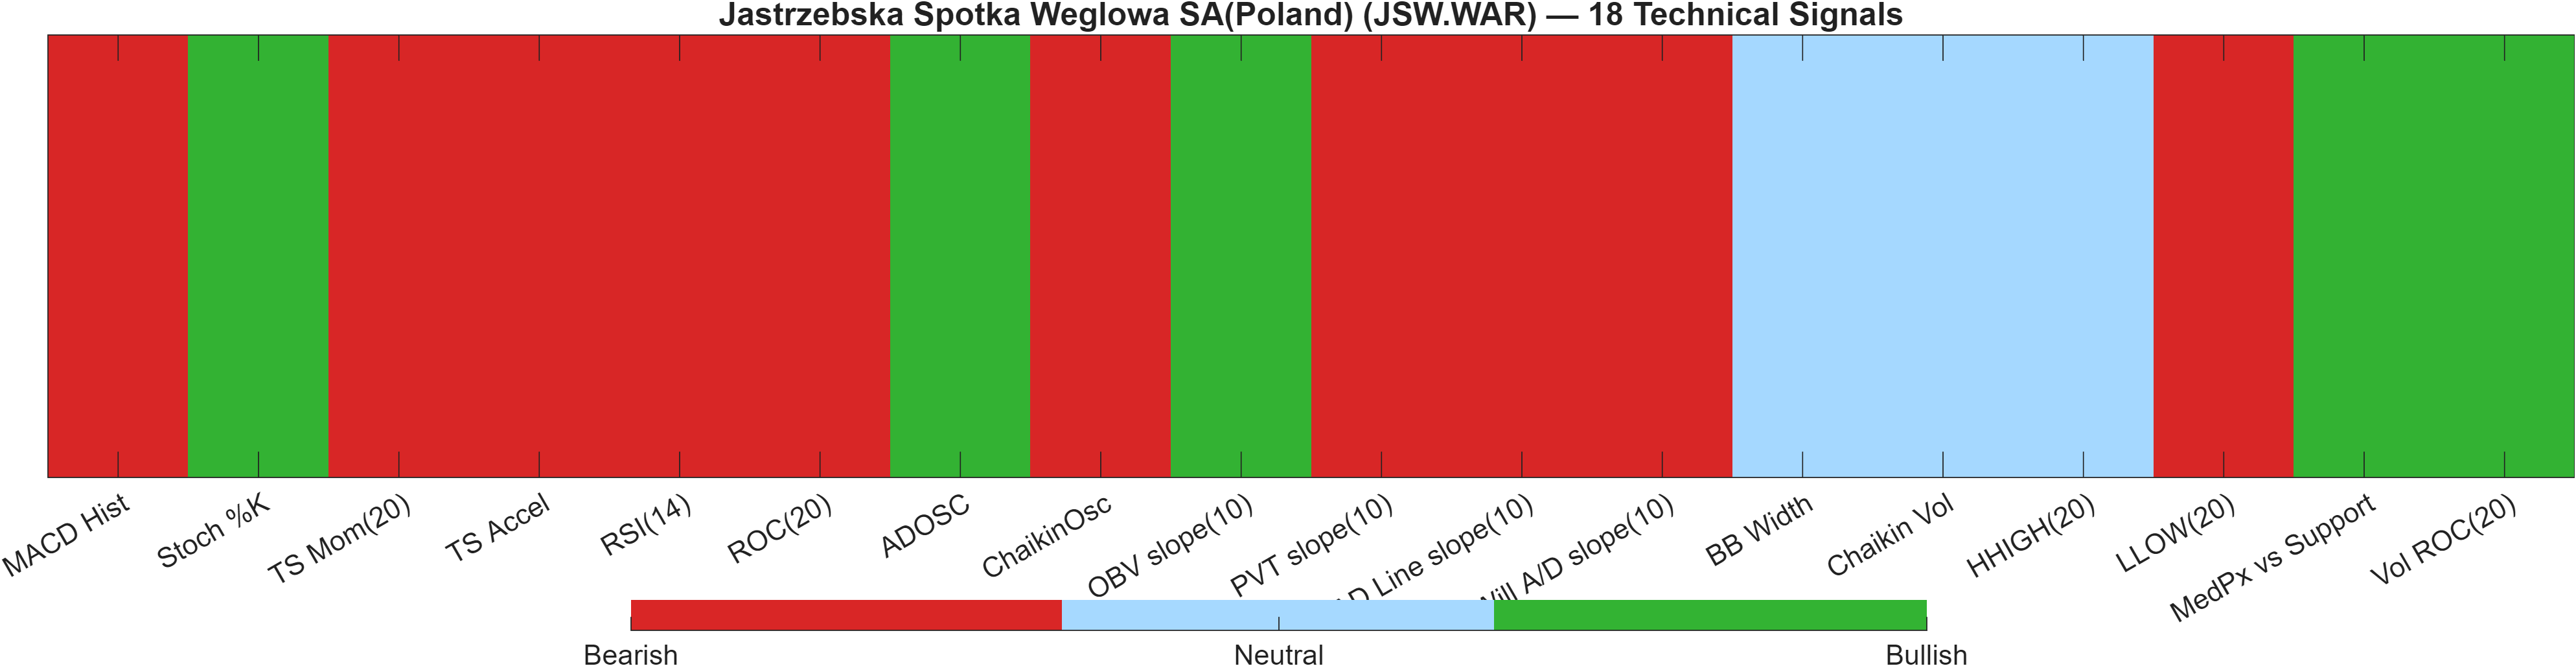
Signal interpretation: why “Neutral” confluence still resolves Bearish
| Indicator | Value | Signal |
|---|---|---|
| MACD Hist | -0.72 | Bearish |
| Stoch %K | 3.071 | Bullish |
| TS Mom(20) | -4.59 | Bearish |
| TS Accel | -5.497 | Bearish |
| RSI(14) | 28.33 | Bearish |
| ROC(20) | -14.34 | Bearish |
| ADOSC | 9.247 | Bullish |
| ChaikinOsc | -1.412e+06 | Bearish |
| OBV slope(10) | 1.98e+06 | Bullish |
| PVT slope(10) | -3.38e+05 | Bearish |
| AD Line slope(10) | -3.814e+06 | Bearish |
| Will A/D slope(10) | -2.989 | Bearish |
| BB Width | 0.3217 | Neutral |
| Chaikin Vol | -5.394 | Neutral |
| HHIGH(20) | 35.3 | Neutral |
| LLOW(20) | 27.16 | Bearish |
| MedPx vs Support | 2.245 | Bullish |
| Vol ROC(20) | 7.621 | Bullish |
Interpretation: Indicator-level signals form the base confluence, which is then adjusted using a separate AI-driven technical ranking model. The final technical score summarizes this combined view.
The 18-signal layer is mixed but negatively skewed: the confluence score of -0.278 lands Neutral, yet the distribution shows 10 Bear versus 5 Bull signals, with 3 Neutral. This is a “soft neutral”—not balanced, but not maximally bearish either. The bearish core is carried by momentum/trend components such as MACD histogram -0.72, RSI(14) 28.33, and ROC(20) -14.34, which collectively argue that downside pressure is still the dominant state variable.
The bullish offsets concentrate in accumulation/volume and short-horizon reversal cues: Stoch %K 3.071 flags a stretched condition, while OBV slope(10) 1.98e+06 and Vol ROC(20) 7.621 suggest episodic participation that can support bounces. However, some flow proxies remain adverse (e.g., AD Line slope(10) -3.814e+06 and ChaikinOsc -1.412e+06), implying that “buying interest” is not consistently broad-based across accumulation measures.
The decisive overlay is the AI technical model: DRL rank #1334/1410 with score -0.892 keeps the blended output at -0.462 (Bearish). In other words, even if indicator confluence is not fully bearish, the broader pattern-recognition layer still classifies the structure as weak relative to peers—consistent with the extreme cross-sectional ranks and the level-risk framework around 25.6450 support.
6) News sentiment + extractive gist
Note: Instrument-specific news matches were not found, so the digest includes broader market/sector headlines. Links are provided for verification.
Sentiment score (avg): 0.026 | Positive: 12% | Neutral: 88% | Negative: 0%
KGNAI AI News Sentiment Score (normalized -1 to +1): Not available (as of —) | Label: Not available | Overall news score: 0.03
Positive Developments
Recent coverage across major financial outlets has leaned mildly constructive in tone, but largely through macro and cross-asset narratives rather than JSW.WAR-specific catalysts. The aggregate news mix shows 12% positive against 0% negative, leaving the digest skewed toward benign framing even as technicals remain weak. Market commentary has highlighted areas of resilience in parts of global finance and risk appetite, which can indirectly support cyclicals via broader sentiment channels. However, within this report’s design, that positivity should be treated as context rather than a driver: the platform explicitly notes that instrument-specific matches were not found, and the normalized news sentiment score is Not available. As a result, any constructive inference must be filtered through price behavior at 35.0900 resistance and whether momentum (e.g., MACD histogram -0.7200) begins to improve.
Neutral / Mixed Developments
The dominant classification is neutral, with 88% of items labeled Neutral and an average sentiment score of 0.026—a configuration consistent with “headline flow without directional edge.” The key implication is that news is unlikely to provide a strong tailwind or headwind in the near term, increasing the weight of technical confirmation. In mixed regimes like this, markets often defer to levels and trend structure: JSW.WAR’s support at 25.6450 and resistance at 35.0900 become the practical filters for interpreting any broad macro developments. With the AI news sentiment score Not available, the disciplined approach is to treat news as background noise unless it becomes clearly reflected in volume behavior and cross-sectional rank improvement.
Negative / Risk Signals
While the dataset reports 0% negative in its classification, the broader thematic backdrop referenced in the digest contains event-risk motifs that can raise volatility across commodities and cyclicals without producing immediately “negative” sentiment labels. This matters because JSW.WAR’s technical posture is already fragile: the blended technical score is -0.462 (Bearish), and momentum readings such as RSI(14) 28.33 suggest the market is sensitive to shocks. In that setup, risk narratives can show up less as persistent negative sentiment and more as gap risk or failed rallies below resistance. The analytic priority is therefore not to infer negativity from the news score, but to monitor whether risk events coincide with a loss of 25.6450 support or renewed weakness in momentum/flow indicators.
- What to monitor next: Price response at 25.6450 (support integrity vs breakdown).
- What to monitor next: Reclaim attempts toward 35.0900 with confirming volume.
- What to monitor next: Momentum repair signals (MACD histogram moving toward zero; RSI exiting bearish bias).
Snapshot: AI Rank (Short–Mid–Long): Bearish (Bearish–Bearish–Bearish) · Technical Confluence: Neutral · Key Levels: Support ~25.65 | Resistance ~35.09 · News Sentiment: Neutral
Sources referenced: Reuters, Bloomberg, Yahoo Finance, MarketWatch, Investing.com
7) Sources
Not available in the provided data.
You may also like: How KGNAI AI ranks instruments across global markets
Disclaimer: KGNAI provides AI-generated analytics and educational market commentary only. This is not financial advice. Markets involve risk. Always do your own research.