
AGI Infra Ltd (AGIIL) Technical & Rank Update — 22-Mar-2026 | Bullish Short/Mid, Neutral Long
AGI Infra Ltd (AGIIL) is screening with a bullish short-to-mid-term rank profile inside a 1222-instrument India universe, while the longer-horizon signal set remains more reserved. The daily rank (#8) and monthly rank (#7) place the name in the top decile of the tracked universe, but the yearly rank (#396) sits closer to the middle of the distribution, consistent with a regime where recent strength has not fully translated into long-horizon dominance. Technically, the moving-average structure is constructive (close vs MA50 bullish; MA50 vs MA200 bullish), yet the broader confluence framework is more balanced: the 18-signal confluence score is 0.111 (Neutral) and the overall blended technical score is 0.284 (Neutral). Key levels frame the decision space with support ~238.4750 and resistance ~316.4000. News sentiment is mildly positive but largely neutral in composition (0.085 average; 63% neutral).
Key Takeaways
- Short / Mid / Long rank stance: Bullish / Bullish / Neutral (top-decile short-term ranks; longer-term closer to mid-pack).
- Technical confluence label: Neutral (18-signal confluence 0.111; blended score 0.284).
- Key levels: Support ~238.4750; Resistance ~316.4000.
- News sentiment bias: Neutral with mild positive tilt (avg 0.085; 31% positive; 63% neutral; 6% negative).
- Confirmation / invalidation condition: A break above 316.4000 with volume supports continuation; a close below 238.4750 increases deterioration risk.
What KGNAI Measures
KGNAI evaluates assets using large cross-sectional datasets built from millions of structured data points. Inputs incorporate fundamental metrics, technical structures, and systematically processed news sentiment. Statistical models, machine learning, and AI frameworks are used to assess relative positioning, signal alignment, and probabilistic behavior across broad universes.
How to Read This Report
- Ranks are comparative across the tracked universe, not absolute price targets.
- Confluence reflects alignment among independent signal groups.
- Support/resistance levels are probabilistic decision zones, not guarantees.
- Sentiment provides contextual bias within the broader analytical framework.
KGNAI Signal + Technical Snapshot + News Sentiment Digest
As of: 22-Mar-2026
Ticker: AGIIL
1) KGNAI AI Analysis
Region: INDIA
Total universe size: 1222 ranked instruments
- Daily rank: #8 out of 1222 — Bullish
- Weekly rank: #131 out of 1222 — Bullish
- Monthly rank: #7 out of 1222 — Bullish
- 3-Monthly rank: #54 out of 1222 — Bullish
- 6-Monthly rank: #8 out of 1222 — Bullish
- Yearly rank: #396 out of 1222 — Neutral
The rank stack shows front-end strength with a long-horizon holdout. Daily (#8) and monthly (#7) ranks sit in the top decile, while the 6-month rank (#8) confirms that this is not merely a one-week fluctuation. The 3-month rank (#54) remains in the upper quartile, indicating the bullish bias extends beyond very short horizons, but with slightly less intensity than the daily/monthly extremes.
The principal divergence is the yearly rank at #396, which reads Neutral. In regime terms, that combination typically fits an instrument that has improved materially in recent windows, while the full-cycle profile is still working through prior variability. This matters for sizing decisions and holding-period expectations: short-term rank leadership can persist, but the yearly neutrality increases the probability of higher dispersion around key levels rather than a linear trend.
Stated term view remains consistent with the distribution: Short-term Bullish, Mid-term Bullish, and Long-term Neutral. Within KGNAI’s framework, confirmation is sought from adjacent windows; here, the weekly rank (#131) supports the near-term signal without requiring the yearly window to agree. That makes level-based validation (Section 4) more relevant than relying on rank alone.
2) Price & trend overview
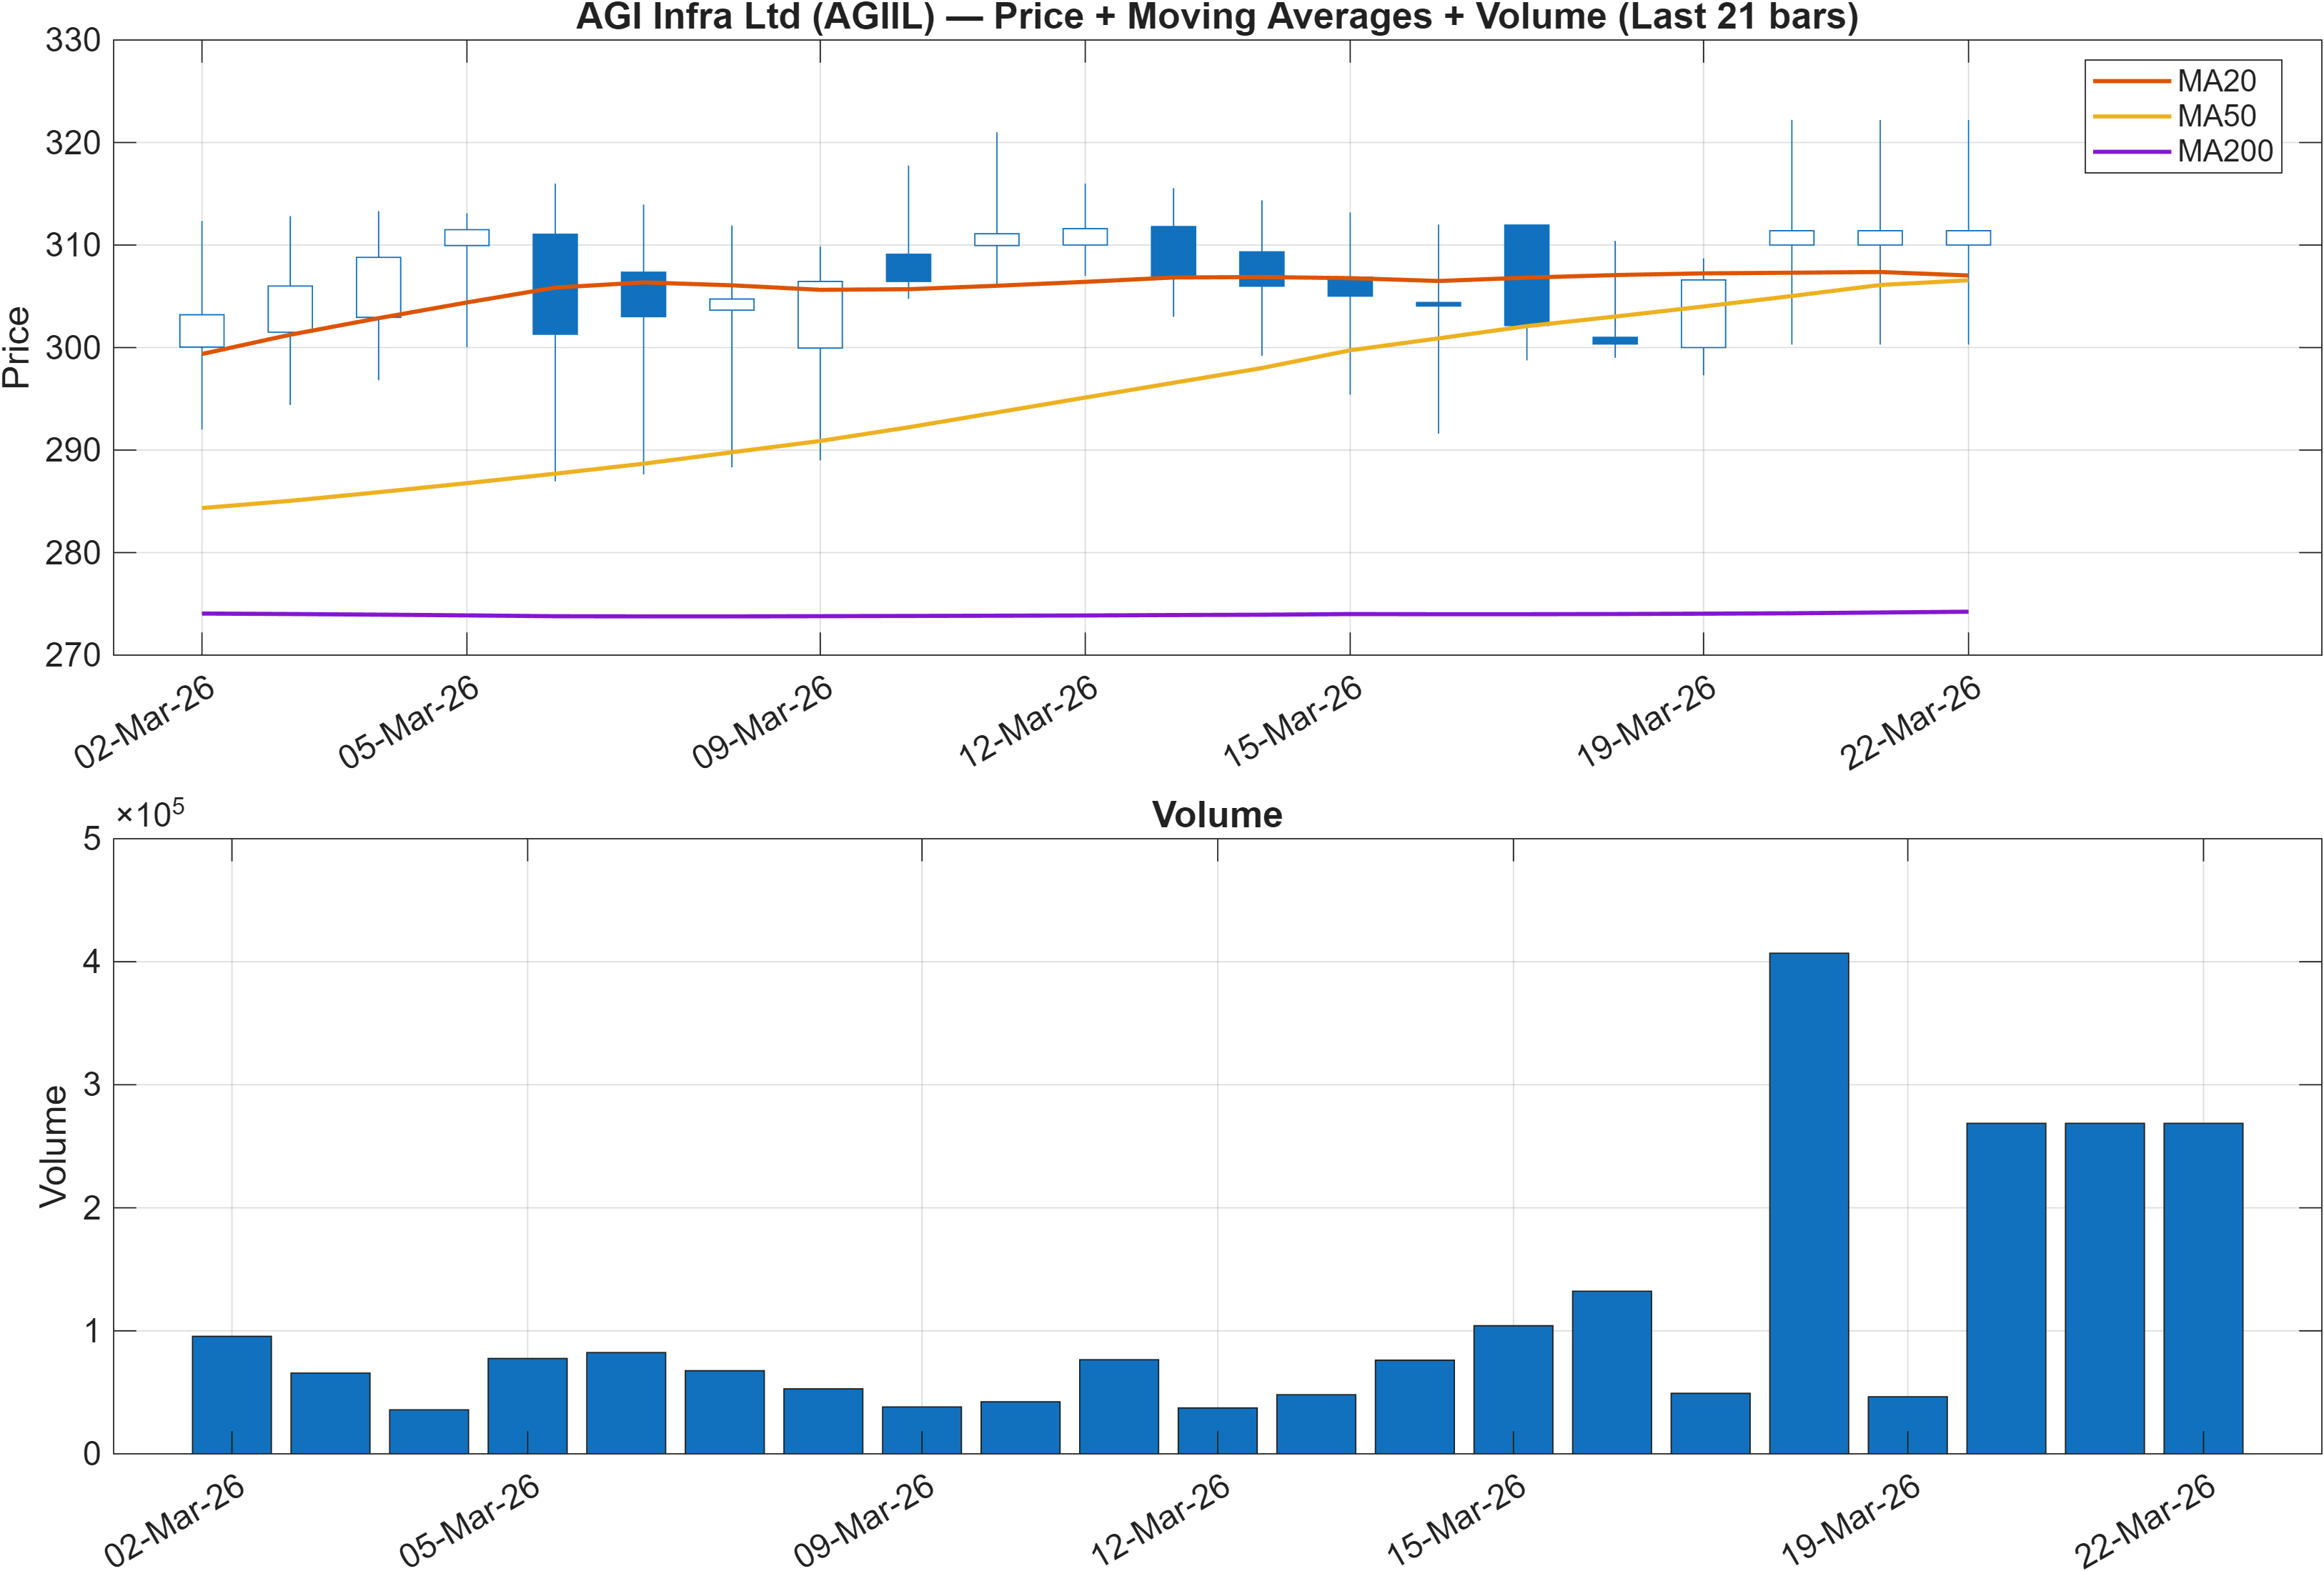
The trend model is currently built around a constructive moving-average configuration: close vs MA50 = Bullish and MA50 vs MA200 = Bullish. This typically reflects a market where intermediate demand is strong enough to keep price above its medium-term mean, while the medium-term mean itself is above the longer-term trend proxy.
Where this becomes analytically important is how it interacts with the score blend: despite a bullish MA structure, the overall blended technical score is 0.284 (Neutral) (Section 5). That combination often signals that the primary trend is intact, but the market is not offering uniformly supportive micro-signals (participation, thrust, and short-cycle momentum) at the same time. In practice, it shifts emphasis toward trend maintenance rather than trend acceleration.
The price structure should be interpreted through the lens of the nearby decision zones: support ~238.4750 and resistance ~316.4000. With a bullish MA backdrop, pullbacks that remain above the support band tend to keep the trend thesis viable, while failure through that zone would be more meaningful than a routine dip given the rank divergence versus the yearly window (#396).
Volume is best used as a qualifier rather than a standalone signal in this report. The scenario statement in Section 4 explicitly conditions continuation on a break above resistance with volume, aligning a price-based trigger with evidence of participation—useful when other signals (e.g., MACD histogram) are not fully aligned.
3) Momentum & volatility dashboard
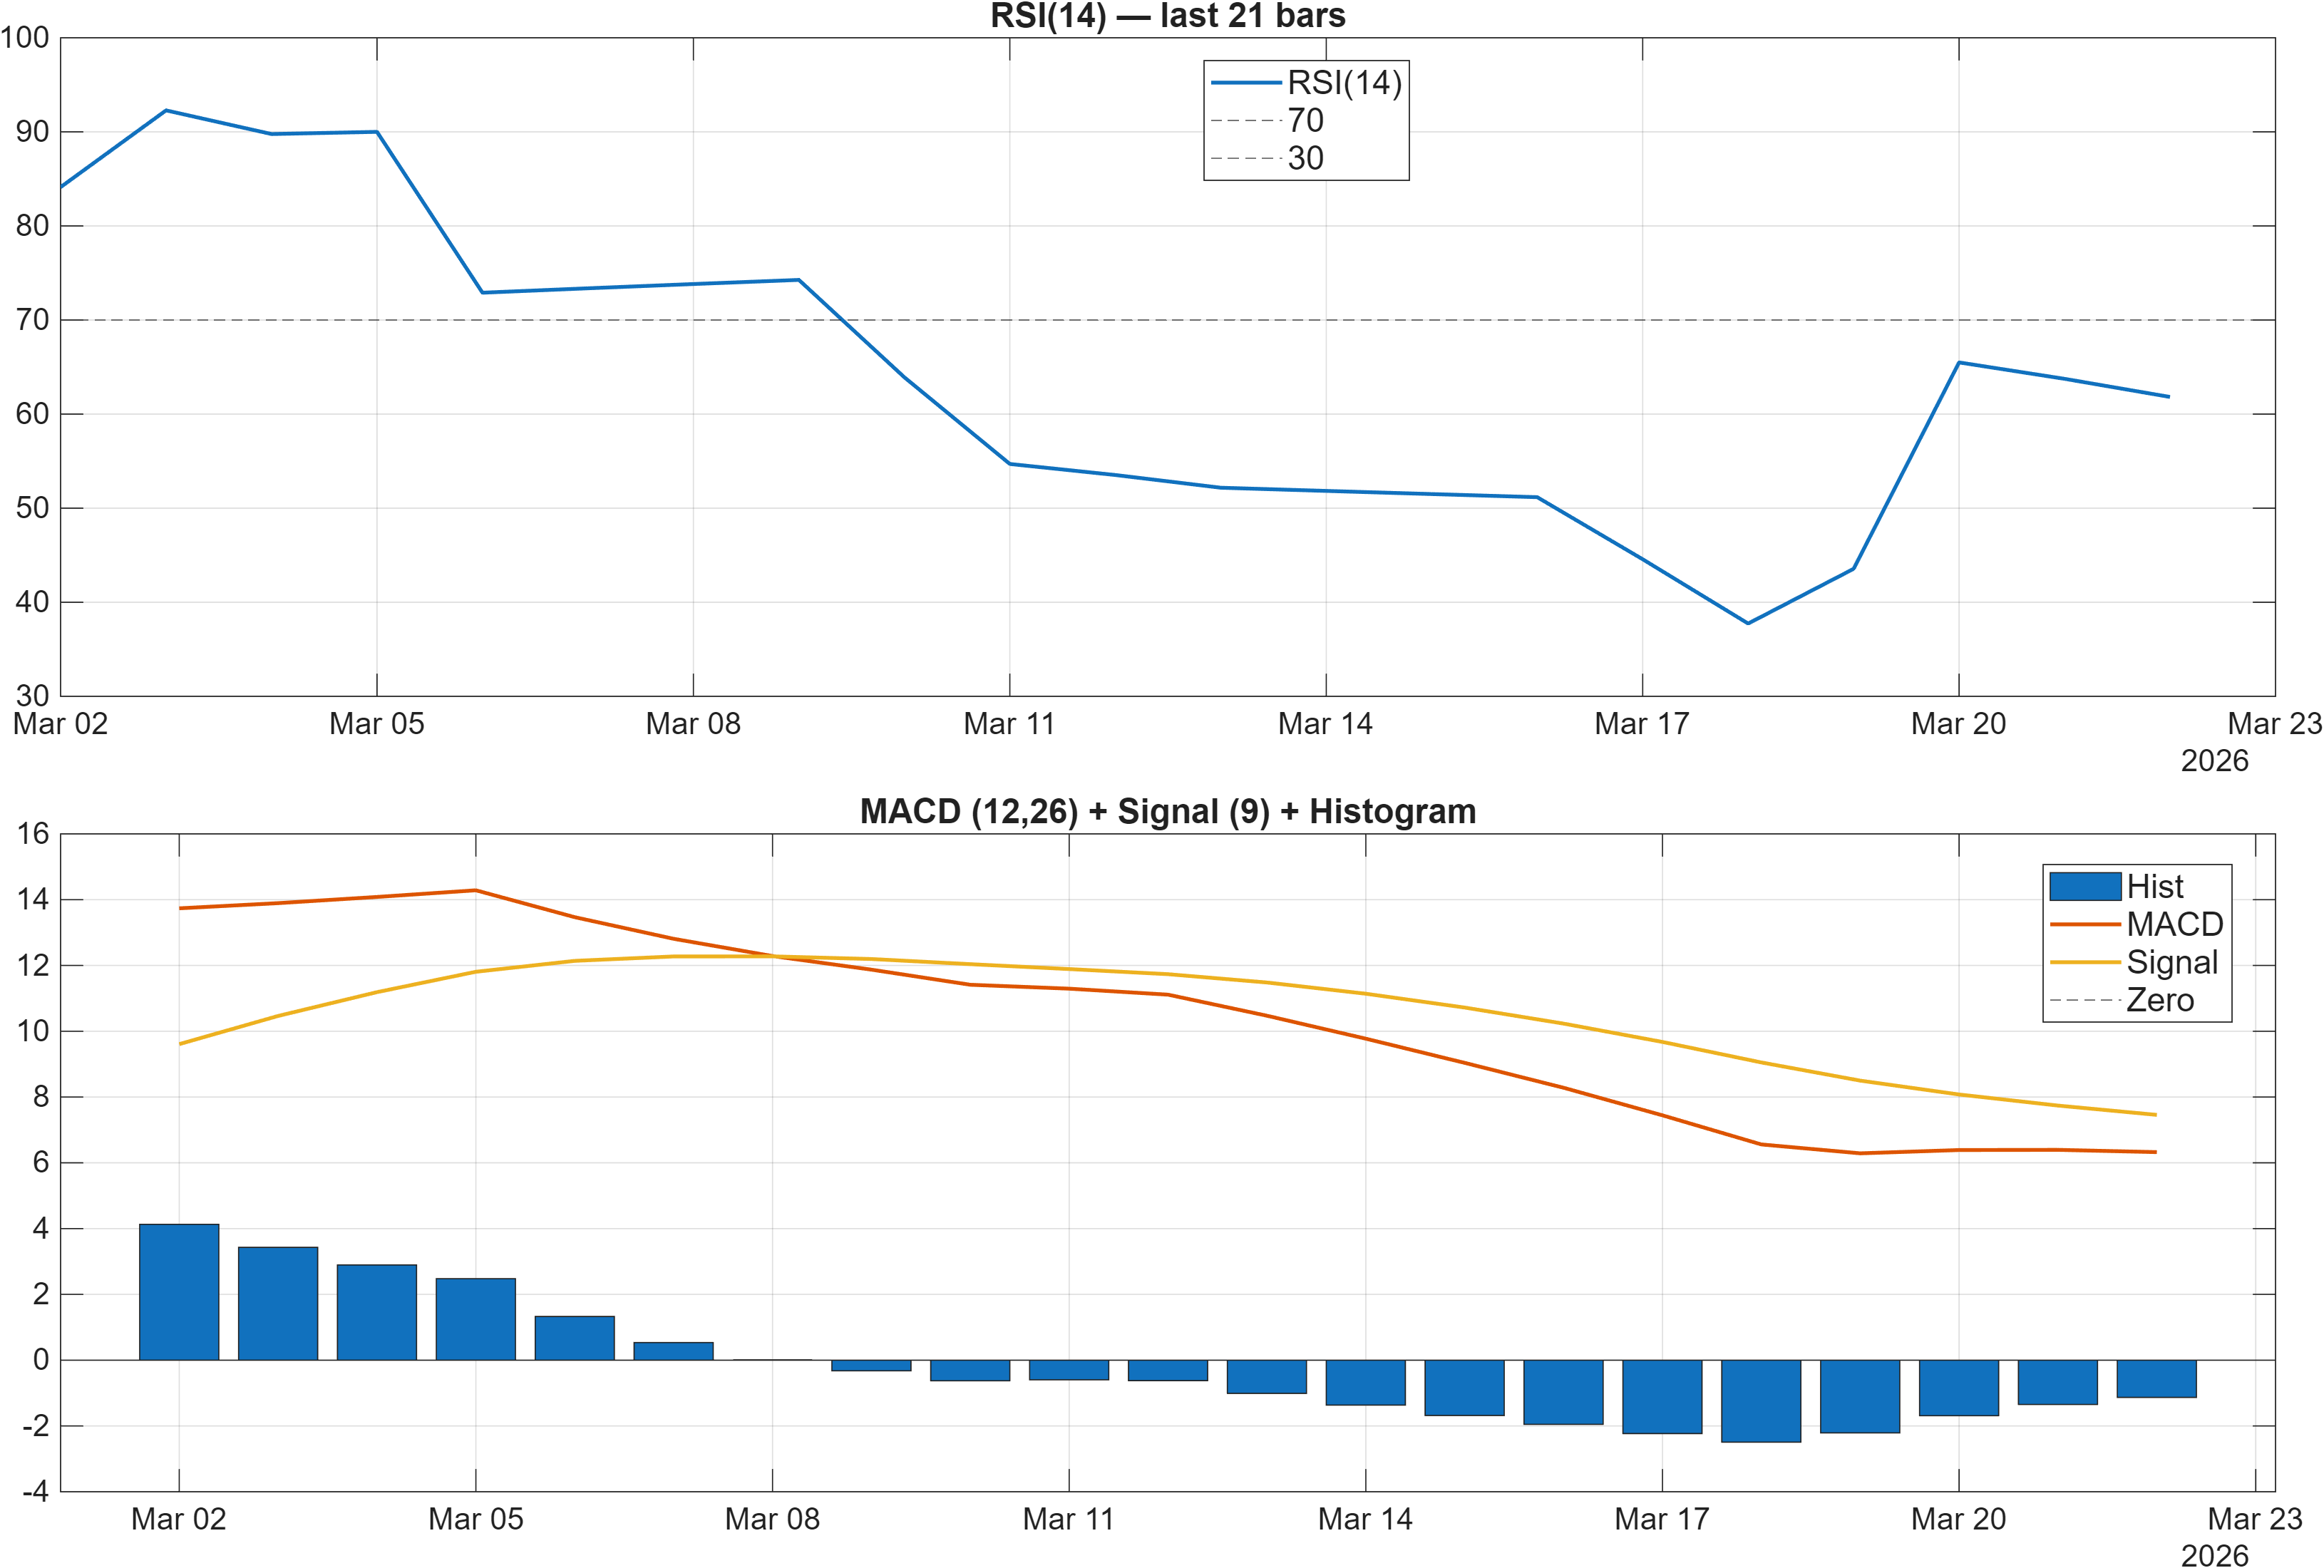
Momentum is sending a mixed-but-manageable message. The dashboard interpretation flags RSI bias = Bullish, and the signal table shows RSI(14) = 61.82, which is consistent with sustained upside pressure without necessarily implying a climactic extension. At the same time, the MACD complex is less supportive: the interpretation lists MACD hist = -1.1320 and the signal table tags MACD Hist -1.132 as Bearish. That divergence (RSI firm, MACD histogram negative) often appears during consolidations within an uptrend or during late-stage pullbacks that have not yet broken structure.
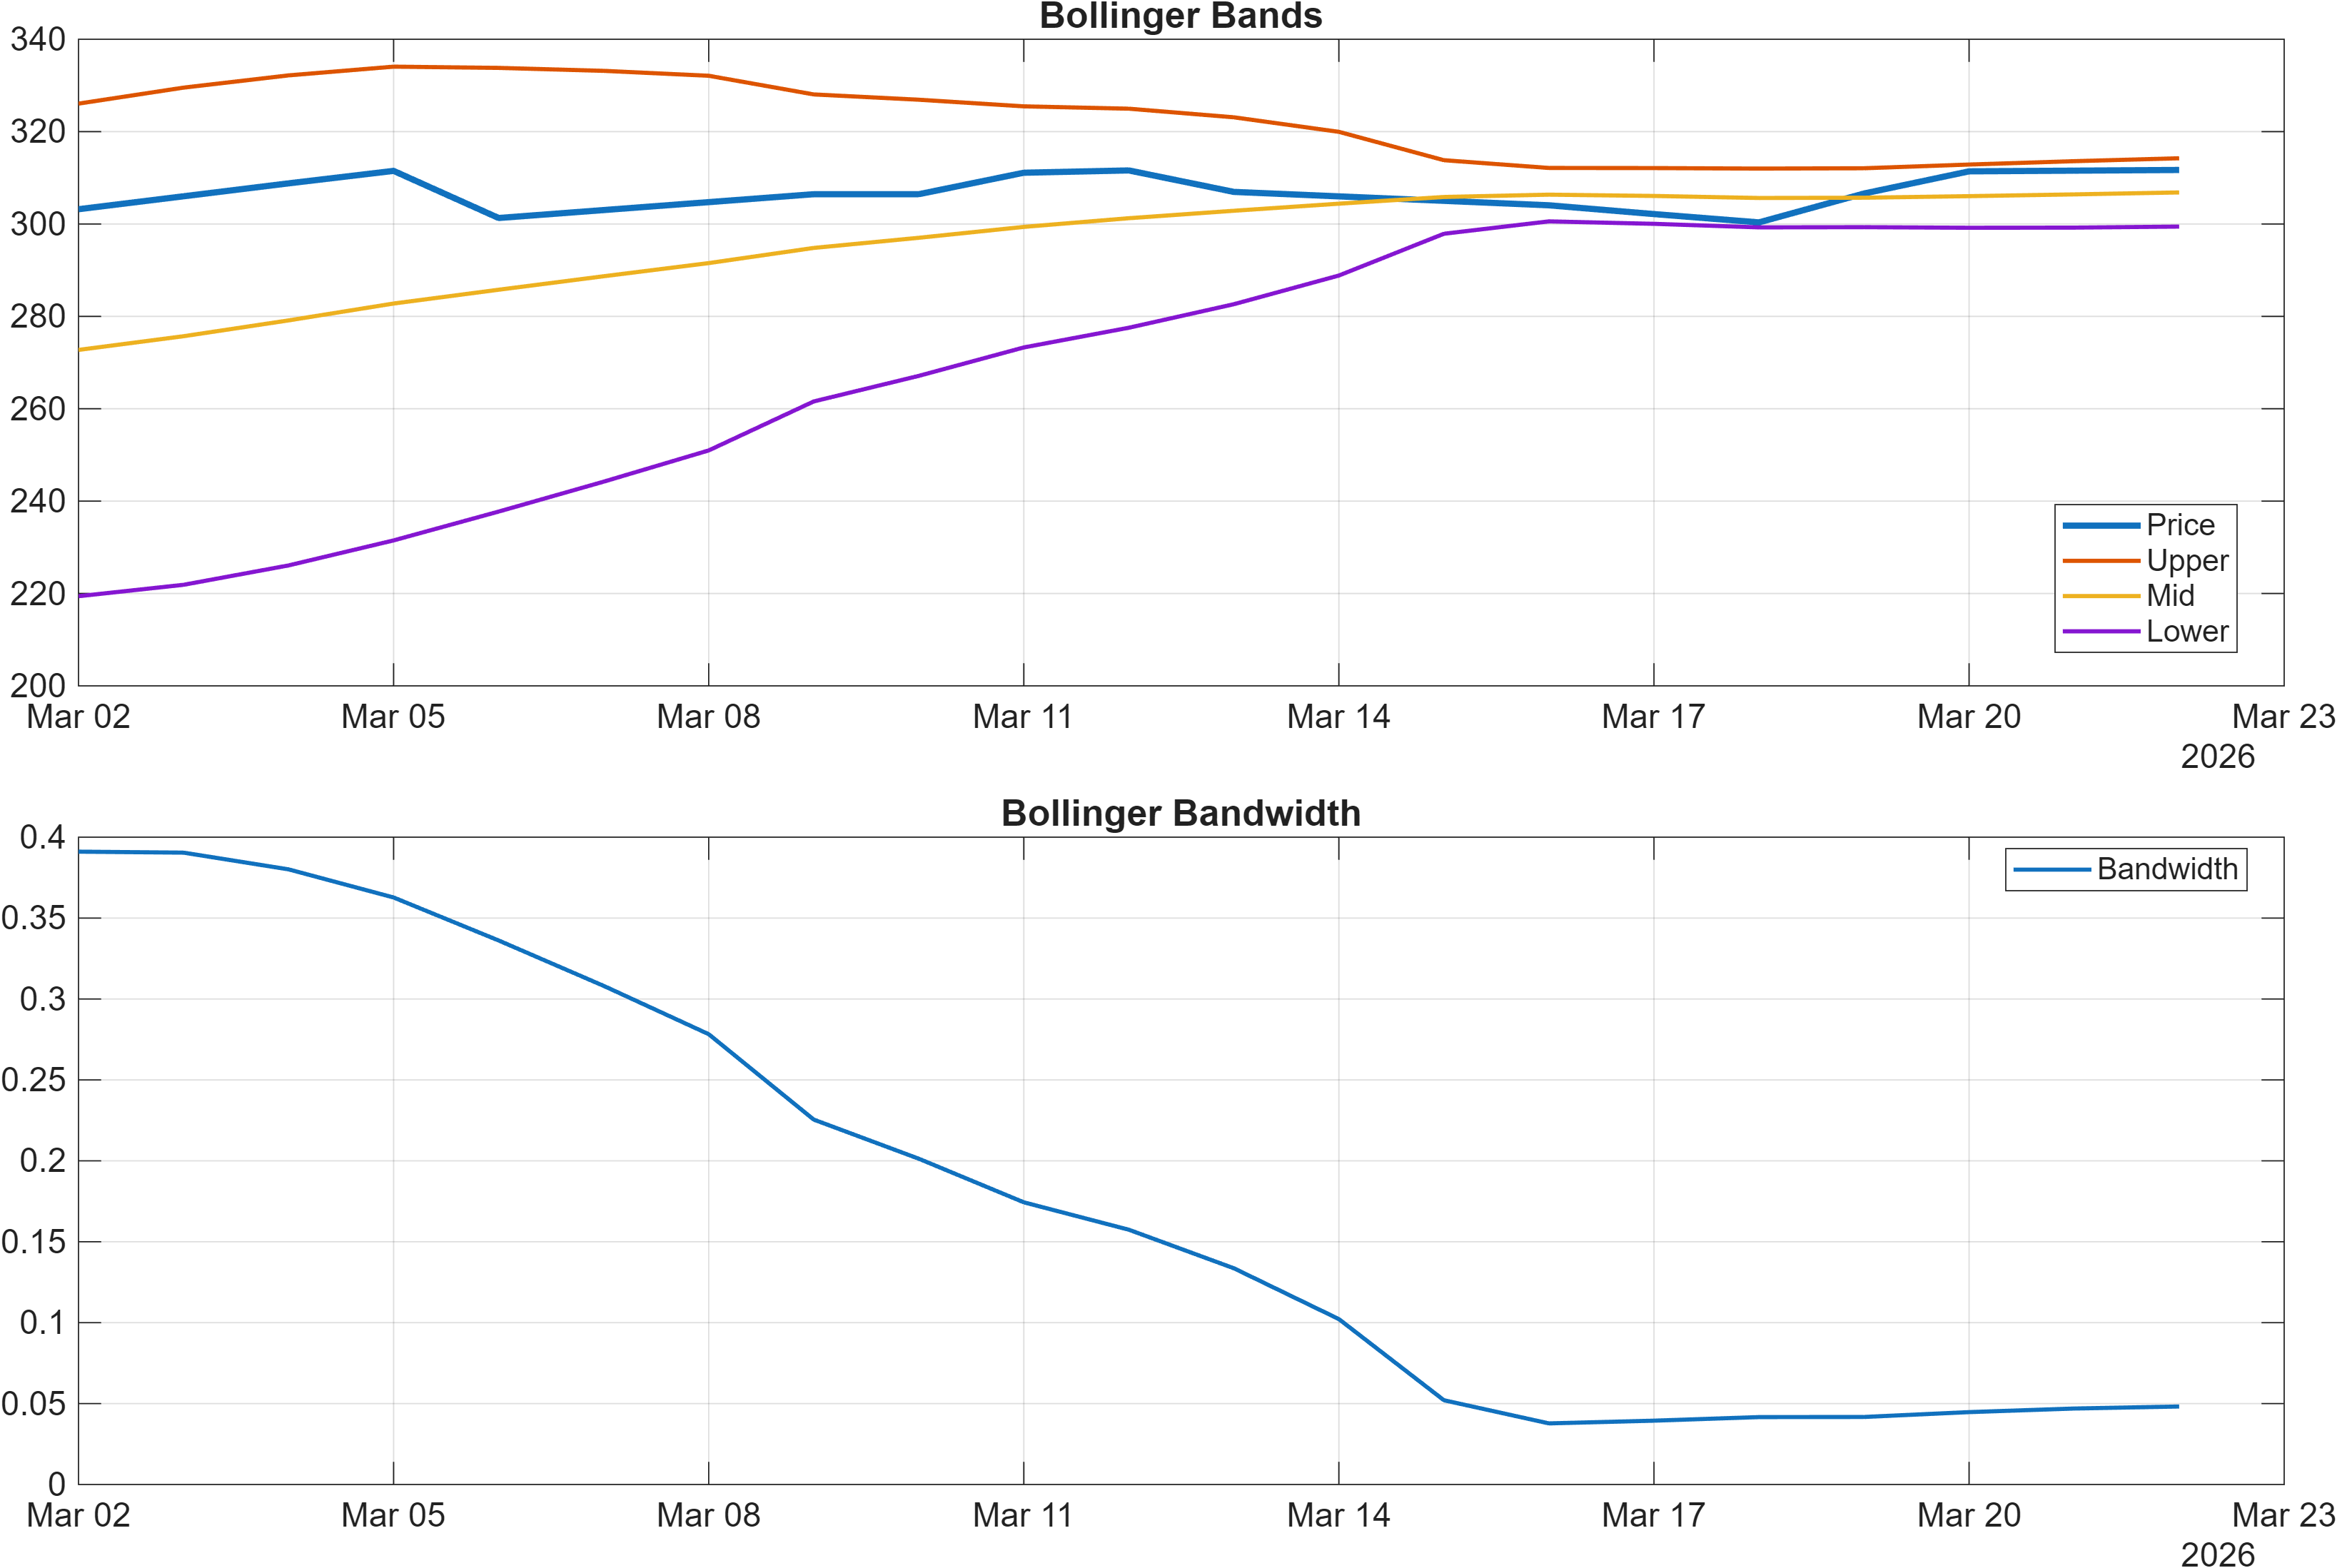
Volatility is currently quantified by Bollinger Bandwidth, with Bandwidth latest = 0.0482 (also echoed as BB Width 0.0482 in the signal table and marked bullish). A relatively constrained bandwidth reading can be interpreted as compression—conditions where directional moves, if they occur, can develop quickly once price resolves beyond nearby levels. This aligns naturally with the explicit support/resistance framing at 238.4750 and 316.4000.
Cross-checking the internal momentum layer, the signal table lists ROC(20) = 1.863 as bullish, which supports a positive rate-of-change backdrop even while MACD histogram remains negative. The combined view suggests momentum is positive on some measures but not broadly synchronized—an environment where confirmation tends to come from level breaks rather than oscillator readings alone.
4) Support / Resistance zones
Support ~ 238.4750 | Resistance ~ 316.4000
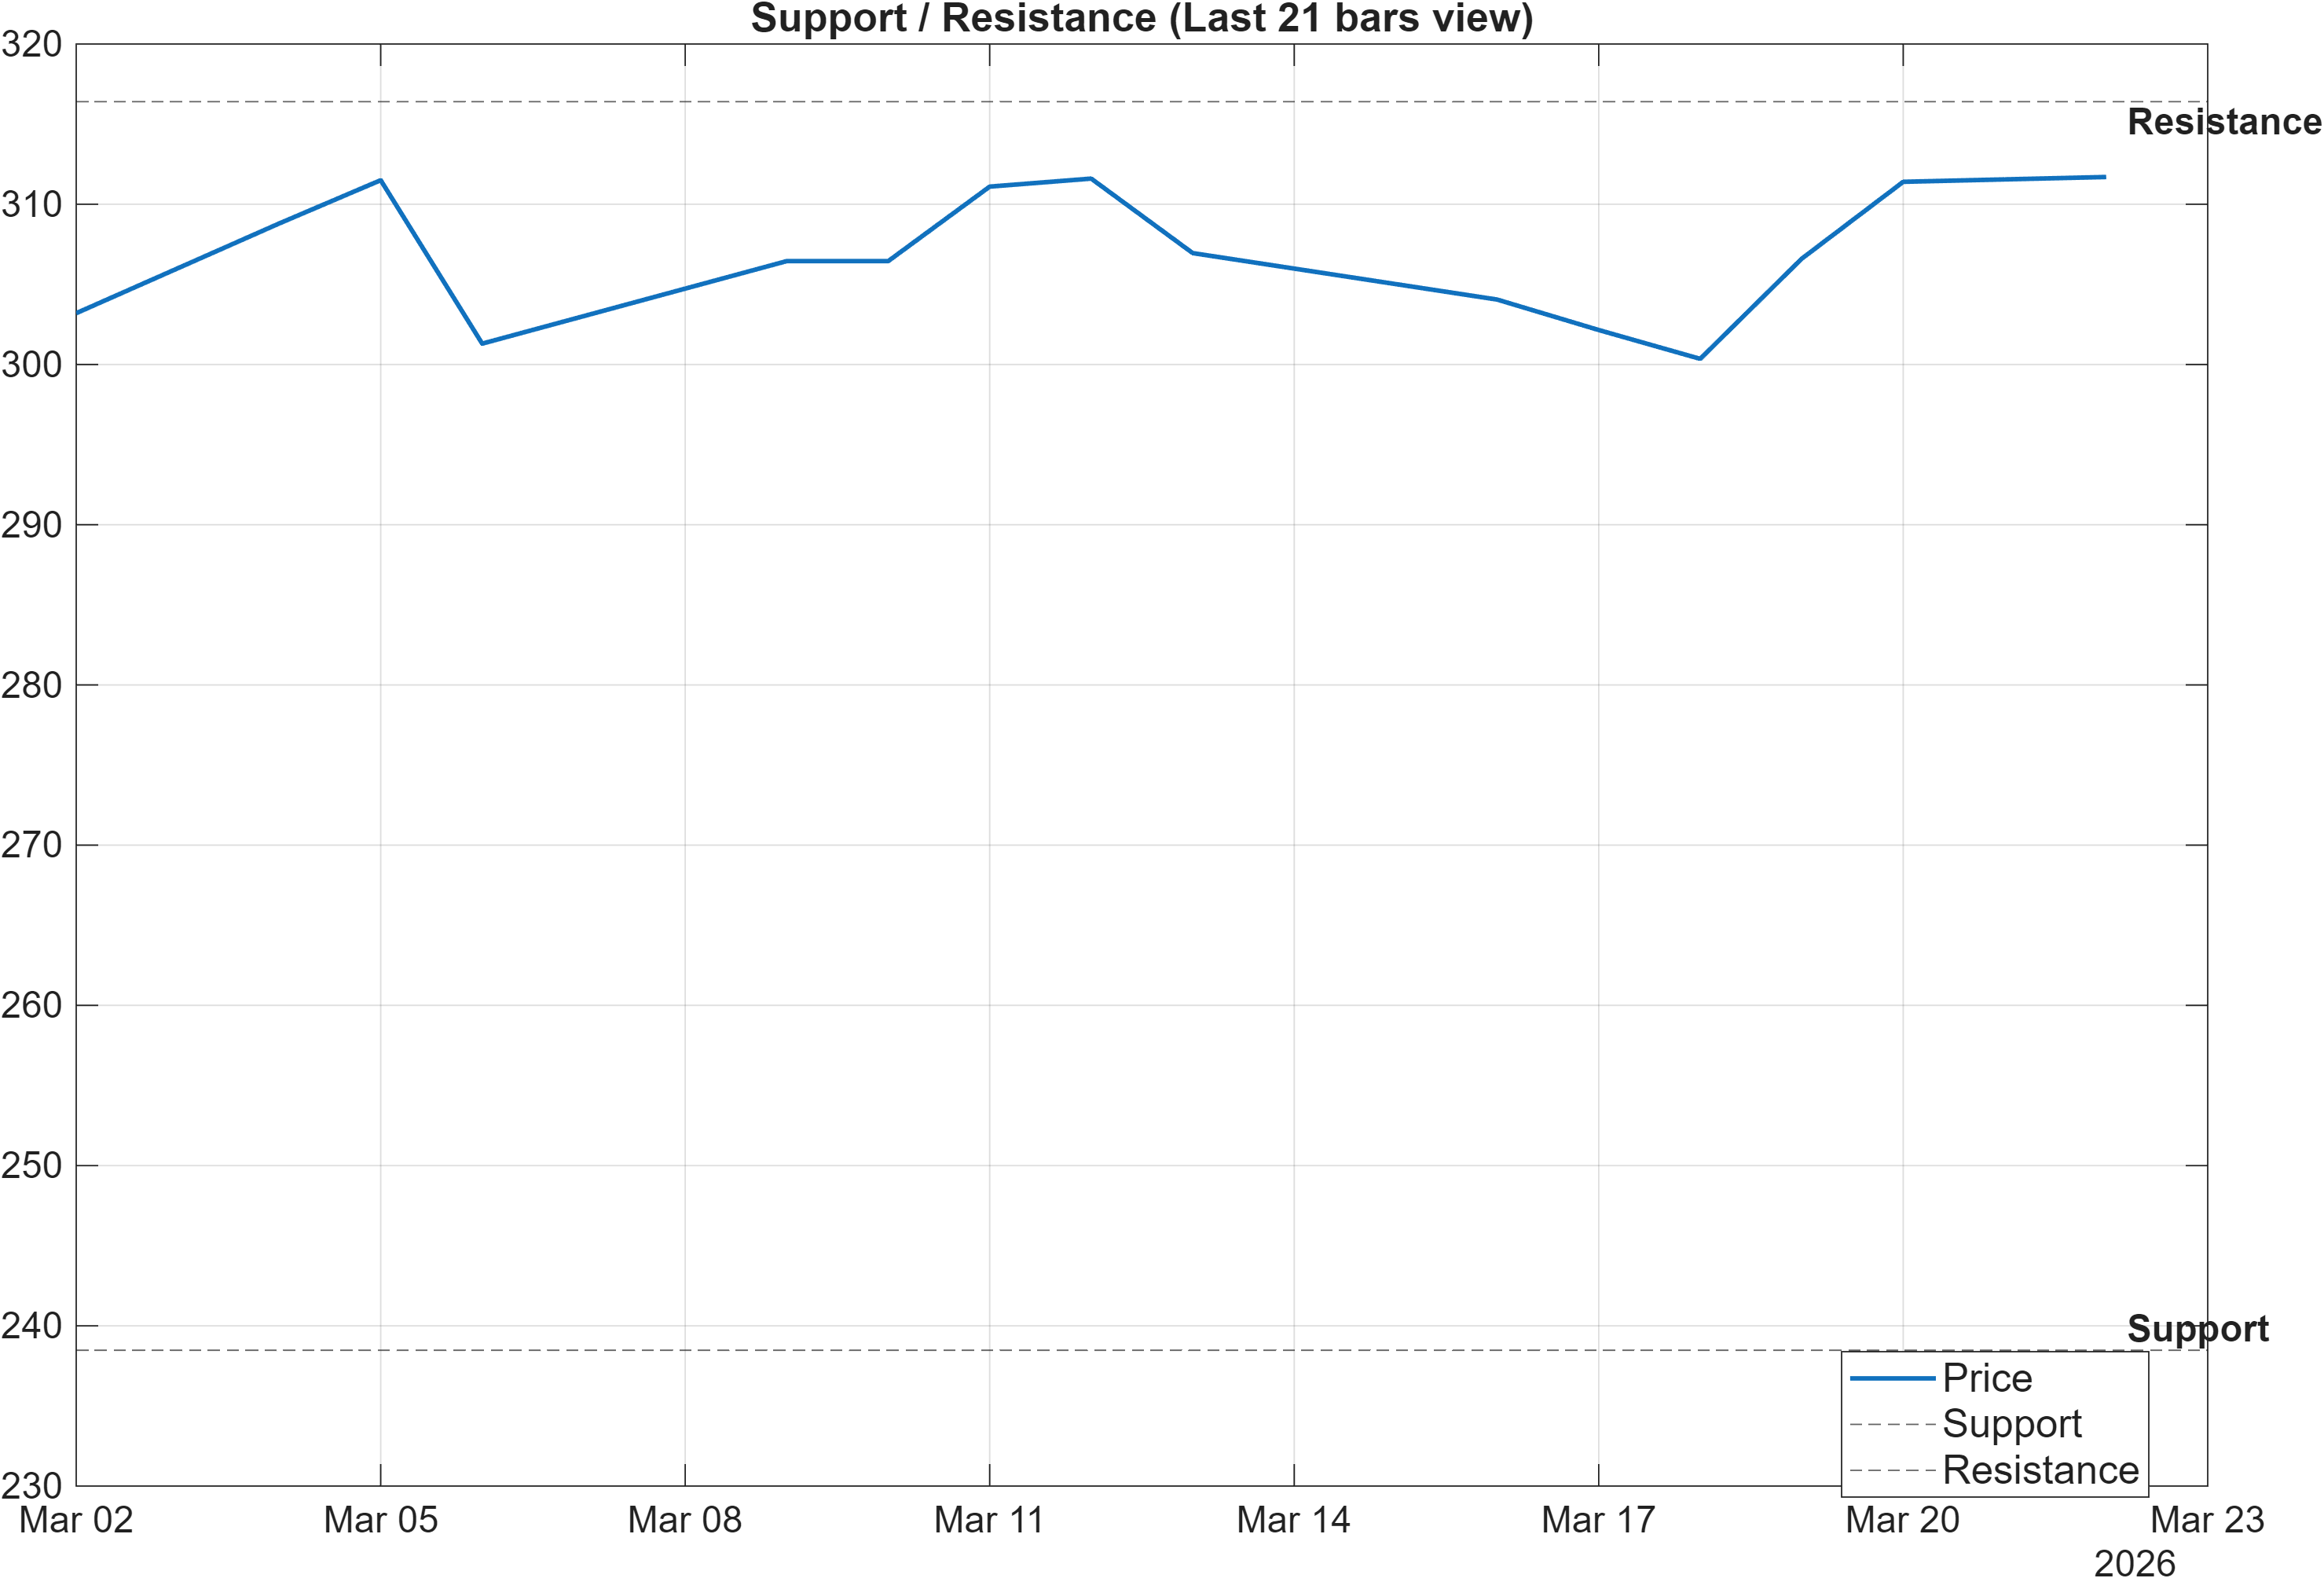
The level map is the highest-utility component when signals are directionally positive but not unanimous. The stated zones—support ~238.4750 and resistance ~316.4000—create a clean framework for interpreting whether the current bullish rank stack is being validated by market acceptance.
From a continuation standpoint, the report’s scenario condition is explicit: a break above resistance with volume supports continuation. This is especially relevant given the neutrality in the composite technical scoring (0.111 confluence; 0.284 blended), where a breakout would serve as an external validator that can override some internal indicator disagreement (for example, the MACD histogram at -1.132).
On the downside, a close below support is treated as deterioration risk. That risk is not framed as a forecast, but it becomes more significant in context: the yearly rank (#396, Neutral) implies that the longer-term distribution of outcomes is not as favorable as the shorter windows (#8 daily; #7 monthly). When the long-horizon rank is neutral, support breaks tend to matter more because they can represent a regime transition rather than a minor pullback.
For tactical monitoring, levels can also be paired with volatility state. With bandwidth 0.0482 suggesting compression, the market may spend time oscillating inside the band, but the first decisive acceptance above 316.4000 or failure below 238.4750 carries incremental informational value relative to a higher-volatility regime.
5) Quant Technical Dashboard (18 Signals)
KGNAI AI Technical Analysis Score (Deep Reinforcement Learning): Rank #191 out of 1222 (Rank 1 represents the strongest technical positioning and a higher probability of favorable price behavior. As ranks increase toward the maximum, the probability of favorable outcomes weakens and bearish positioning becomes more dominant.) | Label: Bullish | Score: 0.687
18-Signal Technical Confluence Score: 0.111 (Neutral)
Overall Technical Score (18-signal confluence + DRL rank blend): 0.284 (Neutral)
Note: The blended score reflects signal strength weighted against broader AI technical ranking, which may temporarily diverge.
Blended technical score breakdown: 0.284 (Neutral | Bull 9 / Bear 7 / Neutral 2)
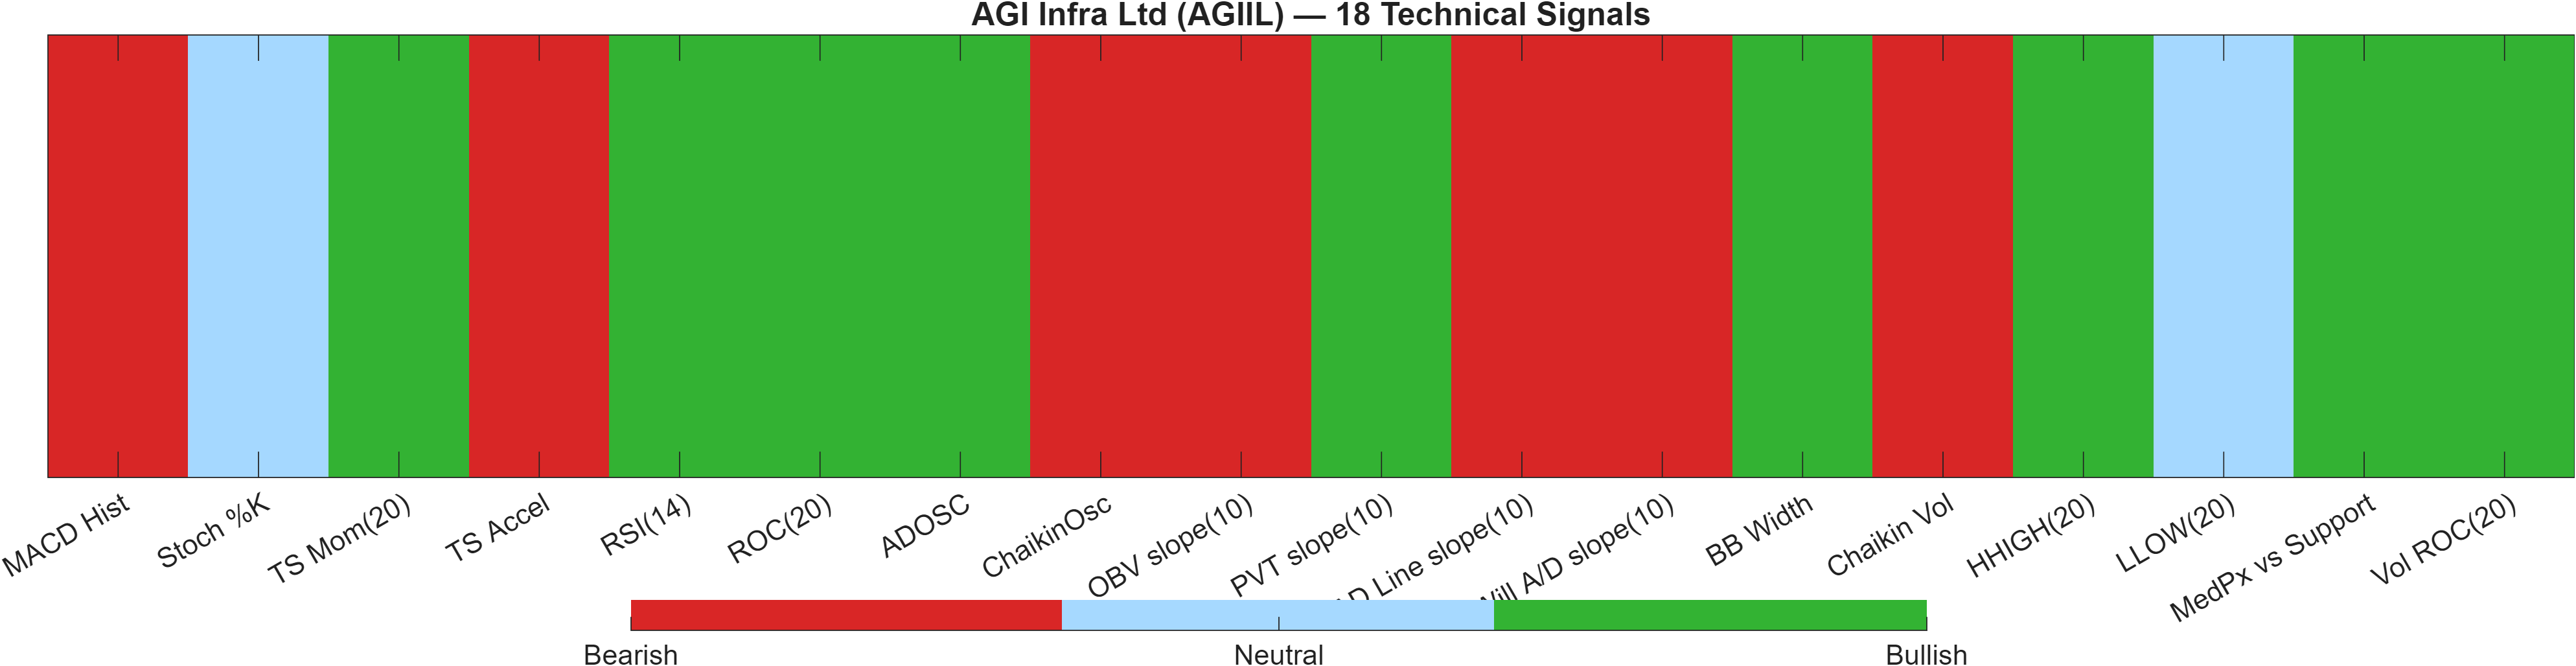
Signal table (Bull/Bear/Neutral)
| Indicator | Value | Signal |
|---|---|---|
| MACD Hist | -1.132 | Bearish |
| Stoch %K | 64.71 | Neutral |
| TS Mom(20) | 5.4 | Bullish |
| TS Accel | -60.3 | Bearish |
| RSI(14) | 61.82 | Bullish |
| ROC(20) | 1.863 | Bullish |
| ADOSC | 53.2 | Bullish |
| ChaikinOsc | -8.916e+04 | Bearish |
| OBV slope(10) | -5.015e+05 | Bearish |
| PVT slope(10) | 735 | Bullish |
| AD Line slope(10) | -2.824e+05 | Bearish |
| Will A/D slope(10) | -32.6 | Bearish |
| BB Width | 0.0482 | Bullish |
| Chaikin Vol | 11.88 | Bearish |
| HHIGH(20) | 322.2 | Bullish |
| LLOW(20) | 286.9 | Neutral |
| MedPx vs Support | 72.78 | Bullish |
| Vol ROC(20) | 309.3 | Bullish |
The dashboard is best read as a two-layer system: (1) indicator confluence and (2) an AI technical rank overlay. The overlay is constructive: the DRL technical rank is #191 out of 1222 with a 0.687 score and a Bullish label. Yet the indicator aggregation is more evenly split, resulting in 0.111 (Neutral) confluence and 0.284 (Neutral) blended score.
This compression between bullish overlay and neutral blend typically occurs when trend-following inputs are supportive while participation or thrust measures are less synchronized. For example, momentum/strength readings such as RSI(14) 61.82 and ROC(20) 1.863 are bullish, while some accumulation/flow proxies are tagged bearish (e.g., OBV slope(10) -5.015e+05 and ChaikinOsc -8.916e+04). The result is not a contradiction so much as a quality-of-trend question: the tape can stay constructive, but the market is asking for better participation confirmation.
Volatility and structure cues add context. BB Width 0.0482 is marked bullish, aligning with a regime where breakouts can be decisive once they occur. Additionally, HHIGH(20) 322.2 sits above the stated resistance zone (316.4000), suggesting nearby overhead reference points where a breakout attempt may be evaluated. Overall, the dashboard leans toward trend continuation conditional on confirmation rather than a fully synchronized momentum expansion.
6) News sentiment + extractive gist
Note: Instrument-specific news matches were not found, so the digest includes broader market/sector headlines. Links are provided for verification.
Sentiment score (avg): 0.085 | Positive: 31% | Neutral: 63% | Negative: 6%
KGNAI AI News Sentiment Score (normalized -1 to +1): Not available (as of —) | Label: Not available | Overall news score: 0.09
Positive Developments
Recent coverage across major financial outlets indicates a mildly constructive tone in pockets of the broader India market narrative, with selective interest in equities and an emphasis on stock-specific opportunity sets rather than blanket risk-off positioning. In the provided sentiment mix, 31% of items are positive with an average sentiment score of 0.085, which is consistent with a modestly supportive backdrop rather than a euphoric one. The constructive angle is also compatible with AGIIL’s shorter-horizon rank leadership (daily #8; monthly #7), where market participants often respond to improving setups even when macro/market conditions are mixed. With the technical framework showing a bullish moving-average structure but neutral confluence (0.111), a mildly positive news tone functions mainly as contextual reinforcement—helpful for follow-through if price challenges the 316.4000 resistance zone, but not sufficient on its own to resolve the internal signal dispersion.
Neutral / Mixed Developments
The dominant feature of the news mix is neutrality: 63% neutral items suggest information flow that is largely descriptive (market levels, sector rotation, policy discussion) rather than strongly directional. This matters for interpretation because the report’s news layer is not instrument-specific here, and the system flags that the normalized news sentiment score is not available in the provided data even though an overall news score of 0.09 is shown. In this setting, neutral news tends to coincide with technical markets where price action does the heavy lifting. For AGIIL, that aligns with a regime in which confirmation is better sought through structure—respect of 238.4750 support or acceptance above 316.4000—than through narrative catalysts.
Negative / Risk Signals
Risk framing is present but not dominant, with 6% negative items. The common thread in the risk tone across major outlets is a focus on market fragility themes—volatility, pullback risk, and sensitivity to broader conditions—rather than company-specific deterioration signals (not available in the provided data). That risk coloration is worth integrating because AGIIL’s long-horizon rank is only Neutral at #396, implying that a broader market de-risking episode could have more impact than it would on a uniformly top-ranked long-term profile. From a process standpoint, negative risk tone increases the importance of the close-below-support invalidation trigger at 238.4750, especially while some internal indicators remain bearish (e.g., MACD histogram -1.132) despite bullish RSI conditions.
- Price/volume behavior on any approach to 316.4000 (continuation condition requires volume confirmation).
- Whether pullbacks hold above 238.4750 (invalidation risk on a close below support).
- Momentum alignment: RSI(14) 61.82 staying constructive while MACD hist -1.132 improves or remains a drag.
Sources referenced: Reuters, Bloomberg, Yahoo Finance, MarketWatch, Investing.com
Snapshot: AI Rank (Short–Mid–Long): Mixed (Bullish tilt) (Bullish–Bullish–Neutral) · Technical Confluence: Neutral · Key Levels: Support ~238.47 | Resistance ~316.40 · News Sentiment: Neutral
7) Sources
Instrument-level source links are not reproduced here to avoid duplicating headline lists. Source attribution in the sentiment section reflects aggregated coverage across major financial outlets.
You may also like: How KGNAI AI ranks instruments across global markets
Disclaimer: KGNAI provides AI-generated analytics and educational market commentary only. This is not financial advice. Markets involve risk. Always do your own research.