
IRCON International Ltd (IRCON) — 12-Apr-2026 Technical Stance: Bullish Bias With Short-Term Neutrality
IRCON International Ltd (IRCON) screens as a bullish-leaning setup across KGNAI’s multi-horizon ranking stack, with the strongest relative positioning concentrated in the longer windows. The 3-Monthly and Yearly ranks (#22) indicate upper-tier strength within the 1222-instrument India universe, while the Weekly rank (#307) keeps the near-term read more balanced. On the technical side, confluence is constructive: the 18-signal score (0.611) and overall blended technical score (0.596) both remain Bullish, supported by positive momentum/participation measures and a positive MACD histogram reading (2.2595). Key levels define the risk map: support ~117.8667 and resistance ~153.9000. News sentiment is modestly positive (0.191) but is based on broader market/sector context due to limited instrument-specific matches in the provided data.
- Rank stance (Short / Mid / Long): Neutral / Bullish / Bullish (weekly #307 vs 3-Monthly #22 and Yearly #22)
- Technical confluence: Bullish (18-signal 0.611; blended 0.596)
- Key levels: Support ~117.8667; Resistance ~153.9000
- News sentiment bias: Slightly positive (avg 0.191; 56% positive, 44% neutral, 0% negative)
- Confirmation / invalidation: Confirmation favors a break above 153.9000 with volume; deterioration risk increases on a close below 117.8667
KGNAI evaluates assets using large cross-sectional datasets built from millions of structured data points. Inputs incorporate fundamental metrics, technical structures, and systematically processed news sentiment. Statistical models, machine learning, and AI frameworks are used to assess relative positioning, signal alignment, and probabilistic behavior across broad universes.
- Ranks are comparative across the tracked universe, not absolute price targets.
- Confluence reflects alignment among independent signal groups.
- Support/resistance levels are probabilistic decision zones, not guarantees.
- Sentiment provides contextual bias within the broader analytical framework.
1) KGNAI AI Analysis
Region: INDIA
Total universe size: 1222 ranked instruments
- Daily rank: #172 out of 1222 — Bullish
- Weekly rank: #307 out of 1222 — Neutral
- Monthly rank: #106 out of 1222 — Bullish
- 3-Monthly rank: #22 out of 1222 — Bullish
- 6-Monthly rank: #77 out of 1222 — Bullish
- Yearly rank: #22 out of 1222 — Bullish
IRCON’s rank profile is best described as mid-to-long horizon strength with near-term moderation. The long-window ranks are the most decisive: #22 on both the 3-Monthly and Yearly horizons places the instrument in the upper tier of the tracked universe, consistent with persistent, higher-quality trend behavior in KGNAI’s cross-sectional framing. The 6-Monthly rank (#77) reinforces that the longer trend is still constructive rather than narrowly time-dependent.
Shorter windows are supportive but less uniform. The Daily rank (#172) remains Bullish, implying near-term strength hasn’t fully rolled over, yet the Weekly rank (#307) shifts the short-term stance to Neutral. This configuration often appears when price action is still strong on shorter sampling windows, but the week-level distribution is beginning to reflect either consolidation risk or less dominant leadership versus peers.
The most actionable takeaway is the timeframe asymmetry: the longer ranks suggest the market is still rewarding IRCON relative to its universe, while the weekly rank introduces a higher bar for continuation signals. In practice, that tends to elevate the importance of level-based confirmation (notably around 153.9000) and participation cues (volume/accumulation indicators discussed later), rather than relying on rank alone.
Term view: Short-term: Neutral. Mid-term: Bullish. Long-term: Bullish.
2) Price & trend overview
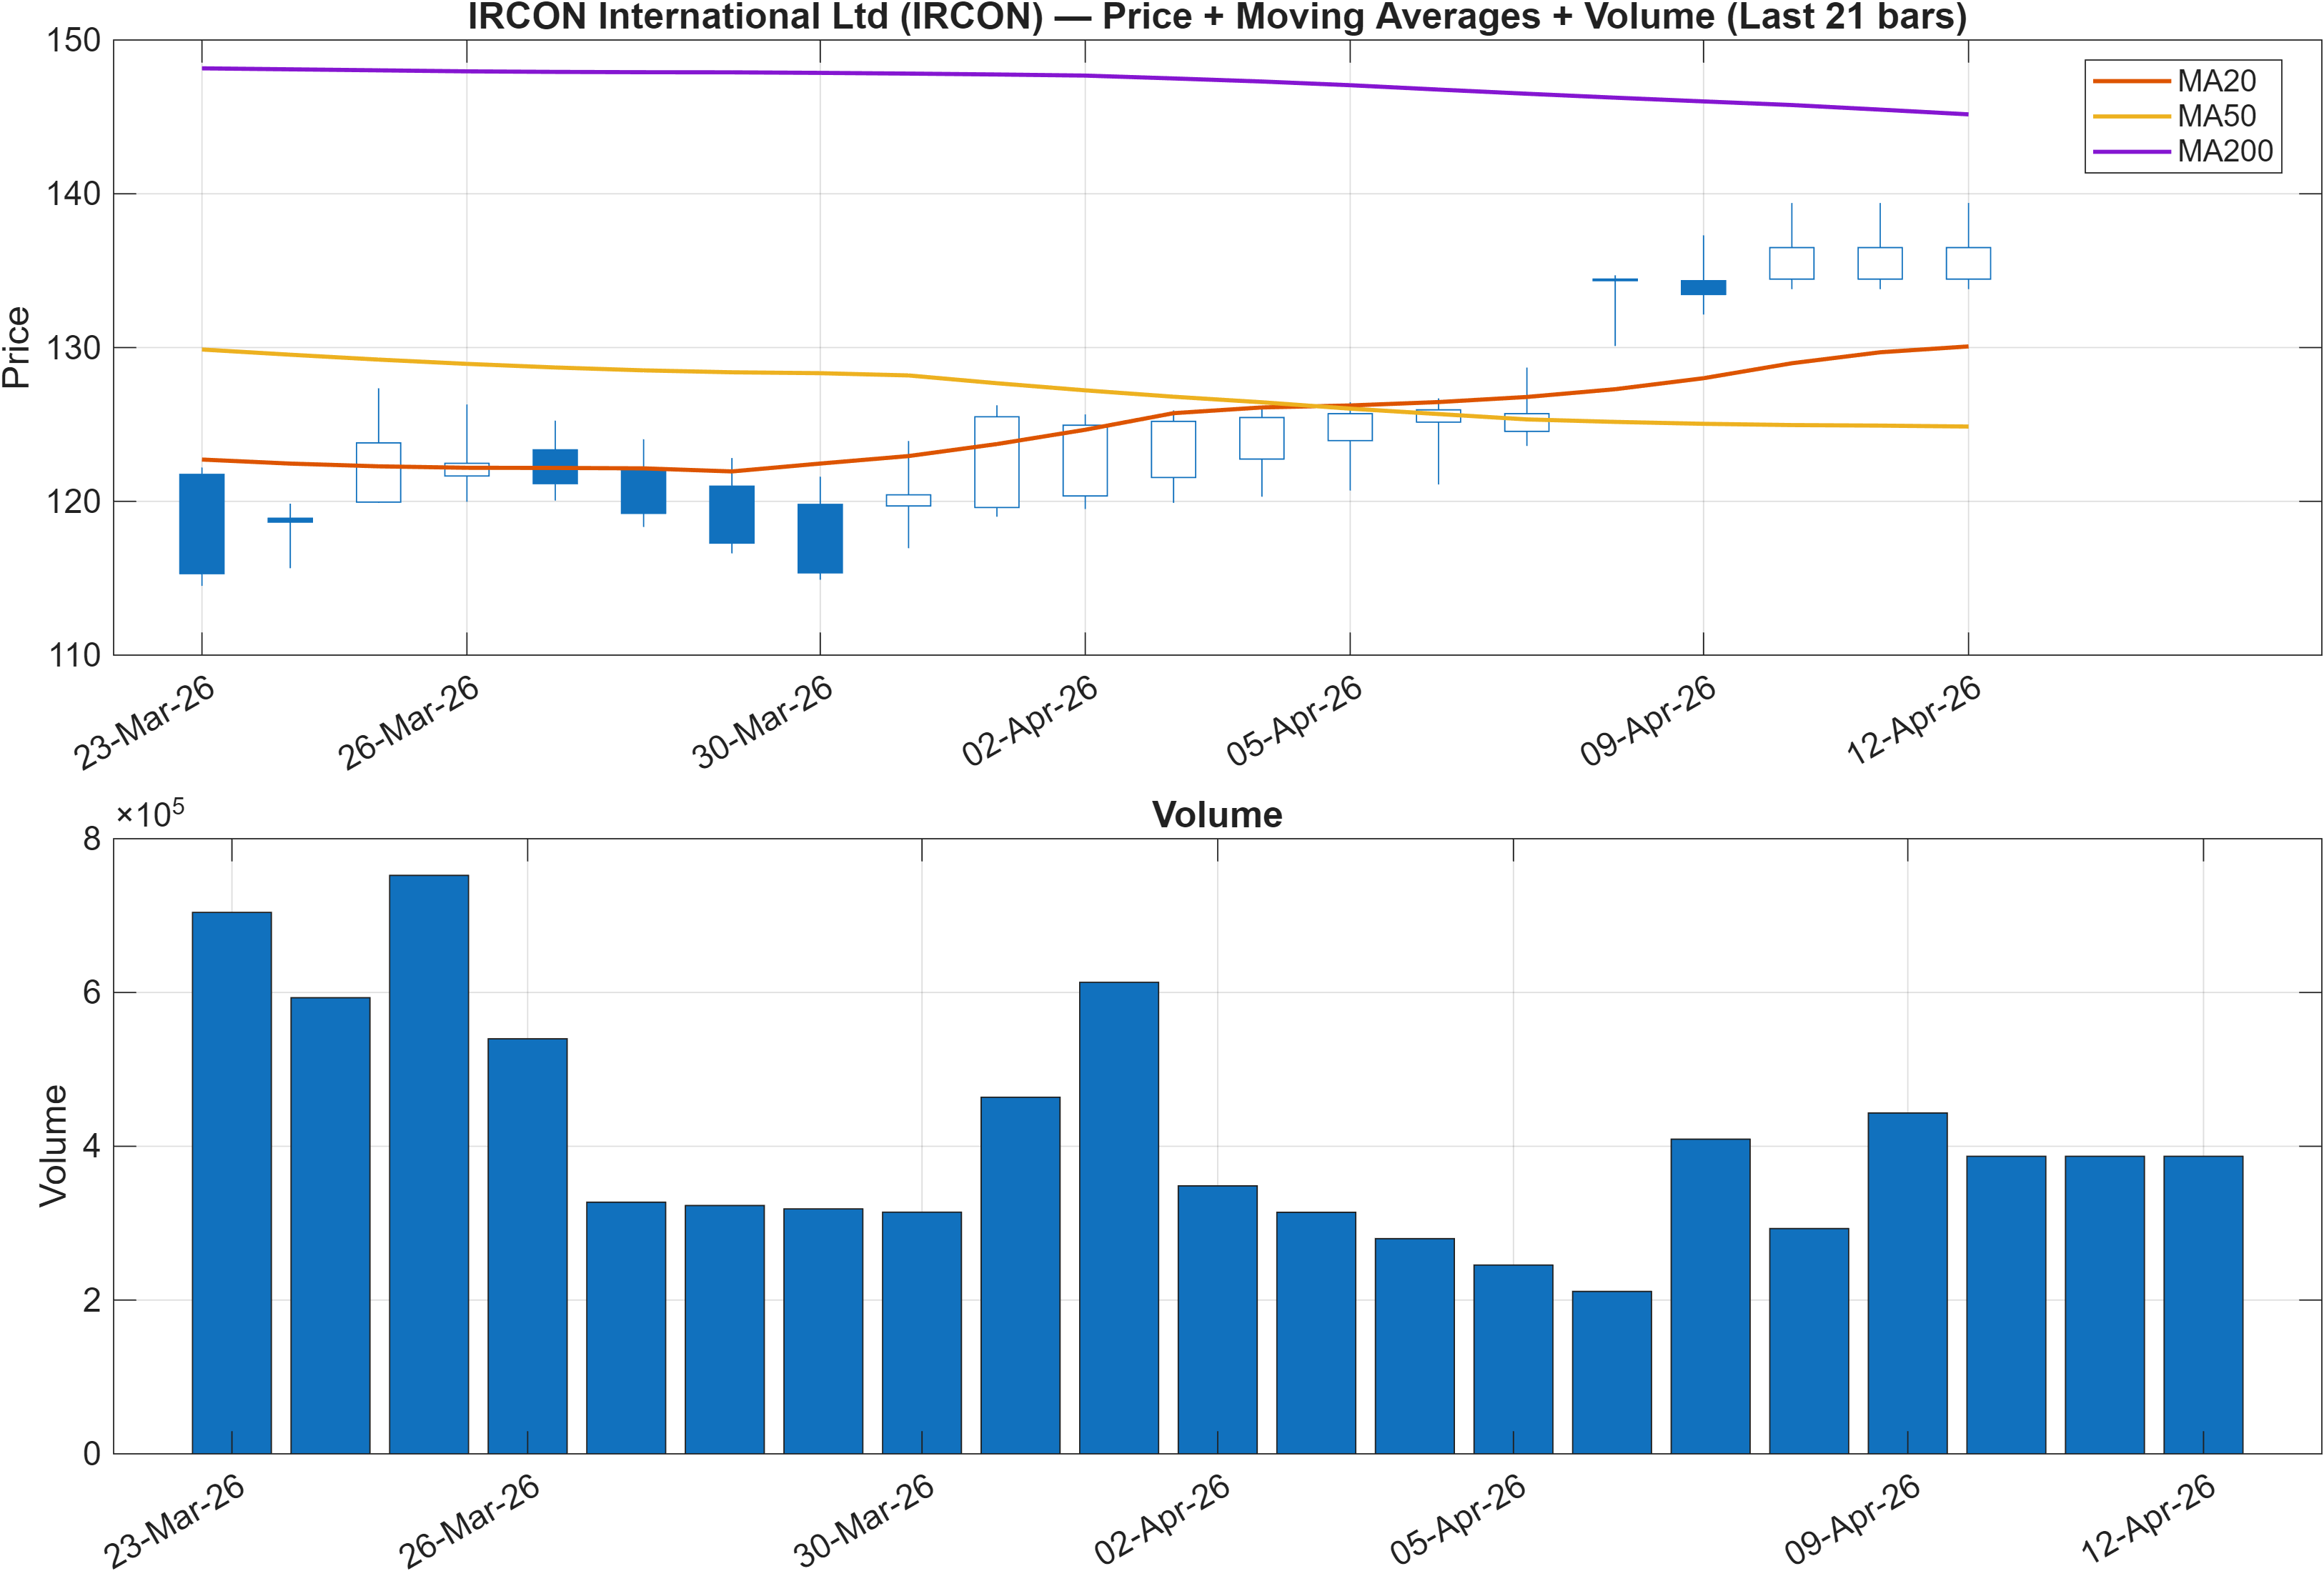
Interpretation: Close vs MA50 = Bullish, MA50 vs MA200 = Bearish.
Trend structure: upside persistence vs longer-term friction
The moving-average read is split, which matters for regime classification. With Close vs MA50 flagged Bullish, the market is still trading in a way that supports short-cycle trend continuation and dip-buying behavior. At the same time, MA50 vs MA200 is Bearish, indicating the longer-cycle trend filter has not fully flipped to a broadly confirmed uptrend configuration.
This is a classic transition setup: shorter-term trend strength is present, but the long-term baseline remains a constraint. In that environment, IRCON’s strong cross-sectional ranks at #22 (3-Monthly and Yearly) are notable, because they imply that despite the longer MA relationship still being Bearish, the instrument is nevertheless behaving favorably versus peers. That divergence can persist, but it tends to place greater emphasis on breakout validation and pullback discipline.
The level map provides an objective framework around that transition. With support ~117.8667 and resistance ~153.9000, price behavior near resistance becomes the key differentiator between continued trend persistence and a mean-reversion phase. Until resistance is resolved, the weekly Neutral rank (#307) is consistent with the idea that the market may be pricing in consolidation risk even while momentum remains constructive on other measures.
3) Momentum & volatility dashboard
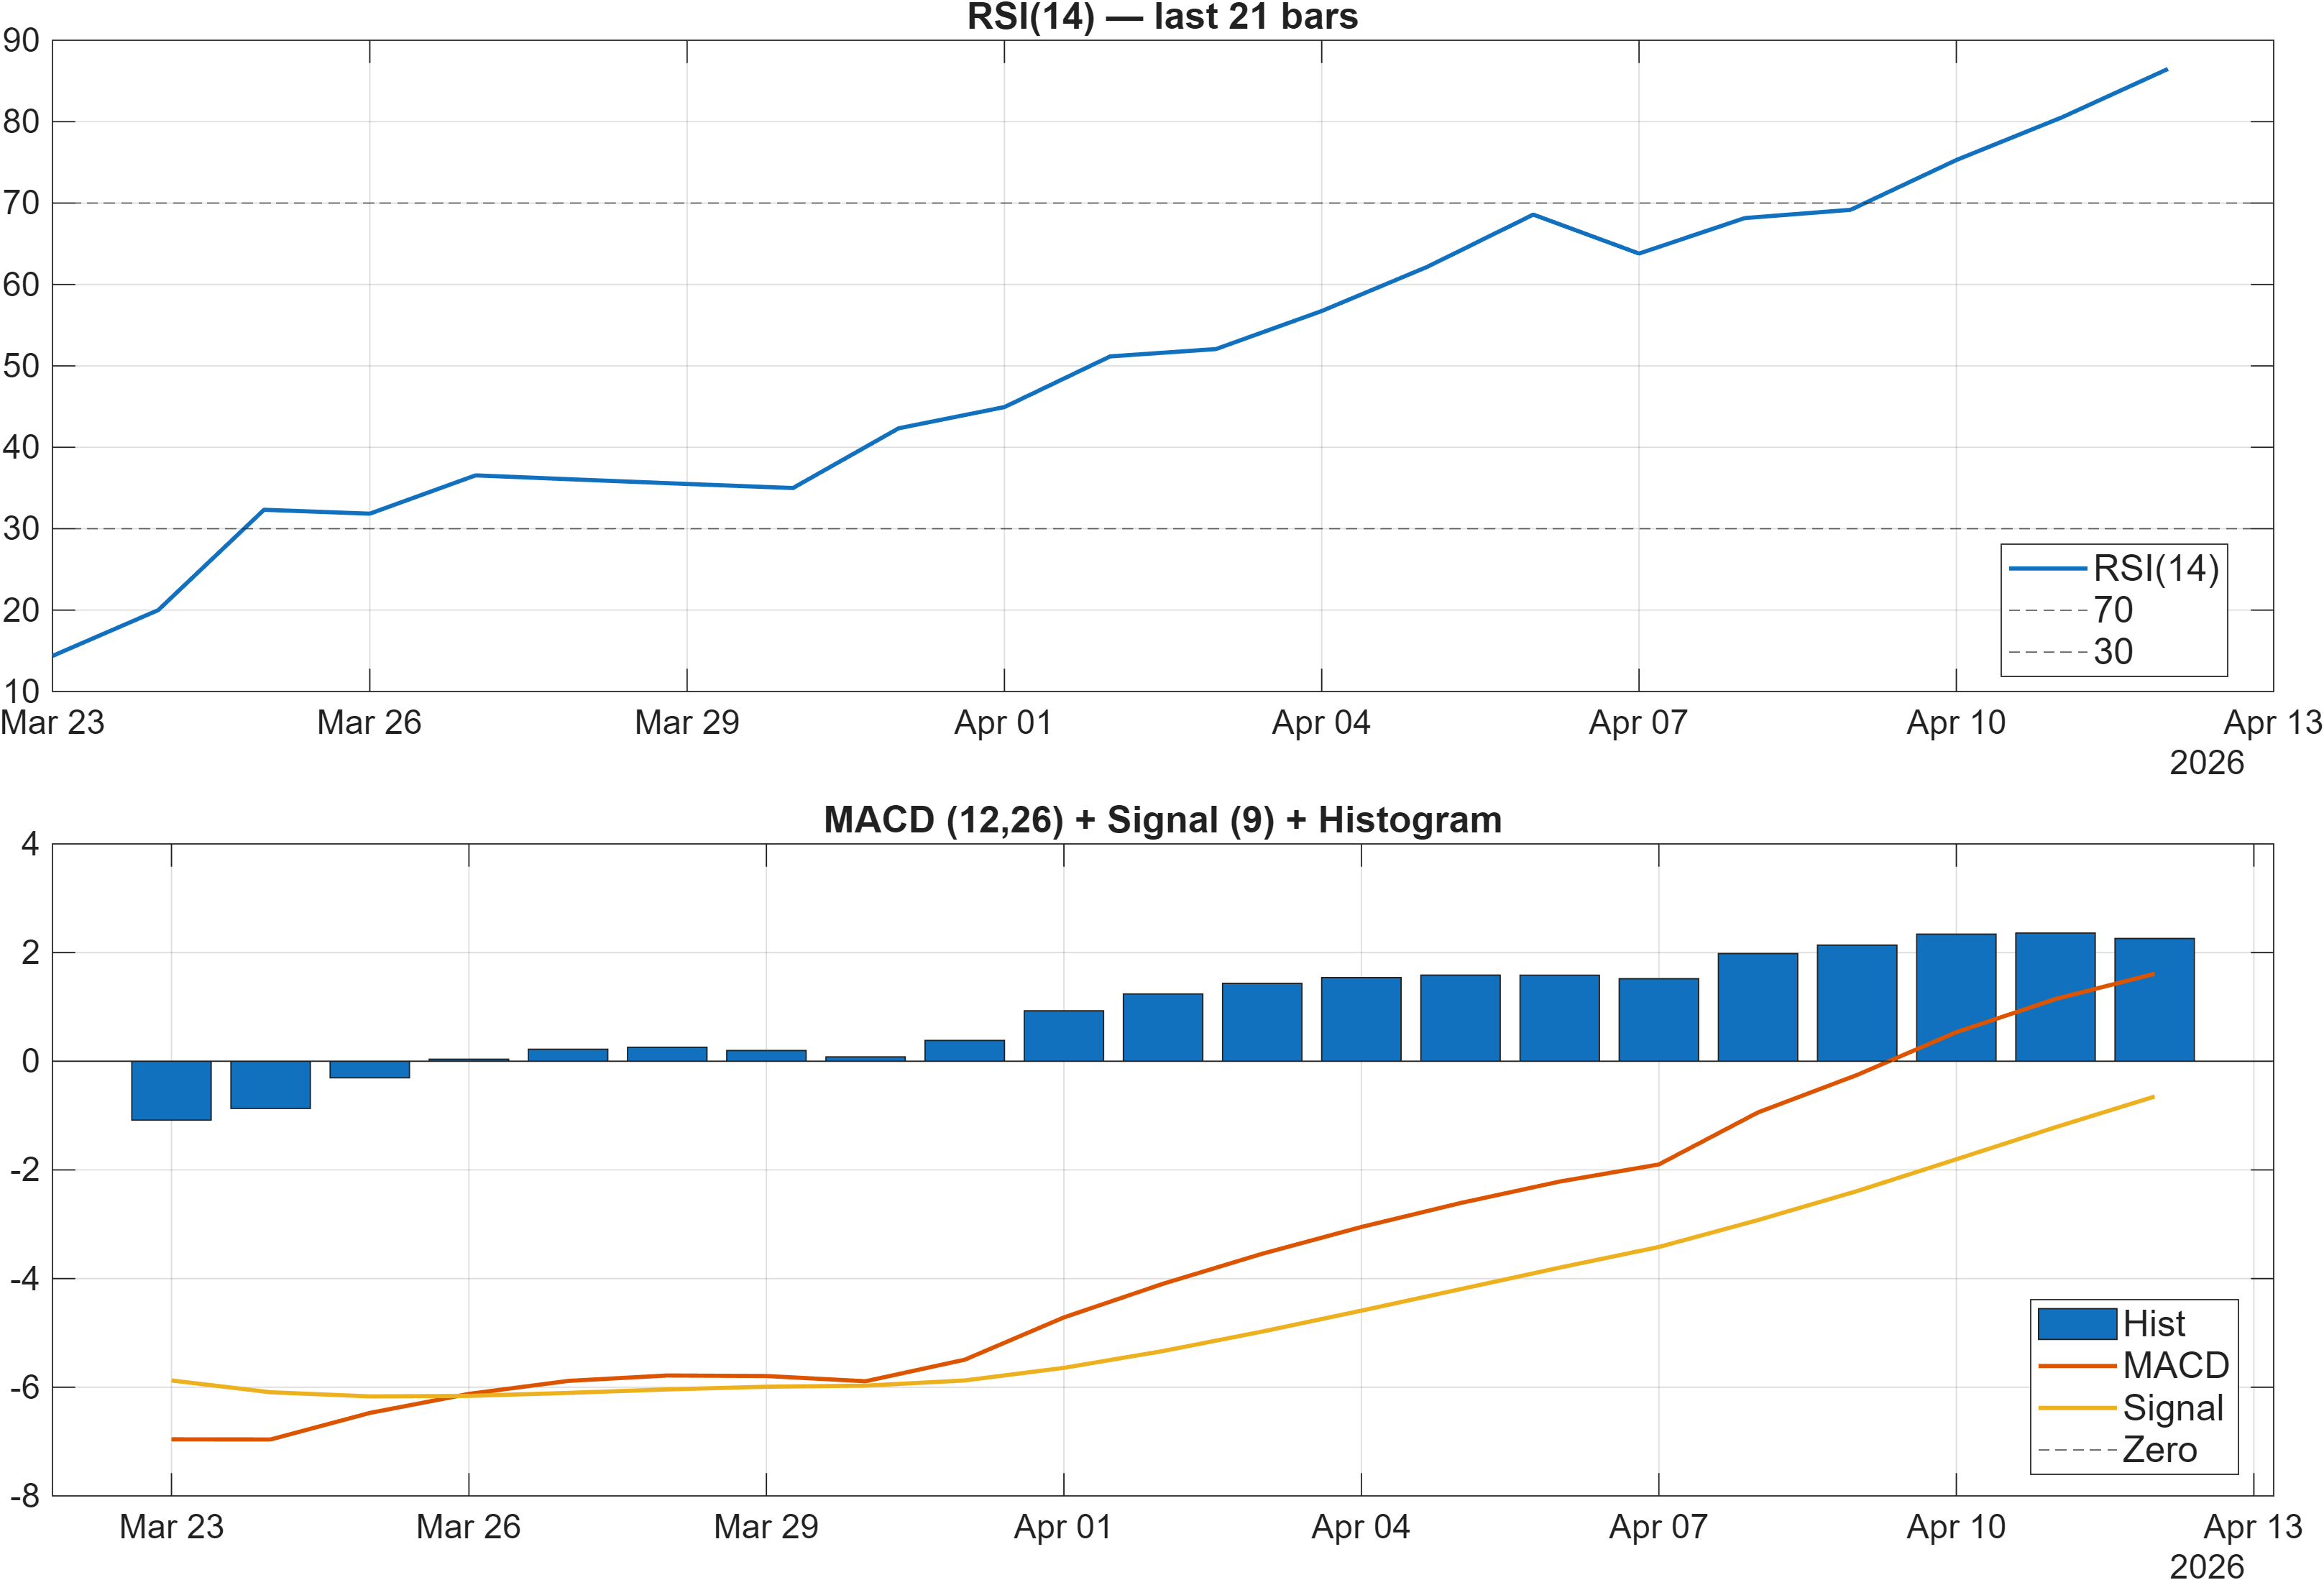
Interpretation: RSI bias = Bullish, MACD hist = 2.2595.
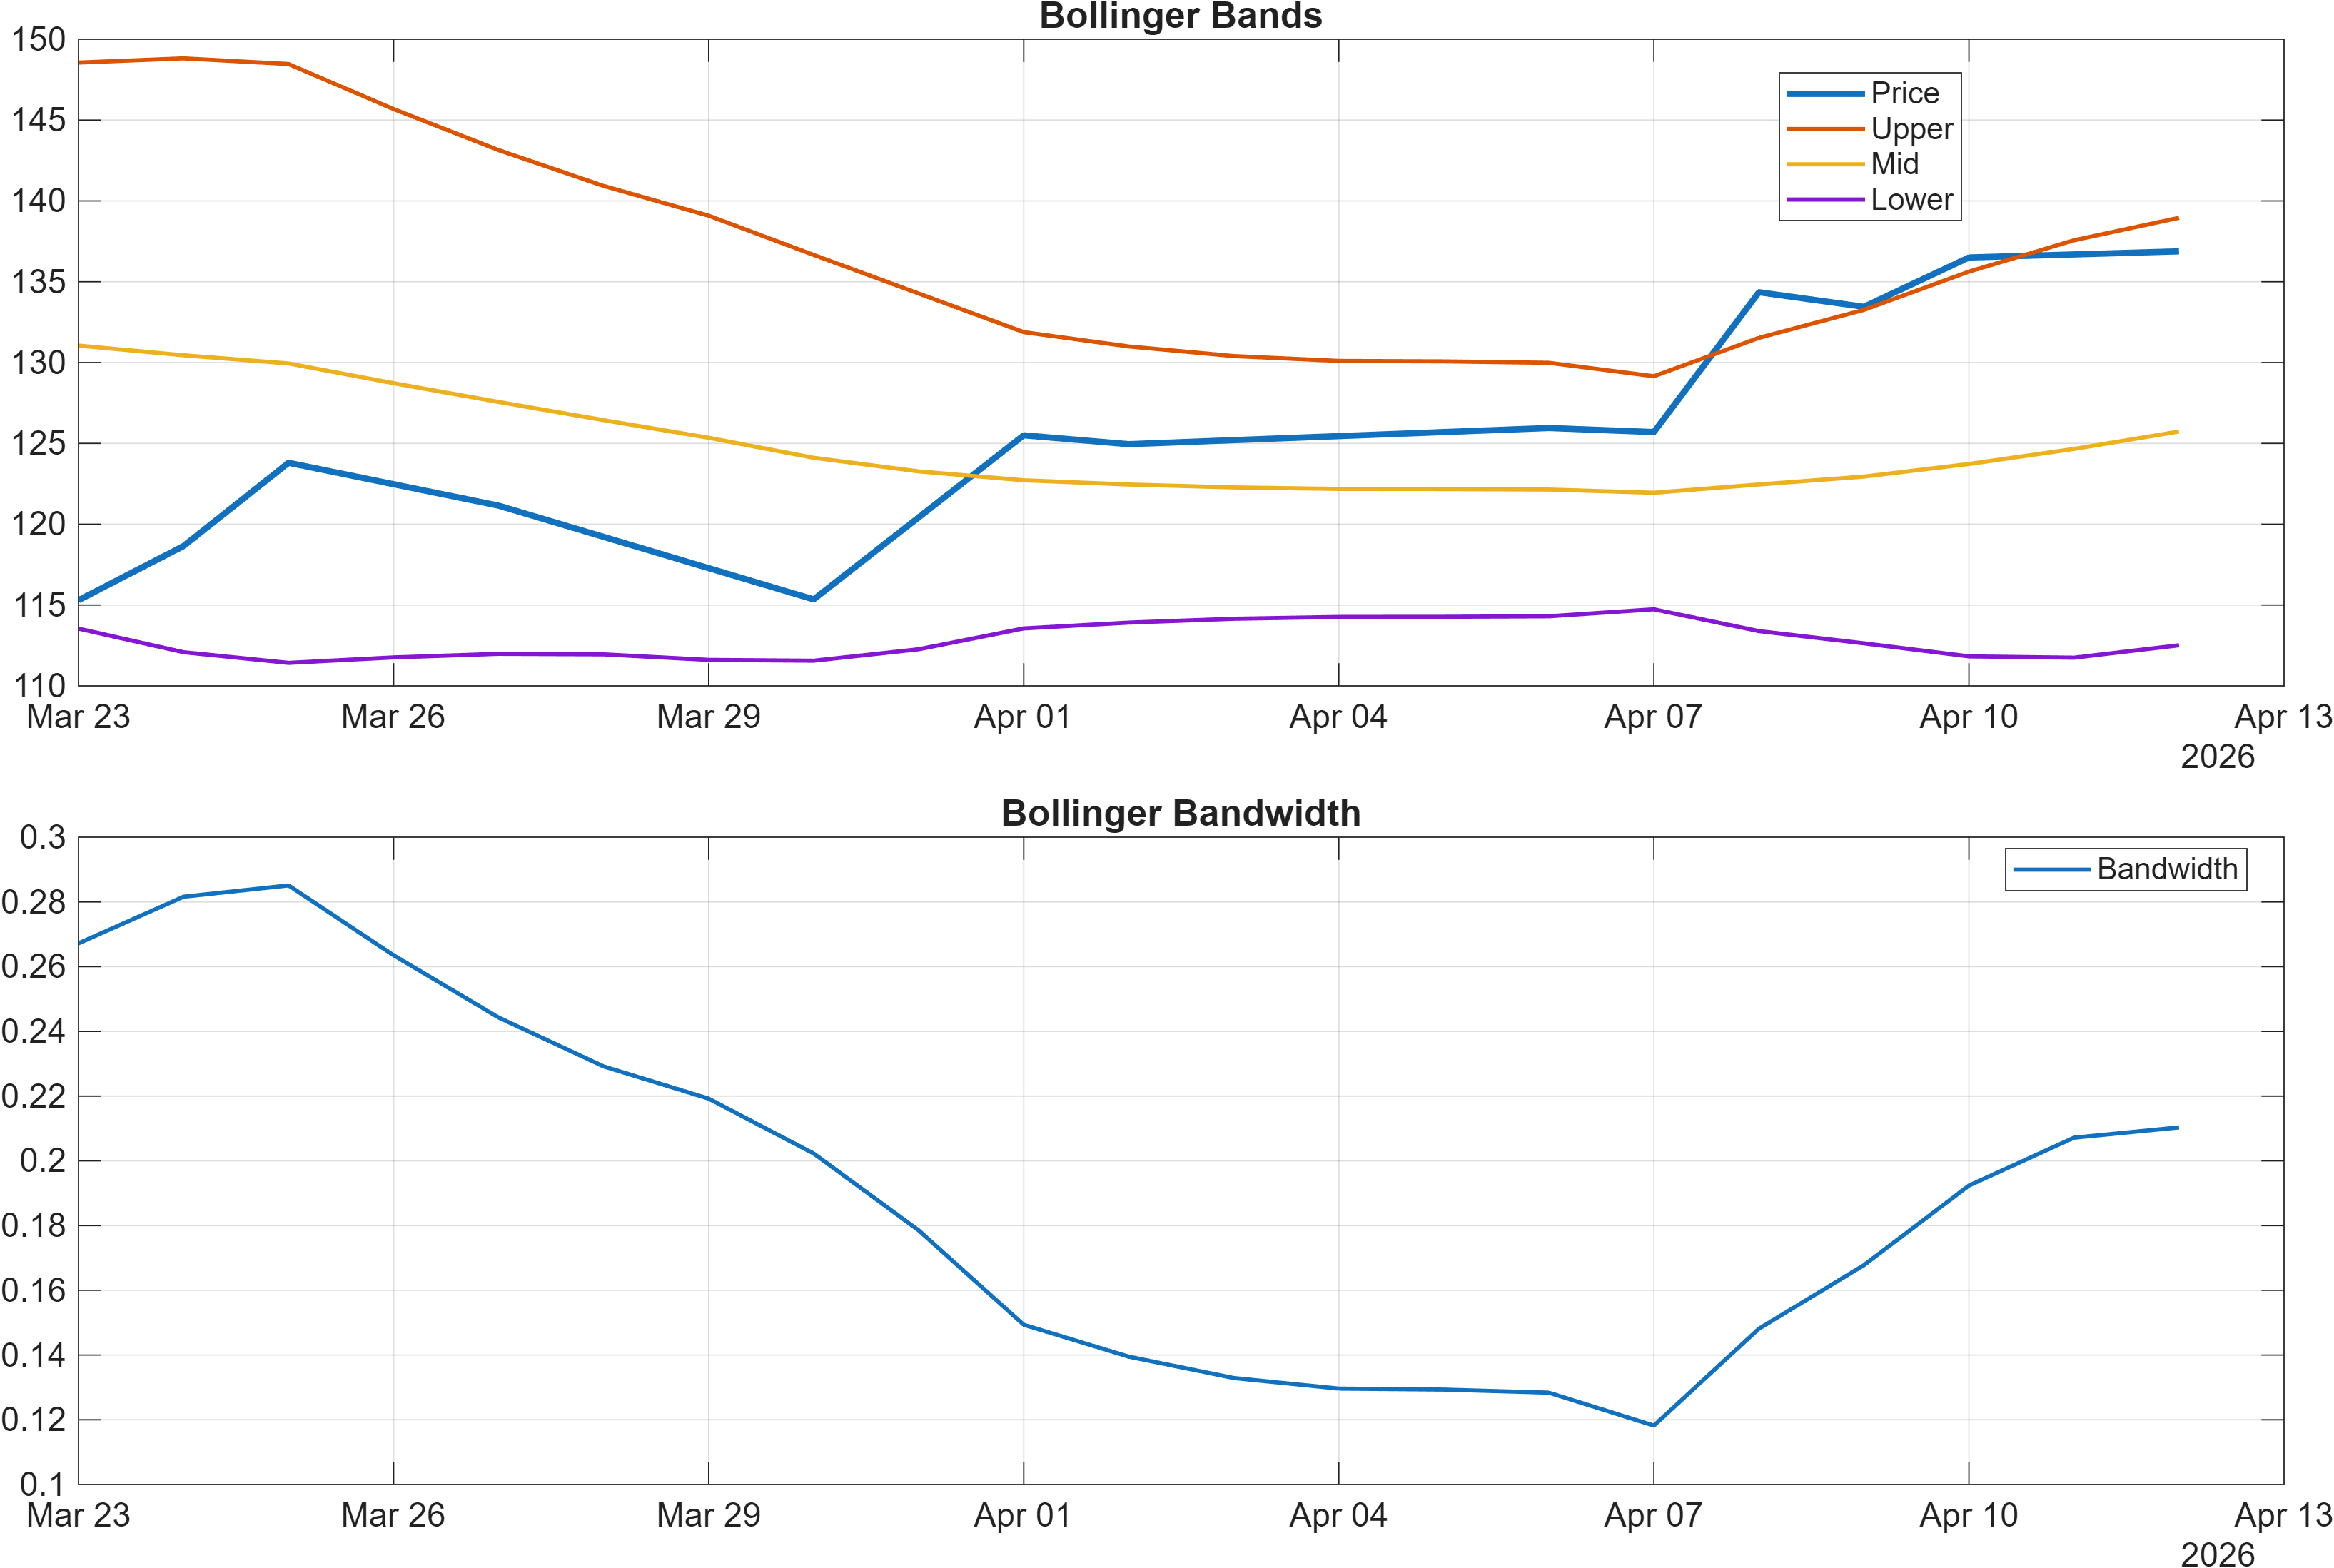
Interpretation: Bandwidth (volatility regime) latest = 0.2103.
Momentum strength with overbought risk: confirmation still matters
Momentum signals are broadly aligned to the upside, but they carry a crowding/extension nuance. RSI is explicitly Bullish, and the signal table shows RSI(14) at 86.47, a level typically associated with strong upside pressure but also a higher probability of short-term pullbacks or consolidation. The MACD histogram (2.2595) and MACD Hist value (2.26) reinforce that the underlying impulse remains positive rather than fading.
Where the dashboard becomes more diagnostic is in the balance between impulse and volatility regime. Bollinger bandwidth is 0.2103 and labeled Neutral, suggesting volatility is not simultaneously expanding in a way that would mechanically confirm a fresh acceleration phase. That mix—strong momentum with a more neutral volatility state—can align with either a steady grind higher or a pause before the next directional attempt.
A second layer comes from short-cycle oscillators: Stoch %K at 85.13 is Bearish, which does not negate the trend but does flag that near-term momentum may be “too far, too fast” relative to recent ranges. This aligns with the weekly Neutral rank (#307) and argues for treating resistance at 153.9000 as a higher-standard confirmation area. If momentum remains strong but fails to convert into a clean breakout, the probability of reverting toward the mid-range (and ultimately monitoring support at 117.8667) rises.
4) Support / Resistance zones
Support ~ 117.8667 | Resistance ~ 153.9000
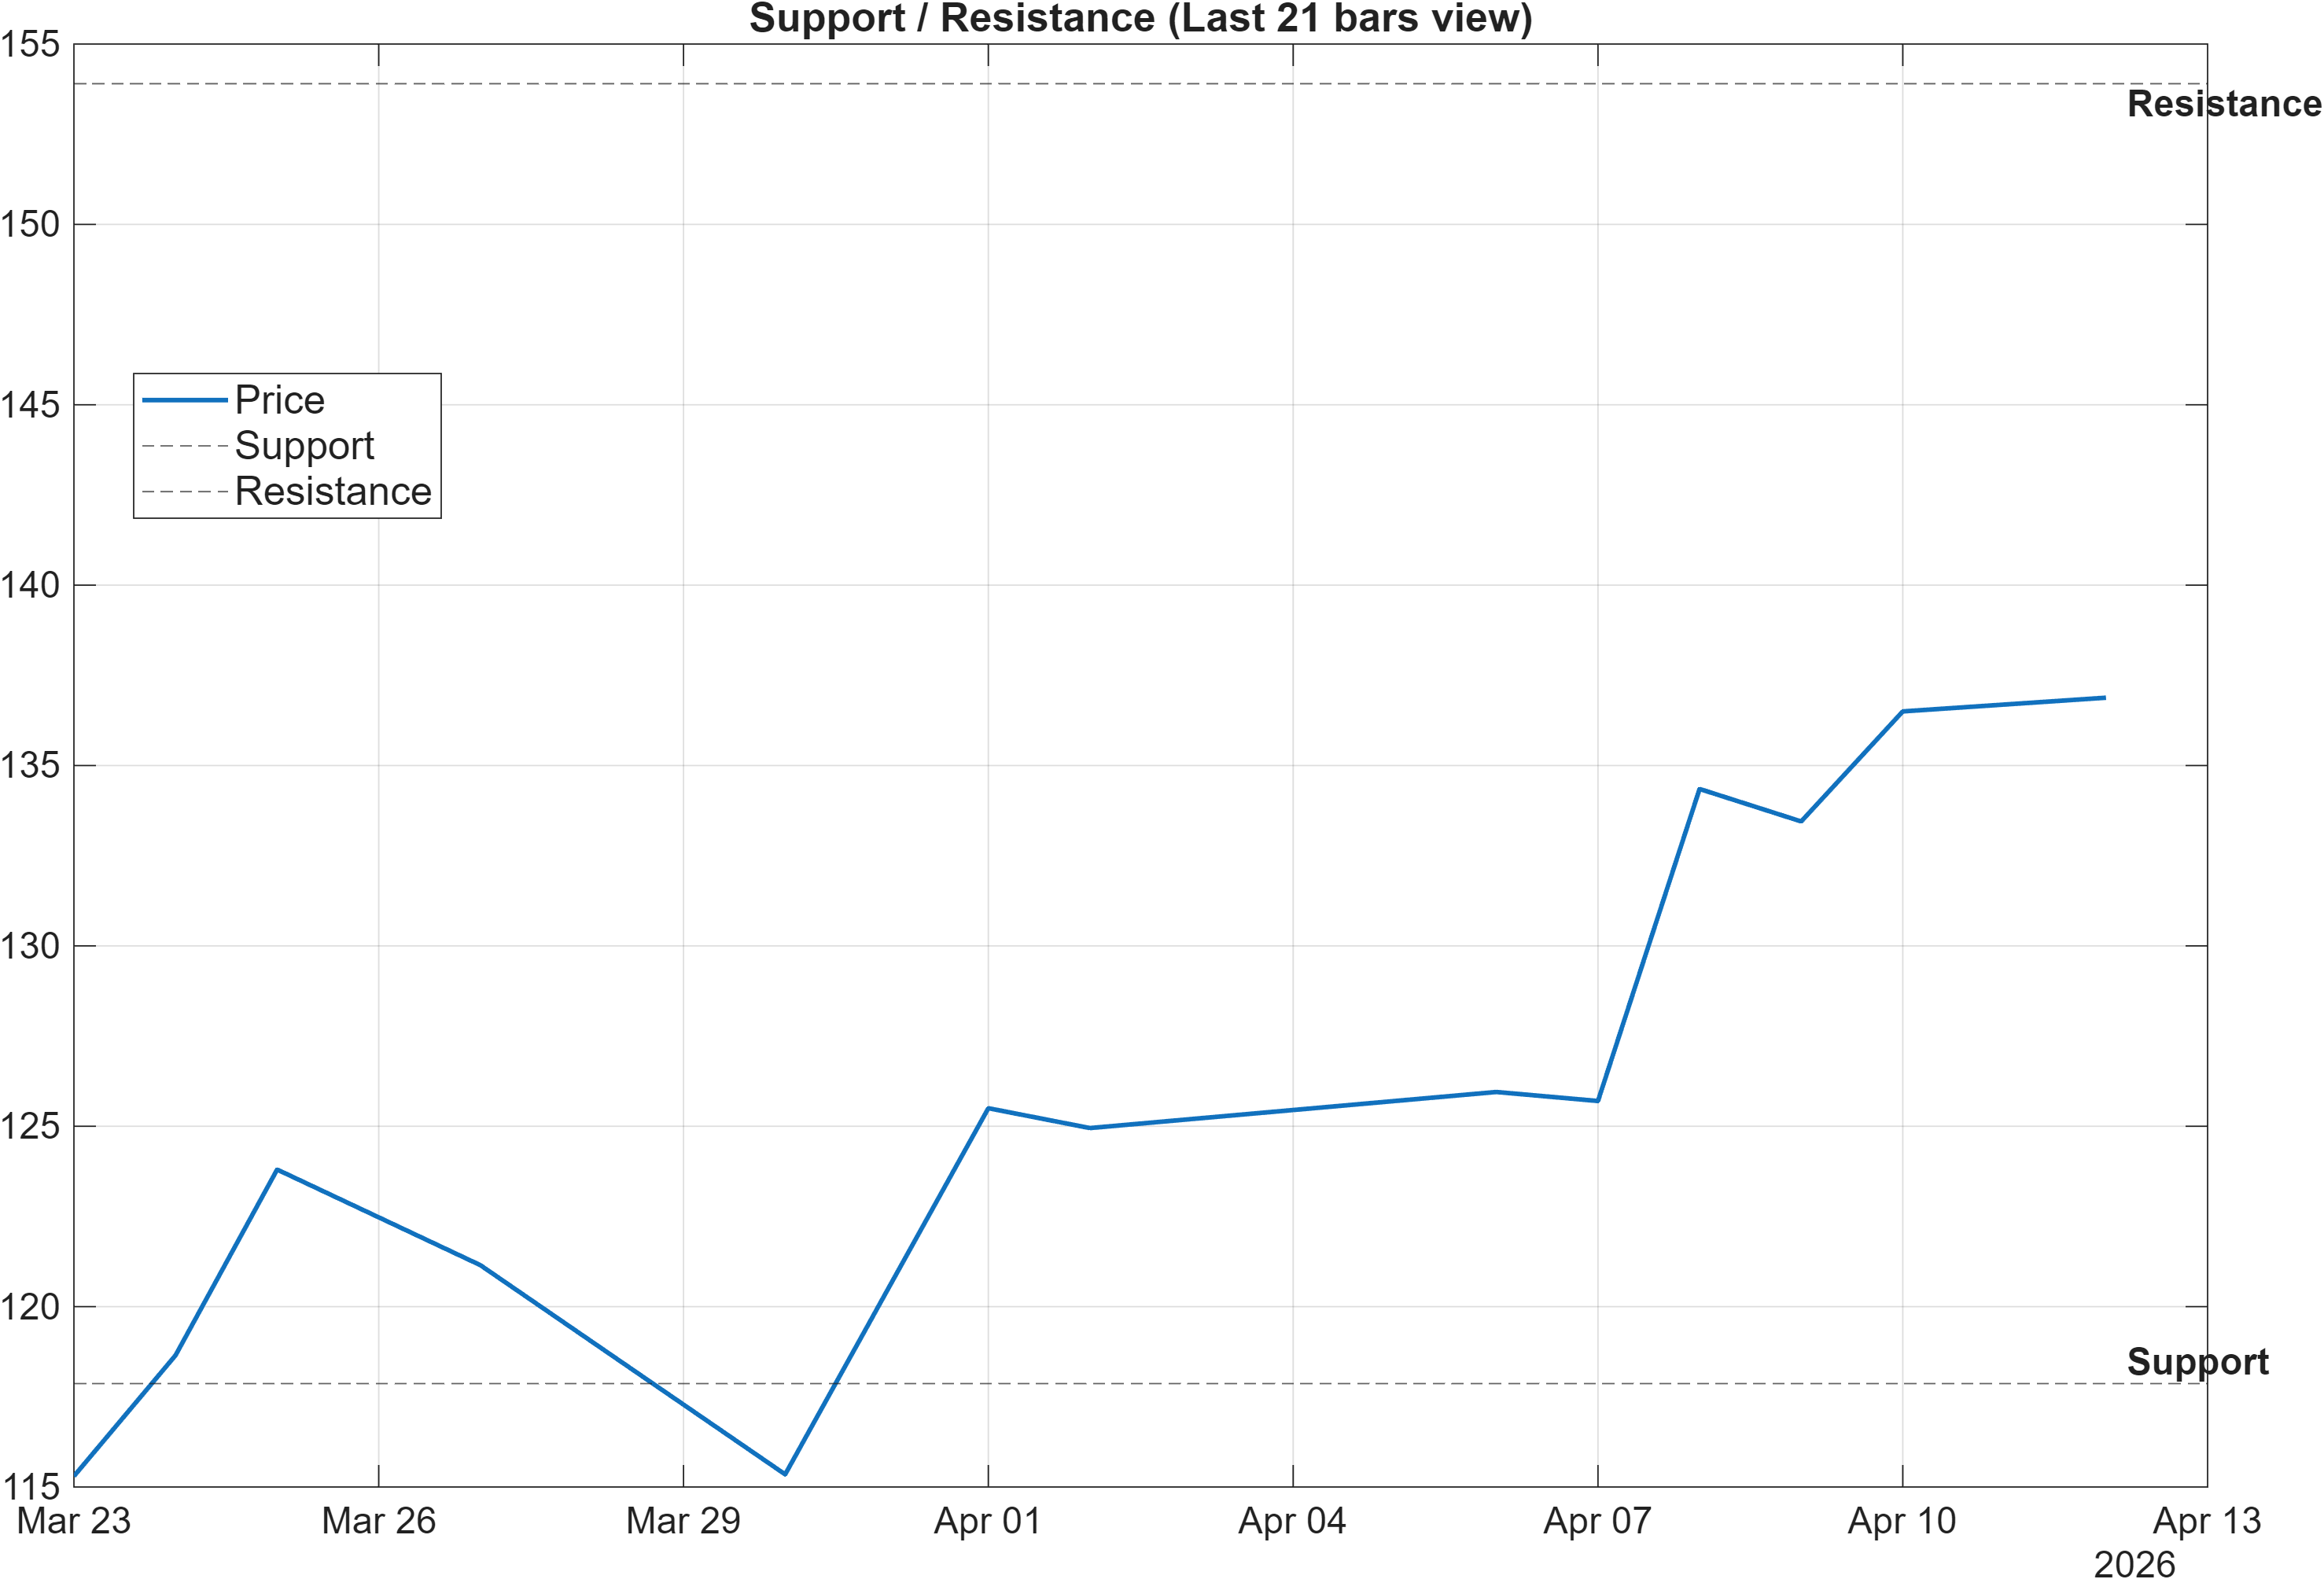
Scenario view: Break above resistance with volume → continuation. Close below support → signal deterioration risk.
Decision zones: mapping continuation vs deterioration
The level structure is clean and provides a disciplined way to reconcile the otherwise mixed trend filters. Resistance ~153.9000 is the principal continuation gate: a break above it is the clearest way to convert the current bullish momentum readings (including MACD hist 2.2595) into a regime that is less dependent on short-cycle indicators staying extended. In a market already showing elevated momentum (e.g., RSI(14) 86.47), a resistance break carries more informational value than incremental oscillator readings.
On the downside, support ~117.8667 is the deterioration threshold. A close below that zone would represent more than routine mean reversion; it would directly conflict with the multi-horizon rank strength—particularly the #22 ranks on the 3-Monthly and Yearly horizons—and would raise the probability that the “longer-horizon leadership” narrative is being repriced. Because the MA relationship (MA50 vs MA200) remains Bearish, a loss of support would also remove a key counterbalance currently coming from the bullish close vs MA50 condition.
The practical read is that IRCON is best assessed through level adherence rather than attempting to fine-tune entries from stretched momentum alone. With volatility regime readings such as BB Width 0.2103 staying Neutral, the market may require a decisive level event (breakout or breakdown) to transition from “constructive but extended” into a clearer directional phase.
5) Quant Technical Dashboard (18 Signals)
KGNAI AI Technical Analysis Score (Deep Reinforcement Learning): Rank #269 out of 1222 (Rank 1 represents the strongest technical positioning and a higher probability of favorable price behavior. As ranks increase toward the maximum, the probability of favorable outcomes weakens and bearish positioning becomes more dominant.) | Label: Neutral | Score: 0.560
18-Signal Technical Confluence Score: 0.611 (Bullish)
Overall Technical Score (18-signal confluence + DRL rank blend): 0.596 (Bullish)
Note: The blended score reflects signal strength weighted against broader AI technical ranking, which may temporarily diverge.
Blended technical score breakdown: 0.596 (Bullish | Bull 13 / Bear 2 / Neutral 3)
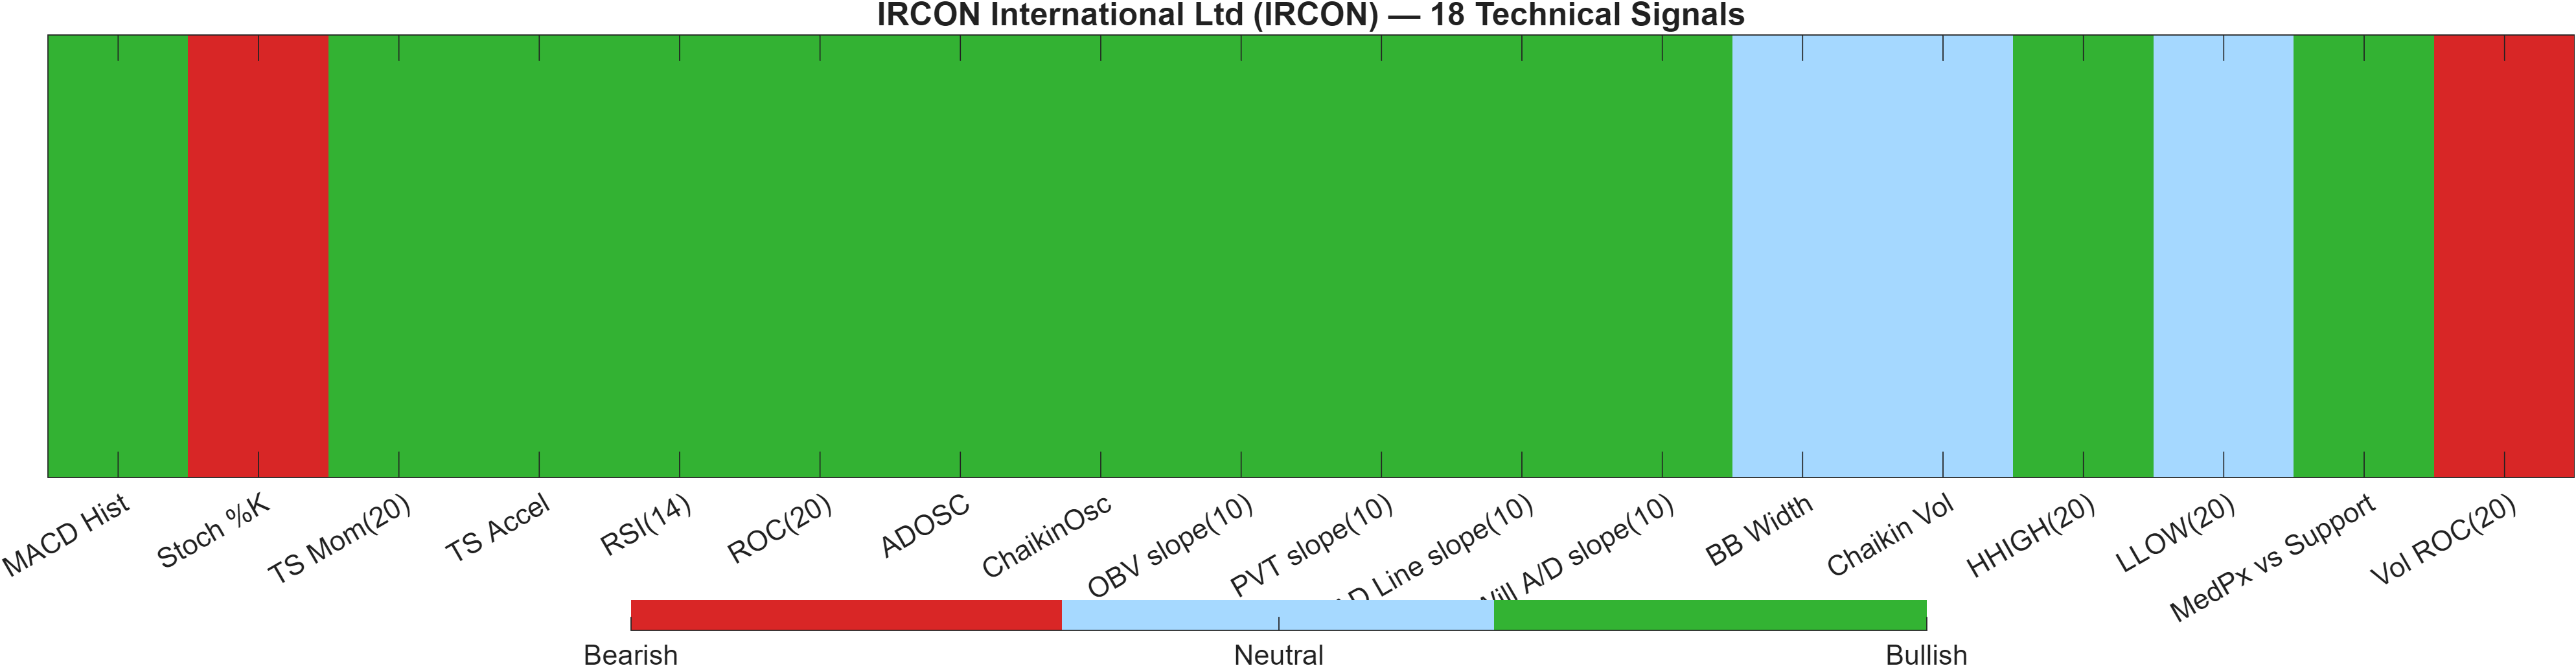
Confluence vs model rank: constructive breadth with a calibrated overlay
The dashboard shows a breadth-positive configuration, with the confluence engine reading 0.611 (Bullish) and the blended technical score at 0.596 (Bullish). Importantly, the blend incorporates an independent model overlay: the DRL technical rank is #269 with a Neutral label and score 0.560. That is a meaningful nuance—confluence is strong, but the model-based cross-sectional technical positioning is less emphatic than the indicator stack alone.
The underlying breadth composition supports the bullish interpretation without being one-dimensional. The blend indicates Bull 13 / Bear 2 / Neutral 3, which typically corresponds to a market state where momentum and participation measures are doing more work than volatility expansion. For example, the signal table includes Bullish readings on accumulation/participation proxies such as ADOSC 68.3 and a Bullish MACD/impulse profile (MACD Hist 2.26). These features matter because they address whether price movement is supported by participation rather than solely by price drift.
The few counter-signals are worth treating as risk controls rather than thesis breakers. With Vol ROC(20) at -34.76 (Bearish), volume change dynamics are not uniformly supportive, even as other volume-related slopes remain constructive. Combined with the elevated oscillator state (RSI(14) 86.47), this argues for respecting the level framework: the technical stack is bullish, but continuation is best “earned” at 153.9000 rather than assumed.
Signal table (Bull/Bear/Neutral)
| Indicator | Value | Signal |
|---|---|---|
| MACD Hist | 2.26 | Bullish |
| Stoch %K | 85.13 | Bearish |
| TS Mom(20) | 17.85 | Bullish |
| TS Accel | 33.1 | Bullish |
| RSI(14) | 86.47 | Bullish |
| ROC(20) | 15.36 | Bullish |
| ADOSC | 68.3 | Bullish |
| ChaikinOsc | 1.158e+05 | Bullish |
| OBV slope(10) | 8.781e+05 | Bullish |
| PVT slope(10) | 2.732e+04 | Bullish |
| AD Line slope(10) | 7.027e+05 | Bullish |
| Will A/D slope(10) | 25.15 | Bullish |
| BB Width | 0.2103 | Neutral |
| Chaikin Vol | -11.44 | Neutral |
| HHIGH(20) | 139.4 | Bullish |
| LLOW(20) | 114.9 | Neutral |
| MedPx vs Support | 18.73 | Bullish |
| Vol ROC(20) | -34.76 | Bearish |
Interpretation: Indicator-level signals form the base confluence, which is then adjusted using a separate AI-driven technical ranking model. The final technical score summarizes this combined view.
6) News sentiment + extractive gist
Note: Instrument-specific news matches were not found, so the digest includes broader market/sector headlines. Links are provided for verification.
Sentiment score (avg): 0.191 | Positive: 56% | Neutral: 44% | Negative: 0%
KGNAI AI News Sentiment Score (normalized -1 to +1): Not available (as of —) | Label: Not available | Overall news score: 0.19
Positive Developments
Recent coverage across major financial outlets indicates a constructive tone in the broader Indian market narrative, with frequent emphasis on tactical stock selection and continued participation in select segments. Within the sentiment breakdown, the absence of negative classification (0% negative) and a majority positive split (56% positive) supports a mild positive bias rather than a euphoric one. For IRCON, this context matters primarily as a background condition: when the technical stack is already bullish (e.g., overall technical score 0.596), marginally supportive sentiment can reduce the likelihood that short-term pullbacks immediately become sustained risk-off moves. Still, because the news set is not instrument-specific in the provided data, this should be treated as macro/sector backdrop, not a direct catalyst read-through.
Neutral / Mixed Developments
The neutral component remains sizable at 44%, consistent with a market that is absorbing mixed signals—corporate action calendars and positioning commentary can coexist with uncertainty without forcing a directional change. For a chart that is momentum-strong (e.g., MACD hist 2.2595 and Bullish RSI bias), neutral news flow often aligns with technical-led trading: price tends to respond more to levels and liquidity than to incremental headlines. That interpretation also fits the short-term ranking profile where the Weekly rank (#307) is Neutral despite strong longer-horizon ranks, implying the market may be in a “wait for confirmation” phase.
Negative / Risk Signals
While the quantified sentiment bucket shows 0% negative, risk should not be inferred away. The key risk signal here is the lack of instrument-specific matches in the provided data, which limits the ability to map sentiment changes directly to IRCON. In such cases, sentiment can lag or fail to capture name-specific inflections that show up first in price/volume. From a positioning standpoint, technical overextension signals—such as RSI(14) 86.47 and Bearish Stoch %K 85.13—can become the effective “risk headline,” particularly near resistance ~153.9000. If broader market tone deteriorates, it typically expresses first as failure at resistance and then as deeper mean reversion toward the defined support zone.
- Reaction quality near 153.9000 (break/hold vs rejection) alongside volume behavior.
- Whether momentum cools without breaking structure (RSI/MACD stability while price respects key levels).
- Any shift in coverage that becomes instrument-specific; otherwise treat sentiment as backdrop only.
Snapshot: AI Rank (Short–Mid–Long): Mixed (Bullish tilt) (Neutral–Bullish–Bullish) · Technical Confluence: Bullish · Key Levels: Support ~117.87 | Resistance ~153.90 · News Sentiment: Positive
Sources referenced: Reuters, Bloomberg, Yahoo Finance, MarketWatch, Investing.com
7) Sources
- Madhusudan Kela picks beaten-down smallcap bets; buys Indiabulls, Simplex Infra in Q4 — https://economictimes.indiatimes.com/markets/stocks/news/madhusudan-kela-picks-beaten-down-smallcap-bets-buys-indiabulls-simplex-infra-in-q4/articleshow/130190449.cms
- D-Street Week Ahead: Nifty extends rebound; Godfrey Phillips signals breakout after base formation — https://economictimes.indiatimes.com/markets/stocks/news/d-street-week-ahead-nifty-extends-rebound-godfrey-phillips-signals-breakout-after-base-formation/articleshow/130190393.cms
- Bitcoin climbs to $73K after rangebound move, softer CPI data supports upside — https://economictimes.indiatimes.com/markets/cryptocurrency/bitcoin-climbs-to-73k-after-rangebound-move-softer-cpi-data-supports-upside/articleshow/130189039.cms
- F&O Talk: Nifty's 6% gains are strongest since February 2021. Is it pullback or trend-reversal? — https://economictimes.indiatimes.com/markets/options/fo-talk-niftys-6-gains-are-strongest-since-february-2021-is-it-pullback-or-trend-reversal/articleshow/130188466.cms
- Aurobindo Pharma share buyback, Muthoot Fin dividend, 2 other corporate actions next week — https://economictimes.indiatimes.com/markets/stocks/news/aurobindo-pharma-share-buyback-muthoot-fin-dividend-2-other-corporate-actions-next-week/slideshow/130188906.cms
- West Asia turmoil priced in; India’s long-term story intact, says Sunil Singhania — https://economictimes.indiatimes.com/markets/expert-view/west-asia-turmoil-priced-in-indias-long-term-story-intact-says-sunil-singhania/articleshow/130188816.cms
- Nifty holds 24,000; 23,700 key support as Akshay Bhagwat bets on Power Grid, Adani Ports — https://economictimes.indiatimes.com/markets/expert-view/nifty-holds-24000-23700-key-support-as-akshay-bhagwat-bets-on-power-grid-adani-ports/articleshow/130186908.cms
- UltraTech Cement, HPCL among 5 stocks Emkay adds to model portfolio; upside seen at 118% — https://economictimes.indiatimes.com/markets/stocks/news/ultratech-cement-hpcl-among-5-stocks-emkay-adds-to-model-portfolio-upside-seen-at-118/slideshow/130186856.cms
You may also like: How KGNAI AI ranks instruments across global markets
Disclaimer: KGNAI provides AI-generated analytics and educational market commentary only. This is not financial advice. Markets involve risk. Always do your own research.