
BANKBARODA (Bank of Baroda) — 20-Mar-2026 Technical Snapshot Shows Bearish Confluence Within a Consolidation Regime
Bank of Baroda (BANKBARODA) is currently characterized by a rank profile that skews neutral across most horizons while technical signal alignment remains decisively bearish. Within a 1222-instrument India universe, the daily rank (#385) and weekly rank (#522) sit in the neutral range, while the monthly rank (#228) is comparatively stronger (upper-quartile behavior relative to the universe). This mixed regime is reinforced by price/MA positioning that is bearish vs MA50 but constructive in MA50 vs MA200, consistent with a consolidation phase rather than a clean trend. Momentum diagnostics are heavy: RSI(14) at 25.43 and MACD histogram at -1.8732 point to weak near-term impulse, even as volatility remains controlled with Bollinger bandwidth at 0.1717. Key decision zones remain clearly defined at support ~276.8500 and resistance ~315.9000.
- Short / Mid / Long rank stance: Neutral / Neutral / Neutral (daily #385, weekly #522, yearly #459; monthly #228 is comparatively stronger)
- Technical confluence label: Bearish (18-signal confluence -0.611; overall technical score -0.680)
- Key levels: Support 276.8500 | Resistance 315.9000
- News sentiment bias: Bullish (normalized score 0.96; avg sentiment 0.037 with 31% positive / 50% neutral / 19% negative)
- Confirmation / invalidation condition: A sustained break above 315.9000 with volume supports continuation; a close below 276.8500 increases deterioration risk
KGNAI evaluates assets using large cross-sectional datasets built from millions of structured data points. Inputs incorporate fundamental metrics, technical structures, and systematically processed news sentiment. Statistical models, machine learning, and AI frameworks are used to assess relative positioning, signal alignment, and probabilistic behavior across broad universes.
- Ranks are comparative across the tracked universe, not absolute price targets.
- Confluence reflects alignment among independent signal groups.
- Support/resistance levels are probabilistic decision zones, not guarantees.
- Sentiment provides contextual bias within the broader analytical framework.
1) KGNAI AI Analysis
Region: INDIA
Total universe size: 1222 ranked instruments
- Daily rank: #385 out of 1222 — Neutral
- Weekly rank: #522 out of 1222 — Neutral
- Monthly rank: #228 out of 1222 — Bullish
- 3-Monthly rank: #260 out of 1222 — Neutral
- 6-Monthly rank: #445 out of 1222 — Neutral
- Yearly rank: #459 out of 1222 — Neutral
The rank stack is best read as time-horizon dispersion rather than a single directional message. BANKBARODA’s monthly rank (#228) sits in the upper quartile of the 1222-instrument universe, while the daily (#385) and weekly (#522) ranks remain neutral—suggesting that the longer swing profile is holding up better than the immediate tape. The 3-month rank (#260) remains supportive but not dominant, while the 6-month (#445) and yearly (#459) ranks drift toward the mid-to-lower half of the universe, consistent with a market that has not re-established persistent leadership.
Importantly, the report’s term view aggregates this dispersion into a Neutral / Neutral / Neutral stance across short-, mid-, and long-term buckets. That is a “resolution-required” state: the instrument is not screening as structurally strong enough to carry bullish conviction across horizons, but it is also not ranking as a persistent laggard.
The practical implication is that the rank system is detecting non-uniform behavior across timeframes. When monthly strength (rank #228) coexists with neutral-to-weaker longer ranks (yearly #459), the burden of proof shifts to price structure and confirmation around major levels. Until the ranks compress in one direction, this profile tends to be sensitive to volatility shifts and support/resistance outcomes rather than trend-follow-through.
2) Price & trend overview
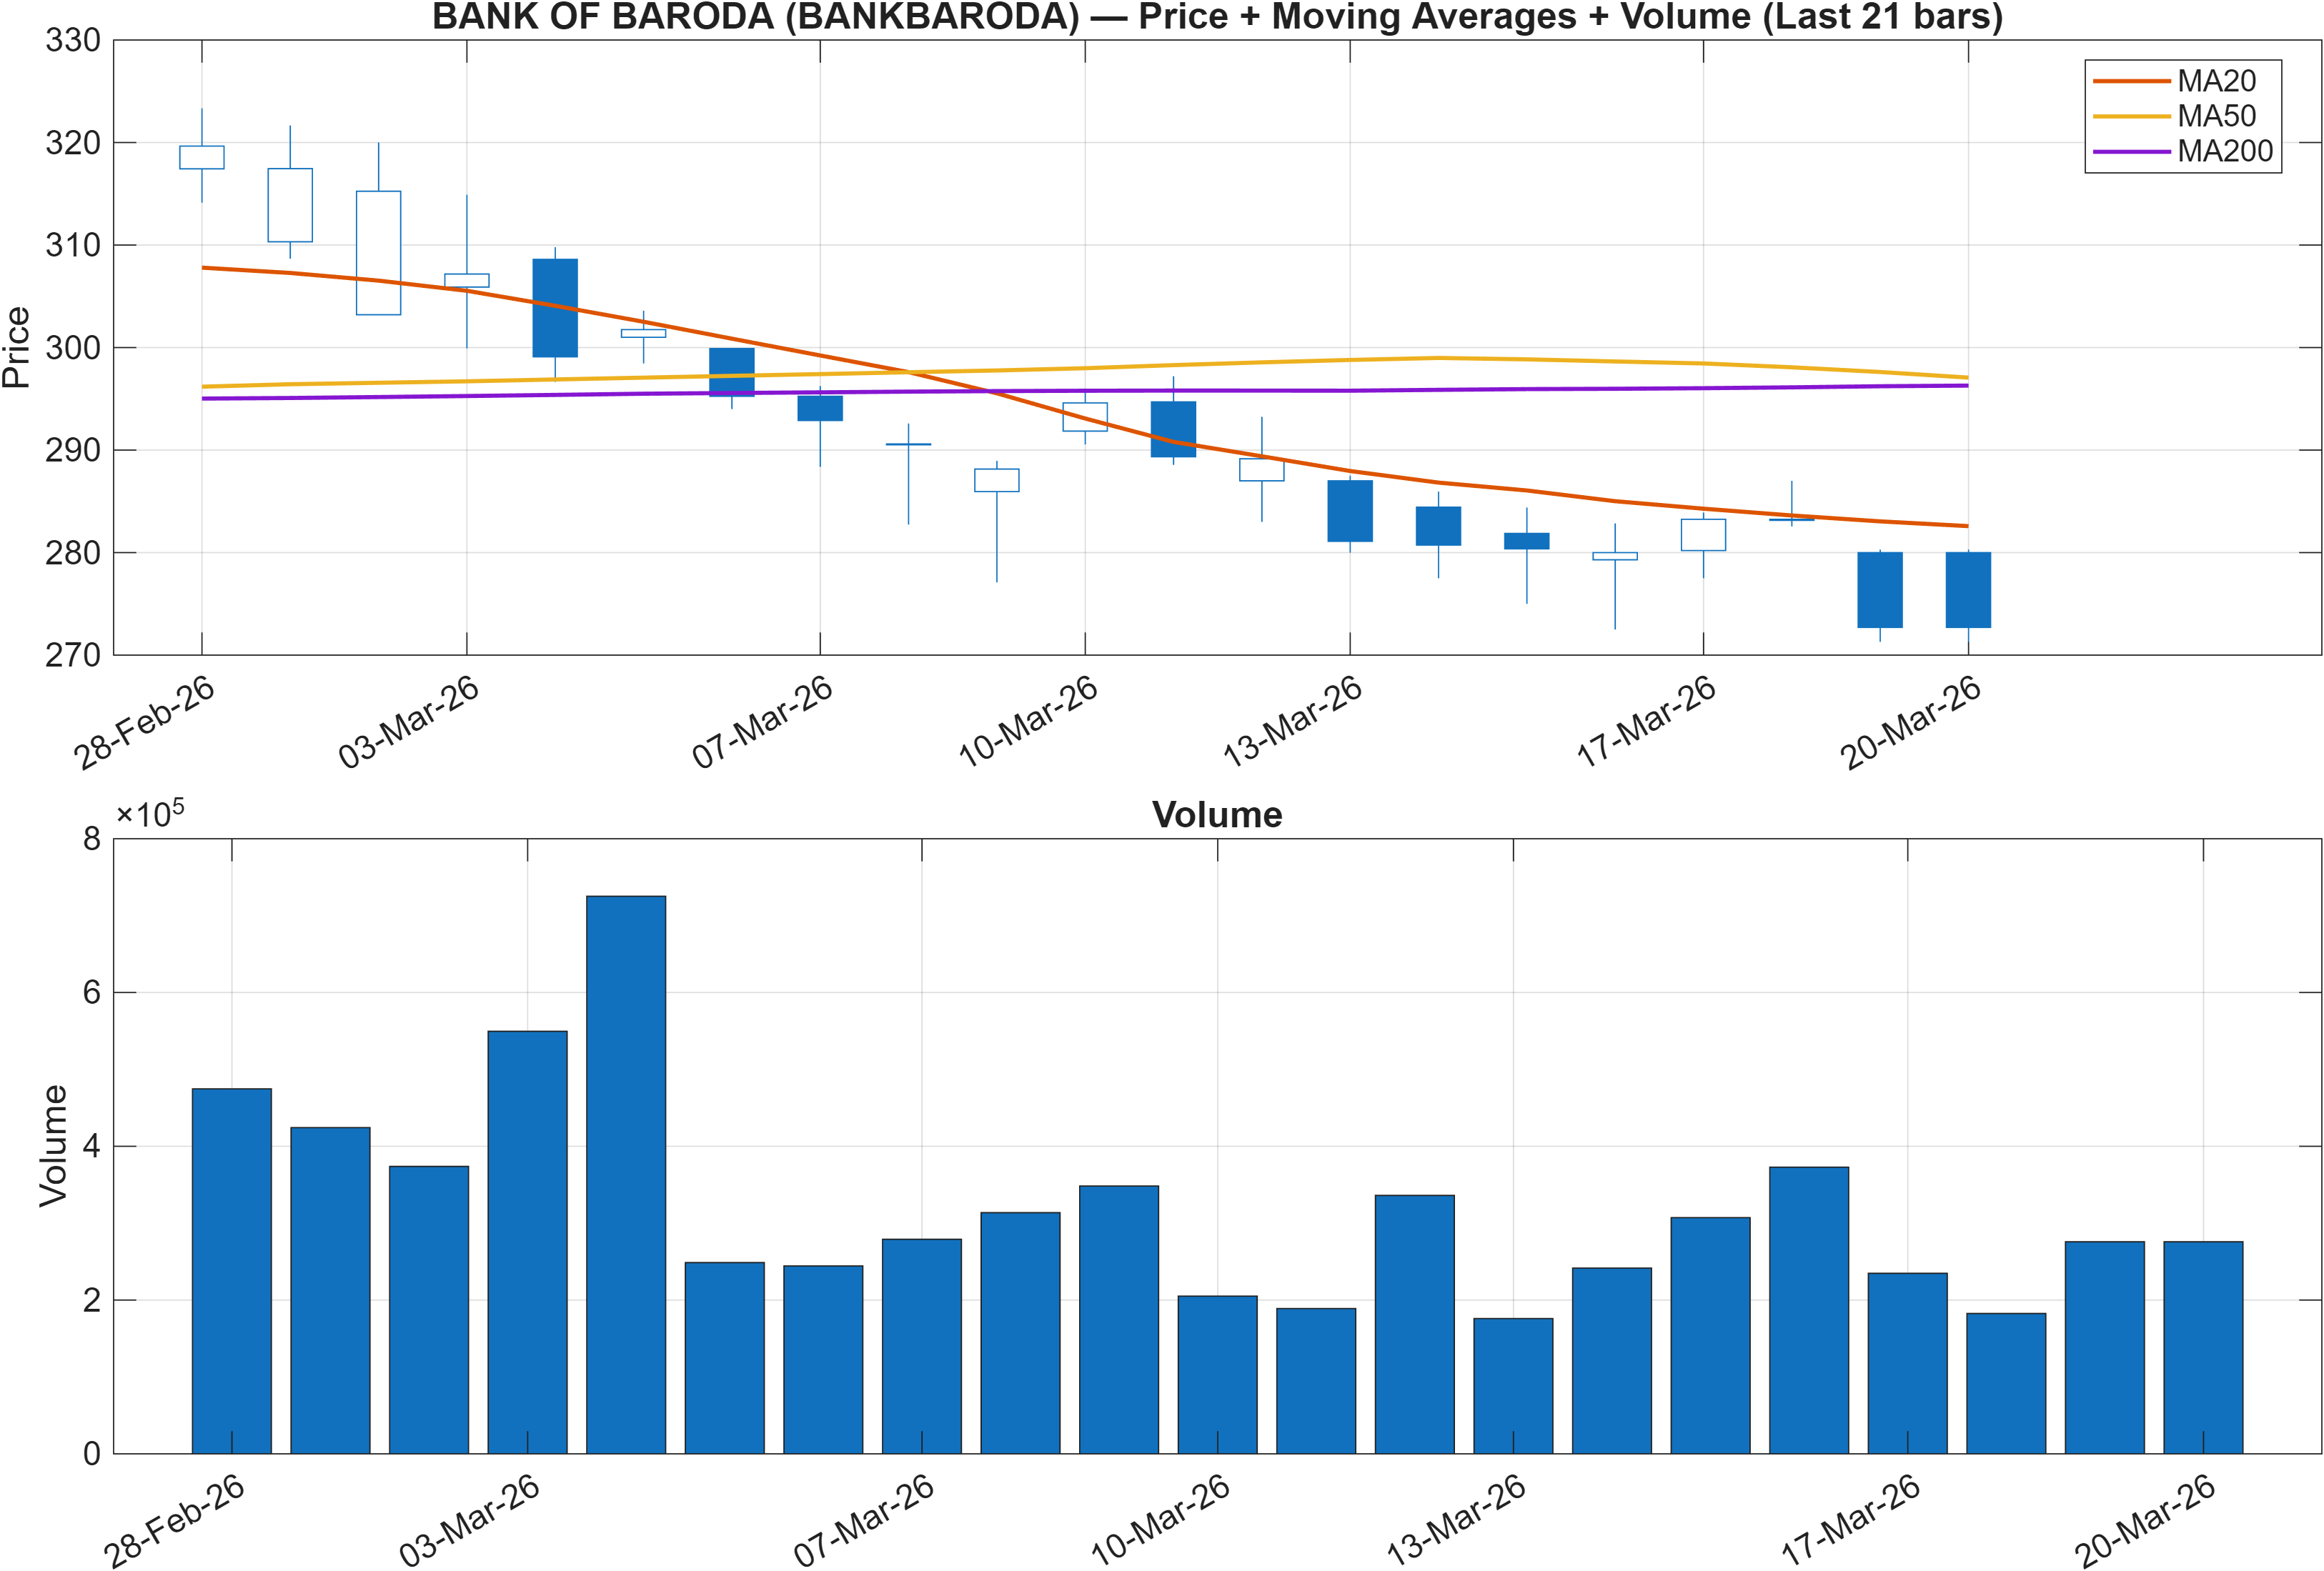
Interpretation: Close vs MA50 = Bearish, MA50 vs MA200 = Bullish.
Trend alignment: short-term weakness against a longer-term base
The moving-average configuration describes a two-speed tape. On one hand, the close vs MA50 is bearish, which typically aligns with near-term distribution pressure and failed rebounds. On the other hand, MA50 vs MA200 is bullish, a condition more consistent with a broader base that has not fully broken down. This split often corresponds to consolidation phases where short-term rallies struggle, yet the longer structure still resists a full trend reversal.
This price/MA split also fits the rank dispersion: the monthly rank (#228) suggests a better intermediate profile than the weekly rank (#522), while the longer ranks (for example yearly #459) indicate the instrument is not persistently outperforming across the full cycle. In those conditions, mean-reversion dynamics can dominate, with the market repeatedly testing boundaries rather than trending cleanly.
From a market-structure standpoint, consolidation regimes tend to demand confirmation via level breaks and volume participation, not merely indicator improvement. The report’s key zones—276.8500 as support and 315.9000 as resistance—become the anchor points for evaluating whether the MA50 bearishness is an early warning of deeper weakness or simply a temporary drawdown within a longer base.
3) Momentum & volatility dashboard
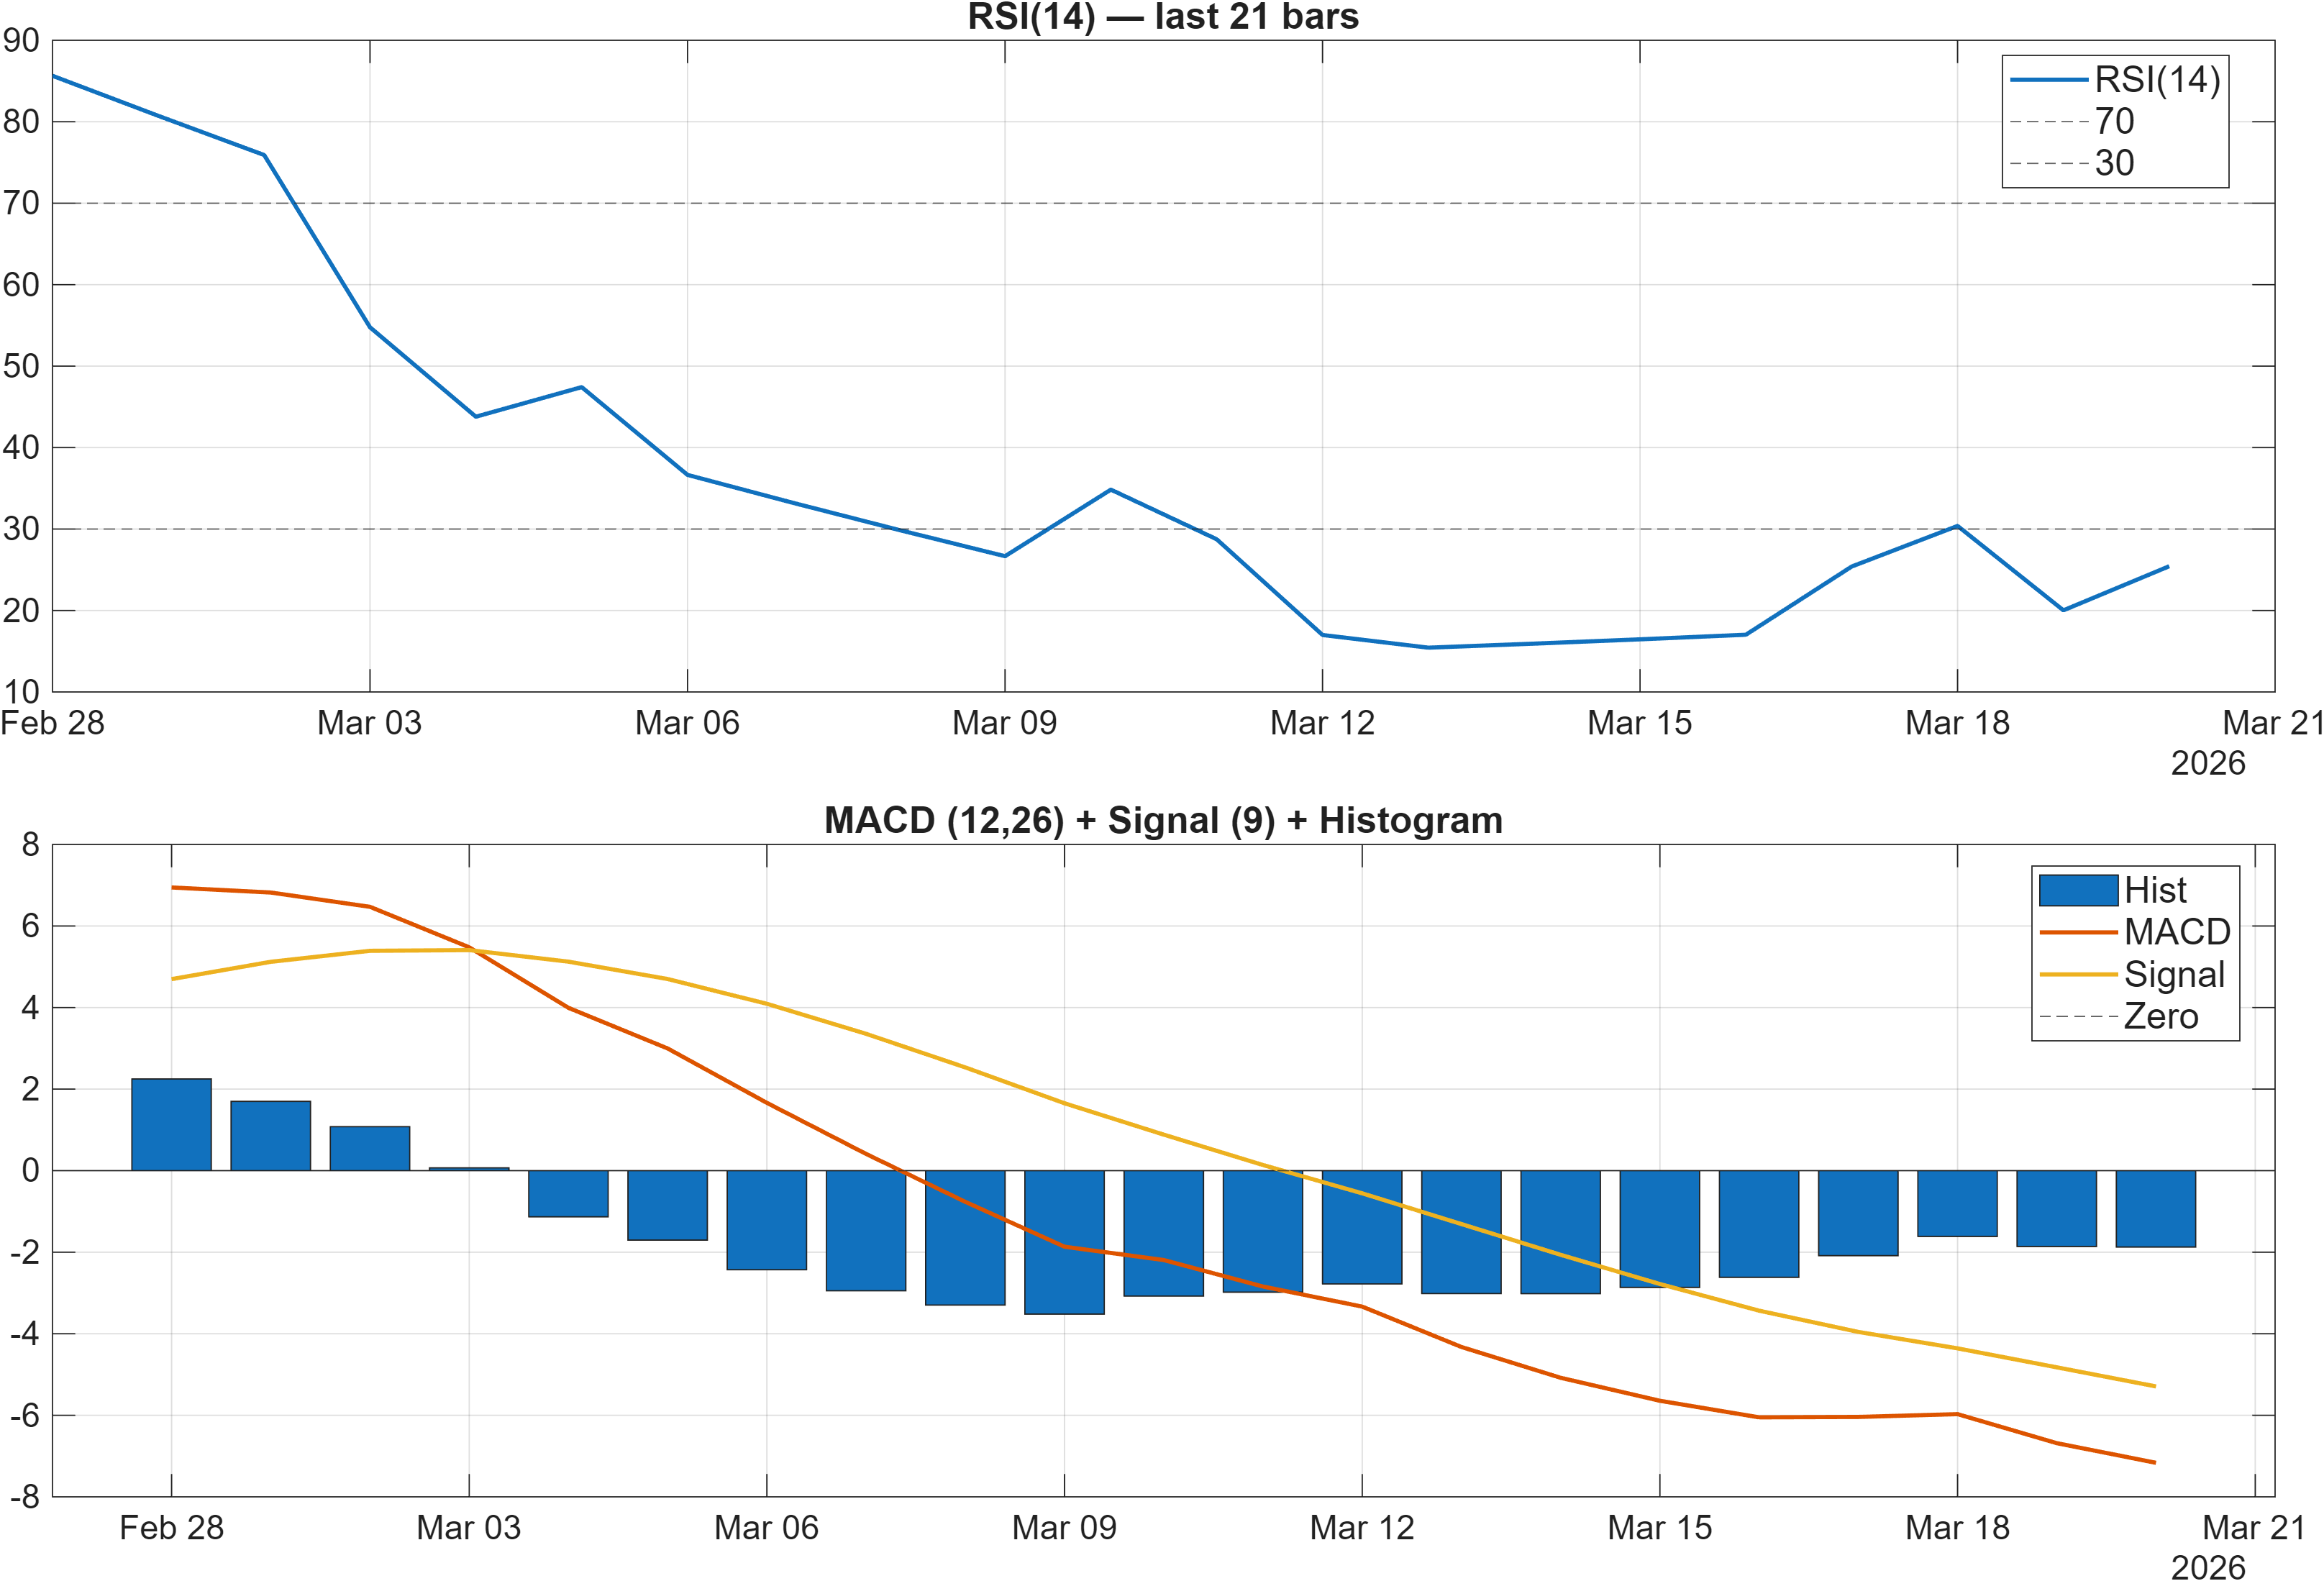
Interpretation: RSI bias = Bearish, MACD hist = -1.8732.
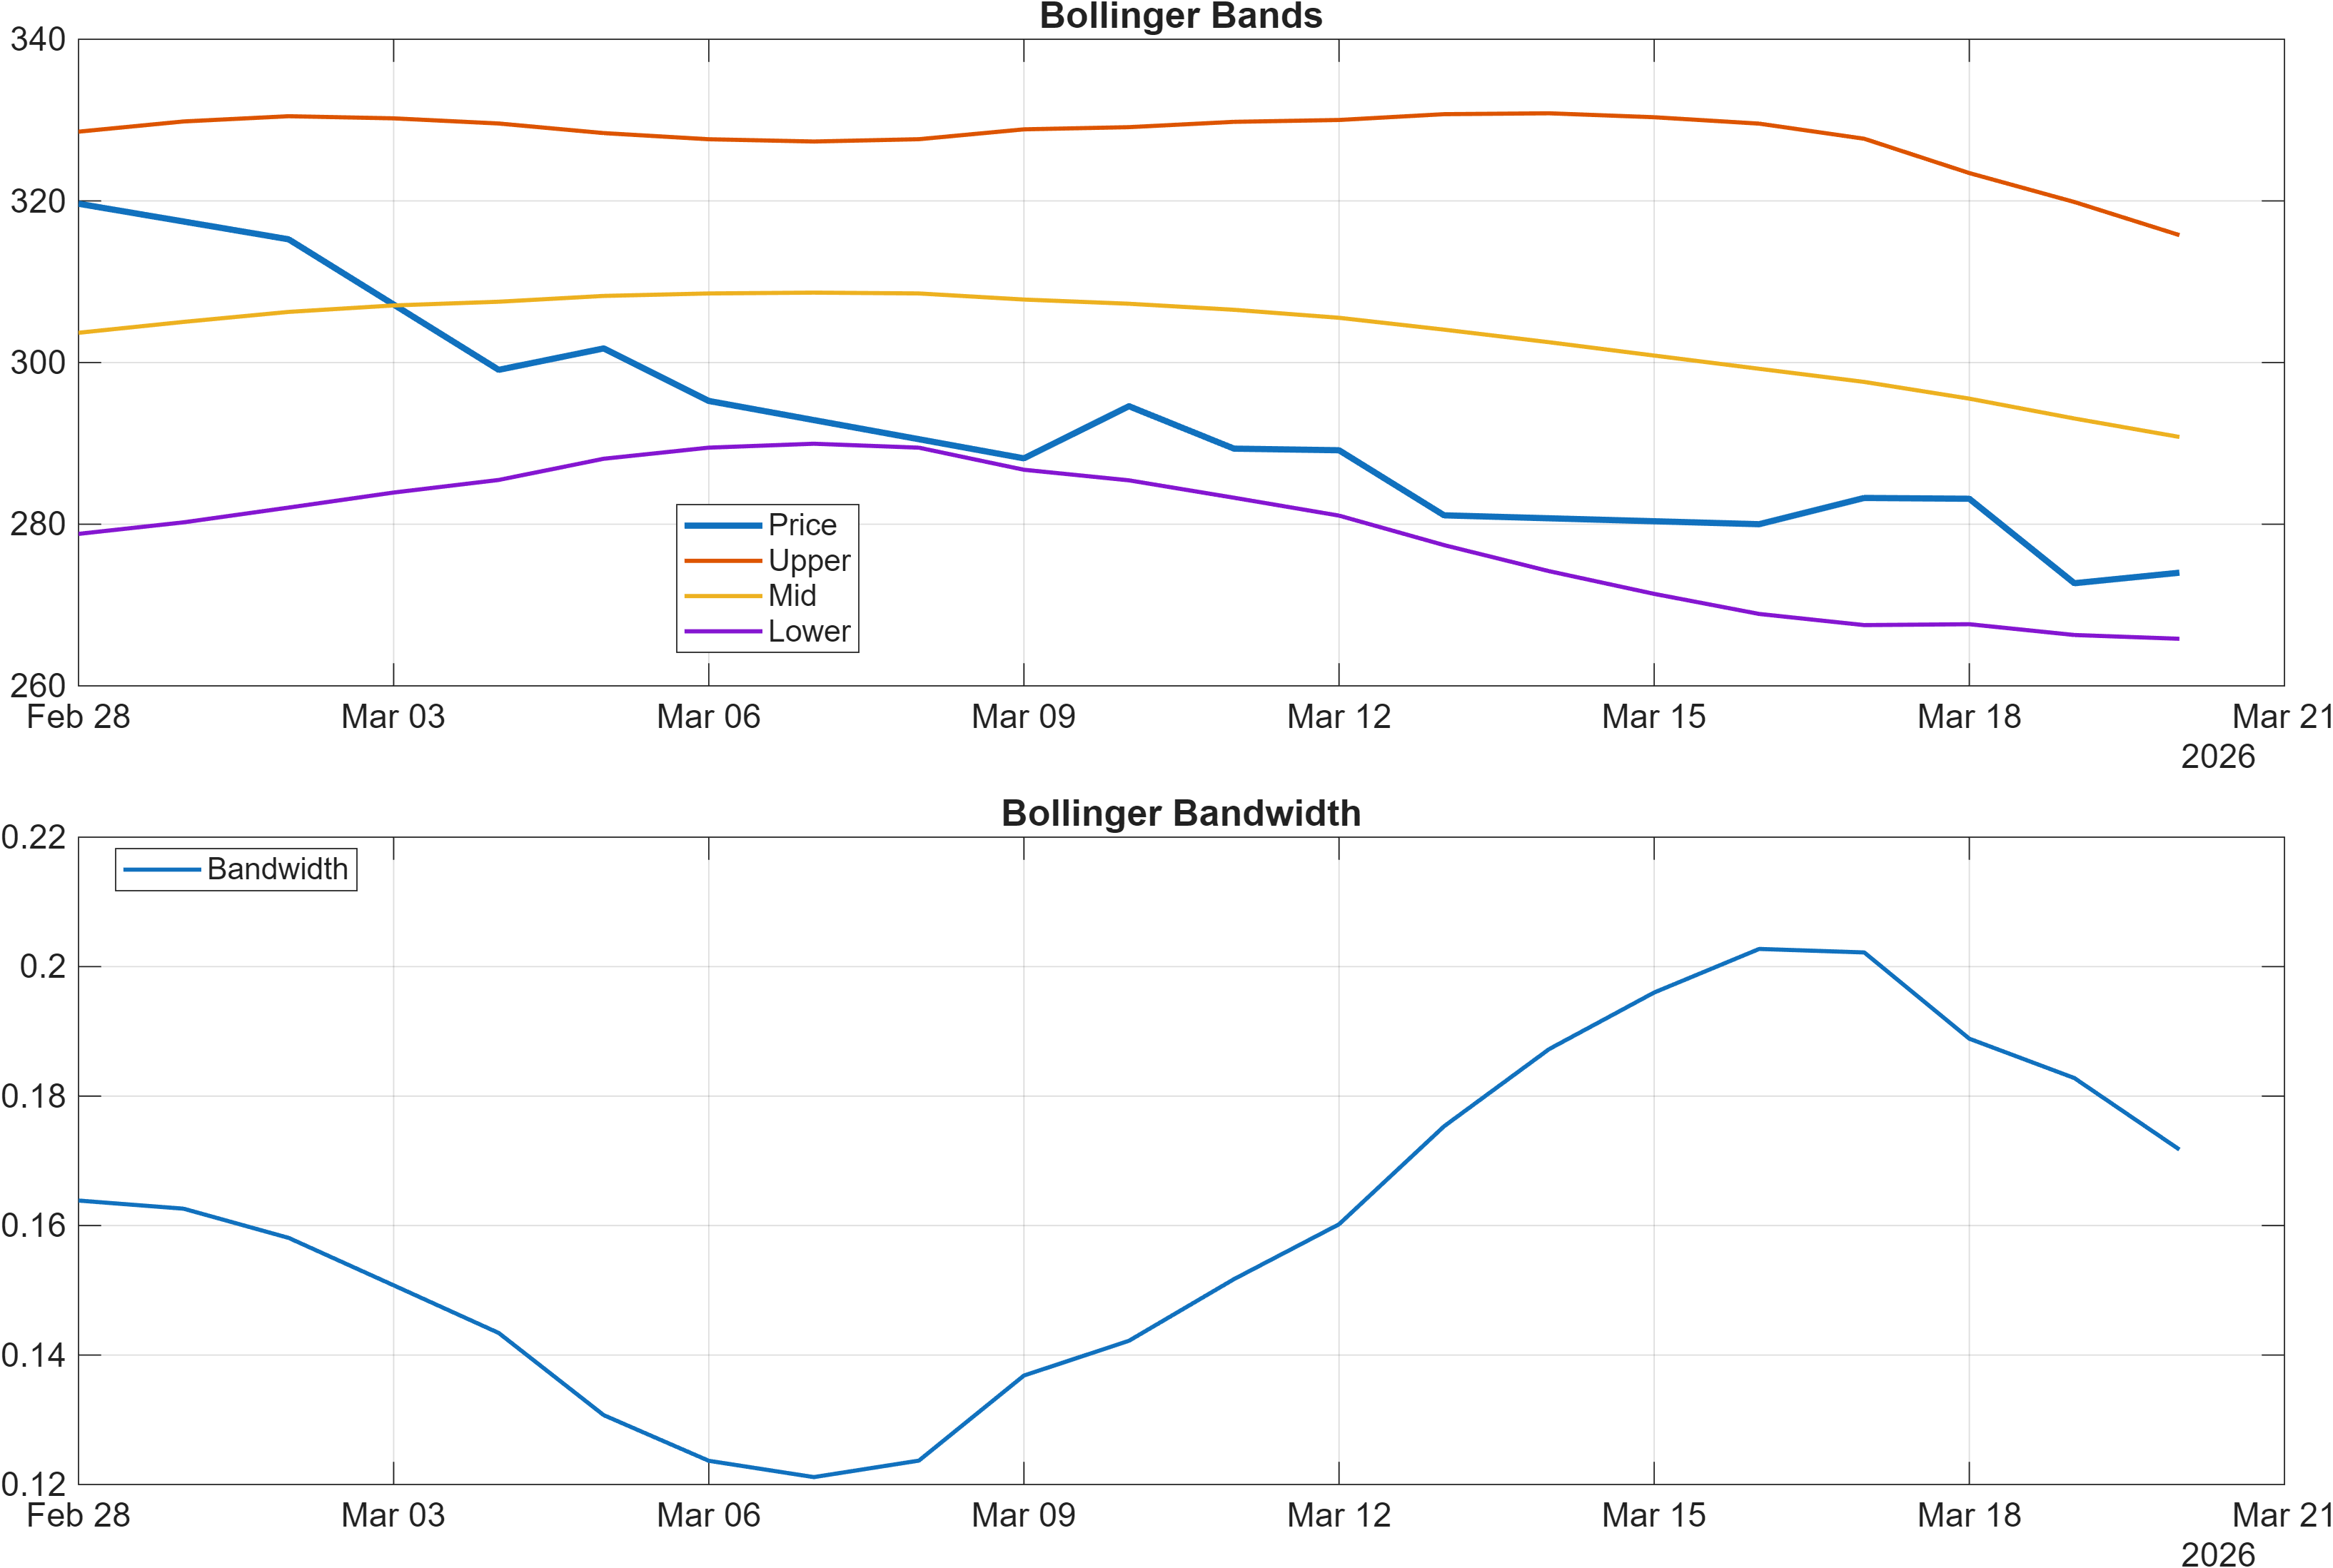
Interpretation: Bandwidth (volatility regime) latest = 0.1717.
Momentum: oversold readings without confirmed reversal mechanics
Momentum signals are tilted toward downside persistence rather than a confirmed inflection. The RSI(14) at 25.43 is firmly bearish, consistent with oversold conditions; however, oversold alone is not a reversal trigger, particularly when trend and volume-confirmation are lacking. Complementing this, the MACD histogram at -1.8732 indicates negative momentum remains present, which can keep rebounds shallow or short-lived in consolidation environments.
Volatility conditions are comparatively restrained. The Bollinger bandwidth at 0.1717 signals a contained regime rather than an extreme expansion phase. When bandwidth is controlled while momentum is deeply negative, the common interpretation is compressed weakness: price can drift lower or chop sideways, but the market has not yet “resolved” into a high-volatility capitulation or a clean recovery thrust.
Cross-checking against the broader dashboard, the 18-signal framework later in the report shows the bearish impulse is not limited to RSI/MACD—many internal measures also lean negative. In this context, the most analytically useful read is that momentum is stressed but not yet transitioning. For regime change, watchers typically look for momentum stabilization while price reclaims key zones (notably toward 315.9000) and for bearish momentum readings to stop deteriorating, rather than simply becoming “less oversold.”
4) Support / Resistance zones
Support ~ 276.8500 | Resistance ~ 315.9000
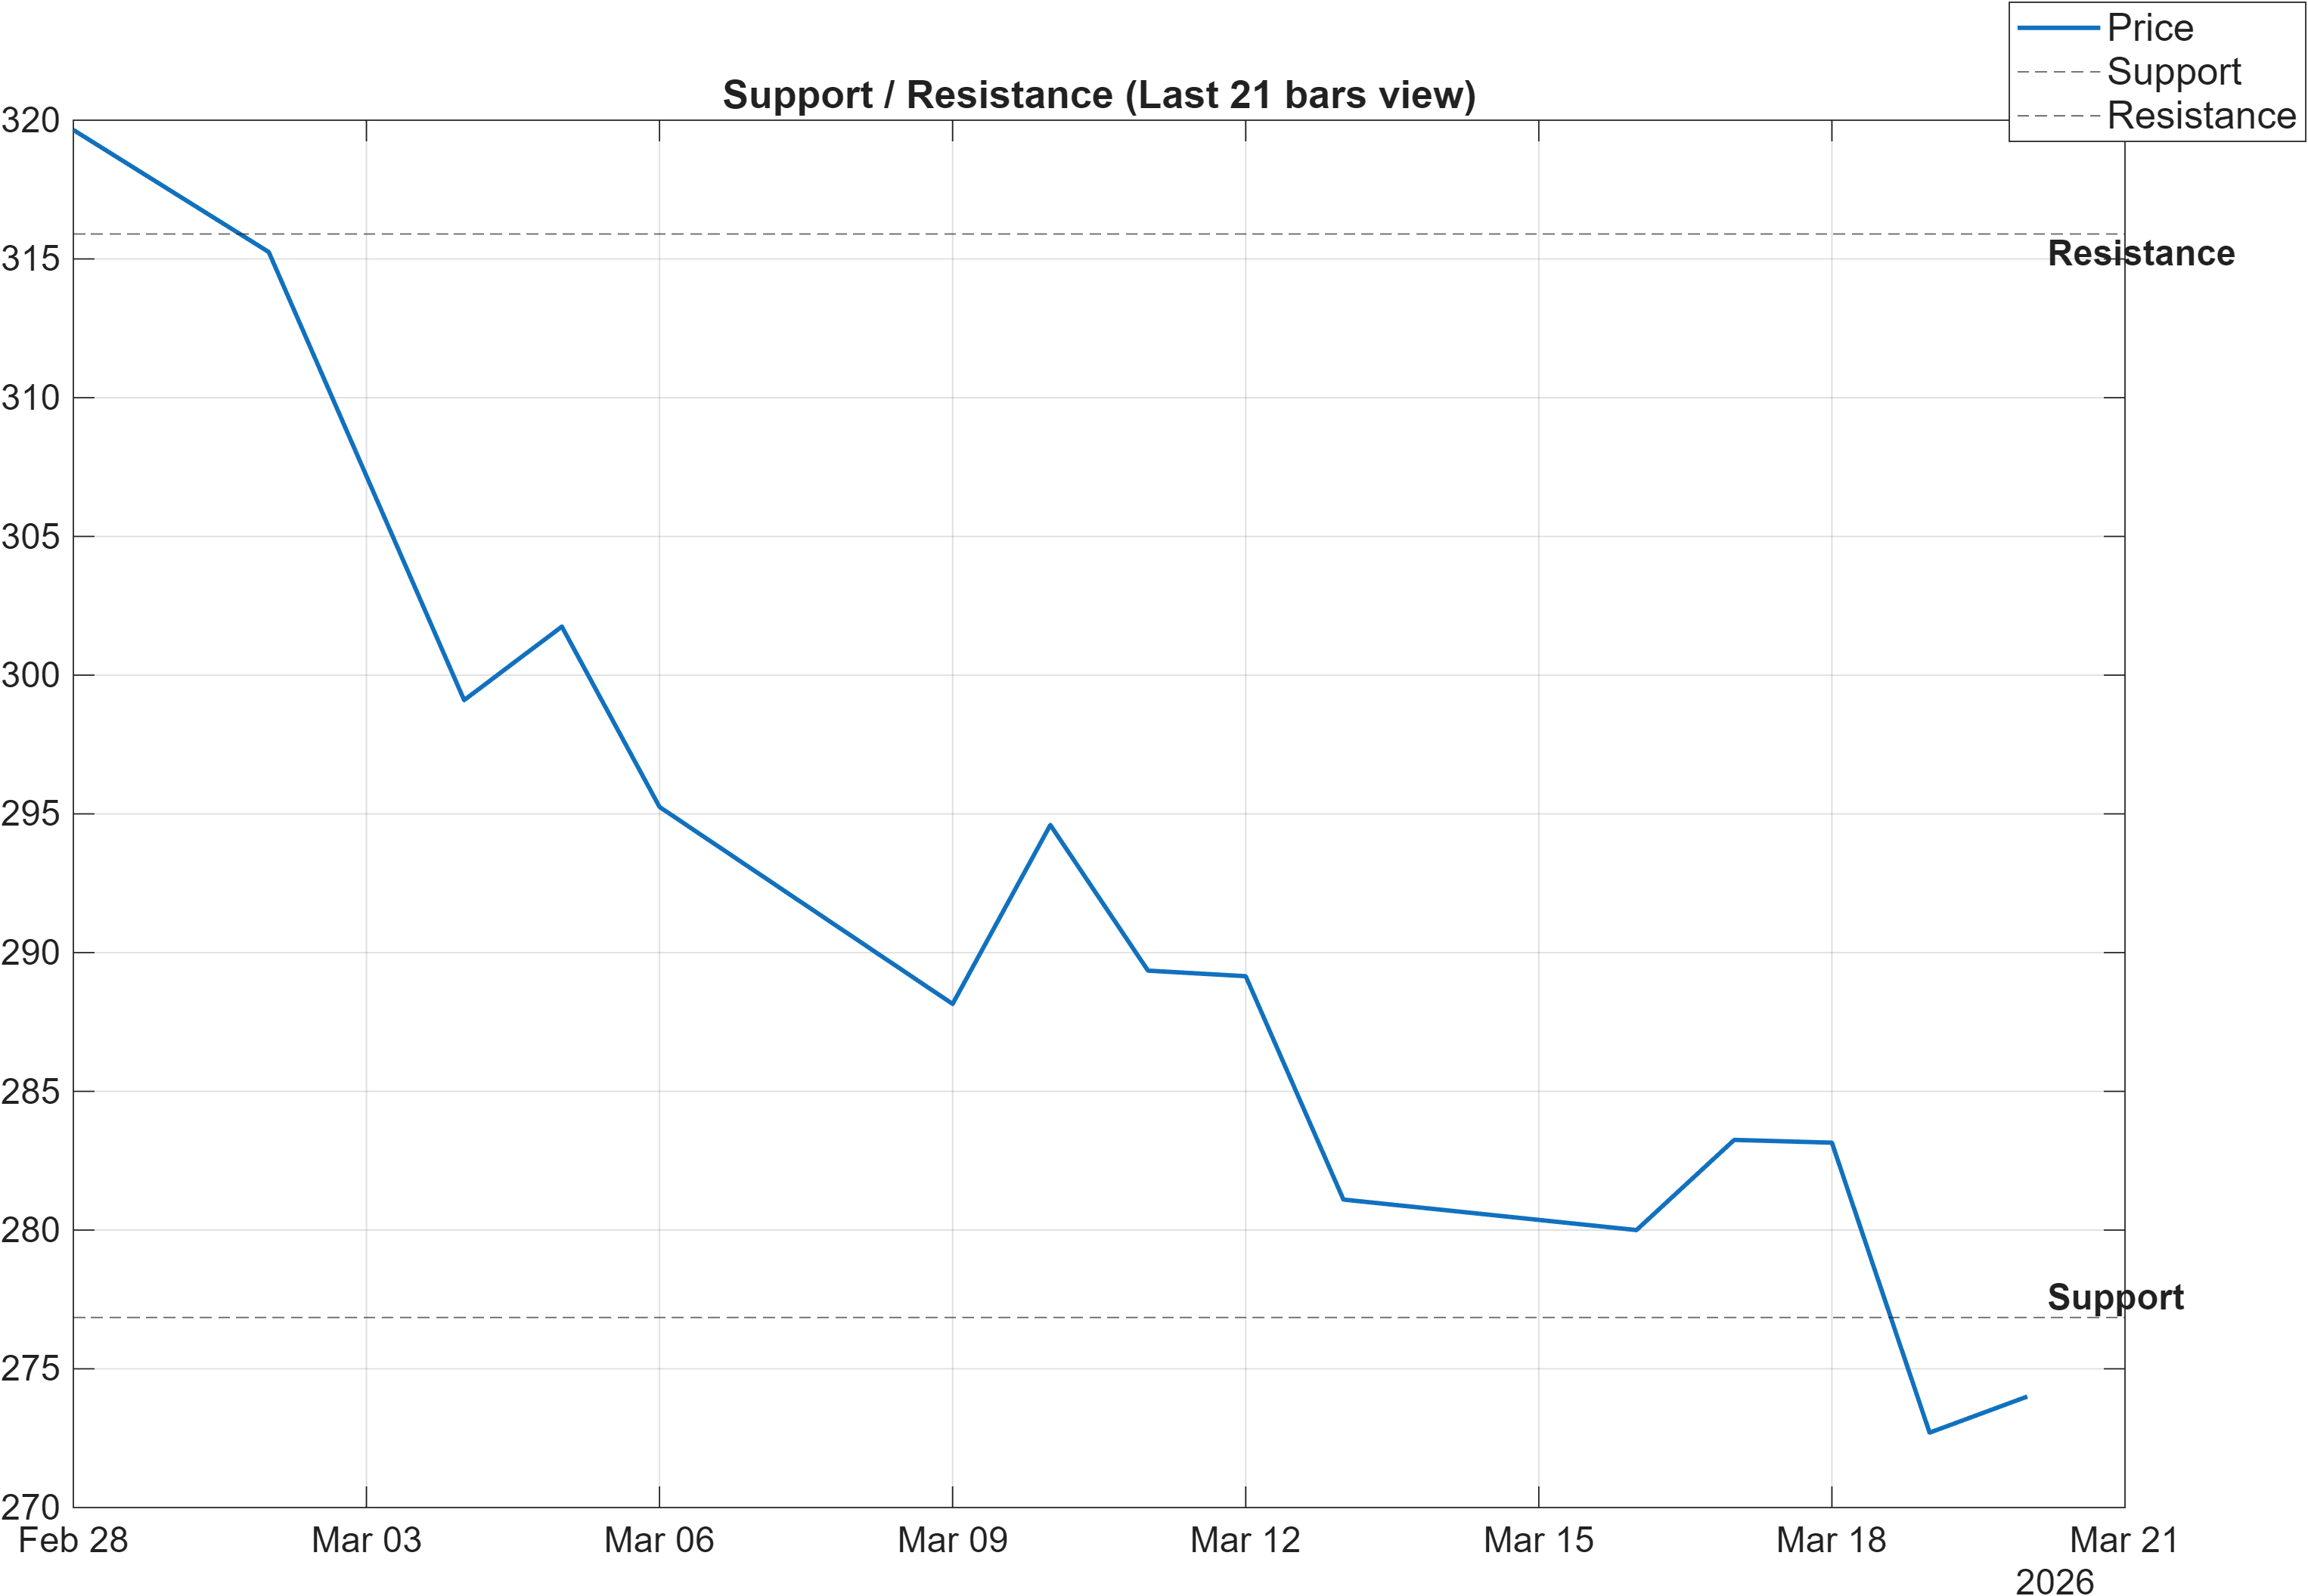
Scenario view: Break above resistance with volume → continuation. Close below support → signal deterioration risk.
Decision zones: mapping resolution risk in a neutral rank environment
With most ranks neutral (daily #385, weekly #522, yearly #459), the support/resistance map carries extra weight because it defines where the system expects the next information update to arrive. The market is currently framed between 276.8500 and 315.9000, which function less like fixed “lines” and more like probabilistic zones where positioning, liquidity, and follow-through are tested.
The report’s scenario logic is intentionally asymmetric. A break above 315.9000 with volume is treated as continuation because it would resolve the consolidation toward expansion and help reconcile the split between bearish close vs MA50 and bullish MA50 vs MA200. Conversely, a close below 276.8500 is flagged as deterioration risk, consistent with the broader technical picture: bearish confluence (overall technical score -0.680) and negative momentum (MACD histogram -1.8732) would be more likely to express through downside if support fails.
The key analytical point is that the instrument is not presenting a high-conviction trend; it is presenting a range with skewed internals. When internals are bearish but volatility is still contained (bandwidth 0.1717), level interactions often precede a sharper move. For monitoring, the highest signal density tends to occur on (1) retests of support with weakening breadth signals, or (2) upside attempts toward resistance where volume confirms—or fails to confirm—acceptance above the level.
5) Quant Technical Dashboard (18 Signals)
KGNAI AI Technical Analysis Score (Deep Reinforcement Learning): Rank #1125 out of 1222 (Rank 1 represents the strongest technical positioning and a higher probability of favorable price behavior. As ranks increase toward the maximum, the probability of favorable outcomes weakens and bearish positioning becomes more dominant.) | Label: Bearish | Score: -0.841
18-Signal Technical Confluence Score: -0.611 (Bearish)
Overall Technical Score (18-signal confluence + DRL rank blend): -0.680 (Bearish)
Note: The blended score reflects signal strength weighted against broader AI technical ranking, which may temporarily diverge.
Blended technical score breakdown: -0.680 (Bearish | Bull 2 / Bear 13 / Neutral 3)
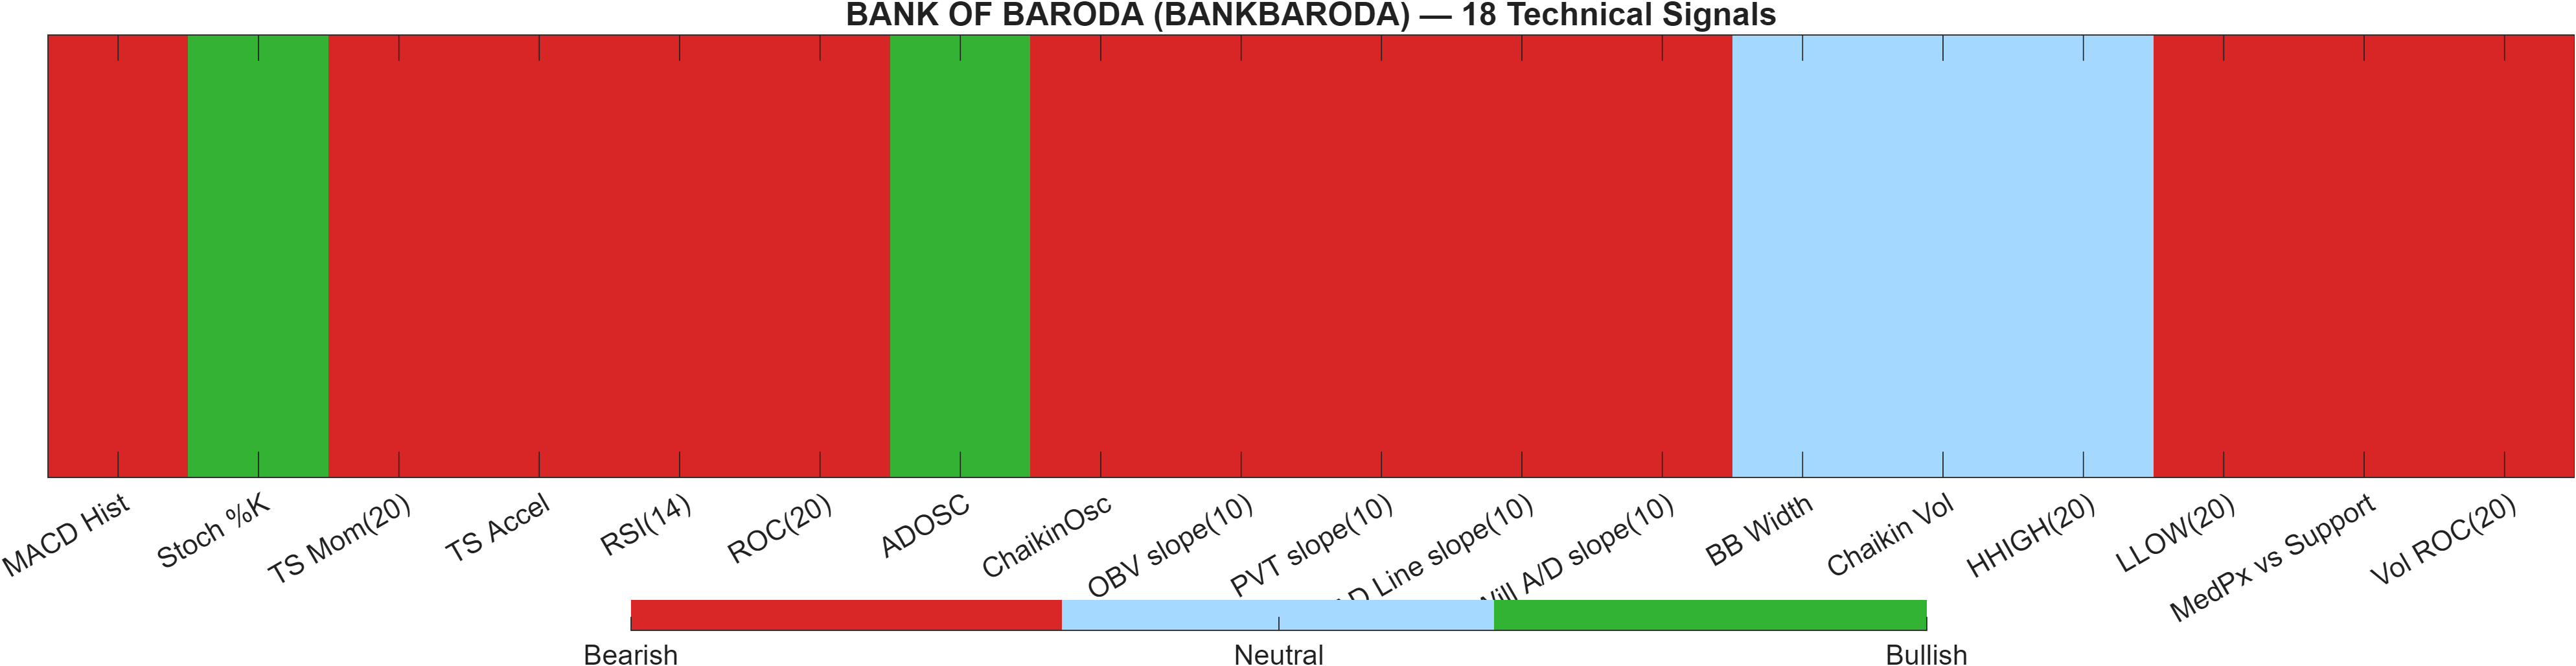
Confluence vs AI technical rank: bearish agreement with minor counter-signals
The technical layer is unusually consistent in its negative orientation. The DRL technical rank (#1125 out of 1222) sits deep in the lower tail of the universe, and the blended technical framework remains Bearish with an overall technical score of -0.680. This matters because the model is not merely picking up one or two weak indicators; it is capturing broad agreement across independent signal groups.
The 18-signal confluence score of -0.611 reinforces that the majority of classical and flow-style measures are aligned to the downside. Internally, the breakdown (Bull 2 / Bear 13 / Neutral 3) implies that “green shoots” exist but are currently insufficient to change the composite. For example, while RSI(14) at 25.43 can coincide with tactical rebounds, the report simultaneously shows negative momentum persistence via the MACD histogram at -1.8732.
This is where interpretation discipline matters: a bearish composite does not require immediate continuation lower, but it does indicate that upside attempts are more likely to face friction unless they are accompanied by regime change signals—typically visible as improving breadth/participation and price reclaiming major levels (notably toward 315.9000). Until then, the dashboard reads as bearish pressure within a range rather than a balanced two-sided setup.
Signal table (Bull/Bear/Neutral)
| Indicator | Value | Signal |
|---|---|---|
| MACD Hist | -1.873 | Bearish |
| Stoch %K | 5.405 | Bullish |
| TS Mom(20) | -44.75 | Bearish |
| TS Accel | -71.7 | Bearish |
| RSI(14) | 25.43 | Bearish |
| ROC(20) | -13.69 | Bearish |
| ADOSC | 9.444 | Bullish |
| ChaikinOsc | -4.89e+04 | Bearish |
| OBV slope(10) | -1.846e+06 | Bearish |
| PVT slope(10) | -1.722e+04 | Bearish |
| AD Line slope(10) | -3.83e+05 | Bearish |
| Will A/D slope(10) | -40.65 | Bearish |
| BB Width | 0.1717 | Neutral |
| Chaikin Vol | -6.961 | Neutral |
| HHIGH(20) | 321.7 | Neutral |
| LLOW(20) | 271.3 | Bearish |
| MedPx vs Support | -1.05 | Bearish |
| Vol ROC(20) | -34.99 | Bearish |
Interpretation: Indicator-level signals form the base confluence, which is then adjusted using a separate AI-driven technical ranking model. The final technical score summarizes this combined view.
6) News sentiment + extractive gist
Note: Instrument-specific news matches were not found, so the digest includes broader market/sector headlines.
Sentiment score (avg): 0.037 | Positive: 31% | Neutral: 50% | Negative: 19%
KGNAI AI News Sentiment Score (normalized -1 to +1): 0.96 (as of 2026-03-18) | Label: Bullish | Overall news score: 0.97
Positive Developments
Recent coverage across major financial outlets indicates a modestly constructive tone despite elevated macro uncertainty. The aggregate news model remains Bullish (0.96) with an overall score of 0.97, while the distribution shows 31% positive versus 19% negative items. The dominant supportive thread is not BANKBARODA-specific; instead it reflects narratives that risk assets can remain resilient even amid energy-price shocks and shifting rate expectations, especially when investors perceive uncertainty as transitory rather than structural. Broader India market developments—such as activity around large financial-sector transactions—also contribute to constructive positioning through a “risk-on, liquidity” lens. In this setup, the positive impulse is best interpreted as contextual tailwind rather than a direct catalyst: it can help stabilize risk appetite, but it does not override bearish technical confluence (-0.611) or weak momentum (RSI 25.43).
Neutral / Mixed Developments
Neutral coverage is the largest bucket at 50%, reflecting a market that is actively repricing uncertainty rather than converging on a single dominant scenario. Commentary has emphasized volatility in energy markets and shifting cross-asset correlations, including periods where commodities and equities move sharply on incremental geopolitical updates. For BANKBARODA, this matters because the chart framework is already in a consolidation map between 276.8500 and 315.9000. In neutral regimes, headline flow tends to influence intraday directionality and gap risk more than it changes the medium-term structure. The restrained volatility regime suggested by Bollinger bandwidth 0.1717 is consistent with this: information is arriving, but the market is not yet expressing it through a decisive trend expansion.
Negative / Risk Signals
Risk-oriented coverage continues to highlight the possibility of tighter financial conditions persisting longer than previously discounted, alongside the knock-on effects of elevated crude and heightened geopolitical stress. Even though the average sentiment score is slightly positive (0.037), the negative share (19%) aligns with the report’s technical posture: the composite technical stack remains Bearish (overall technical score -0.680; DRL rank #1125). When macro risk narratives intensify, instruments with weak momentum—such as a MACD histogram at -1.8732 and depressed RSI 25.43—can remain vulnerable to failed rebounds, particularly if support is tested. The key risk to track is whether negative macro flow coincides with a close below 276.8500, which would convert a range-bound weakness into a more explicit deterioration signal under the framework.
- Whether price acceptance improves above 315.9000 alongside visible participation (volume confirmation).
- Whether momentum stabilizes (RSI lifts from 25.43) while MACD histogram pressure (-1.8732) stops worsening.
- Whether the market holds 276.8500 during broader risk-off sessions tied to energy/rate volatility.
Sources referenced: Reuters, Bloomberg, Yahoo Finance, MarketWatch, Investing.com
7) Sources
Not available in the provided data.
You may also like: How KGNAI AI ranks instruments across global markets
Disclaimer: KGNAI provides AI-generated analytics and educational market commentary only. This is not financial advice. Markets involve risk. Always do your own research.