
Bajaj Healthcare Ltd (BAJAJHCARE) Technical & Rank Outlook (03-May-2026) — Constructive Long-Term Bias, Weak Near-Term Momentum
Bajaj Healthcare Ltd (BAJAJHCARE) enters 03-May-2026 with a split profile: long-horizon rank strength remains notable, while near-term technical momentum reads heavy. Across the 1222-instrument India universe, longer windows sit in the upper tier (including a 6-Monthly rank of #4 and 3-Monthly rank of #94), yet the Daily rank of #768 signals softer immediate positioning. This mismatch is reinforced by the technical layer: the 18-signal confluence score is -0.500 (Bearish) and the blended technical score is -0.419 (Bearish), while oscillators highlight downside pressure (e.g., RSI(14) at 29.39 and MACD histogram -2.1602). Price is approaching defined decision zones, with support ~285.2000 and resistance ~348.9875. With sentiment averaging 0.147, the news backdrop is modestly constructive but not decisive versus the current technical tone.
- Short / Mid / Long stance: Short-term Neutral · Mid-term Bullish · Long-term Bullish
- Technical confluence: Bearish (18-signal confluence -0.500; blended score -0.419)
- Key levels: Support ~285.20 · Resistance ~348.99
- News sentiment bias: Slight positive tilt (avg 0.147; 50% positive / 38% neutral / 12% negative)
- Confirmation / invalidation: A break above 348.9875 with volume supports continuation; a close below 285.2000 increases deterioration risk.
KGNAI evaluates assets using large cross-sectional datasets built from millions of structured data points. Inputs incorporate fundamental metrics, technical structures, and systematically processed news sentiment. Statistical models, machine learning, and AI frameworks are used to assess relative positioning, signal alignment, and probabilistic behavior across broad universes.
- Ranks are comparative across the tracked universe, not absolute price targets.
- Confluence reflects alignment among independent signal groups.
- Support/resistance levels are probabilistic decision zones, not guarantees.
- Sentiment provides contextual bias within the broader analytical framework.
1) KGNAI AI Analysis
Region: INDIA
Total universe size: 1222 ranked instruments
- Daily rank: #768 out of 1222 — Neutral
- Weekly rank: #596 out of 1222 — Neutral
- Monthly rank: #208 out of 1222 — Bullish
- 3-Monthly rank: #94 out of 1222 — Bullish
- 6-Monthly rank: #4 out of 1222 — Bullish
- Yearly rank: #86 out of 1222 — Bullish
The rank curve shows a regime split: short-dated ranks are neutral while longer windows remain strongly favorable. The 6-Monthly rank (#4) places BAJAJHCARE in the very top of the 1222-name universe, and the 3-Monthly rank (#94) keeps it in the upper cohort—consistent with a longer-term constructive structure. By contrast, the Daily rank (#768) and Weekly rank (#596) imply weaker immediate behavior, often associated with drawdown phases, consolidation, or a tactical momentum reset.
This configuration typically matters because cross-horizon alignment is often required for sustained trend continuation. Here, the longer-horizon advantage is intact, but the near-term ranks indicate that confirmation is not yet broad-based. The Monthly rank (#208) sits between those extremes, acting as a bridge: it is bullish, yet less dominant than the 3–6 month window, which can be consistent with a trend that remains structurally supported but is working through a corrective leg.
Within KGNAI’s framework, the Term view is explicitly mixed: Short-term Neutral, Mid-term Bullish, Long-term Bullish. Practically, this is a setup where timing and level discipline tend to matter more than directional conviction alone. If the market begins to reward risk again, short-term ranks often improve first; if not, longer-horizon strength can persist while price chops or retraces.
KGNAI ranks each instrument across large universes using multiple proprietary AI tests and statistical models (millions of data points). Lower ranks generally indicate stronger probability of favorable performance behavior, while higher ranks indicate weaker probability and more bearish positioning.
Term view: Short-term: Neutral. Mid-term: Bullish. Long-term: Bullish.
Want the full universe and complete rank tables? Unlock full access on KGNAI: https://www.kgnai.com/pricing
2) Price & trend overview
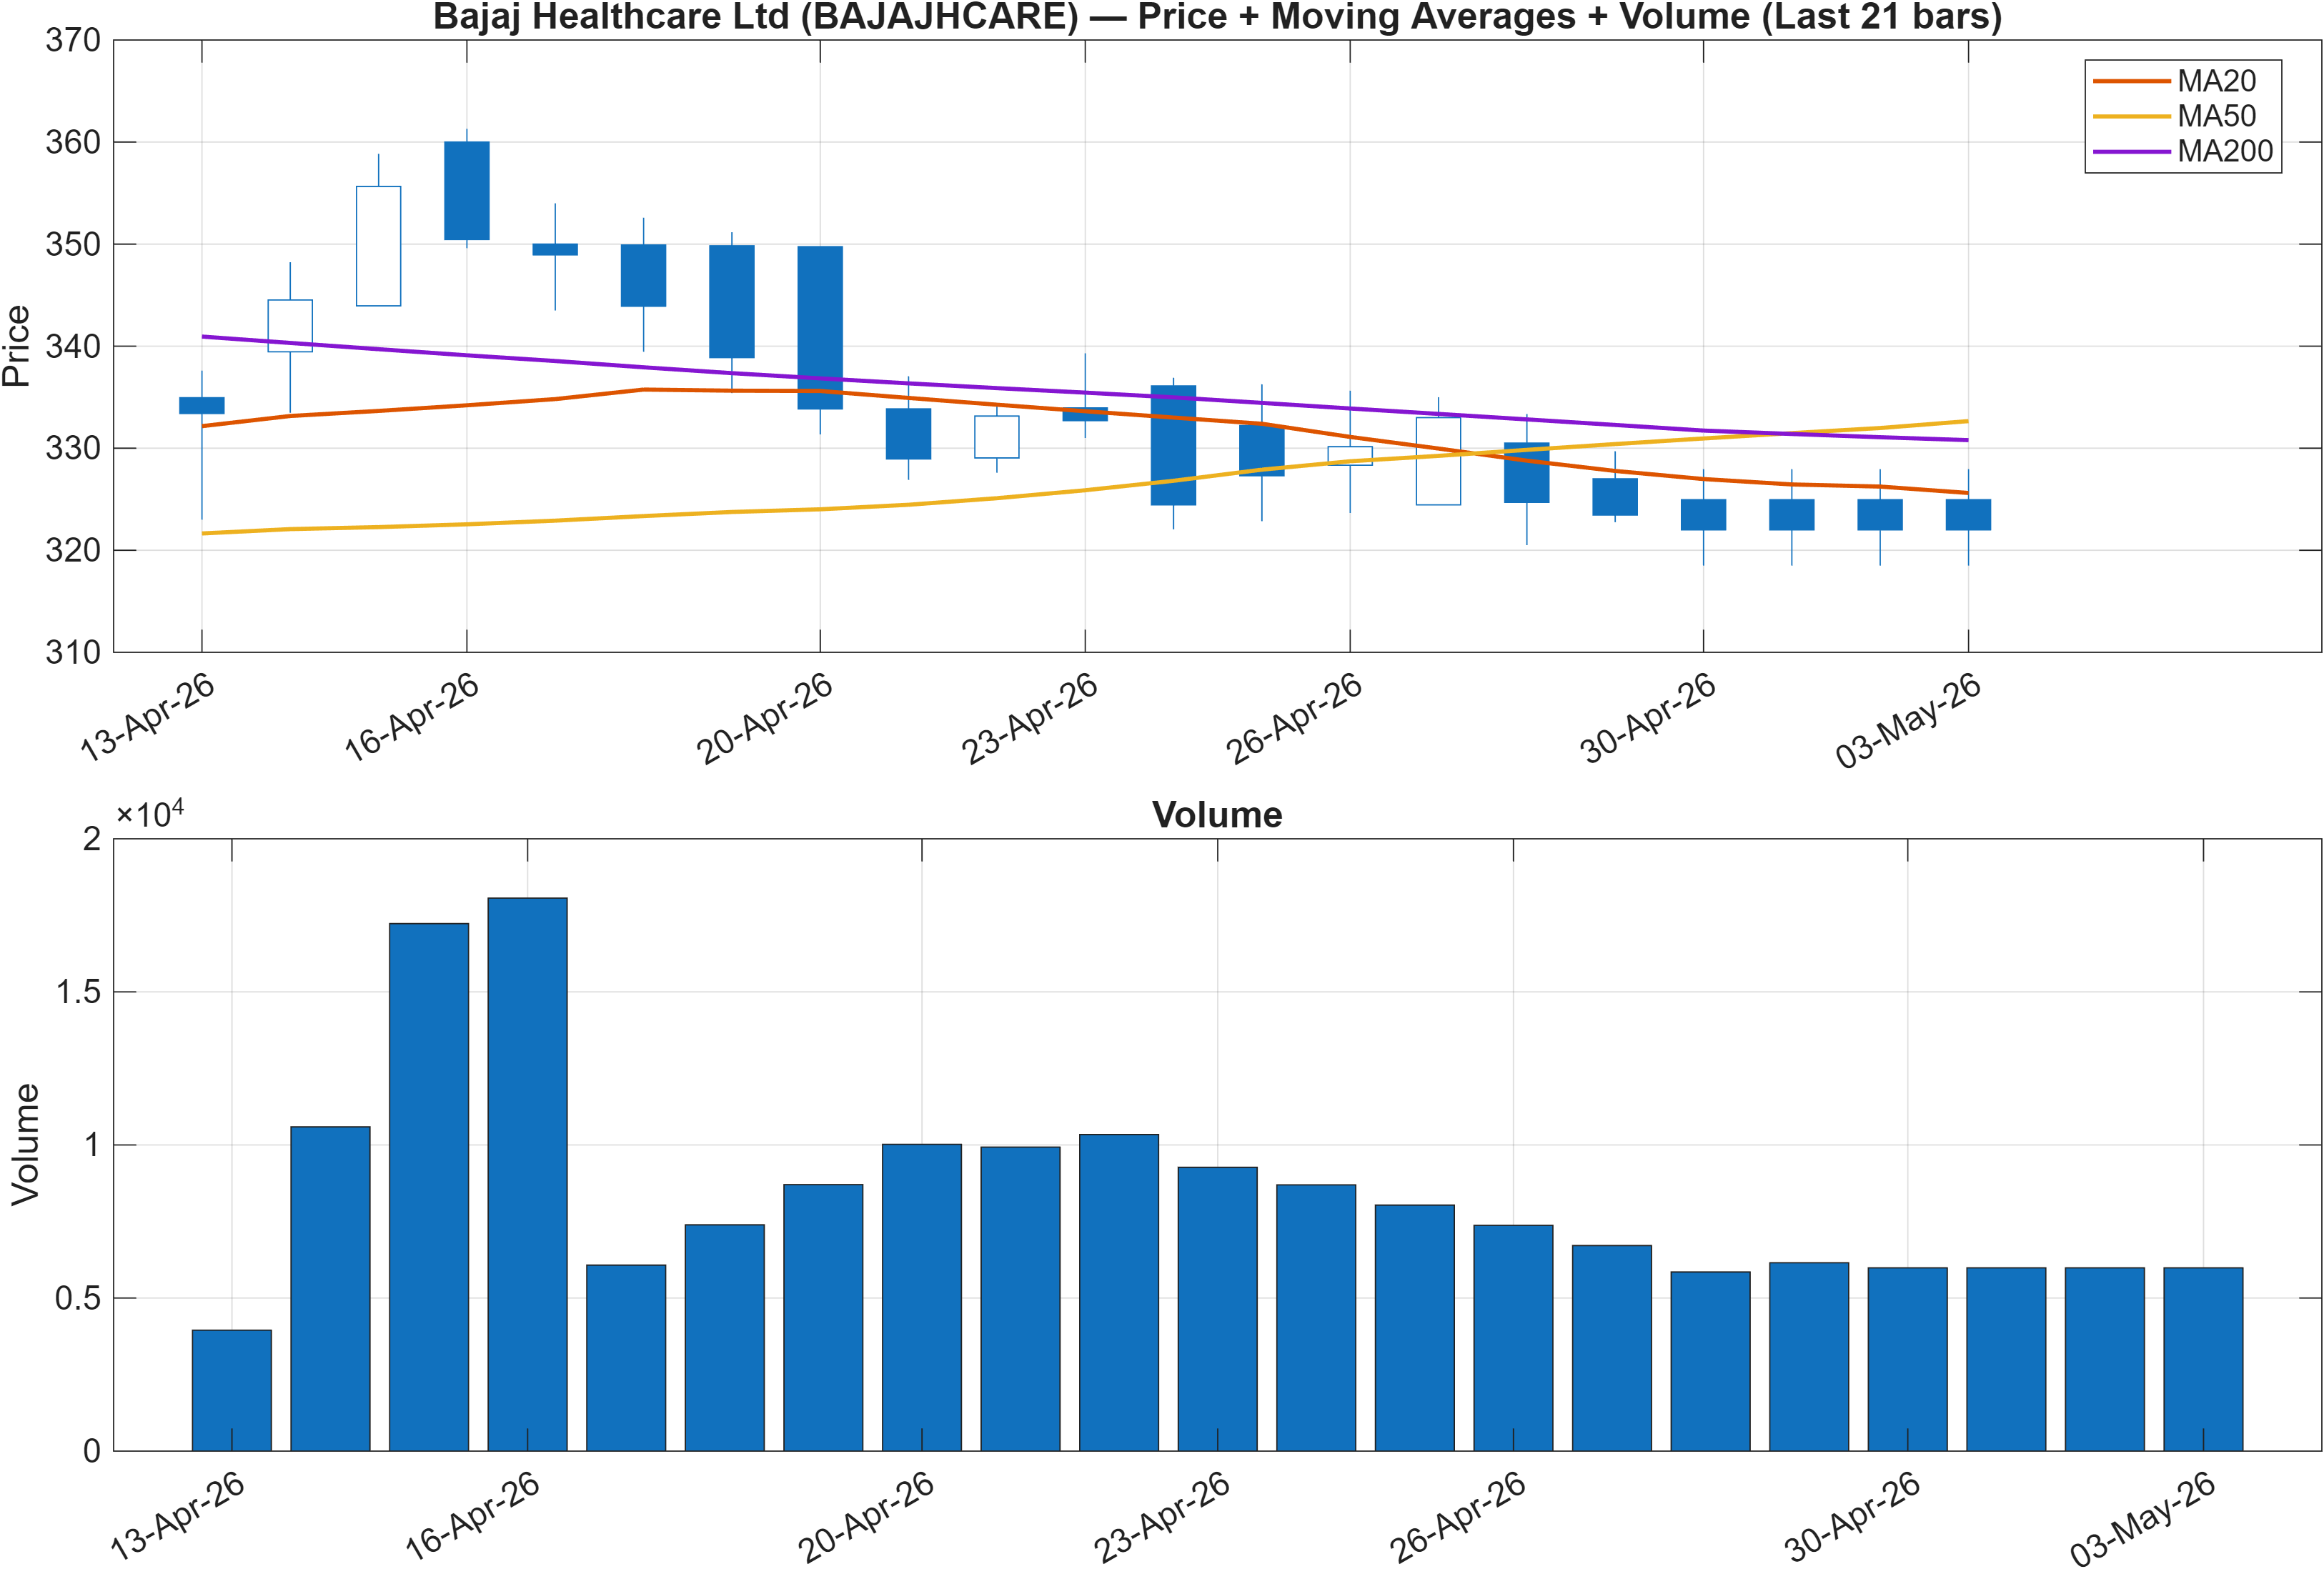
Interpretation: Close vs MA50 = Bearish, MA50 vs MA200 = Bullish.
Trend structure is best described as long-term uptrend integrity with near-term weakness. The moving-average configuration is internally divergent: MA50 vs MA200 is Bullish, which is typically consistent with a broader rising regime, while Close vs MA50 is Bearish, which often appears during pullbacks within an uptrend, failed retests, or early-stage trend fatigue.
This divergence matters for market structure: when price is below the medium-term average (MA50) but the MA50 remains above the long-term average (MA200), the tape can be in a “damage repair” phase rather than a fully bearish transition. In that environment, rallies are often evaluated for whether they can reassert acceptance above the MA50, and whether volume participation improves as price approaches key decision areas.
The rank profile supports this interpretation. A very strong 6-Monthly rank (#4) suggests the longer lookback still “remembers” favorable behavior, but the Daily rank (#768) highlights that the shorter-term auction is not currently aligned with that longer-term backdrop. If the trend is to re-synchronize, the earlier mechanical sign is frequently a sustained recovery above MA50 (consistent with the Close vs MA50 state flipping).
From a portfolio implementation perspective, this is a classic case where trend persistence (MA50 above MA200) coexists with tactical fragility (price below MA50). The next step is less about labeling the trend and more about monitoring whether the market can reclaim intermediate structure without violating key downside levels discussed in the support/resistance section.
3) Momentum & volatility dashboard
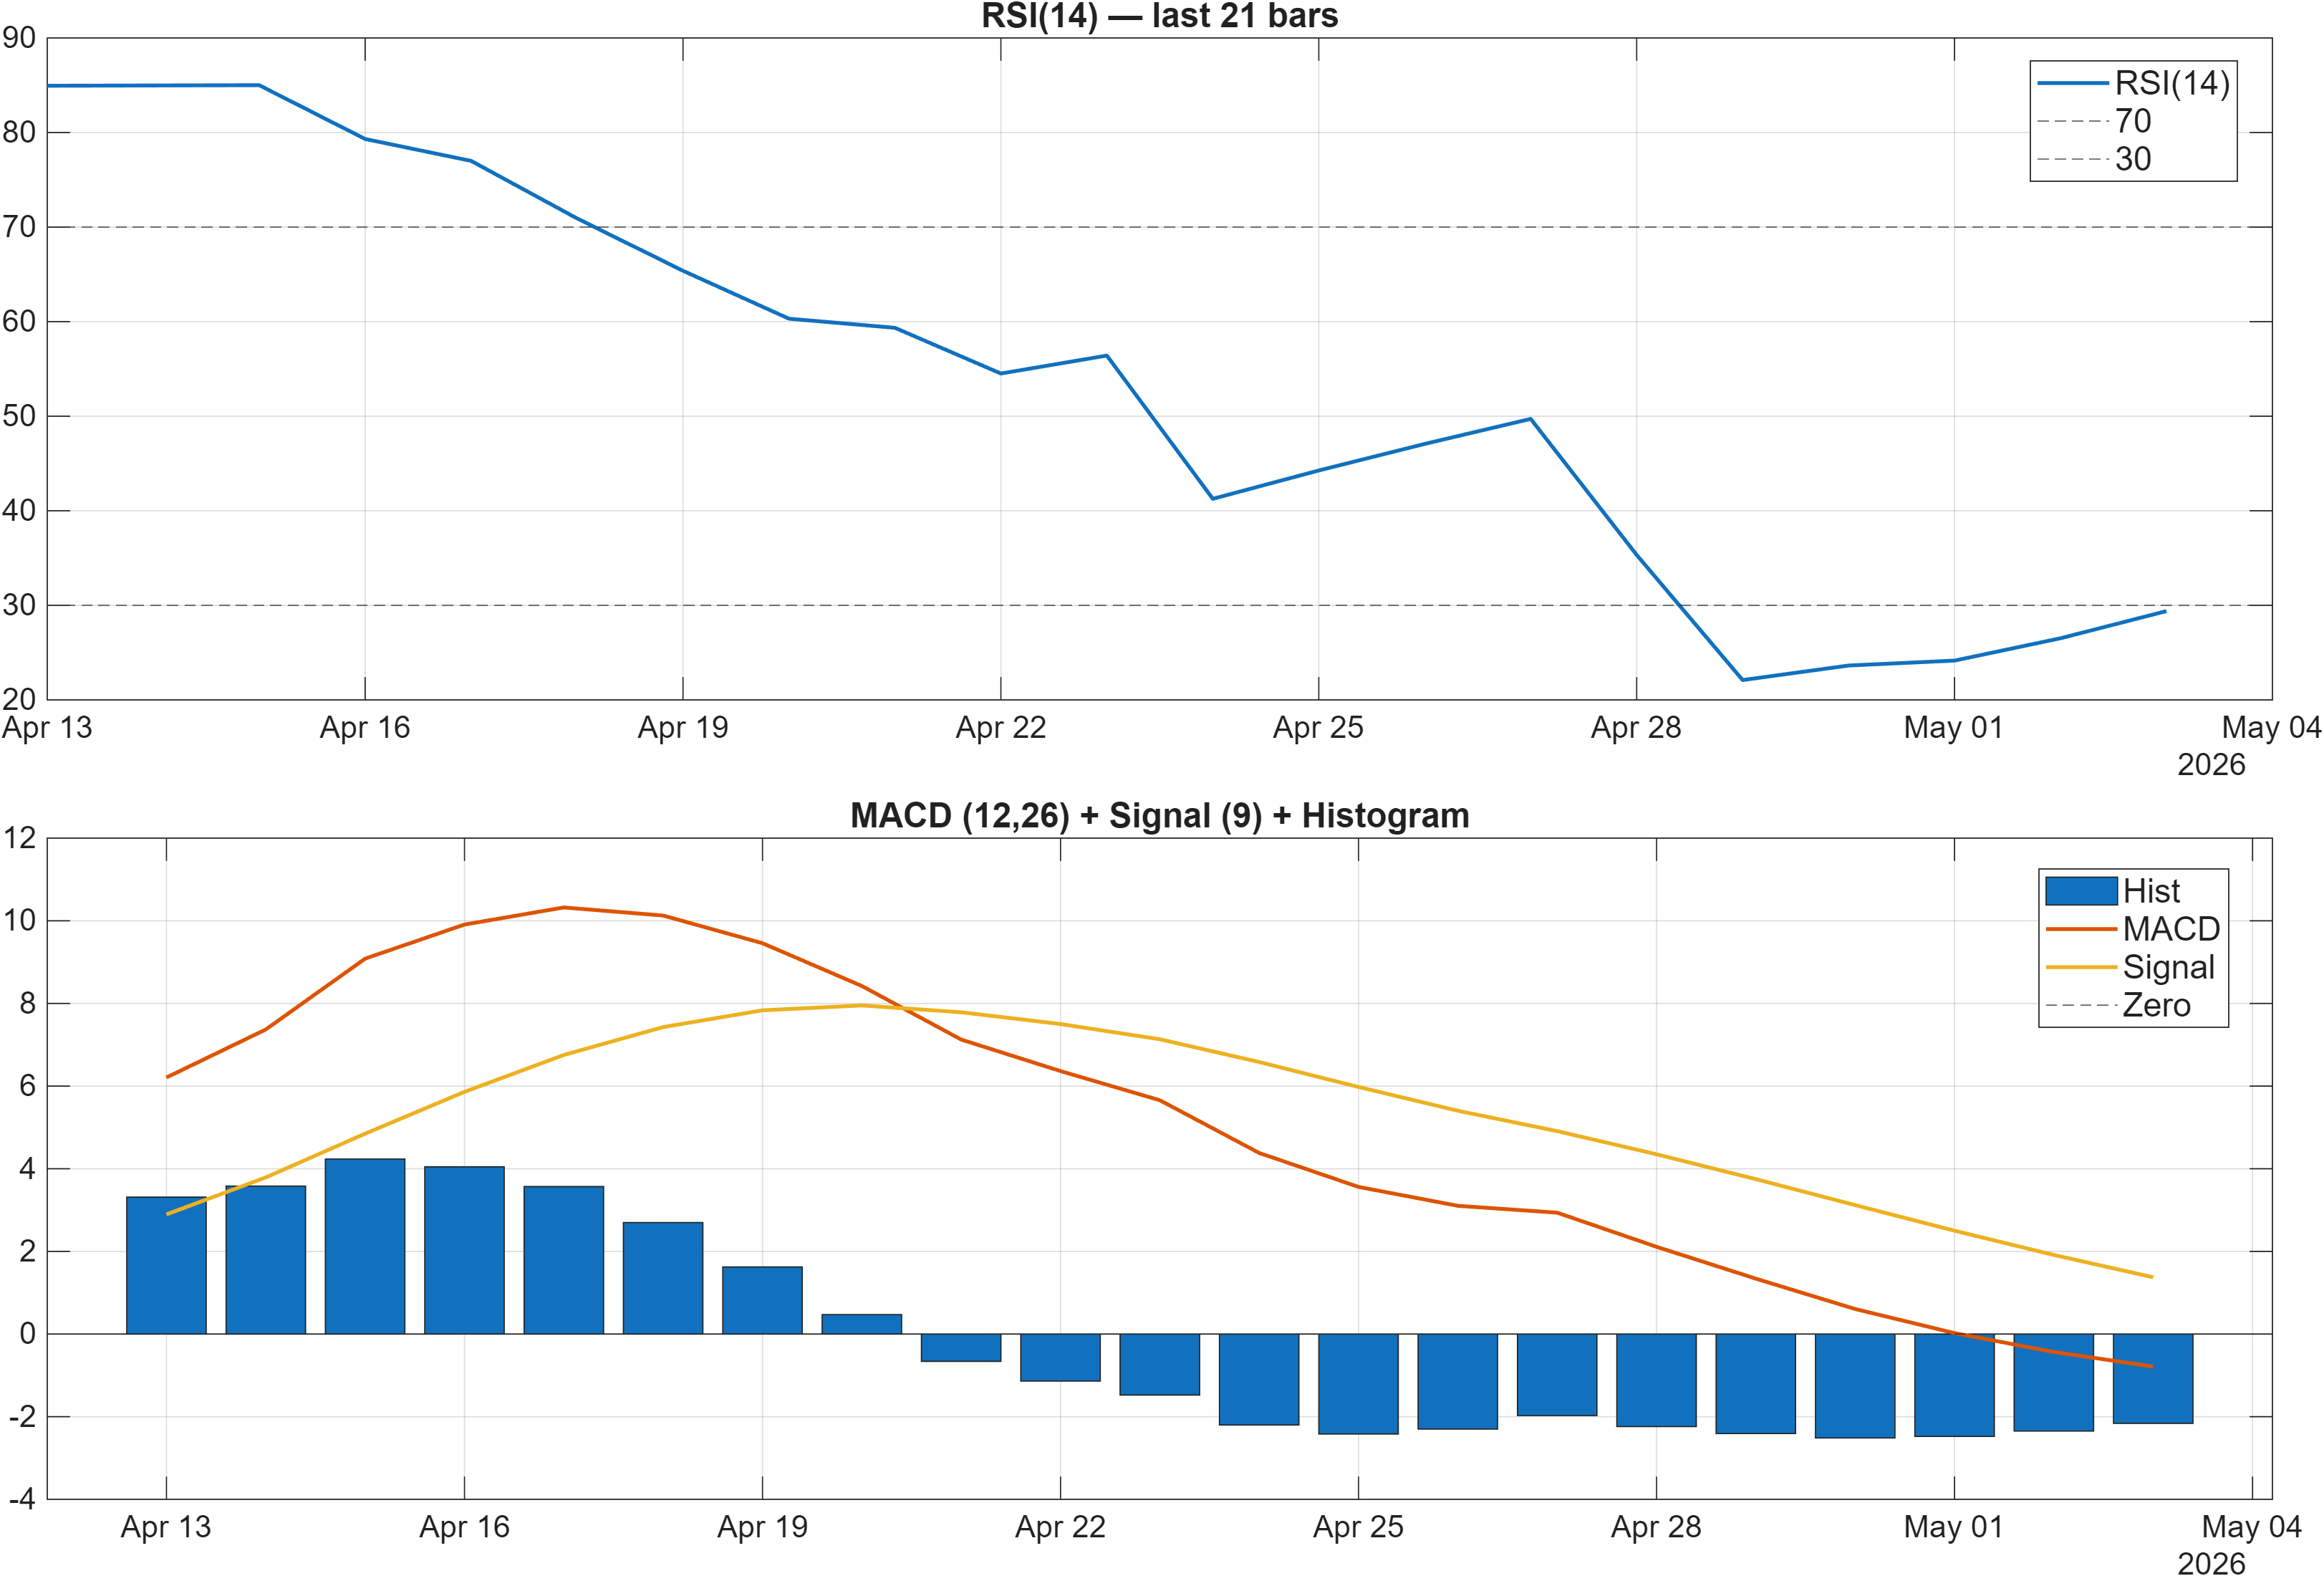
Interpretation: RSI bias = Bearish, MACD hist = -2.1602.
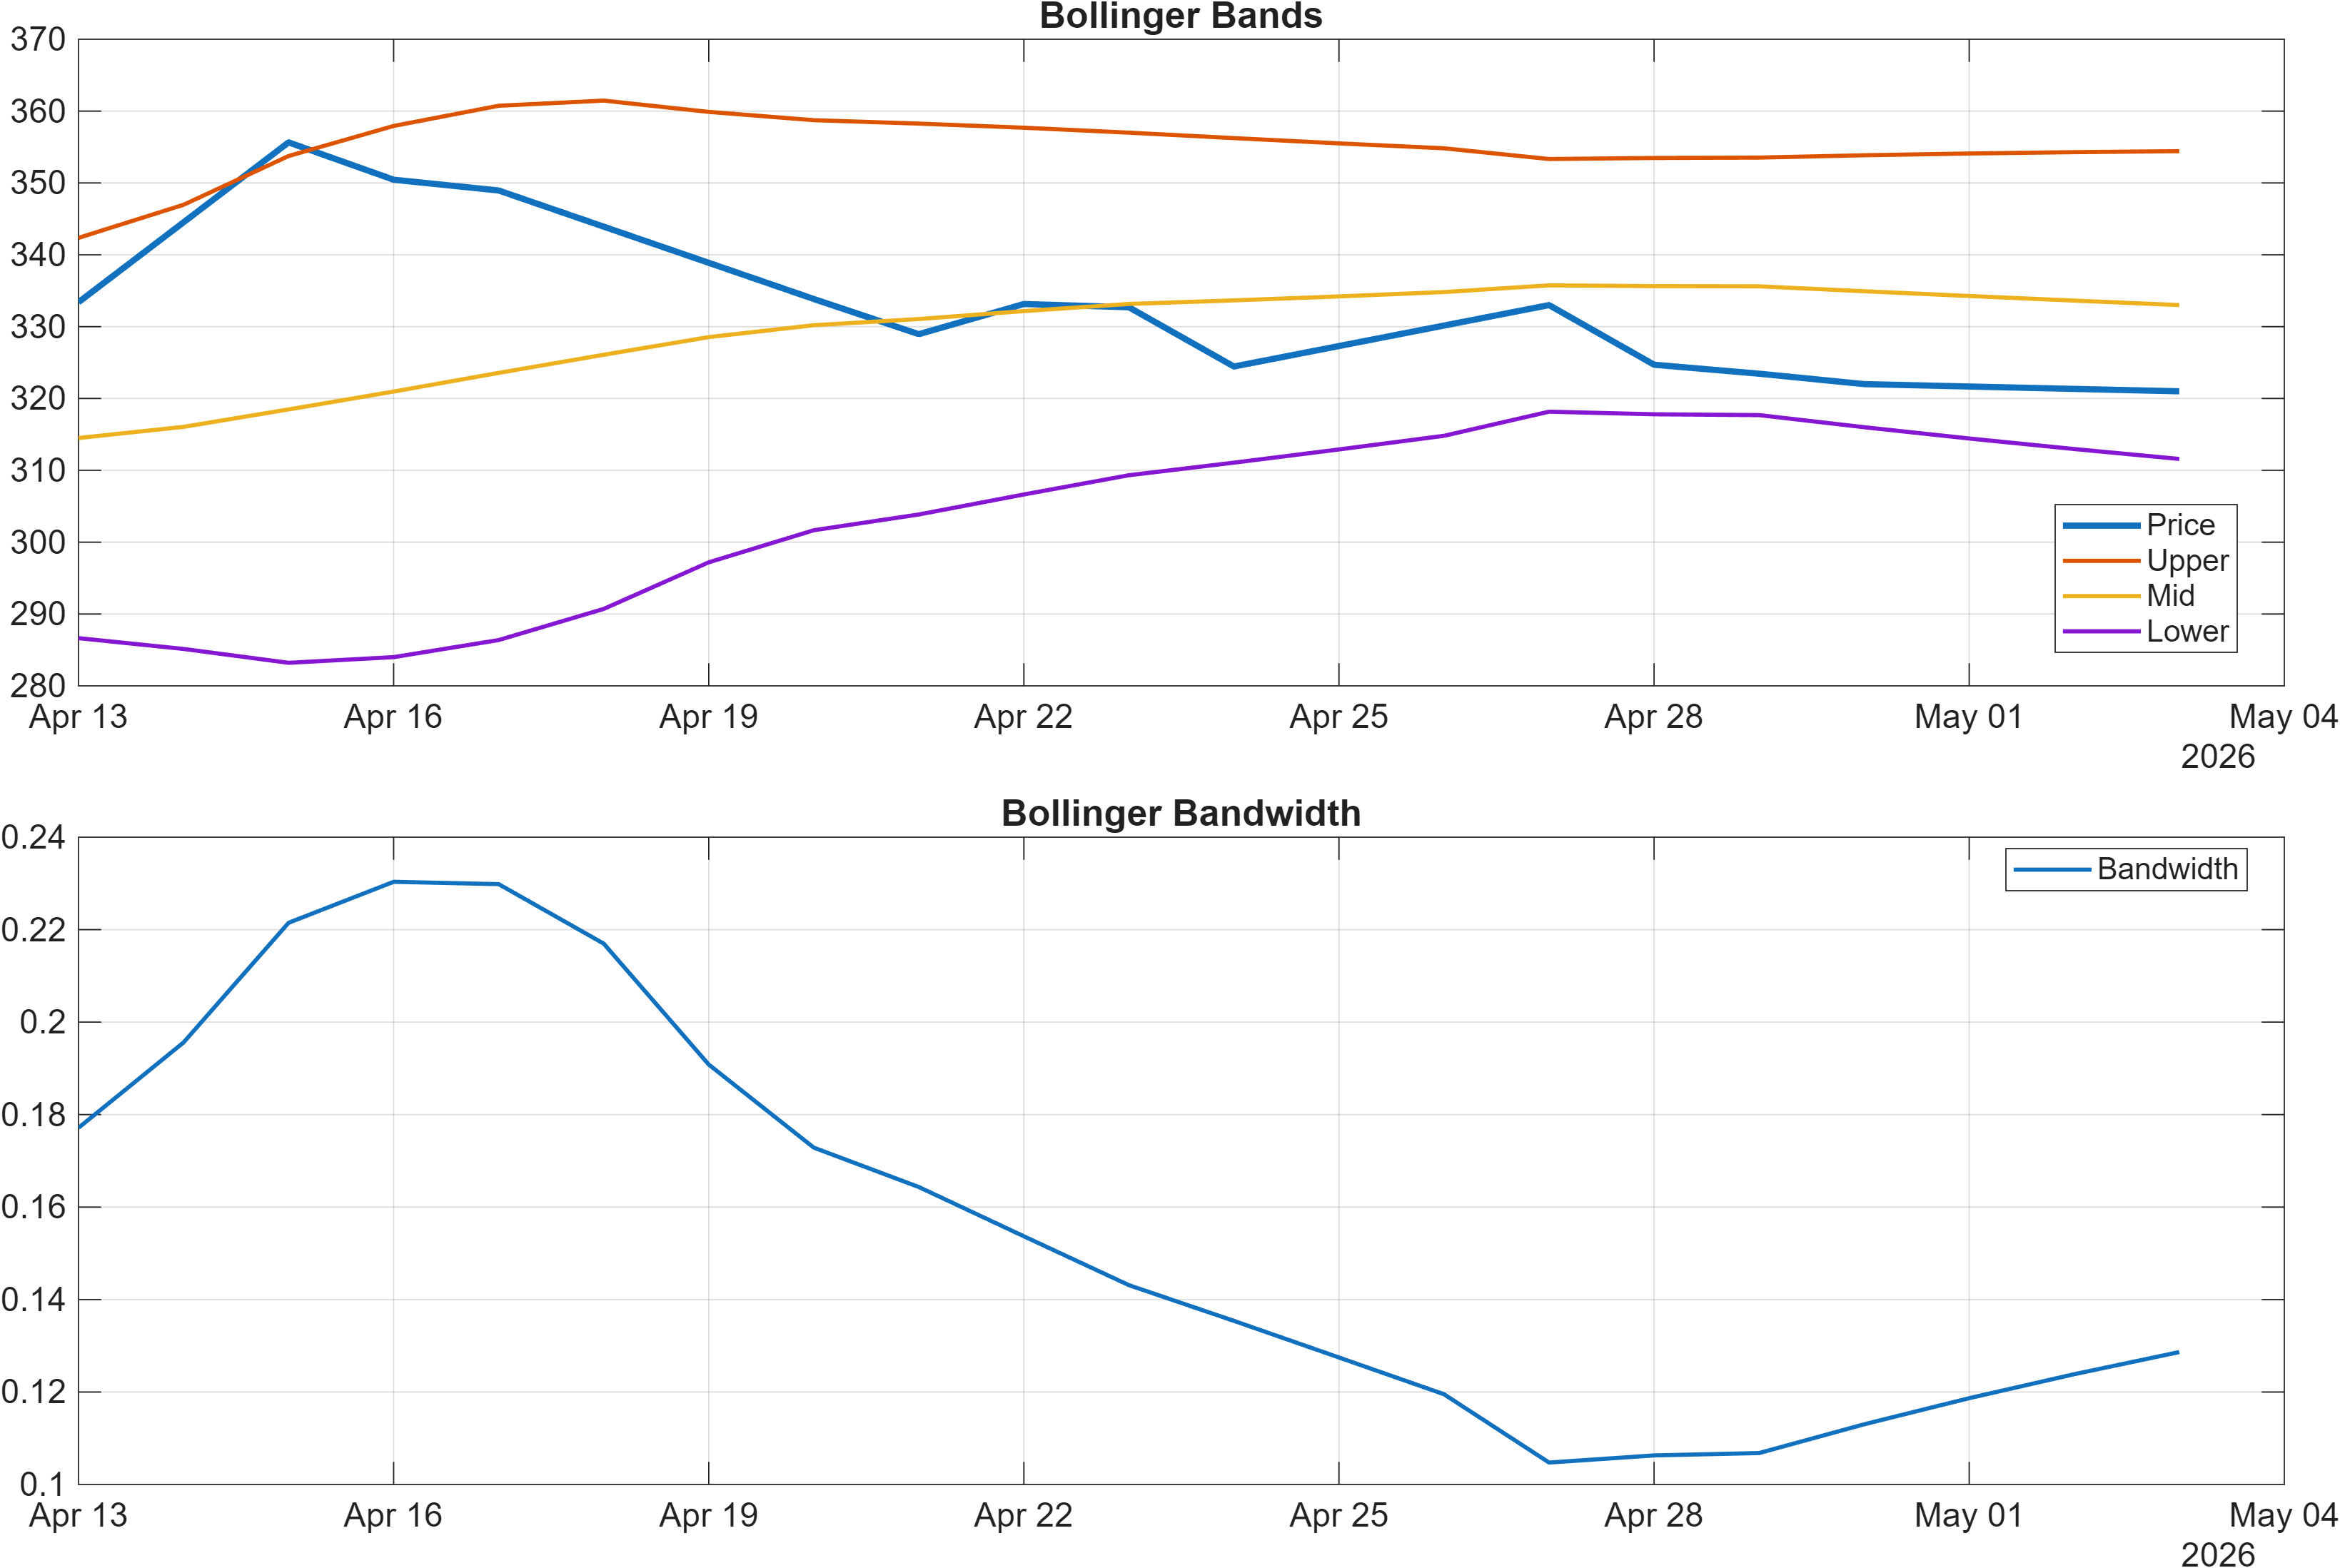
Interpretation: Bandwidth (volatility regime) latest = 0.1286.
Momentum signals are currently tilted toward downside pressure rather than upside expansion. The RSI(14) at 29.39 is in a bearish zone, and the stated RSI bias remains bearish, which often corresponds to persistent selling pressure or weak demand on rebounds. At the same time, the MACD histogram at -2.1602 indicates negative momentum still dominates, implying that any recovery attempt would first need to overcome ongoing downside impulse.
The volatility lens adds a second dimension. Bollinger Bandwidth at 0.1286 frames the current regime as neither extreme compression nor extreme expansion by itself; it suggests the market may be in a relatively contained phase where directionality can be harder to sustain. In practice, this can create whipsaw risk: oscillators remain bearish, but volatility is not necessarily signaling immediate breakout conditions.
Cross-checking the technical dashboard also highlights that bearish momentum is not a single-indicator story. The signal table records TS Mom(20) at -22.52 and ROC(20) at -6.828 as bearish—both consistent with a market that has been losing ground over the last several weeks. Meanwhile, there are early “tactical rebound” hints inside the same set, such as Stoch %K at 19.02 (Bullish), which can appear when a market is oversold and attempting to stabilize.
Net assessment: momentum reads weak but potentially late-cycle within the pullback. For confirmation, traders typically look for RSI to recover from depressed readings and for MACD histogram deterioration to slow, ideally alongside a favorable reaction near identified support.
4) Support / Resistance zones
Support ~ 285.2000 | Resistance ~ 348.9875
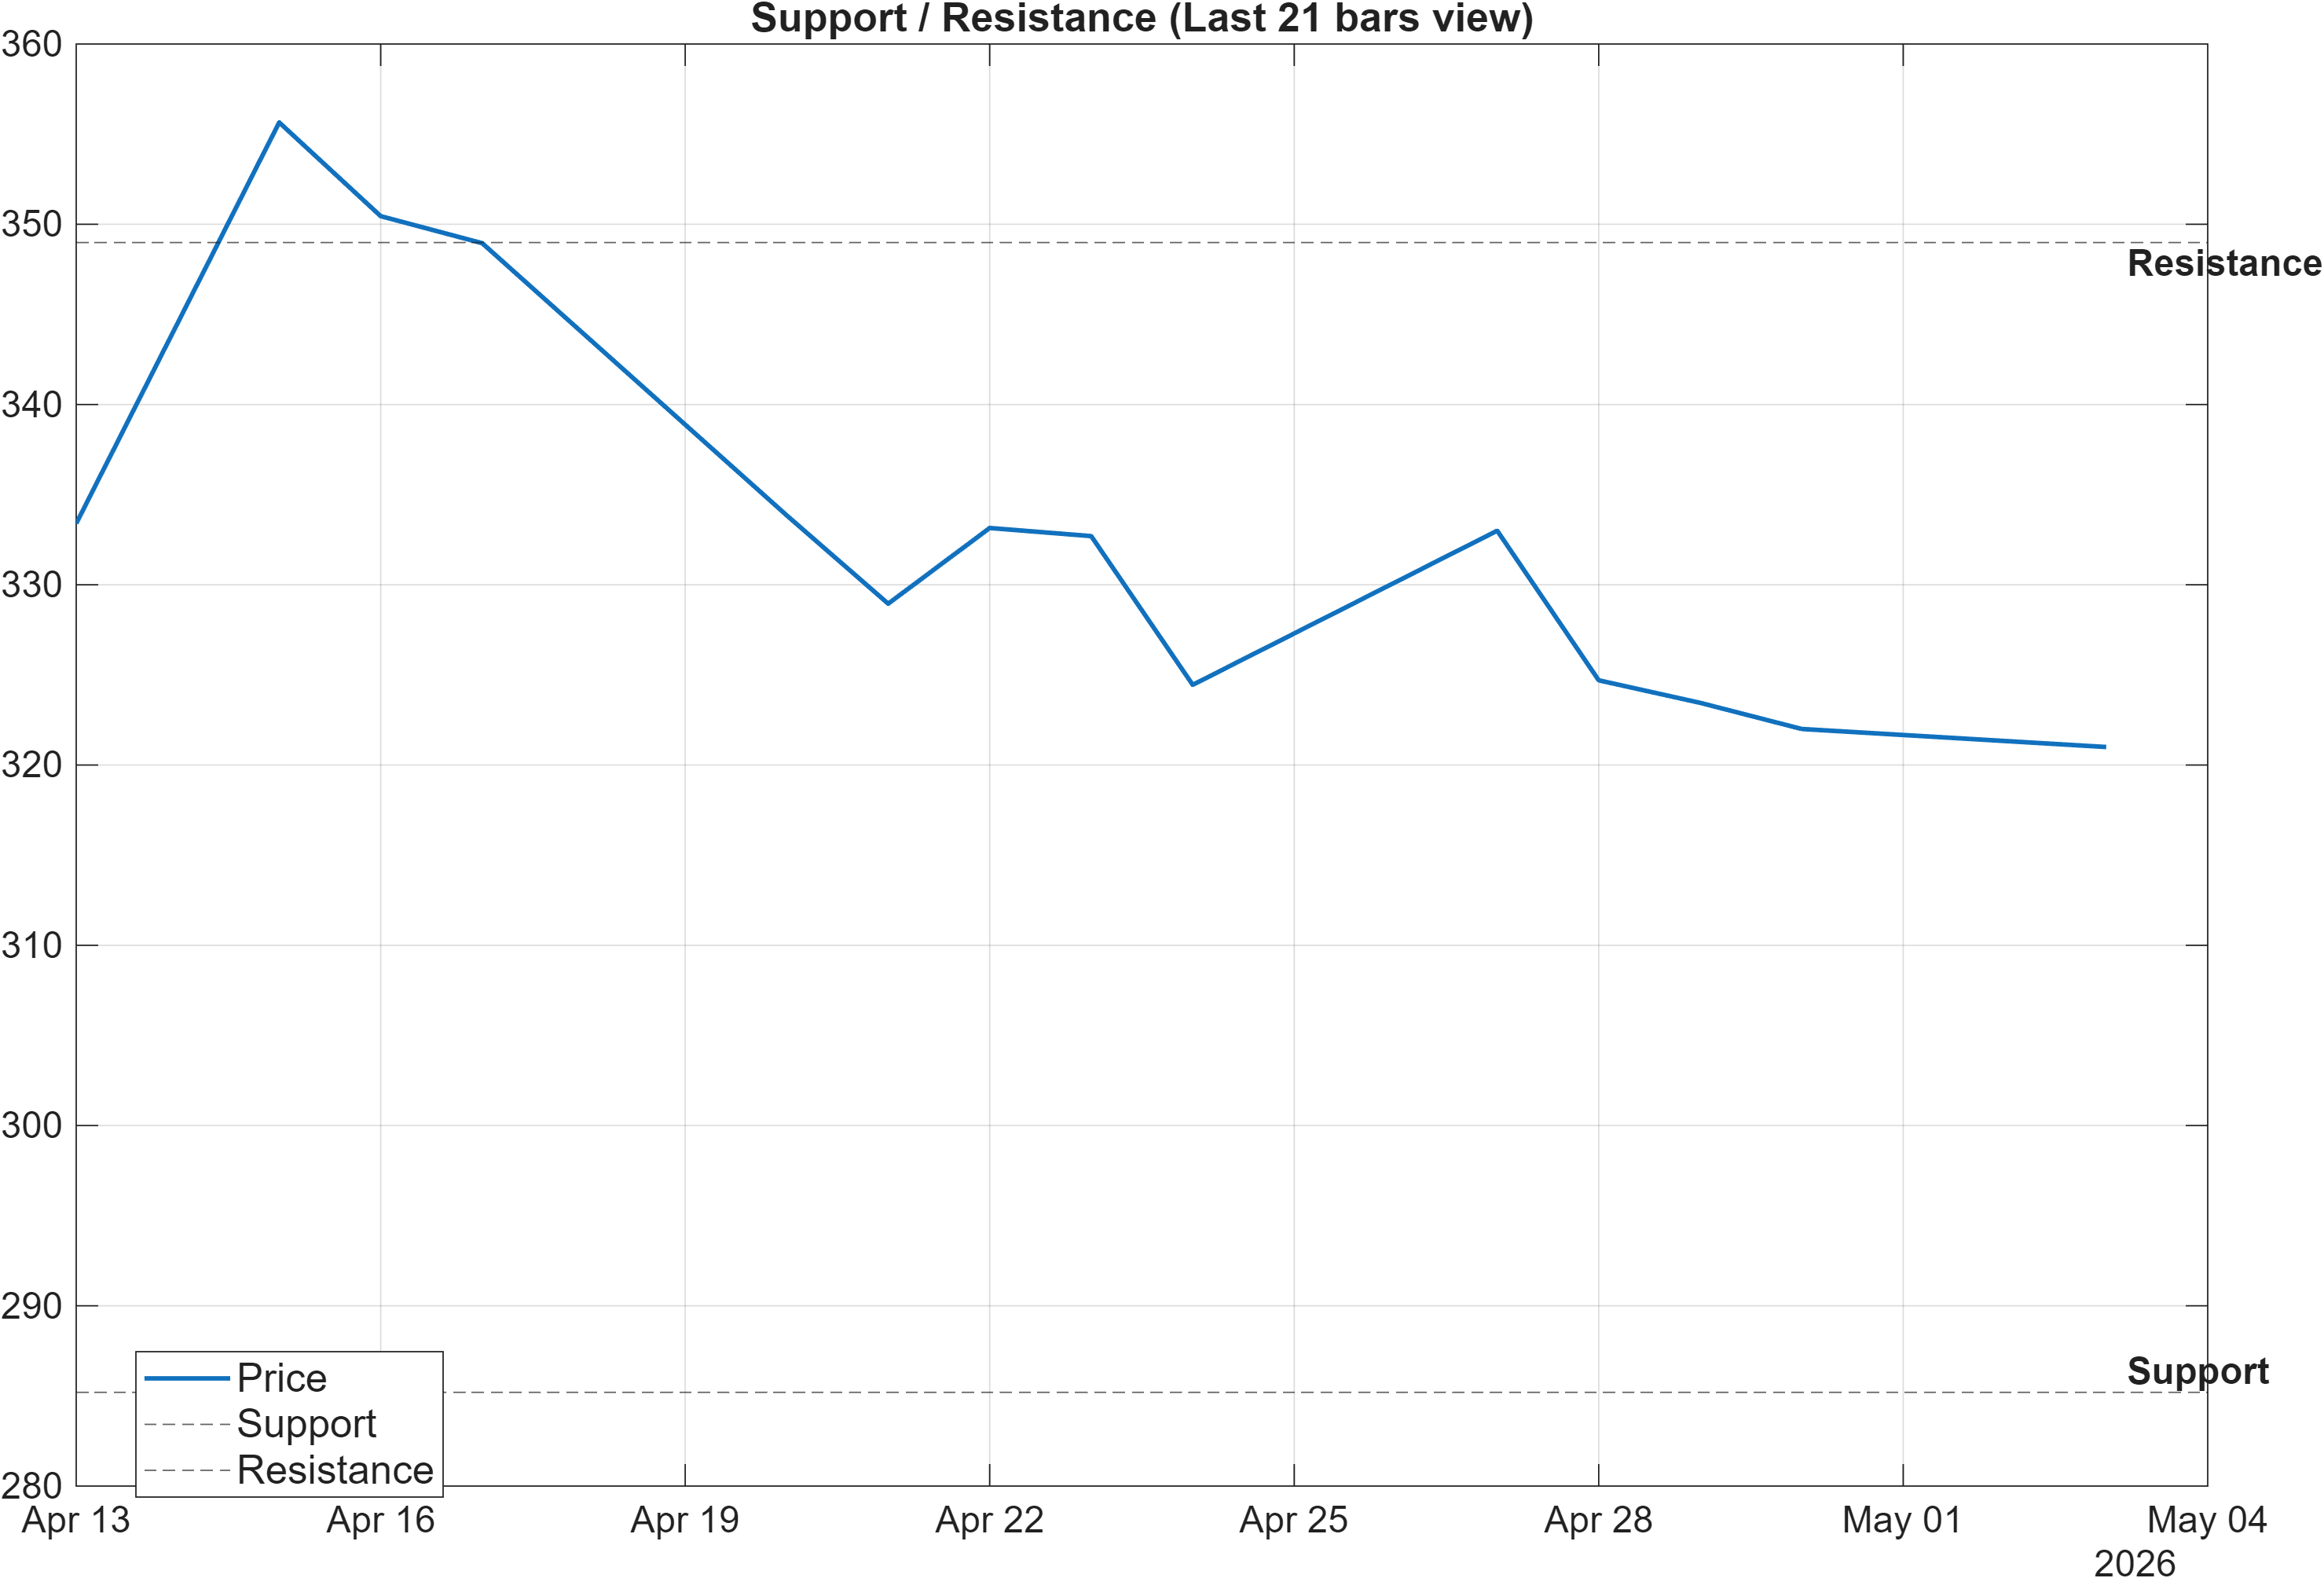
Scenario view: Break above resistance with volume → continuation. Close below support → signal deterioration risk.
The level map is clean and actionable: 285.2000 defines the primary support decision zone, while 348.9875 caps the upside as the key resistance. Given the mixed regime—longer-term bullish ranks alongside bearish technical confluence—these zones function as validation points for whether the broader constructive bias can reassert itself or whether near-term weakness transitions into deeper deterioration.
A resistance break is not just a price event in isolation; the framework explicitly requires a break above resistance with volume to support continuation. That condition is aligned with several internal signals that currently look heavy on participation metrics (for example, Vol ROC(20) at -43.48 is bearish and suggests recent volume dynamics have not been supportive). Without improving participation, price can briefly probe resistance and then fail, which would reinforce the current bearish confluence.
On the downside, a close below 285.2000 is flagged as deterioration risk. That matters because momentum is already soft (e.g., MACD histogram -2.1602 and RSI(14) 29.39), so a support failure would occur in a context where downside impulse has not yet clearly resolved. In those environments, failed support can accelerate signal alignment to the downside, potentially pulling shorter-horizon ranks further away from the still-strong 6-month profile.
Overall, the price path between these zones should be treated as a range of decision rather than a forecast: strength is best validated through acceptance above 348.9875 with participation, while fragility is best diagnosed through closes below 285.2000.
5) Quant Technical Dashboard (18 Signals)
KGNAI AI Technical Analysis Score (Deep Reinforcement Learning): Rank #751 out of 1222 (Rank 1 represents the strongest technical positioning and a higher probability of favorable price behavior. As ranks increase toward the maximum, the probability of favorable outcomes weakens and bearish positioning becomes more dominant.) | Label: Neutral | Score: -0.229
18-Signal Technical Confluence Score: -0.500 (Bearish)
Overall Technical Score (18-signal confluence + DRL rank blend): -0.419 (Bearish)
Note: The blended score reflects signal strength weighted against broader AI technical ranking, which may temporarily diverge.
Blended technical score breakdown: -0.419 (Bearish | Bull 3 / Bear 12 / Neutral 3)
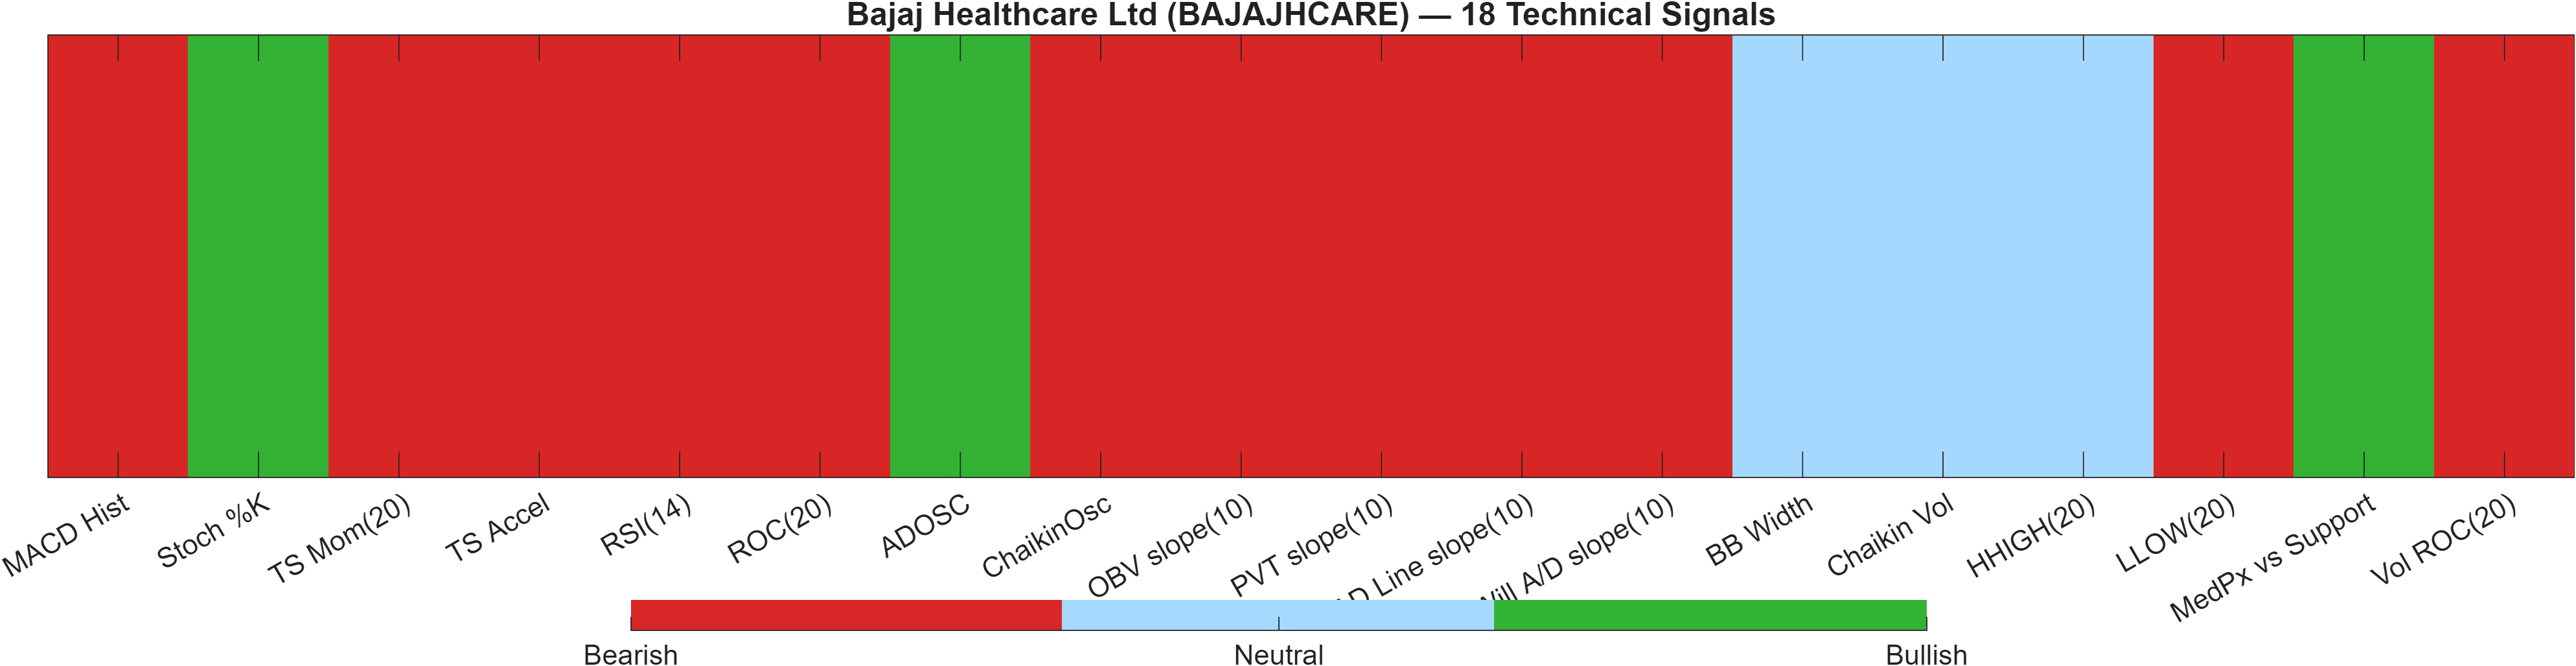
Signal alignment vs divergence
The dashboard’s central message is bearish breadth across independent signal groups, even as the AI technical rank label remains neutral. The 18-signal confluence score of -0.500 (Bearish) and the overall blended technical score of -0.419 (Bearish) indicate that, on balance, trend, momentum, and participation measures are not currently aligned for upside follow-through. The breakdown (Bull 3 / Bear 12 / Neutral 3) suggests bearish signals are not isolated; they are dominant across the set.
The Deep Reinforcement Learning technical rank sits at #751 out of 1222 with a score of -0.229 and a neutral label. That positioning implies BAJAJHCARE is not among the stronger technical setups in the tracked universe at the moment, and it also helps explain how longer-term rank strength can coexist with near-term technical softness: the AI rank system is cross-sectional and time-sensitive, so the short-horizon “state” can deteriorate even if the longer-horizon ranks remain favorable.
At the indicator level, several core momentum and trend measures reinforce the bearish read: RSI(14) 29.39 (Bearish) and MACD Hist -2.16 (Bearish) both point to downside momentum. Participation/flow proxies also lean negative (e.g., OBV slope(10) -4560 and PVT slope(10) -219.2 are bearish), which can be a headwind for sustained rebounds because recoveries tend to be more durable when accumulation metrics improve.
Still, the dashboard contains limited counter-signals that often appear late in selloffs: Stoch %K 19.02 (Bullish) and ADOSC 34.39 (Bullish) suggest some short-term stabilization pressure. The key analytical point is that these bullish elements are currently outvoted by the broader bearish set, so any rebound would be better treated as a test of resistance and moving-average structure until confluence improves.
Signal table (Bull/Bear/Neutral)
| Indicator | Value | Signal |
|---|---|---|
| MACD Hist | -2.16 | Bearish |
| Stoch %K | 19.02 | Bullish |
| TS Mom(20) | -22.52 | Bearish |
| TS Accel | -59.95 | Bearish |
| RSI(14) | 29.39 | Bearish |
| ROC(20) | -6.828 | Bearish |
| ADOSC | 34.39 | Bullish |
| ChaikinOsc | -5901 | Bearish |
| OBV slope(10) | -4560 | Bearish |
| PVT slope(10) | -219.2 | Bearish |
| AD Line slope(10) | -1.694e+04 | Bearish |
| Will A/D slope(10) | -13.8 | Bearish |
| BB Width | 0.1286 | Neutral |
| Chaikin Vol | -15.95 | Neutral |
| HHIGH(20) | 361.3 | Neutral |
| LLOW(20) | 318.5 | Bearish |
| MedPx vs Support | 38.03 | Bullish |
| Vol ROC(20) | -43.48 | Bearish |
Interpretation: Indicator-level signals form the base confluence, which is then adjusted using a separate AI-driven technical ranking model. The final technical score summarizes this combined view.
6) News sentiment + extractive gist
Note: Instrument-specific news matches were not found, so the digest includes broader market/sector headlines. Links are provided for verification.
Sentiment score (avg): 0.147 | Positive: 50% | Neutral: 38% | Negative: 12%
KGNAI AI News Sentiment Score (normalized -1 to +1): Not available (as of —) | Label: Not available | Overall news score: 0.15
Positive Developments
Recent coverage across major financial outlets indicates a moderately constructive backdrop for risk assets, with pockets of supportive tone driven by earnings and large-cap narrative flow. The aggregate distribution shows 50% positive and an average sentiment score of 0.147, suggesting the news cycle is not broadly risk-off. Several widely followed items reflect resilience in parts of corporate performance and ongoing investor attention to capital allocation and earnings outcomes. For BAJAJHCARE specifically, the relevance is indirect—these are broader market/sector signals rather than company-specific catalysts—but a steadier macro-news tape can help stabilize short-term price action when technical momentum is oversold (as implied by RSI(14) 29.39). In mixed regimes, supportive headlines often matter most as a volatility dampener rather than a directional driver, especially when the technical confluence remains Bearish (-0.500).
Neutral / Mixed Developments
Neutral items largely emphasize markets remaining range-bound and data-dependent, consistent with the technical picture of a decision zone forming rather than a confirmed breakout. The sentiment mix includes 38% neutral, aligning with an environment where investors are monitoring rotations and consolidation dynamics instead of chasing directional moves. That tone fits BAJAJHCARE’s current multi-horizon divergence: longer-term ranks (e.g., 6-Monthly #4) can remain strong while near-term ranks (e.g., Daily #768) reflect tactical softness. With the normalized KGNAI news sentiment score Not available, the report treats the overall news score (0.15) as contextual, not confirmatory.
Negative / Risk Signals
Risk-oriented coverage is present but not dominant (12% negative). The negative cluster is concentrated around macro/flow concerns and risk appetite sensitivity—factors that can amplify technical weakness when momentum is already negative (e.g., MACD histogram -2.1602) and volume dynamics are unfavorable (e.g., Vol ROC(20) -43.48 in the signal set). In that setup, the market tends to respond more sharply to adverse flow narratives because positioning is less resilient. For BAJAJHCARE, the practical risk framing is level-based: negative sentiment bursts matter most if they coincide with a technical failure at support ~285.2000, where the framework flags deterioration risk on a close below that zone.
- Whether risk-off headlines coincide with a close below 285.2000 (support failure confirmation).
- Whether improving tone is accompanied by volume on a move above 348.9875 (continuation validation).
- Whether sentiment remains mildly positive while technicals stay bearish (potential divergence to resolve).
Sources referenced: Reuters, Bloomberg, Yahoo Finance, MarketWatch, Investing.com
7) Sources
Not available in the provided data.
You may also like: How KGNAI AI ranks instruments across global markets
Disclaimer: KGNAI provides AI-generated analytics and educational market commentary only. This is not financial advice. Markets involve risk. Always do your own research.