
DISH TV INDIA LTD. (DISHTV) — 06-May-2026 Technical & Rank Update with a Bearish-to-Neutral Tilt
DISHTV enters 06-May-2026 with weak cross-horizon ranking pressure despite pockets of trend structure that still read constructively on moving averages. KGNAI’s comparative ranks place DISHTV in the lower third to bottom decile across key horizons—most notably weekly (#1163/1222) and monthly (#1153/1222)—while longer horizons remain comparatively less severe (6-month #831/1222; yearly #911/1222). On the indicator stack, momentum is not confirming strength: MACD histogram at -0.0552 and RSI(14) at 41.3 lean risk-off even as the MA relationships are labeled bullish. Volatility conditions are not dormant—Bollinger bandwidth 0.0954 implies an environment where moves can extend quickly, increasing sensitivity around decision zones. Key levels remain clearly defined at support ~1.9950 and resistance ~4.0217, while news sentiment is broadly neutral-to-slightly positive (0.148) but not instrument-specific in the provided data.
- Rank stance: Short Bearish | Mid Bearish | Long Neutral
- Technical confluence: Bearish (18-signal confluence -0.333; blended overall -0.471)
- Key levels: Support ~1.9950 | Resistance ~4.0217
- News sentiment bias: Neutral (avg 0.148; Positive 50% / Neutral 31% / Negative 19%)
- Confirmation / invalidation: A close below ~1.9950 increases deterioration risk; a break above ~4.0217 with volume is the cleanest confirmation condition noted in the provided data.
KGNAI evaluates assets using large cross-sectional datasets built from millions of structured data points. Inputs incorporate fundamental metrics, technical structures, and systematically processed news sentiment. Statistical models, machine learning, and AI frameworks are used to assess relative positioning, signal alignment, and probabilistic behavior across broad universes.
- Ranks are comparative across the tracked universe, not absolute price targets.
- Confluence reflects alignment among independent signal groups.
- Support/resistance levels are probabilistic decision zones, not guarantees.
- Sentiment provides contextual bias within the broader analytical framework.
1) KGNAI AI Analysis
Region: INDIA
Total universe size: 1222 ranked instruments
- Daily rank: #971 out of 1222 — Neutral
- Weekly rank: #1163 out of 1222 — Bearish
- Monthly rank: #1153 out of 1222 — Bearish
- 3-Monthly rank: #991 out of 1222 — Bearish
- 6-Monthly rank: #831 out of 1222 — Neutral
- Yearly rank: #911 out of 1222 — Neutral
Across the 1222-instrument universe, DISHTV’s rank profile suggests persistent relative weakness concentrated in the intermediate horizons. The weekly and monthly placements (both near the bottom decile, at #1163 and #1153) typically coincide with environments where rallies are more likely to be treated as counter-trend until breadth improves. By contrast, the daily rank (#971) is less extreme and labeled neutral, indicating that very short-horizon behavior may be stabilizing without meaningfully reversing the broader comparative trend.
The longer-window picture is notably different: 6-month (#831) and yearly (#911) are also neutral. That mix can occur when a market is not uniformly trending in one regime, producing a split between tactical (short/mid) softness and structural (longer) consolidation. In practice, this combination tends to put more weight on level-based validation (key support/resistance) and momentum confirmation (e.g., MACD/RSI behavior) rather than assuming continuity from any single timeframe.
The stated term view consolidates this into a clear stance: Short-term Bearish, Mid-term Bearish, and Long-term Neutral. For readers using ranks as a cross-sectional filter, DISHTV is currently positioned as an instrument that needs measurable improvement in intermediate-horizon behavior before it can compete with stronger-ranked peers, even if near-term price action intermittently appears firm.
KGNAI ranks each instrument across large universes using multiple proprietary AI tests and statistical models (millions of data points). Lower ranks generally indicate stronger probability of favorable performance behavior, while higher ranks indicate weaker probability and more bearish positioning.
Term view: Short-term: Bearish. Mid-term: Bearish. Long-term: Neutral.
Want the full universe and complete rank tables? Unlock full access on KGNAI: https://www.kgnai.com/pricing
2) Price & trend overview
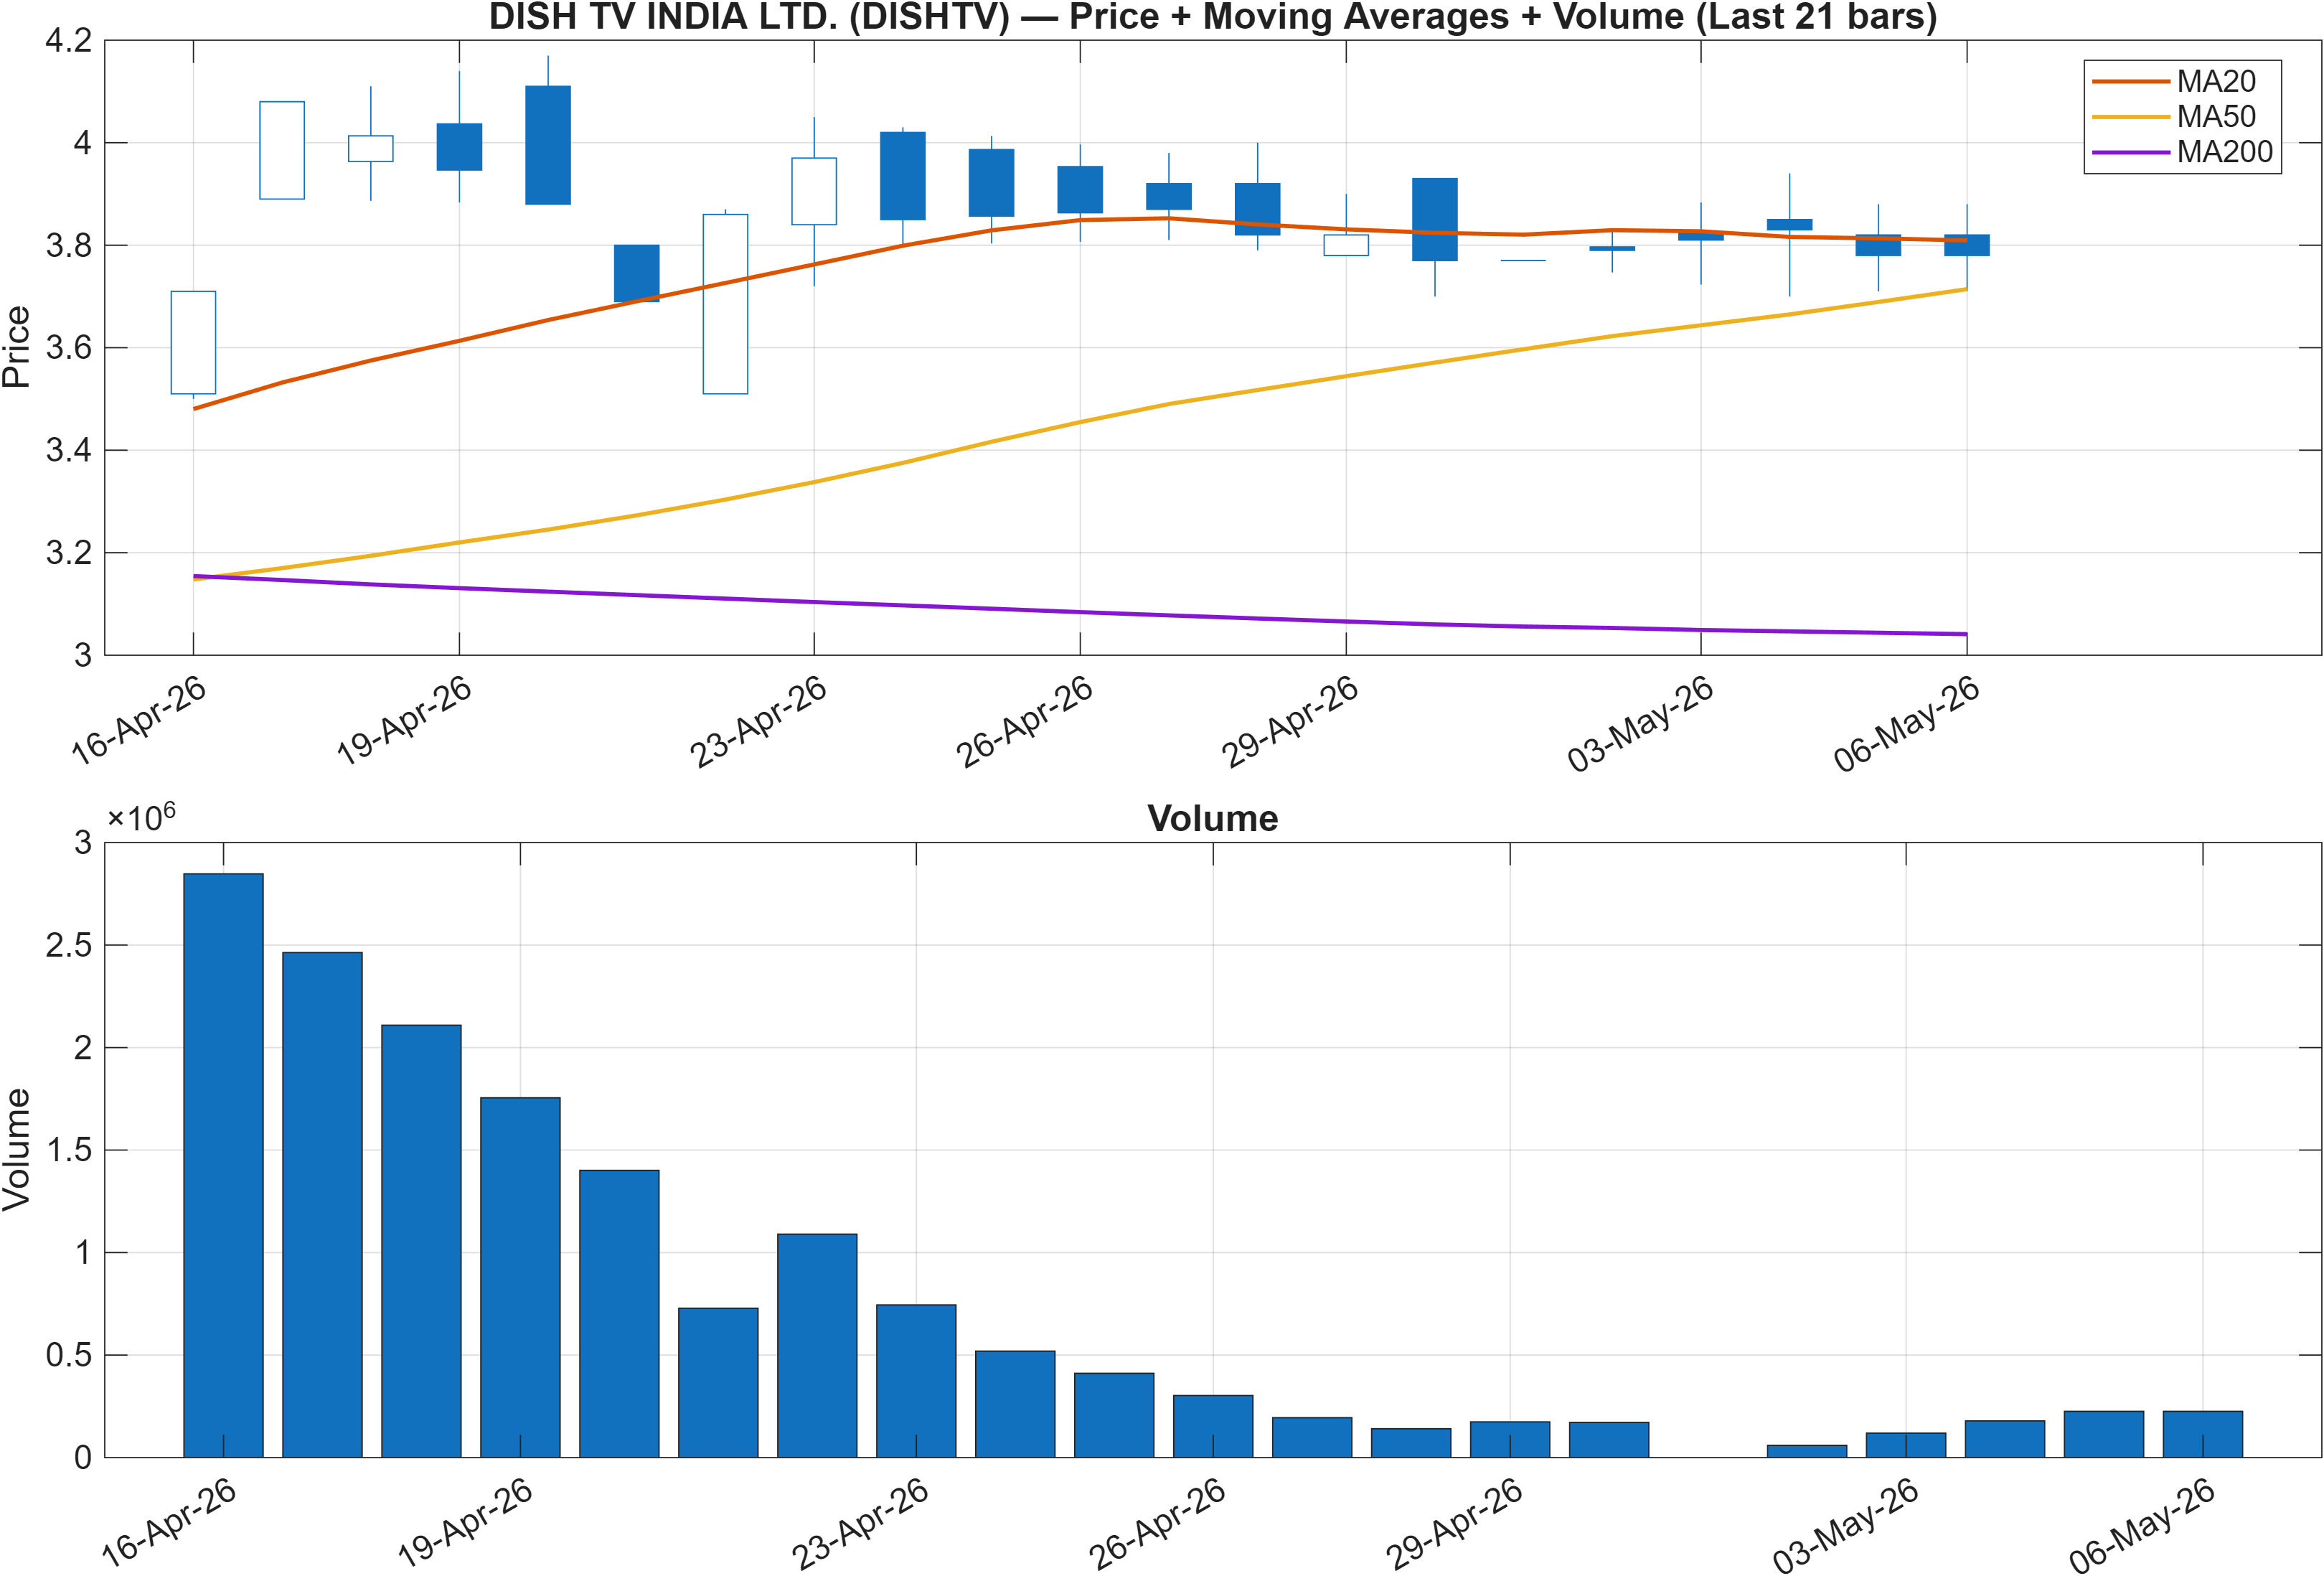
Trend structure in the provided interpretation reads constructive on moving-average relationships: Close vs MA50 = Bullish and MA50 vs MA200 = Bullish. That combination often reflects either (a) a market still holding above its intermediate baseline or (b) a lagging long-term average that has not yet rolled over. However, this trend framing is in tension with DISHTV’s weak weekly/monthly ranks (bottom-decile placement at #1163 and #1153), which suggests that—relative to the broader universe—trend-following signals alone are not being rewarded.
This is a classic alignment vs divergence setup: price/MA structure looks supportive, while the cross-sectional AI ranking is still unfavorable. When these disagree, resolution typically comes from either (i) follow-through that improves intermediate ranks, or (ii) a breakdown that forces the MA-based read to converge toward the weaker ranking regime. In that context, the support at ~1.9950 becomes more than a chart level—it is a practical boundary for whether the bullish MA framing can remain intact.
Volume is shown in the figure but not numerically specified in the provided data; still, the report’s own scenario framework emphasizes “break above resistance with volume” as the confirmation condition. Given resistance at ~4.0217, the market is effectively bracketed: sustained trade inside the range keeps the “trend vs rank” disagreement unresolved, while a directional move beyond either boundary would likely compress the disagreement quickly.
Interpretation: Close vs MA50 = Bullish, MA50 vs MA200 = Bullish.
3) Momentum & volatility dashboard
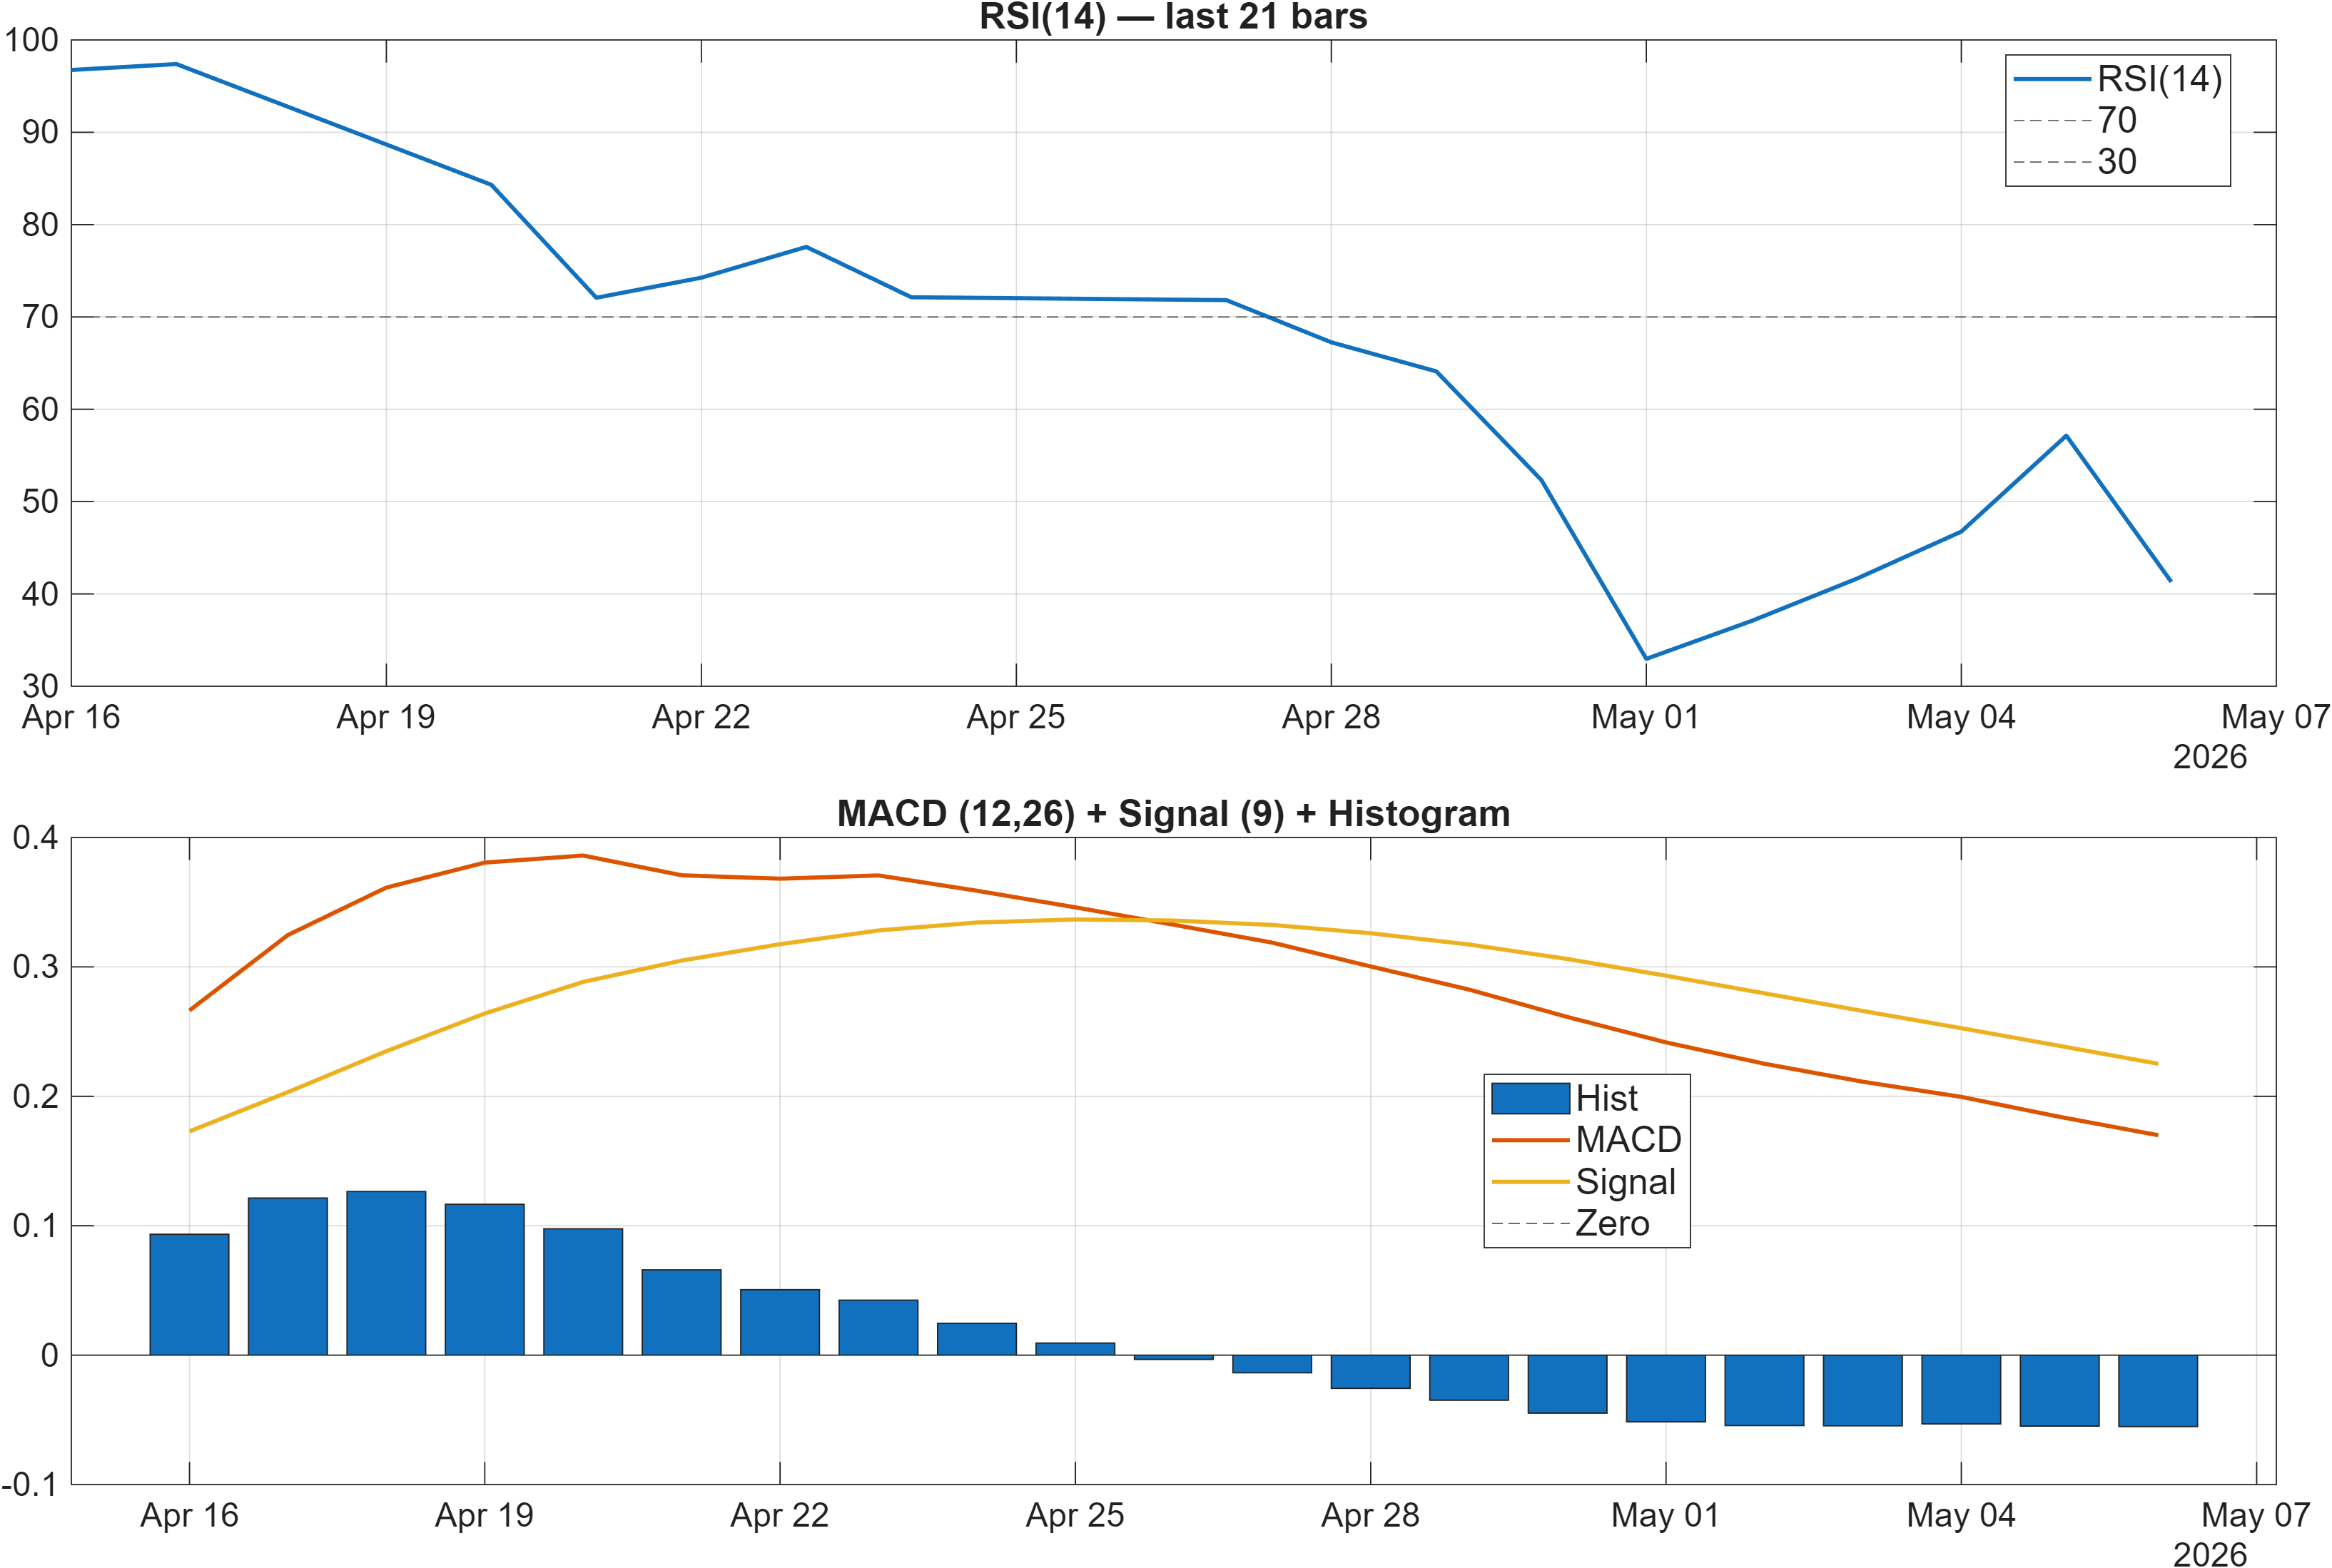
Momentum readings lean defensive. The stated bias is RSI Neutral in the interpretation line, but the signal table classifies RSI(14) at 41.3 as Bearish, consistent with sub-50 RSI behavior where upside impulses often struggle to persist. MACD is also not confirming upside: the interpretation shows MACD hist = -0.0552 (table: -0.05522), which typically aligns with negative momentum carry even if price is temporarily holding above averages.
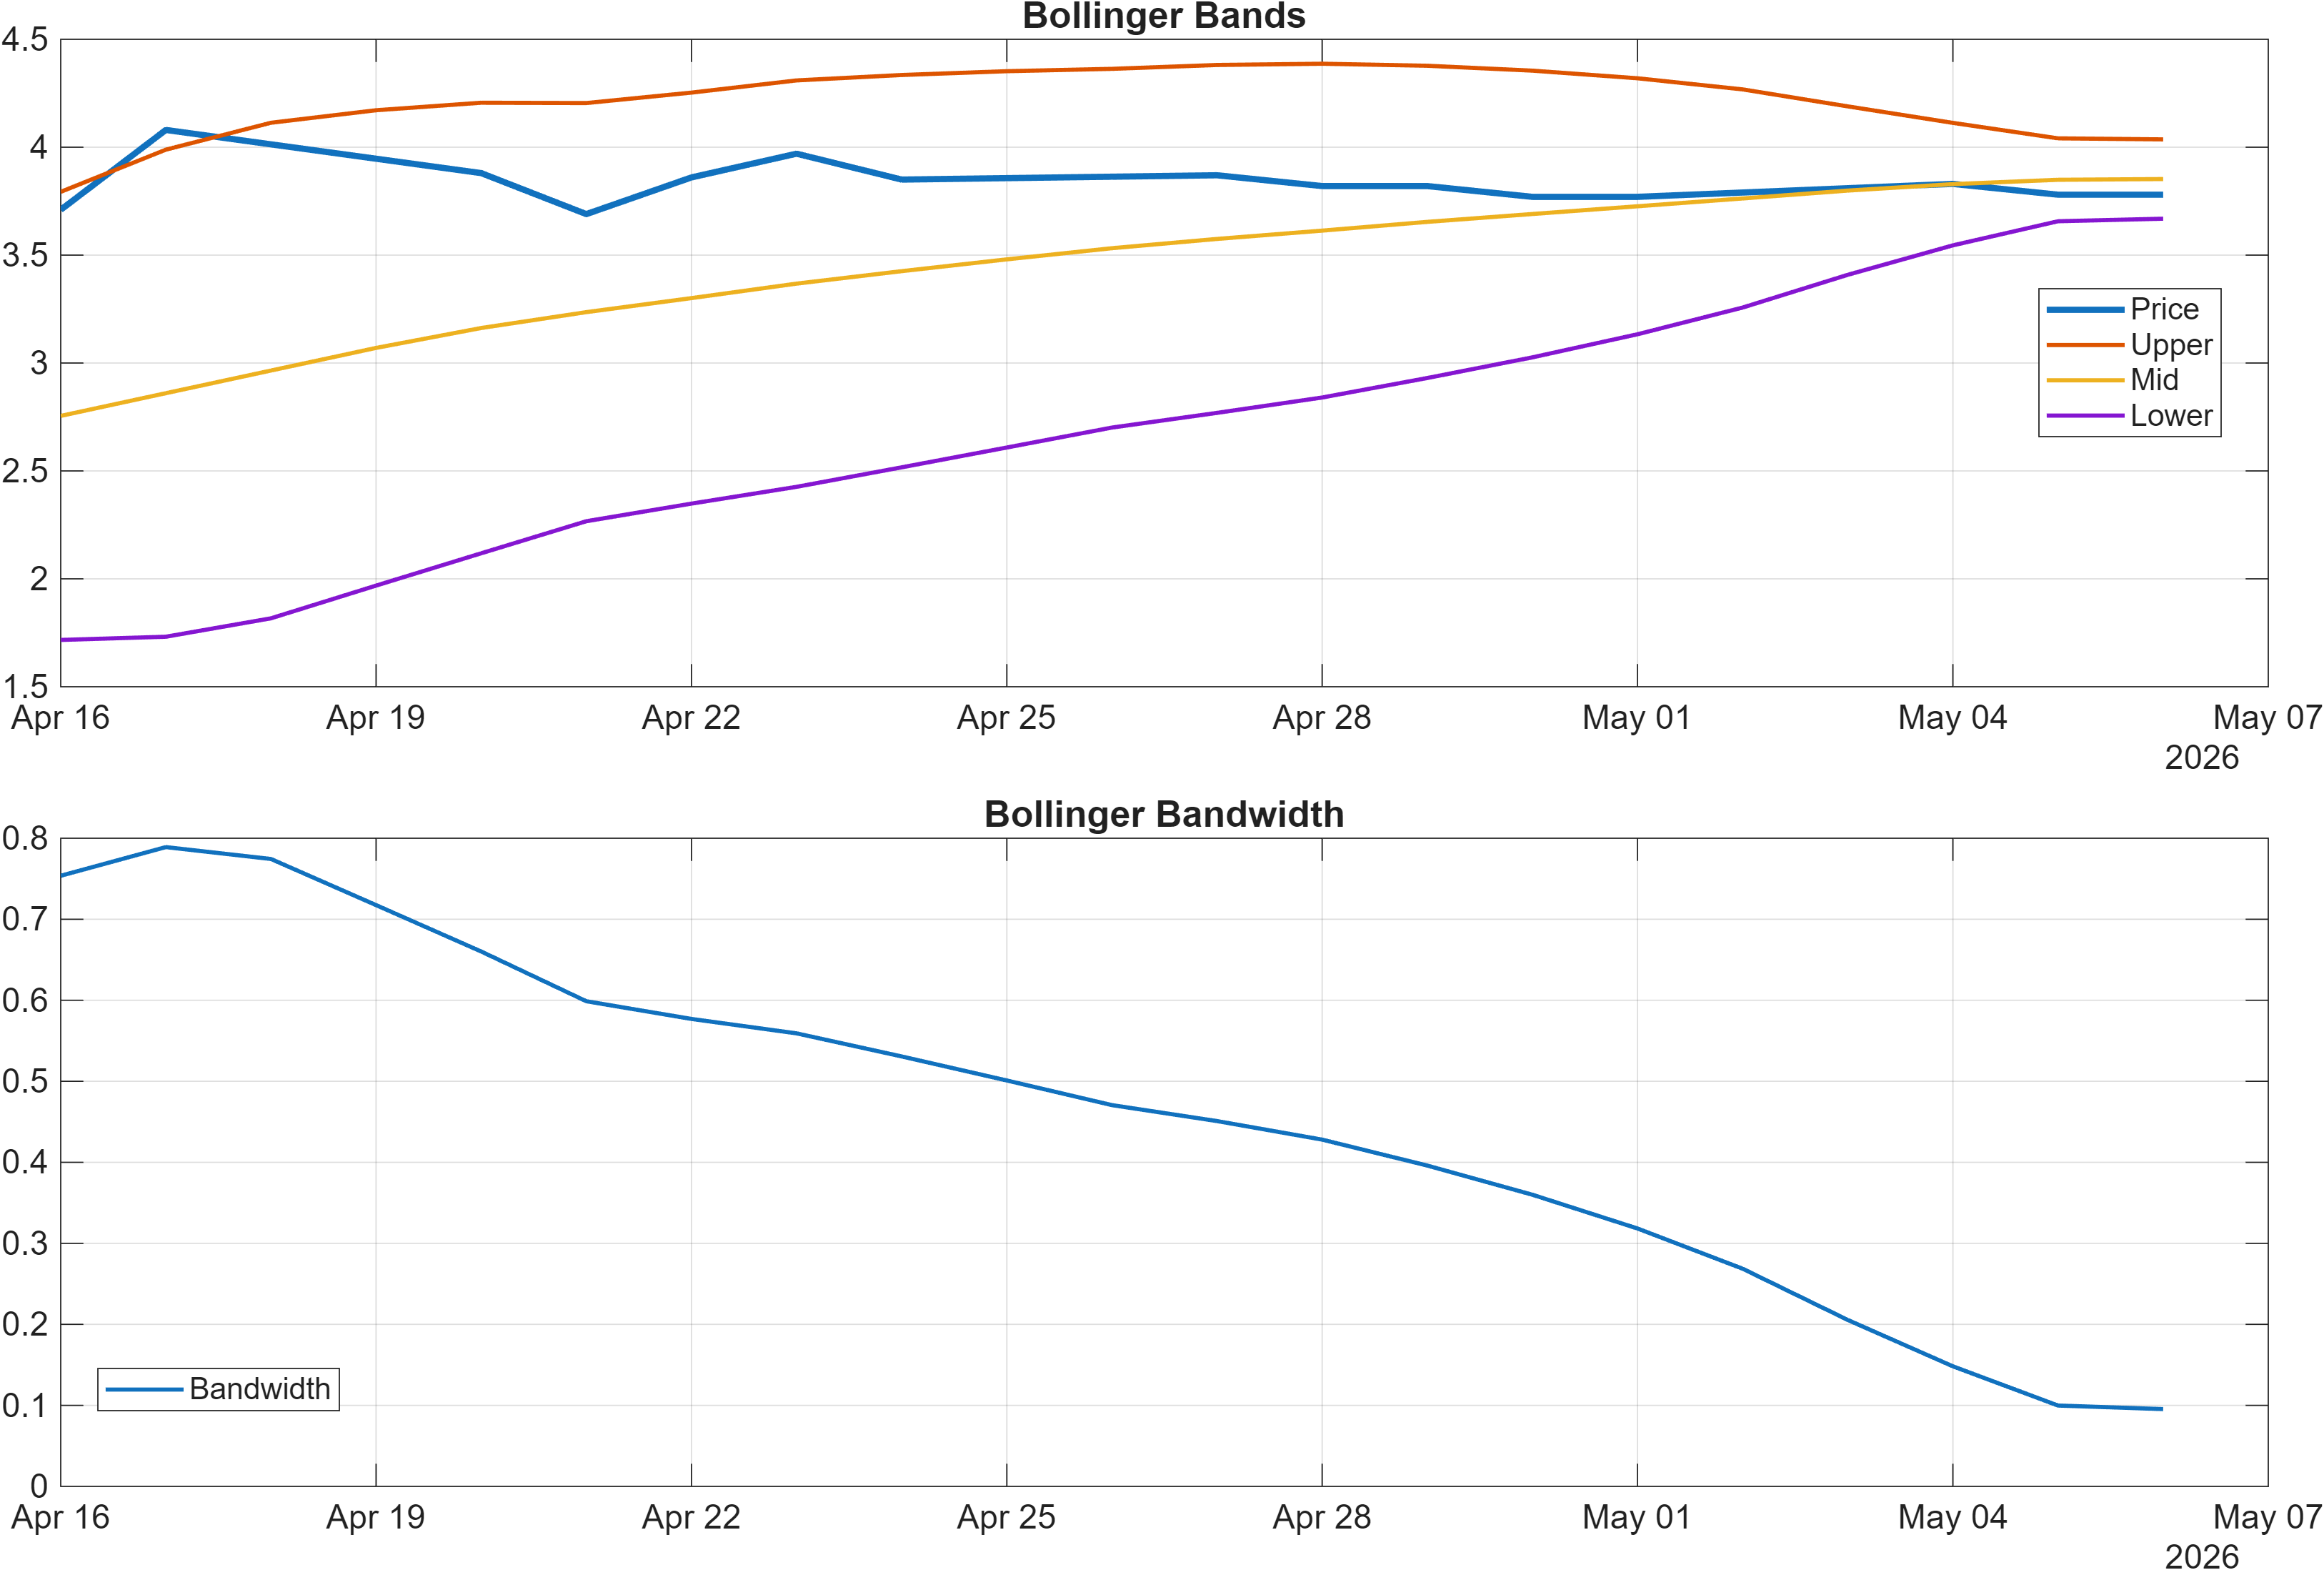
The volatility layer adds nuance. Bollinger bandwidth at 0.0954 is flagged bullish, which is less about direction and more about regime: expanding bandwidth often coincides with greater price dispersion and wider tactical swings. That can create short-lived rallies, but it can also amplify drawdowns if downside momentum is already present. Importantly, volatility expansion combined with negative MACD tends to make support tests more consequential, because moves can extend further before mean reversion appears.
Other momentum/velocity elements in the signal set reinforce the same theme: ROC(20) at -7.353 and TS Accel at -2.467 are bearish, suggesting that any bounce would need to prove itself by improving the rate-of-change profile rather than relying on a single oversold-style response. Overall, the dashboard points to volatility that can move with momentum that has not yet turned.
Interpretation: RSI bias = Neutral, MACD hist = -0.0552.
Interpretation: Bandwidth (volatility regime) latest = 0.0954.
4) Support / Resistance zones
Support ~ 1.9950 | Resistance ~ 4.0217
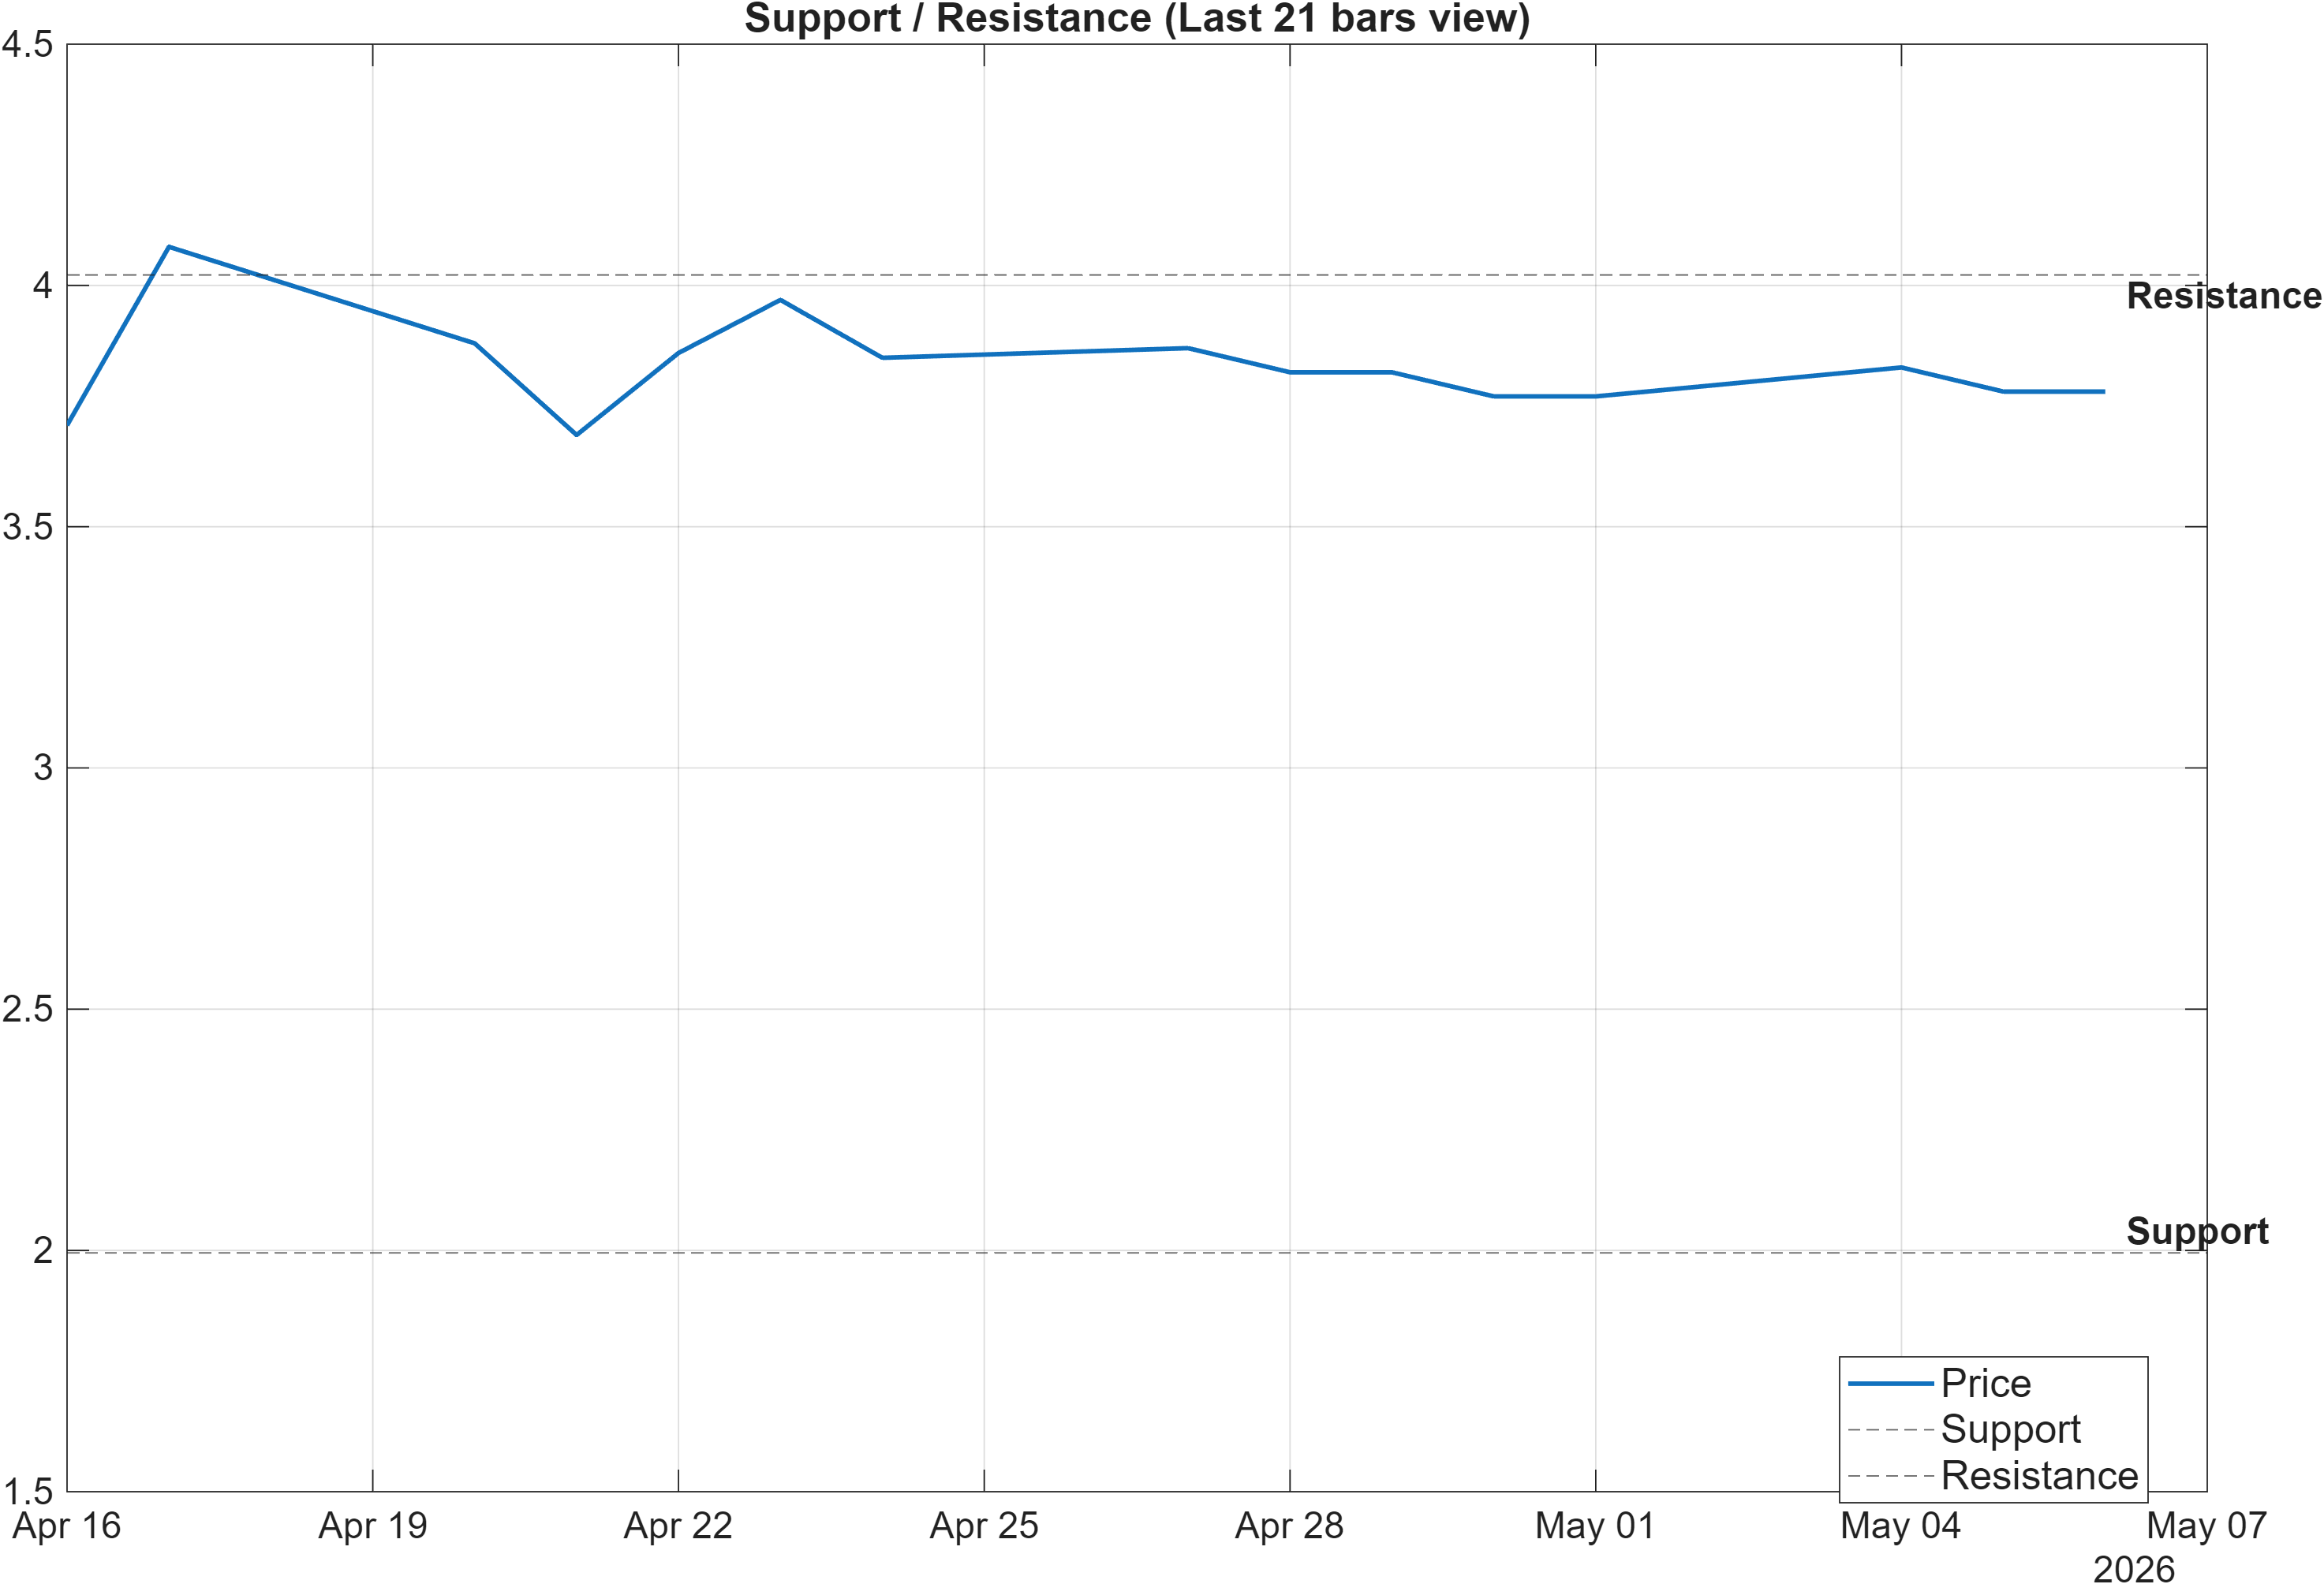
DISHTV’s level map is unusually clean: support ~1.9950 and resistance ~4.0217 define a wide decision corridor. With the technical stack leaning bearish (overall blended score -0.471) and intermediate ranks weak, support carries added weight as a regime boundary rather than merely a trading reference. A close below support is explicitly framed as “signal deterioration risk,” which would also be consistent with the negative momentum readings (e.g., MACD histogram -0.0552 and ROC(20) -7.353).
On the upside, the report’s scenario condition is specific: break above resistance with volume → continuation. Given the distance to ~4.0217, an upside resolution would likely require not only a price move, but also an improvement in momentum confirmation (RSI shifting away from 41.3 conditions) and better participation signals. Notably, there are some early constructive hints in the volume/accumulation indicators (e.g., OBV slope(10) is bullish and ADOSC is bullish), but these are not yet sufficient to outweigh the broader bearish majority in the 18-signal mix.
Because volatility regime is not compressed (BB width 0.0954), level interactions may be less “precise” and more characterized by overshoots and fast re-tests. Practically, that makes closing behavior around 1.9950 and 4.0217 more informative than intraday spikes. Until a breakout/breakdown is confirmed, the level framework suggests a market still negotiating whether it is in range continuation or moving toward trend resumption.
Scenario view: Break above resistance with volume → continuation. Close below support → signal deterioration risk.
5) Quant Technical Dashboard (18 Signals)
KGNAI AI Technical Analysis Score (Deep Reinforcement Learning): Rank #1095 out of 1222 (Rank 1 represents the strongest technical positioning and a higher probability of favorable price behavior. As ranks increase toward the maximum, the probability of favorable outcomes weakens and bearish positioning becomes more dominant.) | Label: Bearish | Score: -0.792
18-Signal Technical Confluence Score: -0.333 (Bearish)
Overall Technical Score (18-signal confluence + DRL rank blend): -0.471 (Bearish)
Note: The blended score reflects signal strength weighted against broader AI technical ranking, which may temporarily diverge.
Blended technical score breakdown: -0.471 (Bearish | Bull 4 / Bear 10 / Neutral 4)
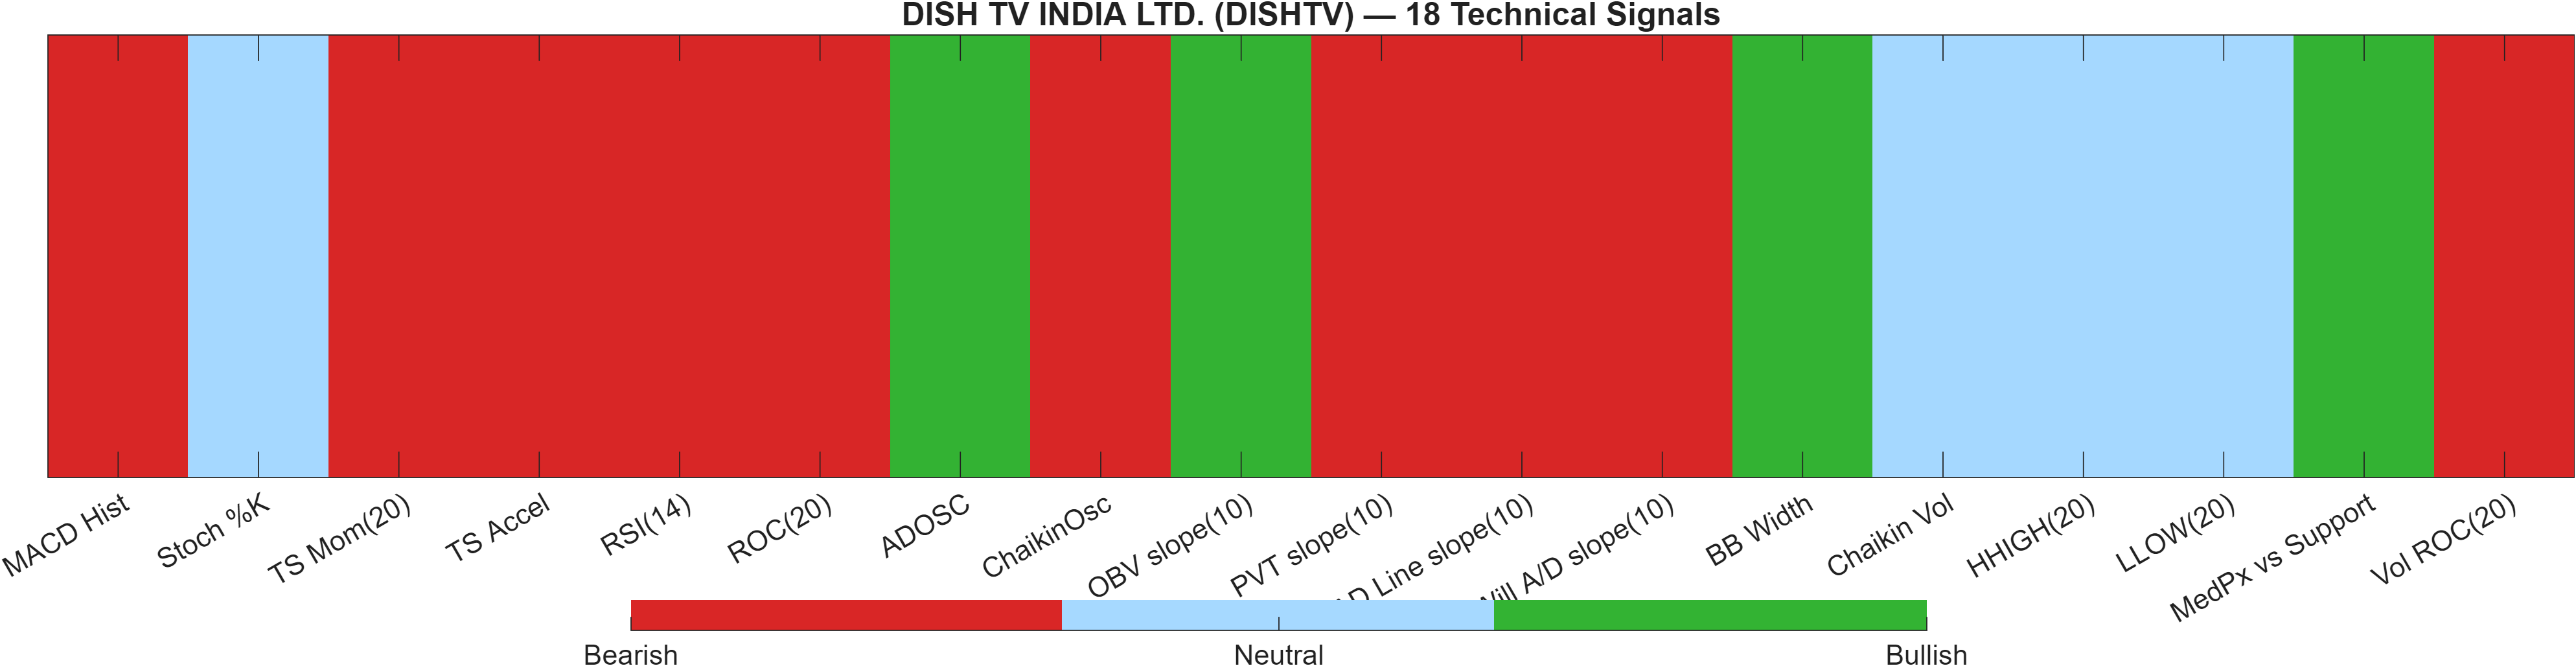
The technical dashboard emphasizes breadth of bearish signals rather than a single indicator failure. The 18-signal confluence is -0.333 (Bearish), and the blended overall score declines further to -0.471, reflecting the additional weight of the DRL model. The DRL technical rank (#1095/1222) reinforces that, cross-sectionally, DISHTV’s technical posture is not currently competitive versus peers.
Internally, the composition matters: Bear 10 / Bull 4 / Neutral 4 indicates that a reversal case would likely require multiple simultaneous repairs rather than a single “one-off” trigger. Momentum/trajectory components are a key drag (e.g., MACD histogram -0.05522, TS Mom(20) -0.3, ROC(20) -7.353). At the same time, a subset of accumulation/participation signals is not uniformly bearish—ADOSC and OBV slope(10) are flagged bullish—suggesting the tape can still show selective demand even in an overall weak configuration.
Volatility is another differentiator: BB Width 0.0954 is bullish in the signal table, which can be consistent with an environment where breakouts and breakdowns are more likely to travel. In a bearish confluence setting, that increases the importance of respecting the defined decision zones (support ~1.9950, resistance ~4.0217) and waiting for confirmation through indicator alignment (RSI improving from the 41.3 region, and MACD histogram stabilizing).
Signal table (Bull/Bear/Neutral)
| Indicator | Value | Signal |
|---|---|---|
| MACD Hist | -0.05522 | Bearish |
| Stoch %K | 26.67 | Neutral |
| TS Mom(20) | -0.3 | Bearish |
| TS Accel | -2.467 | Bearish |
| RSI(14) | 41.3 | Bearish |
| ROC(20) | -7.353 | Bearish |
| ADOSC | 38.24 | Bullish |
| ChaikinOsc | -2.122e+04 | Bearish |
| OBV slope(10) | 1.493e+04 | Bullish |
| PVT slope(10) | -4784 | Bearish |
| AD Line slope(10) | -3.326e+05 | Bearish |
| Will A/D slope(10) | -0.12 | Bearish |
| BB Width | 0.0954 | Bullish |
| Chaikin Vol | -24.22 | Neutral |
| HHIGH(20) | 4.17 | Neutral |
| LLOW(20) | 3.51 | Neutral |
| MedPx vs Support | 1.8 | Bullish |
| Vol ROC(20) | -90.84 | Bearish |
Interpretation: Indicator-level signals form the base confluence, which is then adjusted using a separate AI-driven technical ranking model. The final technical score summarizes this combined view.
6) News sentiment + extractive gist
Note: Instrument-specific news matches were not found, so the digest includes broader market/sector headlines. Links are provided for verification.
Sentiment score (avg): 0.148 | Positive: 50% | Neutral: 31% | Negative: 19%
KGNAI AI News Sentiment Score (normalized -1 to +1): Not available (as of —) | Label: Not available | Overall news score: 0.15
Positive Developments
Recent coverage across major financial outlets indicates a generally supportive backdrop for risk assets, driven by pockets of strong corporate results and persistent interest in AI-related themes. While this is not DISHTV-specific (instrument matches were not found), the aggregate tone can still influence short-horizon flows—particularly when volatility is already elevated (BB bandwidth 0.0954). With the sentiment mix showing 50% positive and an average score of 0.148, the news tape leans mildly constructive rather than defensive. In markets where rankings are weak (DISHTV weekly #1163/1222), a benign macro-equity tone sometimes helps stabilize price action, but it typically does not replace the need for technical confirmation. Any upside follow-through in DISHTV would still be expected to show up as improvements in momentum alignment (e.g., MACD histogram moving away from -0.0552) and cleaner behavior around resistance (~4.0217).
Neutral / Mixed Developments
The news flow also includes policy and market-structure discussions that are directionally ambiguous for near-term pricing, such as changes to disclosure norms and shifting expectations around transparency and reporting cadence. For price action, this type of information tends to matter through its impact on volatility and liquidity rather than immediate fundamentals. That framing fits DISHTV’s current setup: the chart-based trend read is positive on moving averages, but the cross-sectional ranks remain weak in the mid horizons, suggesting a market that is sensitive to incremental shifts in risk appetite. With 31% neutral items in the sentiment mix, the information set appears to be providing context more than impulse, leaving the support ~1.9950 and resistance ~4.0217 levels as the primary decision anchors.
Negative / Risk Signals
Risk-oriented coverage highlights a more cautious undercurrent: mixed index-level breadth, episodes of selling pressure, and attention to regulatory and cybersecurity risks linked to advanced AI tooling. Separately, shifts in rate expectations can tighten financial conditions and raise the hurdle for lower-ranked instruments to sustain rallies. For DISHTV, this matters because the technical stack is already skewed bearish (overall blended -0.471; DRL score -0.792), and momentum indicators remain negative (RSI 41.3, MACD histogram -0.0552). In such a configuration, negative macro or risk headlines can act less as a catalyst and more as an accelerant if price begins to stress key supports. The report’s own scenario language is consistent: a close below ~1.9950 raises deterioration risk under a risk-off tape.
- Whether sentiment remains neutral-to-positive (0.148) during tests of ~1.9950.
- Any shift in risk backdrop that coincides with momentum repair (MACD histogram improving from -0.0552; RSI lifting from 41.3).
- Whether broader volatility stays elevated (bandwidth 0.0954) and increases the probability of level breaks.
Sources referenced: Reuters, Bloomberg, Yahoo Finance, MarketWatch, Investing.com
Snapshot: AI Rank (Short–Mid–Long): Mixed (Bearish tilt) (Bearish–Bearish–Neutral) · Technical Confluence: Bearish · Key Levels: Support ~2.00 | Resistance ~4.02 · News Sentiment: Neutral
7) Sources
- Not available in the provided data.
You may also like: How KGNAI AI ranks instruments across global markets
Disclaimer: KGNAI provides AI-generated analytics and educational market commentary only. This is not financial advice. Markets involve risk. Always do your own research.