
TATAPOWER (Tata Power Co. Ltd.) — 01-May-2026 Technical Stance: Range-Biased With Select Bullish Signals
Tata Power Co. Ltd. (TATAPOWER) enters 01-May-2026 with a market posture that is better described as selectively constructive rather than trend-dominant. KGNAI’s cross-sectional ranks place the stock largely in a neutral positioning across most horizons (daily, monthly, 3-monthly, 6-monthly, yearly), while the weekly rank stands out as the more supportive input. On the chart-based layer, moving-average relationships still lean constructive, and momentum is broadly positive with RSI flagged bullish and MACD histogram marginally positive at 0.0333. Volatility, however, remains moderate-to-contained with Bollinger bandwidth at 0.1323, consistent with an environment where breakouts require confirmation. Key decision zones remain well-defined at support ~369.3125 and resistance ~446.1250, framing a practical range for validation or deterioration.
Key Takeaways
- Short / Mid / Long rank stance: Neutral (weekly is the exception with a bullish tilt)
- Technical confluence label: Bullish (18-signal score 0.556; blended overall 0.279 is Neutral)
- Key support / resistance: 369.3125 / 446.1250
- News sentiment bias: Mildly constructive mix (avg sentiment 0.184; normalized score -0.10 labeled bullish)
- Confirmation / invalidation condition: A volume-confirmed move above 446.1250 improves continuation odds; a close below 369.3125 increases deterioration risk
What KGNAI Measures
KGNAI evaluates assets using large cross-sectional datasets built from millions of structured data points. Inputs incorporate fundamental metrics, technical structures, and systematically processed news sentiment. Statistical models, machine learning, and AI frameworks are used to assess relative positioning, signal alignment, and probabilistic behavior across broad universes.
How to Read This Report
- Ranks are comparative across the tracked universe, not absolute price targets.
- Confluence reflects alignment among independent signal groups.
- Support/resistance levels are probabilistic decision zones, not guarantees.
- Sentiment provides contextual bias within the broader analytical framework.
1) KGNAI AI Analysis
Region: INDIA
Total universe size: 1222 ranked instruments
- Daily rank: #426 out of 1222 — Neutral
- Weekly rank: #232 out of 1222 — Bullish
- Monthly rank: #711 out of 1222 — Neutral
- 3-Monthly rank: #640 out of 1222 — Neutral
- 6-Monthly rank: #529 out of 1222 — Neutral
- Yearly rank: #481 out of 1222 — Neutral
The rank stack highlights a dispersion across horizons rather than a clean, persistent leadership profile. The weekly rank (#232) sits in the upper quartile of the 1222-name universe and is the clearest constructive input, suggesting the most favorable behavior is concentrated in the intermediate window. In contrast, the monthly rank (#711) falls into the lower half, which is consistent with a market that may be improving tactically but not yet demonstrating broad cross-horizon strength.
The daily rank (#426) is closer to the middle of the universe, aligning with the headline characterization of “No Strong Trend Present” in the original snapshot. When daily neutrality coexists with a stronger weekly reading, it often implies that near-term noise is still active while the intermediate trend is attempting to stabilize. The longer windows remain neutral (e.g., yearly #481; 6-monthly #529), which reinforces a range-to-transition regime rather than a mature directional phase.
From a process perspective, the practical implication is that TATAPOWER currently screens as a candidate for confirmation-based positioning: the weekly profile supports constructive setups, but the weaker monthly standing argues for discipline around invalidation levels and follow-through. This rank configuration tends to reward strategies that require multiple confirmations (trend + momentum + volume) rather than relying on a single signal.
Term view: Short-term: Neutral. Mid-term: Neutral. Long-term: Neutral.
Want the full universe and complete rank tables? Unlock full access on KGNAI: https://www.kgnai.com/pricing
2) Price & trend overview
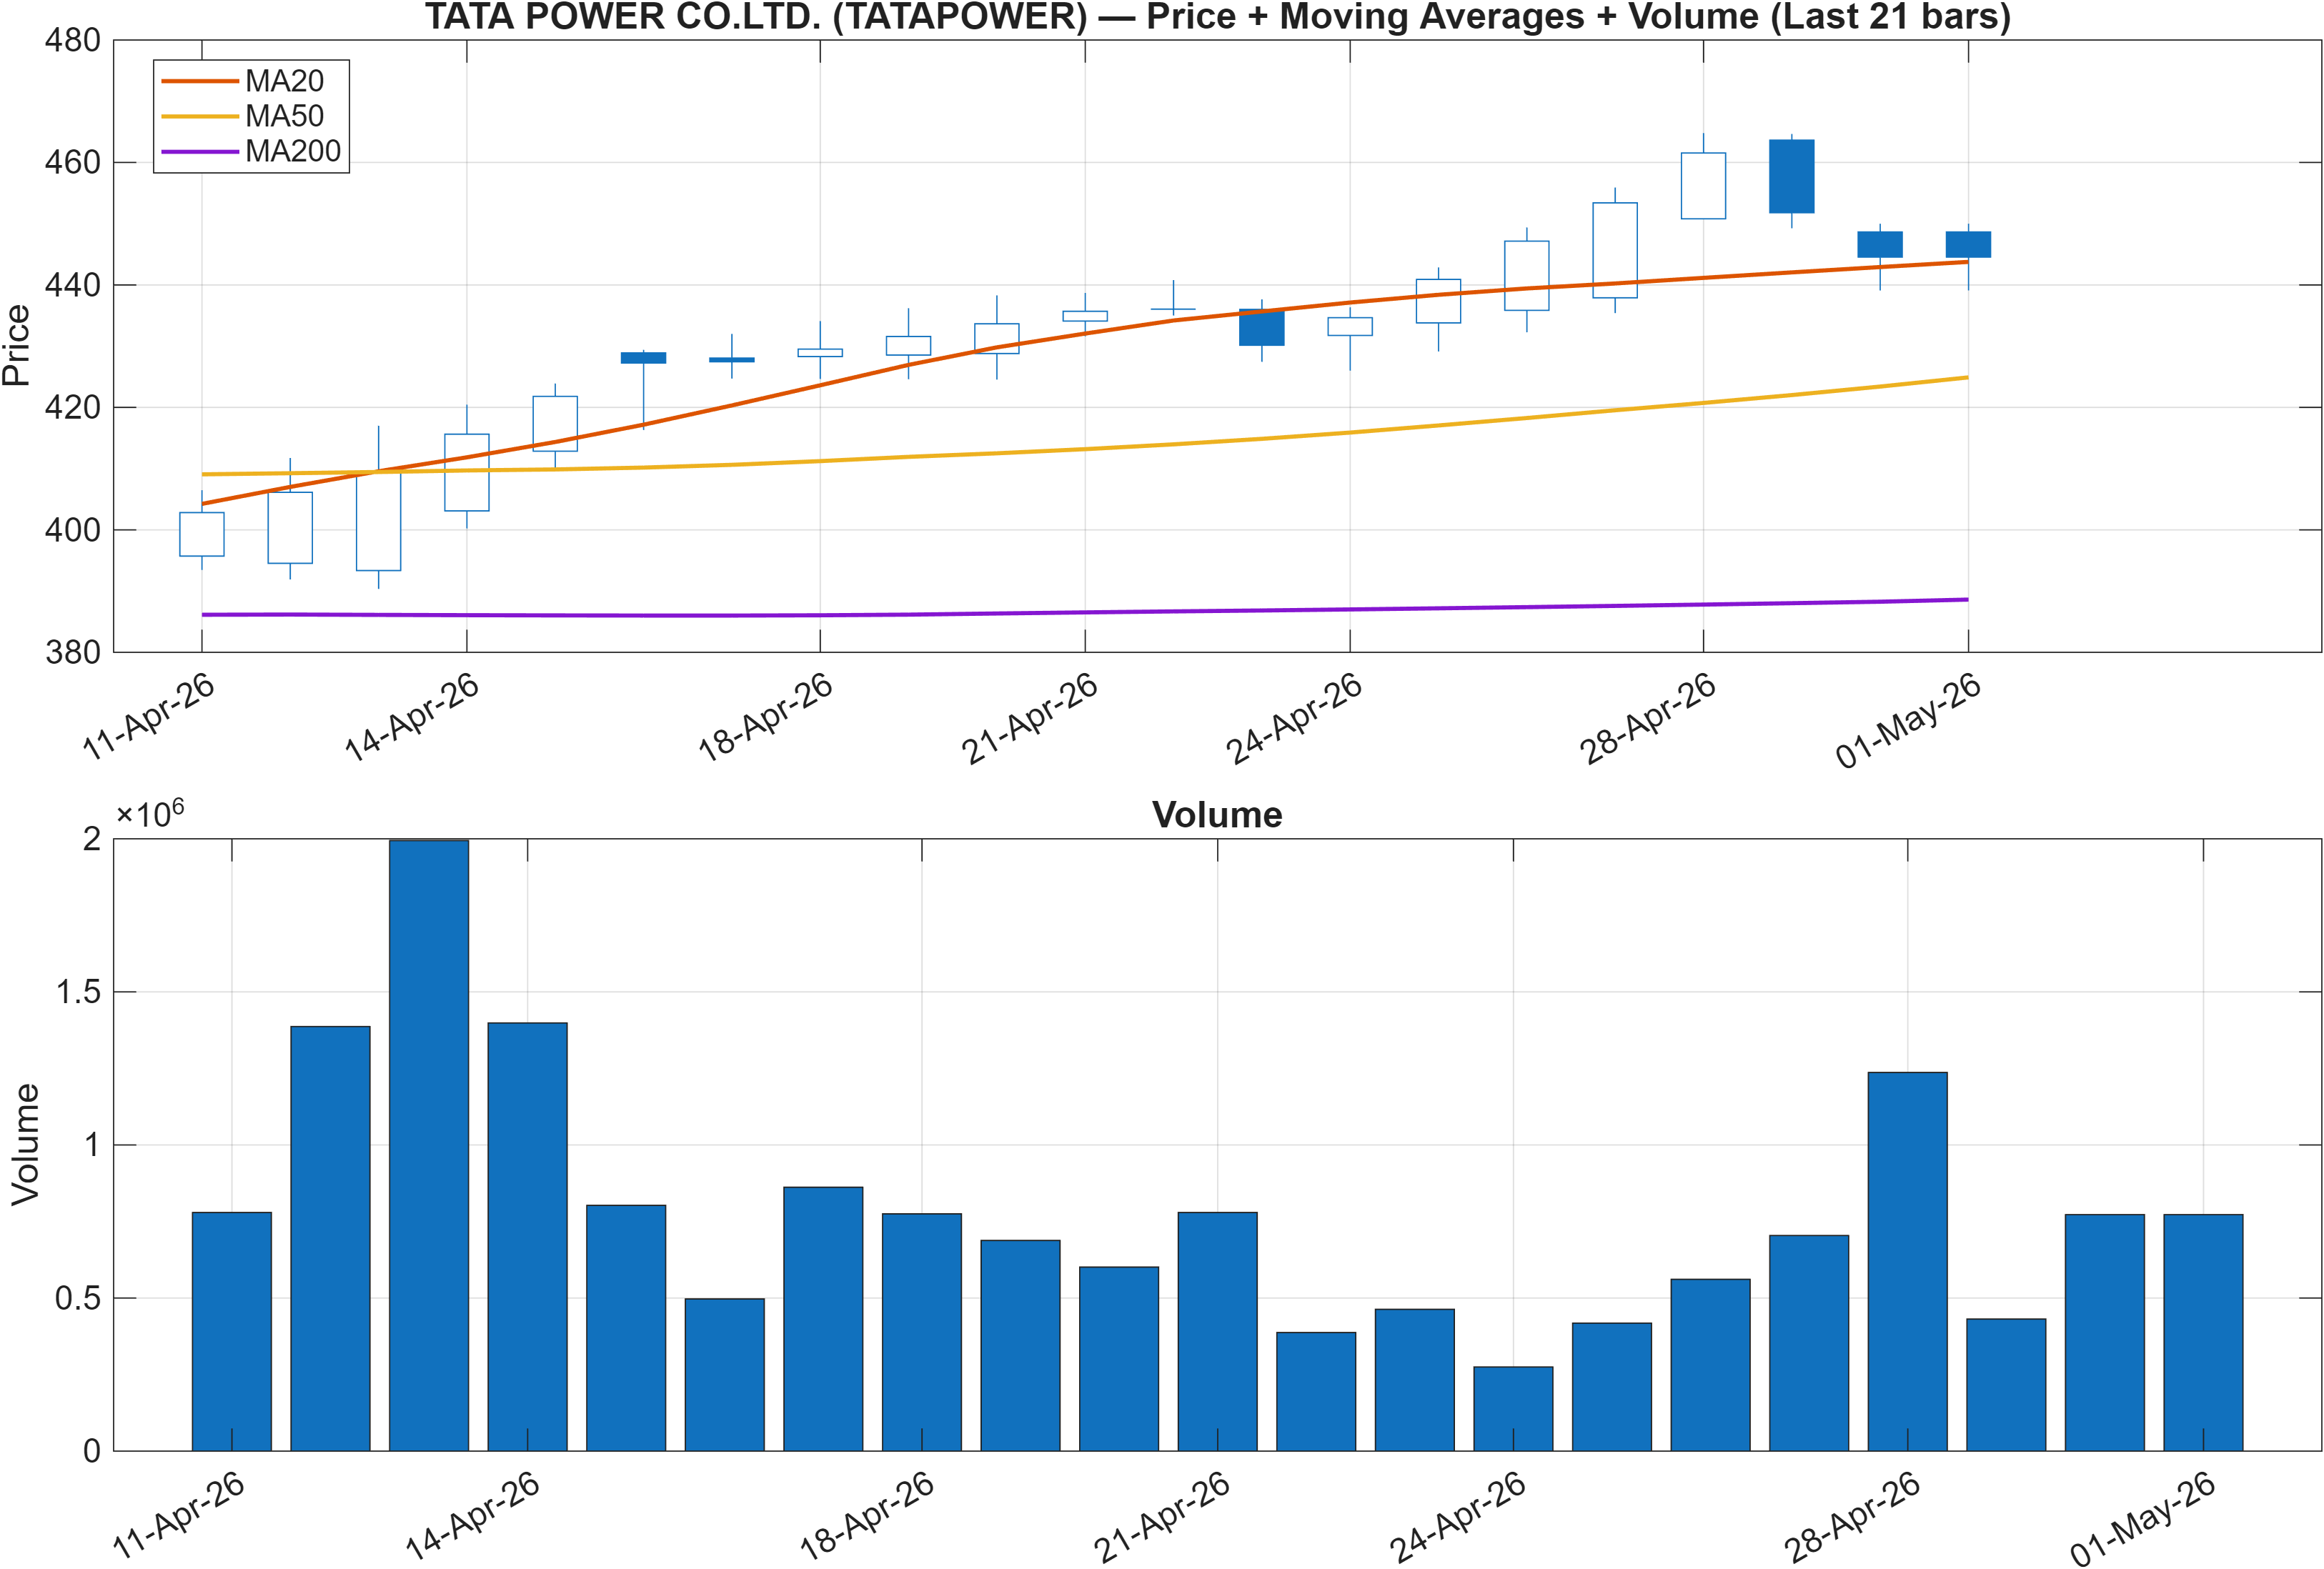
The moving-average structure is constructive on two layers: the close is above the MA50 (bullish), and the MA50 is above the MA200 (also bullish). This is typically associated with trend continuation conditions; however, the broader KGNAI rank stack remains mostly neutral, which suggests a trend-quality question rather than a simple trend/no-trend classification.
In this context, the most informative read is whether the bullish MA configuration is being validated by participation. That matters because the signal table later flags Vol ROC(20) at -44.29 (bearish), implying that recent price improvement may not be uniformly supported by expanding volume. When moving averages point upward while volume acceleration contracts, the market can still grind higher—but it is more vulnerable to mean reversion around key levels.
The range markers embedded elsewhere in the dataset reinforce this “trend-with-conditions” framing: the 20-day high reference is 464.8 (neutral) and the 20-day low is 390.4 (neutral). Those values, together with the primary resistance at 446.1250, outline where the market would need to demonstrate persistence (through closes and volume behavior) to upgrade from a technically constructive posture into a higher-confidence trend regime.
For institutional-style execution logic, the key distinction is whether advances continue to hold above trend proxies (MA50) while rotations remain shallow—or whether pullbacks begin to test the lower boundary of the defined support regime near 369.3125.
3) Momentum & volatility dashboard
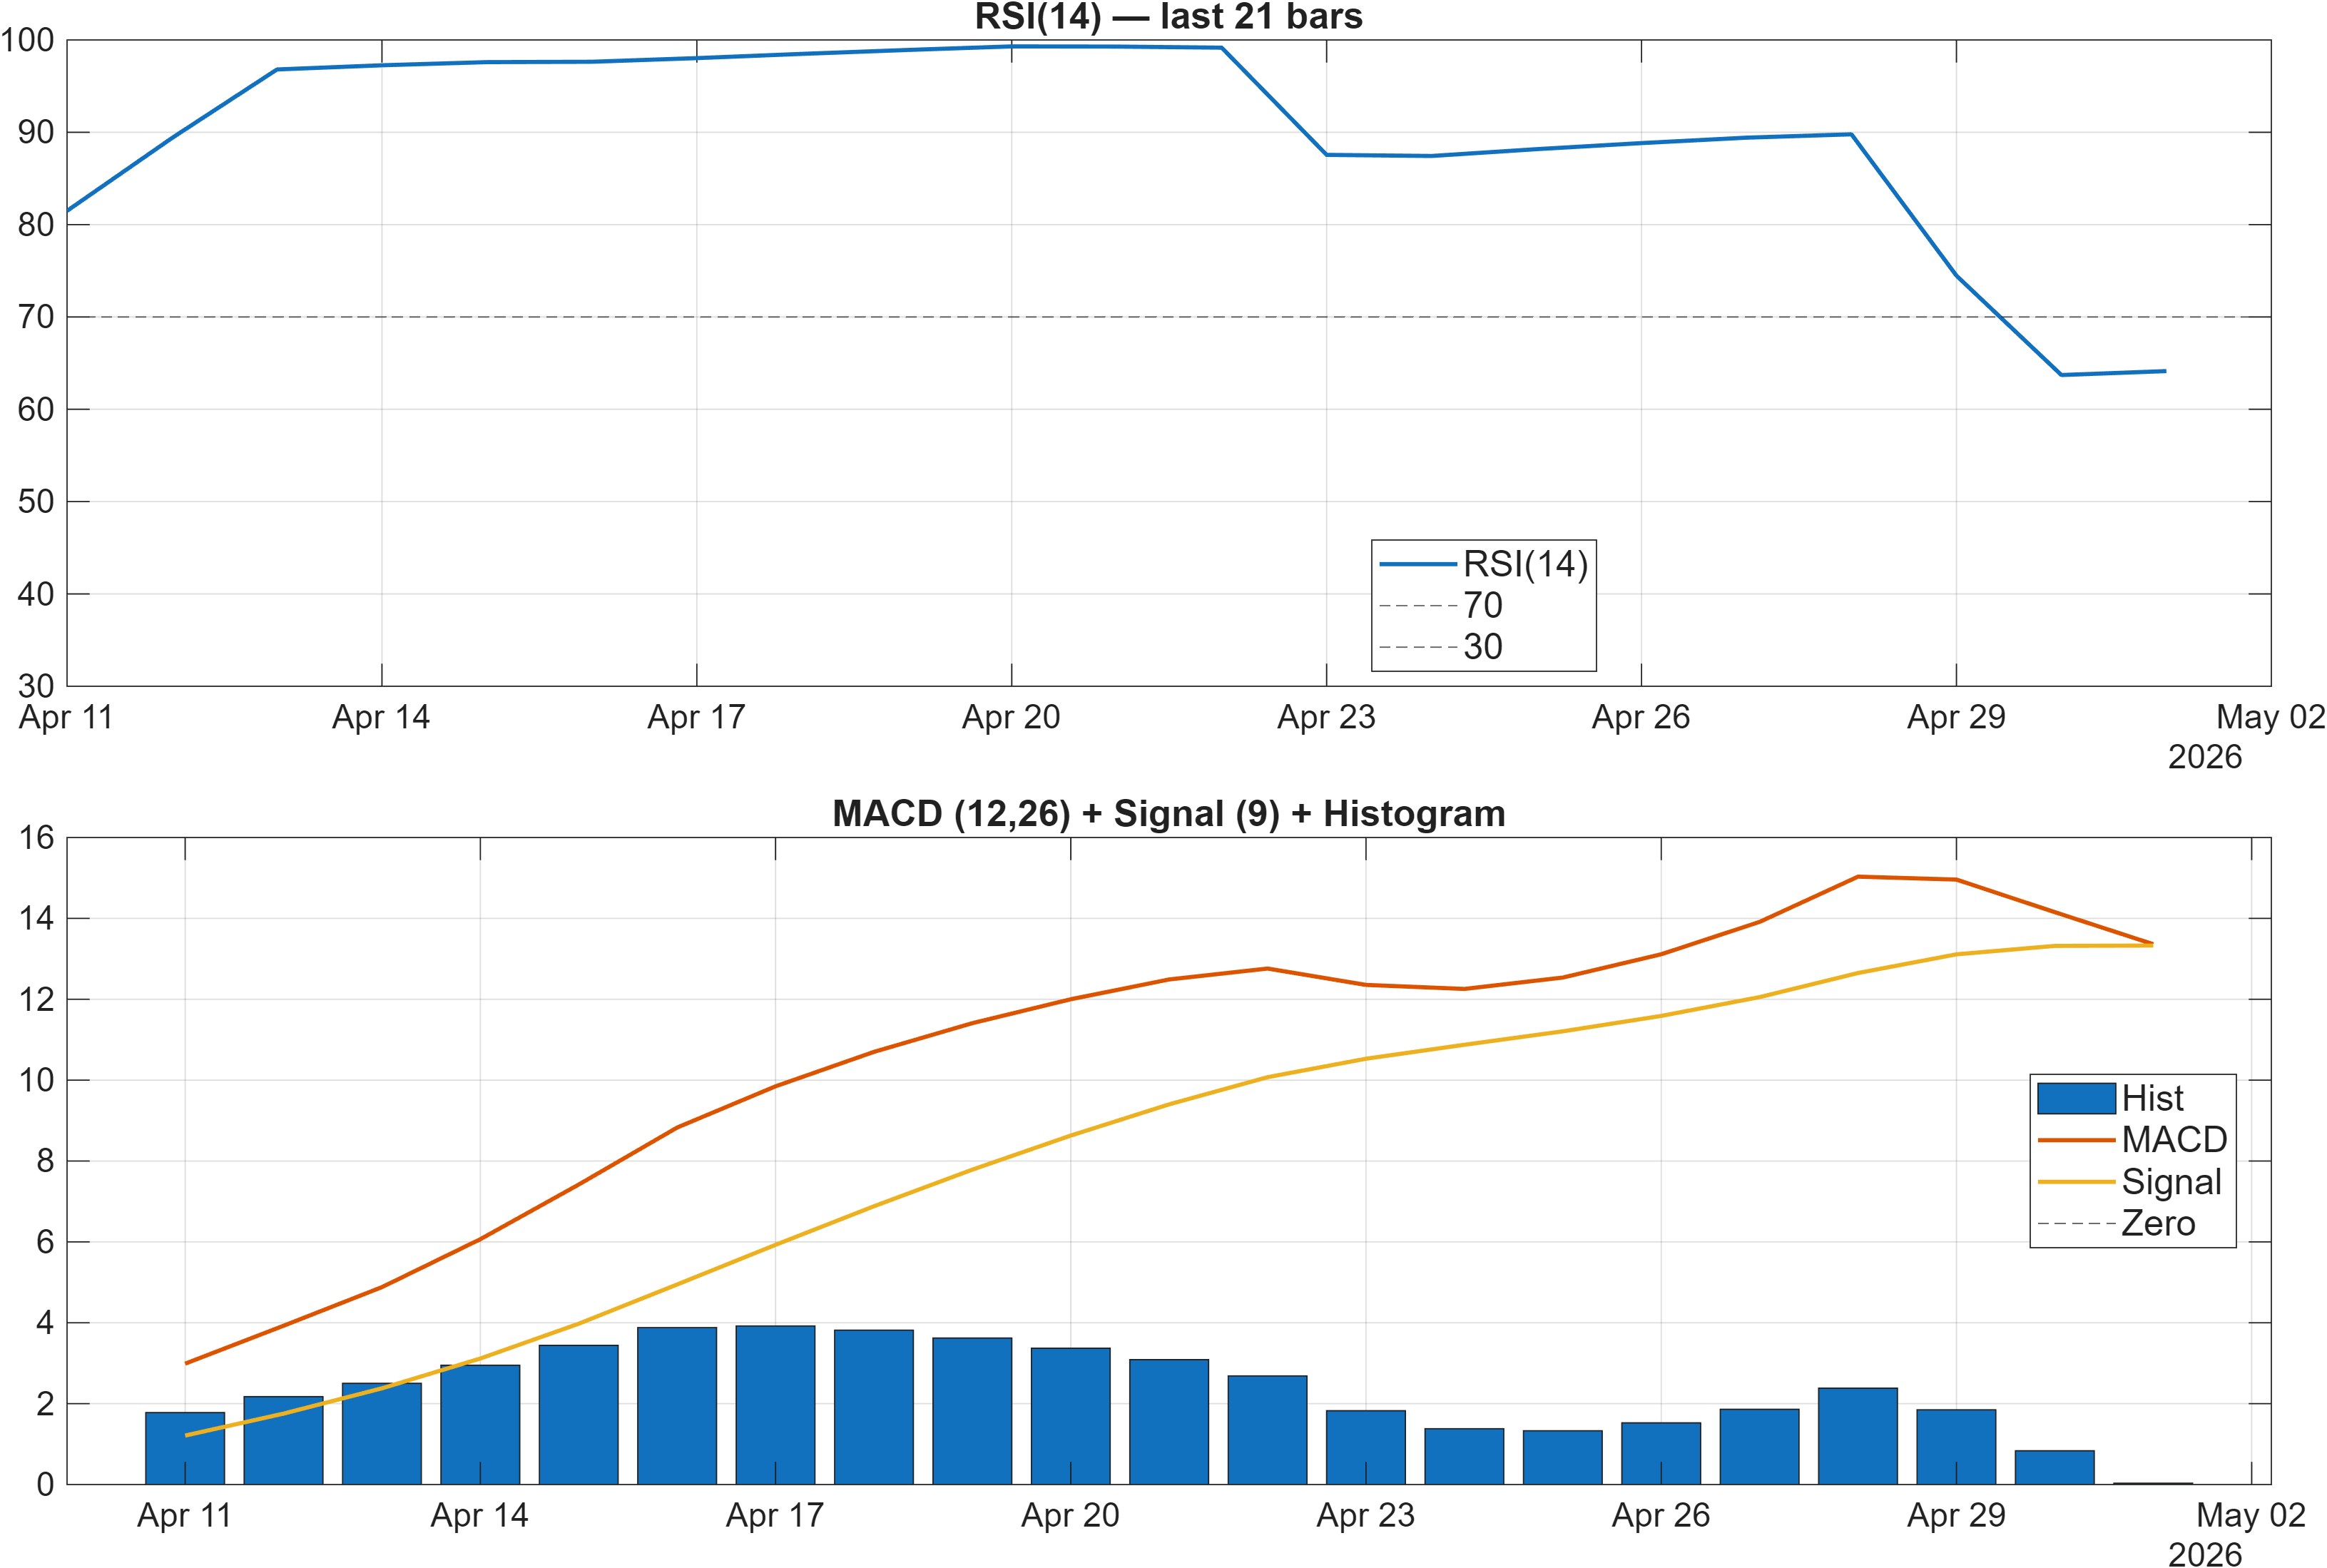
Interpretation: RSI bias = Bullish, MACD hist = 0.0333.
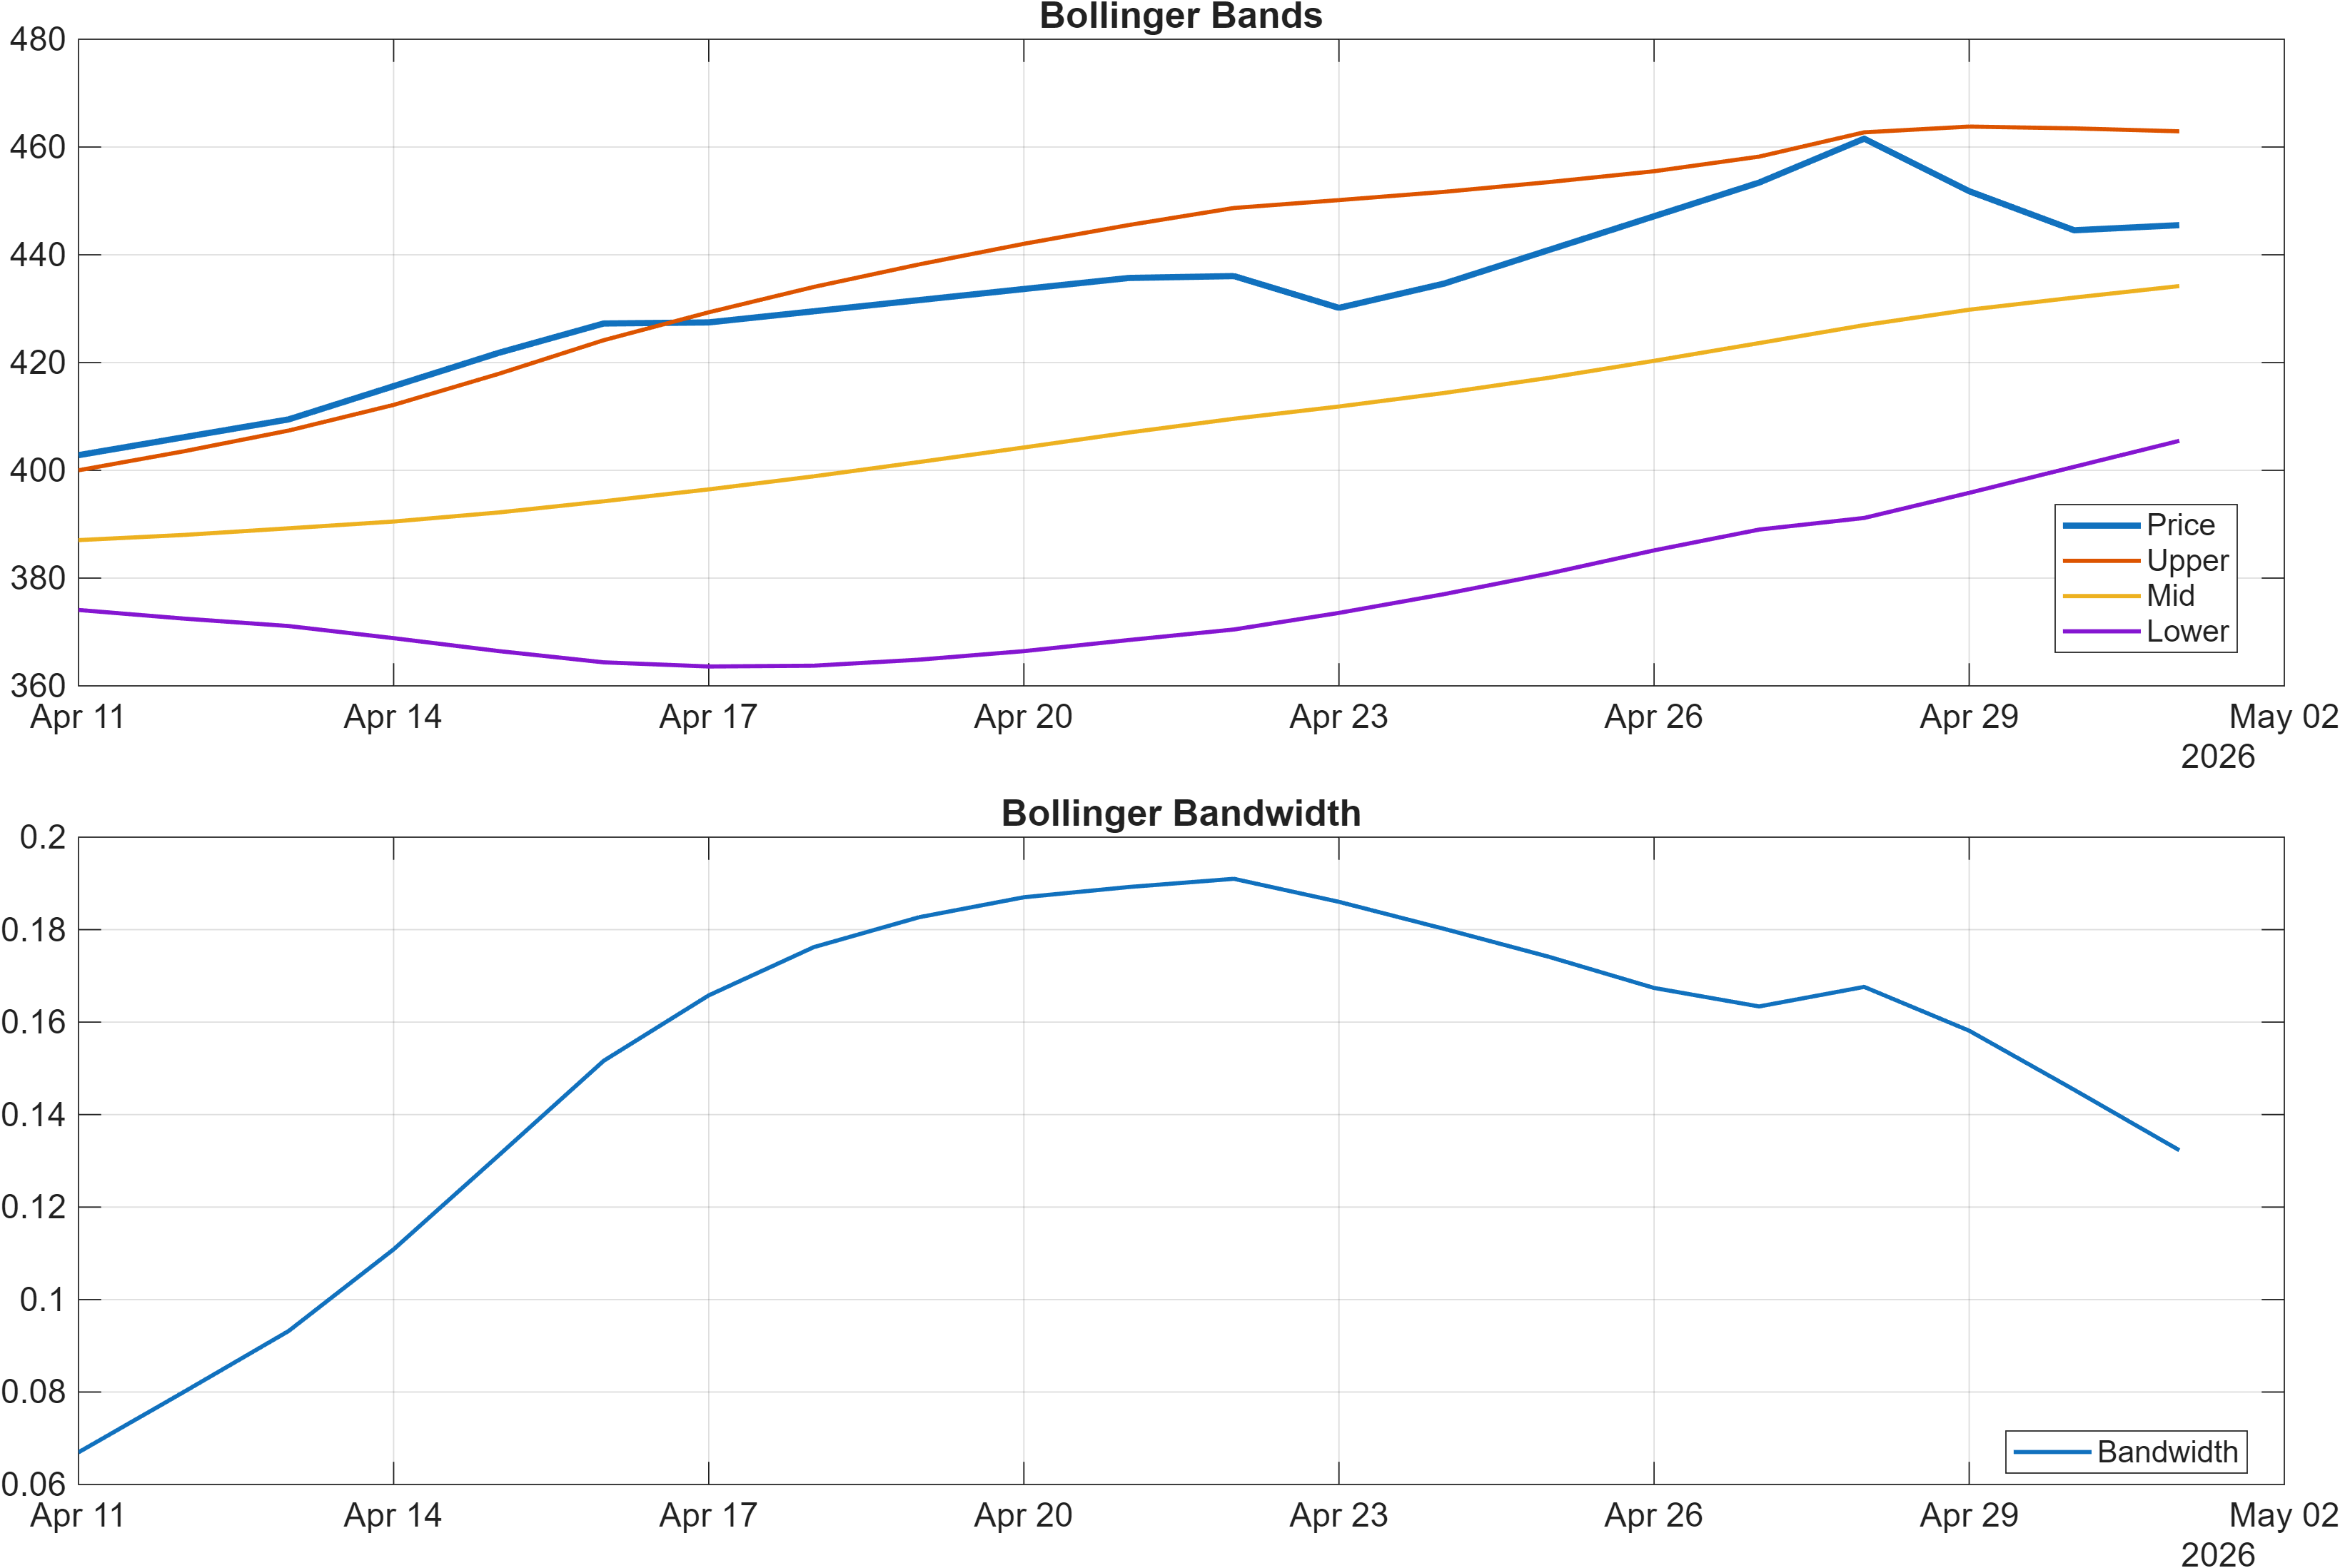
Interpretation: Bandwidth (volatility regime) latest = 0.1323.
Momentum readings are modestly supportive, but they do not yet describe an overextended impulse. RSI(14) is 64.13 (bullish), indicating positive internal strength without necessarily signaling a late-stage blow-off. Meanwhile, the MACD histogram is positive at 0.03326, which is consistent with incremental upside momentum rather than a high-amplitude thrust. This combination often maps to a market that can advance, but may do so in steps with intermittent consolidation.
Volatility context tempers the momentum message. Bollinger bandwidth at 0.1323 is tagged neutral and points to a regime where large expansions are not yet dominant. In practical signal terms, bandwidth compression tends to precede expansion, but it does not specify direction; it mainly raises the importance of break confirmation at well-defined levels. That is consistent with the separate level framework showing resistance at 446.1250 as the principal “decision” zone.
The oscillator mix also suggests selective friction. Stoch %K at 47.81 is neutral, implying that momentum is not uniformly strong across measures. At the same time, rate-of-change is constructive (ROC(20) 9.693 bullish) and time-series momentum remains positive (TS Mom(20) 38.42 bullish), which supports the idea of an improving tape that still needs persistence.
Net: the dashboard reads as momentum-positive within a contained-volatility envelope. That structure typically places higher weight on follow-through behavior—especially whether upside attempts are accompanied by improving participation rather than fading volume.
4) Support / Resistance zones
Support ~ 369.3125 | Resistance ~ 446.1250
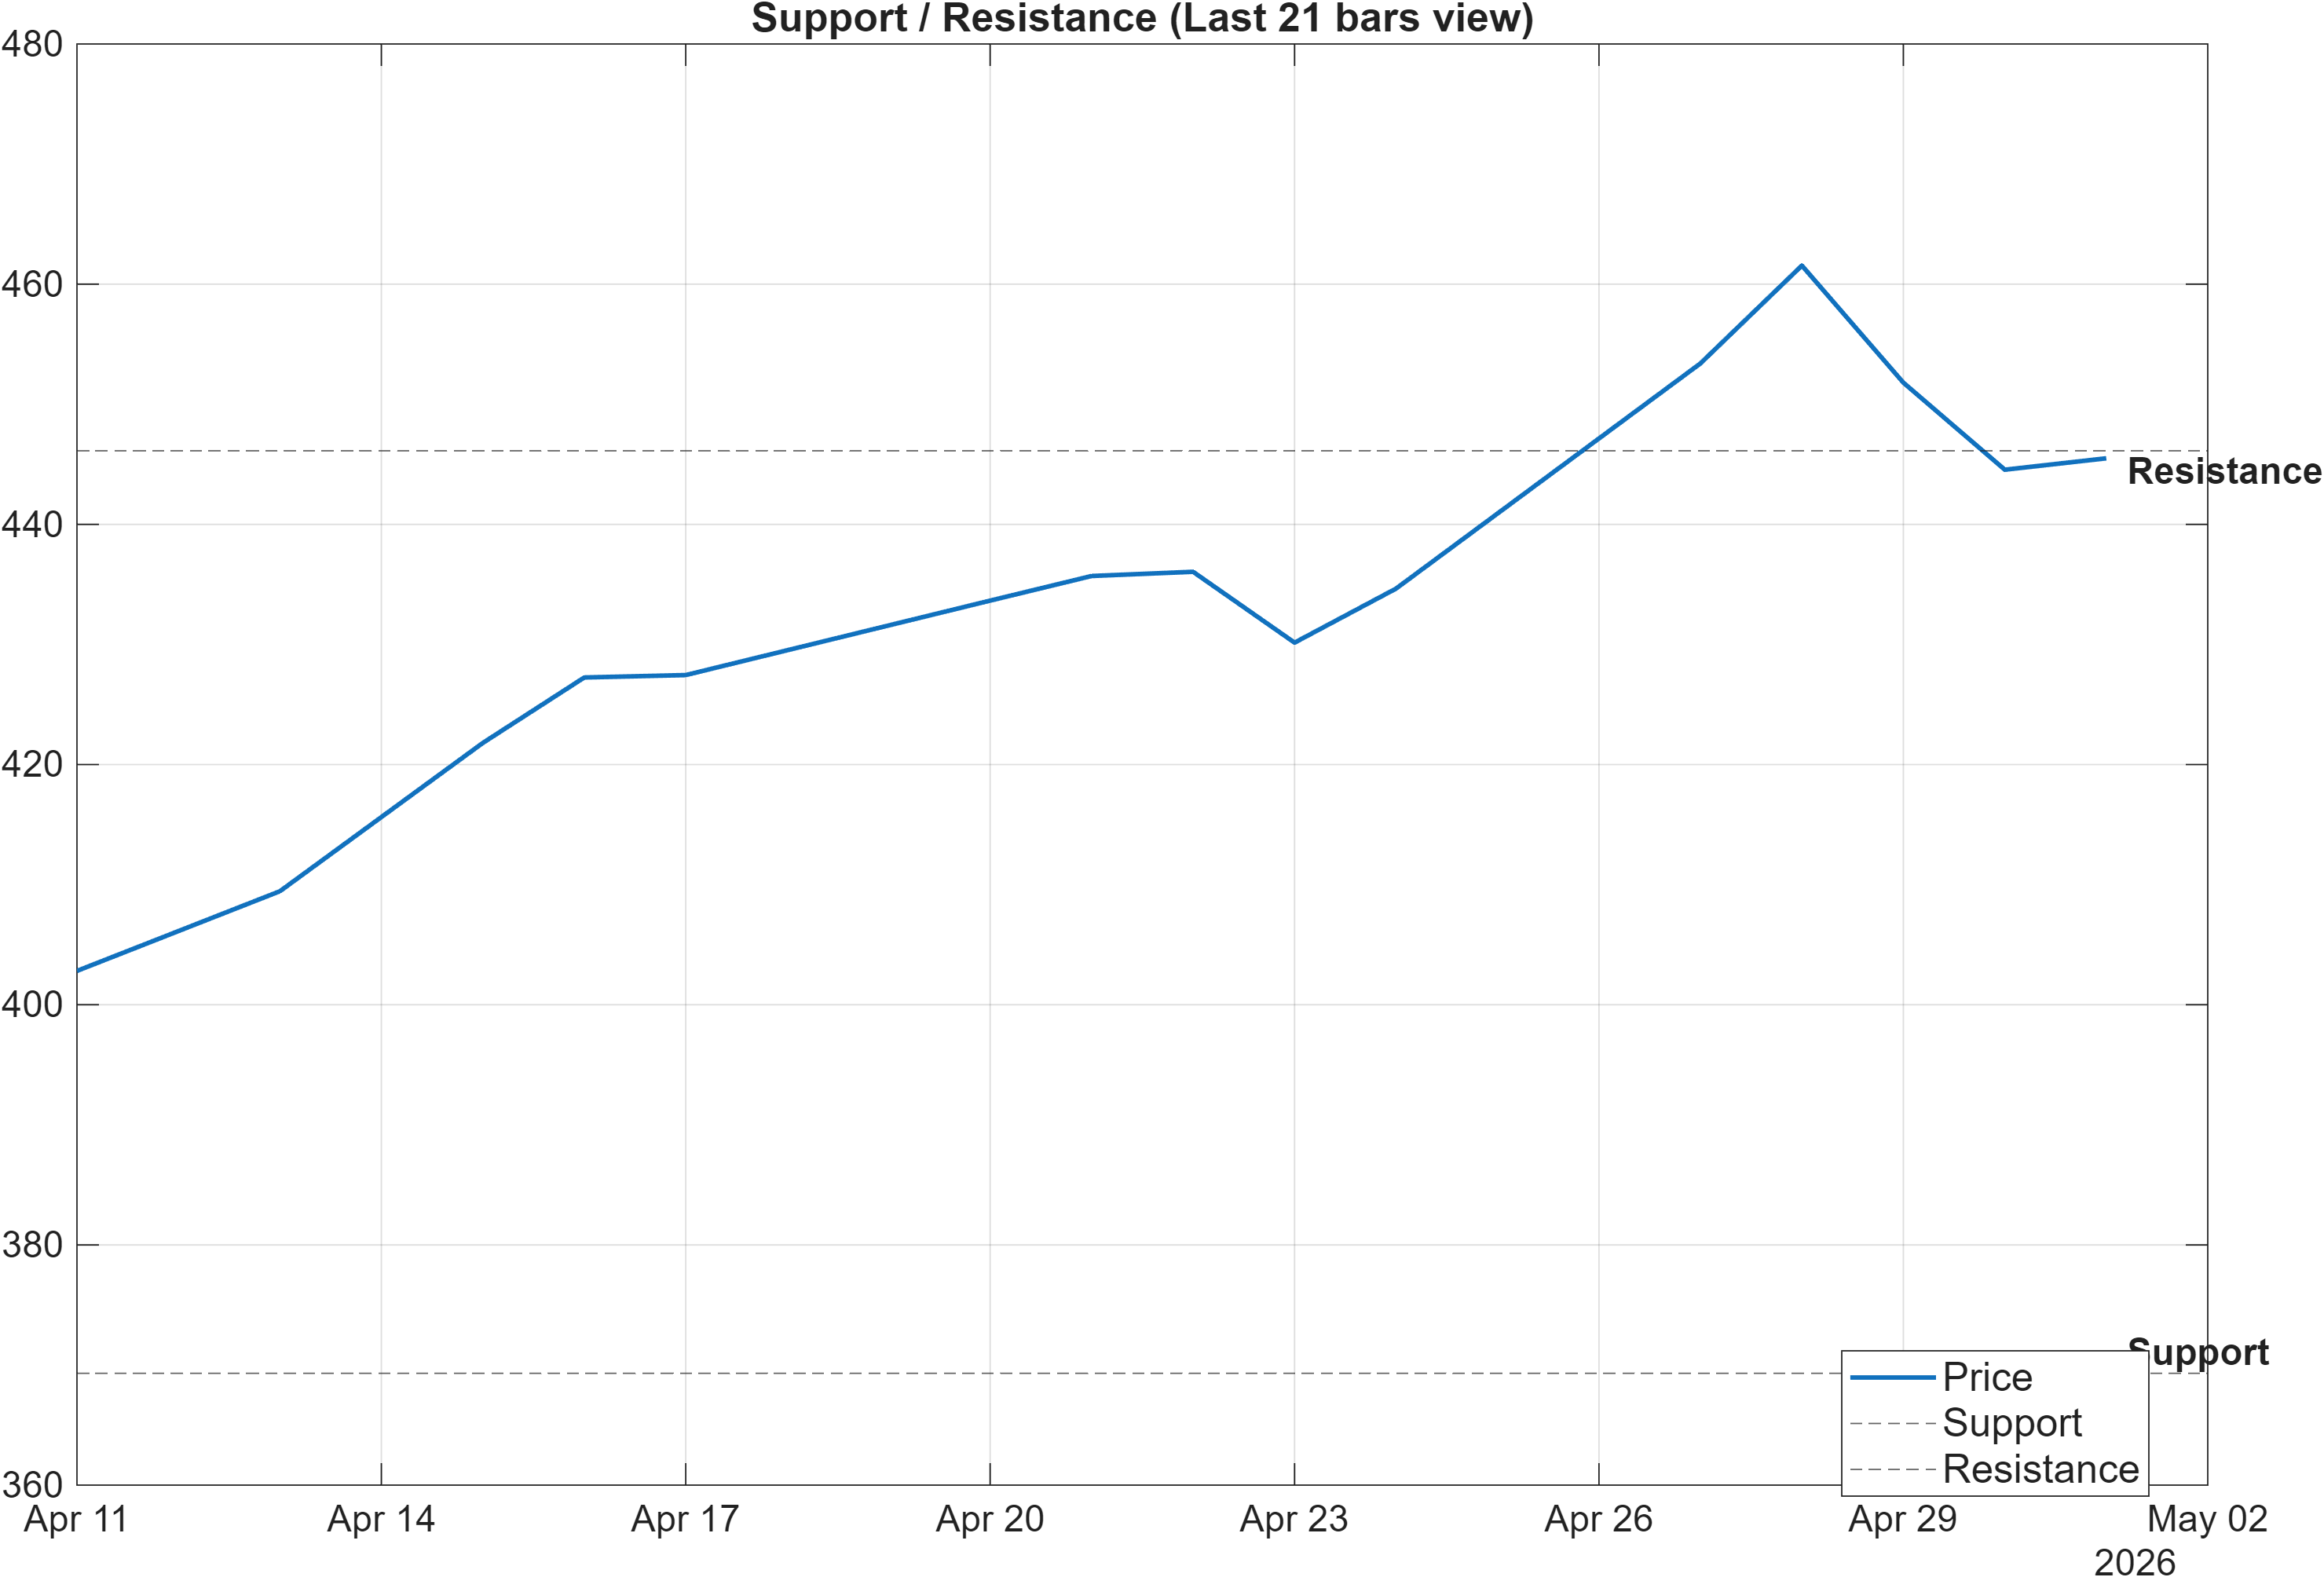
Scenario view: Break above resistance with volume → continuation. Close below support → signal deterioration risk.
The level map is unusually clean: 369.3125 defines the primary support band and 446.1250 defines the primary resistance band. Given the neutral-to-mixed cross-horizon ranks, this structure is best treated as a probabilistic decision framework rather than a directional forecast. In a neutral regime, price behavior around levels (rejection, acceptance, and retest) carries more information than the level itself.
The surrounding technical context supports that interpretation. The 20-day range references (HHIGH(20) 464.8 and LLOW(20) 390.4, both neutral) imply that resistance is not far from a recent high watermark, and support is below a recent low reference. That configuration can produce a “two-step” process: first an attempt through resistance, then either follow-through into a higher range or a retreat toward the middle of the band.
Volume behavior becomes a key differentiator. The scenario note explicitly requires a break above resistance with volume, which aligns with the signal table’s caution that volume acceleration is currently weak (Vol ROC(20) -44.29 bearish). If price moves above 446.1250 without participation improving, upside may be more prone to false-break characteristics. Conversely, a decisive close below 369.3125 would conflict with the otherwise bullish moving-average and momentum profile and would likely represent a regime downgrade.
For risk control, these two numbers are the anchor points: above 446.1250 the market is testing continuation conditions; below 369.3125 the evidence shifts toward deterioration despite pockets of bullish signal support elsewhere.
5) Quant Technical Dashboard (18 Signals)
KGNAI AI Technical Analysis Score (Deep Reinforcement Learning): Rank #835 out of 1222 (Rank 1 represents the strongest technical positioning and a higher probability of favorable price behavior. As ranks increase toward the maximum, the probability of favorable outcomes weakens and bearish positioning becomes more dominant.) | Label: Neutral | Score: -0.367
18-Signal Technical Confluence Score: 0.556 (Bullish)
Overall Technical Score (18-signal confluence + DRL rank blend): 0.279 (Neutral)
Note: The blended score reflects signal strength weighted against broader AI technical ranking, which may temporarily diverge.
Blended technical score breakdown: 0.279 (Neutral | Bull 12 / Bear 2 / Neutral 4)
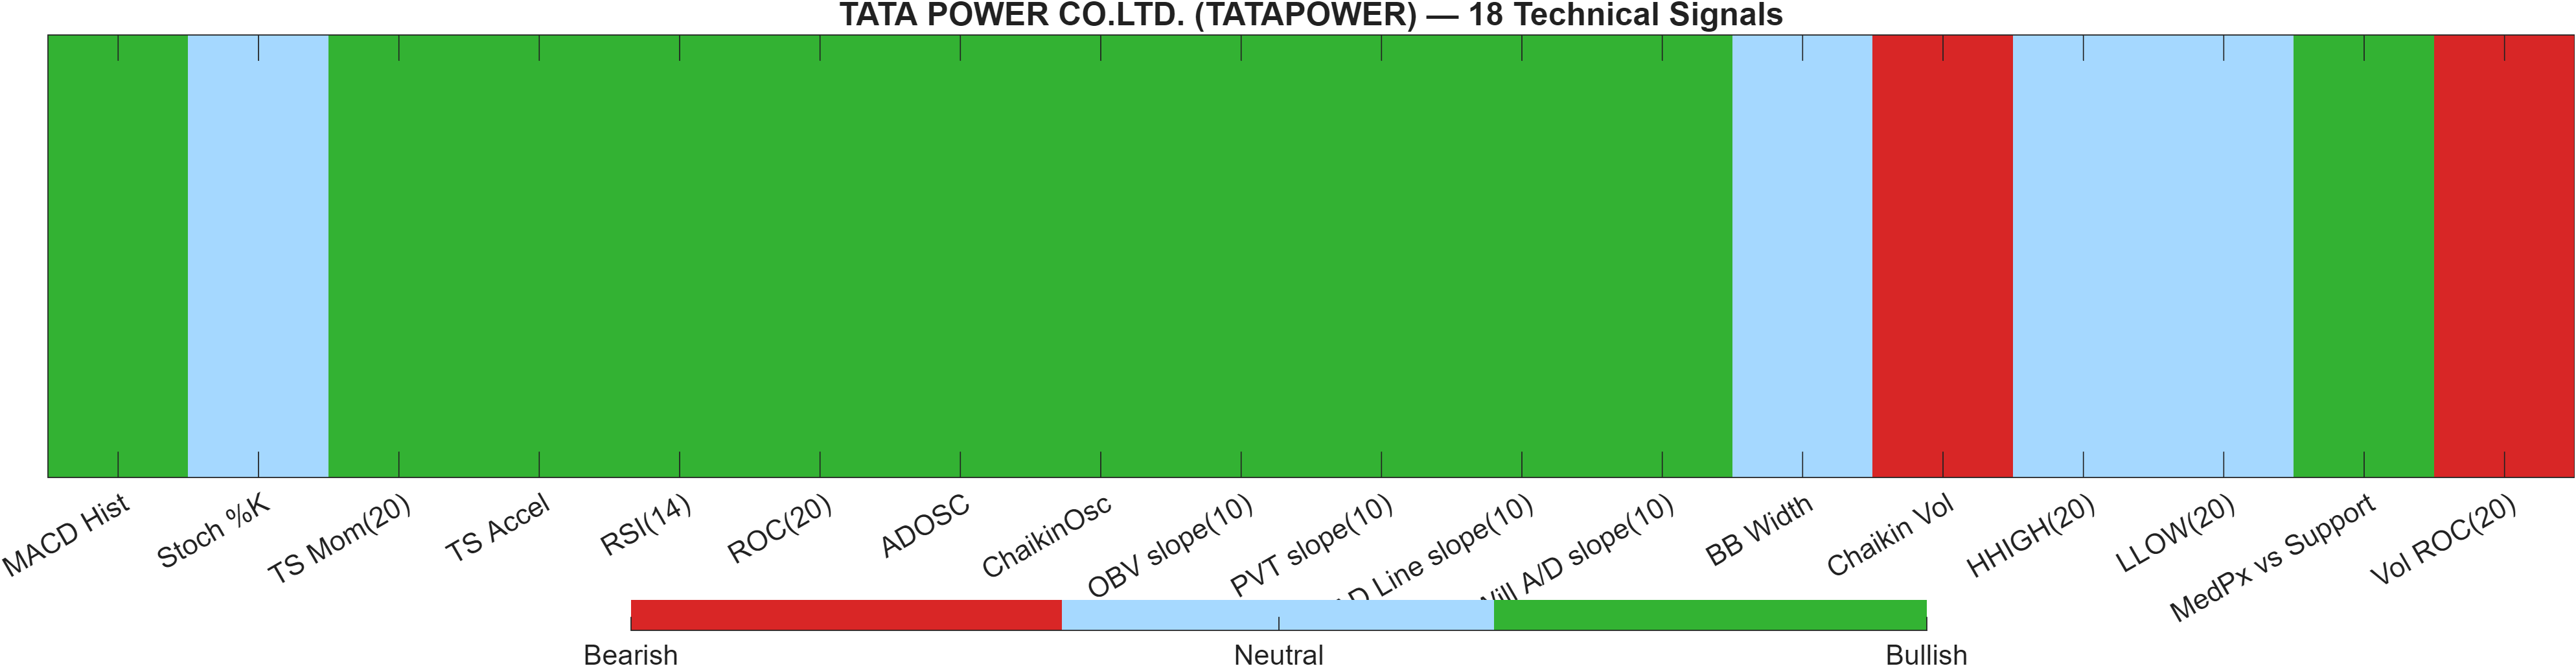
Signal table (Bull/Bear/Neutral)
| Indicator | Value | Signal |
|---|---|---|
| MACD Hist | 0.03326 | Bullish |
| Stoch %K | 47.81 | Neutral |
| TS Mom(20) | 38.42 | Bullish |
| TS Accel | 17.03 | Bullish |
| RSI(14) | 64.13 | Bullish |
| ROC(20) | 9.693 | Bullish |
| ADOSC | 31.19 | Bullish |
| ChaikinOsc | 5.901e+05 | Bullish |
| OBV slope(10) | 1.915e+06 | Bullish |
| PVT slope(10) | 2.145e+04 | Bullish |
| AD Line slope(10) | 1.339e+06 | Bullish |
| Will A/D slope(10) | 37.5 | Bullish |
| BB Width | 0.1323 | Neutral |
| Chaikin Vol | 22.33 | Bearish |
| HHIGH(20) | 464.8 | Neutral |
| LLOW(20) | 390.4 | Neutral |
| MedPx vs Support | 75.24 | Bullish |
| Vol ROC(20) | -44.29 | Bearish |
Interpretation: Indicator-level signals form the base confluence, which is then adjusted using a separate AI-driven technical ranking model. The final technical score summarizes this combined view.
This dashboard is best read as a confluence vs model-rank divergence problem. The 18-signal confluence score is 0.556 and labeled Bullish, driven by broad participation-style inputs (e.g., OBV slope(10) 1.915e+06 bullish; AD Line slope(10) 1.339e+06 bullish) and momentum confirmation (RSI(14) 64.13 bullish; ROC(20) 9.693 bullish). On its own, that concentration of bullish signals would normally argue for a constructive technical regime.
The counterweight is the Deep Reinforcement Learning technical rank at #835 (neutral) with score -0.367, pulling the blended view down to an overall technical score of 0.279, labeled Neutral. This kind of divergence often occurs when near-term indicator behavior improves faster than the model’s broader pattern library recognizes as durable—or when a subset of risk flags remains active.
The two bearish signals are informative in that regard: Vol ROC(20) -44.29 and Chaikin Vol 22.33. Together, they flag that the quality of participation/volatility dynamics is not uniformly supportive. That does not negate the bullish cluster; it argues for treating bullish confluence as conditional on confirmation above resistance and on stabilization of volume behavior rather than assuming immediate trend persistence.
6) News sentiment + extractive gist
Note: Instrument-specific news matches were not found, so the digest includes broader market/sector headlines. Links are provided for verification.
Sentiment score (avg): 0.184 | Positive: 44% | Neutral: 56% | Negative: 0%
KGNAI AI News Sentiment Score (normalized -1 to +1): -0.10 (as of 2025-12-15) | Label: Bullish | Overall news score: 0.15
Positive Developments
Recent coverage across major financial outlets indicates a generally constructive tone, dominated by corporate results narratives and operational execution themes rather than acute stress signals. In aggregate, the distribution skews positive-to-neutral (Positive 44%, Neutral 56%, Negative 0%), which aligns with the mildly constructive average sentiment reading of 0.184. While the digest is not instrument-specific for TATAPOWER, it reflects a market backdrop where earnings releases and company updates can support risk appetite and keep attention on sector rotation rather than macro shock. The platform’s broader news scoring also shows an “overall news score” of 0.15, reinforcing that the net information flow is not strongly adverse. Taken together, the news layer acts as a contextual tailwind to the technical picture—helpful for confirmation, but not sufficient on its own to override the neutral blended technical regime.
Neutral / Mixed Developments
The neutral component is meaningful at 56% and suggests the information environment is still dominated by interpretation and positioning rather than decisive catalyst clarity. Mixed macro-policy discussion (including policy disagreement and inflation sensitivity themes) can translate into higher cross-asset correlation and short bursts of volatility even when single-stock technicals look stable. In that environment, it is common to see technically constructive setups fail to follow through unless breadth and participation improve. This is consistent with the technical dashboard’s split: a bullish confluence score (0.556) paired with a neutral blended score (0.279) that demands confirmation. The practical takeaway is to treat neutral news flow as an amplifier of technical decision zones: if price is near resistance, neutral macro framing can increase the odds of chop unless an incremental catalyst appears.
Negative / Risk Signals
Even with Negative at 0% in the provided sentiment split, risk signals still exist in the form of macro sensitivity and the potential for volatility to reprice quickly around policy and inflation narratives. This matters because the volatility regime is currently contained (Bollinger bandwidth 0.1323), and such regimes can transition abruptly. For TATAPOWER’s setup, the core risk expression remains technical: a failure to hold key zones—particularly a close below 369.3125—would represent deterioration relative to the otherwise constructive momentum readings (e.g., RSI(14) 64.13, MACD histogram 0.03326). In short, the news layer is not flashing overt stress in the data provided, but it also does not remove the need to monitor confirmation, volume, and level integrity in a potentially headline-responsive tape.
- What to monitor next: Whether any breakout attempt above 446.1250 is accompanied by improving participation (watch the volume/accumulation complex).
- What to monitor next: Whether volatility remains contained (bandwidth 0.1323) or begins to expand alongside price.
- What to monitor next: Whether the neutral blended technical score (0.279) starts to converge upward toward the bullish confluence (0.556).
Sources referenced: Reuters, Bloomberg, Yahoo Finance, MarketWatch, Investing.com
7) Sources
Not available in the provided data.
You may also like: How KGNAI AI ranks instruments across global markets
Disclaimer: KGNAI provides AI-generated analytics and educational market commentary only. This is not financial advice. Markets involve risk. Always do your own research.