
GANESHHOUC (Ganesh Housing Corporation Ltd.) — 18-Mar-2026 Technical Positioning Remains Cautious
Ganesh Housing Corporation Ltd. (GANESHHOUC) enters 18-Mar-2026 with a short-to-mid horizon profile that remains decisively weak across KGNAI’s cross-sectional ranking system, while longer horizons sit closer to neutral. The ranking stack skews toward the lower third of the tracked universe in the near term, aligning with a bearish moving-average structure and negative momentum readings. On the indicator layer, MACD histogram is negative and RSI is deeply depressed, implying downside momentum remains dominant even if mean-reversion attempts can occur. Volatility conditions, as reflected by Bollinger bandwidth, do not indicate a clear expansion regime, which can complicate timing for reversals. Key decision levels are clearly defined: support near 617.8000 and resistance near 759.9250. News sentiment is broadly neutral in the provided digest, offering limited counterbalance to the technical tone.
- Rank stance: Short-term Bearish | Mid-term Bearish | Long-term Neutral
- Technical confluence: Bearish (18-signal confluence and blended score both negative)
- Key levels: Support ~ 617.8000 | Resistance ~ 759.9250
- News sentiment bias: Neutral (avg 0.047; negative share 12%)
- Confirmation / invalidation: A sustained reclaim above 759.9250 with volume would help validate stabilization; a close below 617.8000 increases deterioration risk per the scenario framework.
KGNAI evaluates assets using large cross-sectional datasets built from millions of structured data points. Inputs incorporate fundamental metrics, technical structures, and systematically processed news sentiment. Statistical models, machine learning, and AI frameworks are used to assess relative positioning, signal alignment, and probabilistic behavior across broad universes.
- Ranks are comparative across the tracked universe, not absolute price targets.
- Confluence reflects alignment among independent signal groups.
- Support/resistance levels are probabilistic decision zones, not guarantees.
- Sentiment provides contextual bias within the broader analytical framework.
1) KGNAI AI Analysis
Region: INDIA
Total universe size: 1222 ranked instruments
- Daily rank: #1163 out of 1222 — Bearish
- Weekly rank: #1023 out of 1222 — Bearish
- Monthly rank: #1051 out of 1222 — Bearish
- 3-Monthly rank: #986 out of 1222 — Bearish
- 6-Monthly rank: #789 out of 1222 — Neutral
- Yearly rank: #481 out of 1222 — Neutral
The cross-horizon rank stack places GANESHHOUC in a persistently weak short-run cohort, with the daily rank at #1163 and weekly at #1023 out of 1222—both consistent with lower-quality near-term price behavior relative to the broader universe. The monthly reading (#1051) and 3-monthly rank (#986) reinforce that this is not a single-session anomaly, but a multi-week state where downside skew and trend-following pressure remain dominant.
The longer horizons are less uniform: the 6-monthly rank improves to #789 and the yearly to #481, both labeled neutral. This configuration often reflects a market that is temporarily dislocated versus its longer-run baseline, rather than one that is uniformly weak across all timeframes. In practice, that tends to raise the bar for calling a clean regime shift: short-run weakness can persist longer than expected when the near-term ranks cluster deep in the bearish zone, even if the long-run model no longer flags the instrument as structurally impaired.
Taken together with the stated term view—Short-term: Bearish, Mid-term: Bearish, Long-term: Neutral—the highest-confidence read is that any bounce attempts are operating inside a broader “repair” phase. For risk management, the main analytical question becomes whether subsequent price action can translate into rank stabilization (i.e., moving out of the extreme upper tail) rather than relying on single-indicator oversold conditions.
Want the full universe and complete rank tables? Unlock full access on KGNAI: https://www.kgnai.com/pricing
2) Price & trend overview
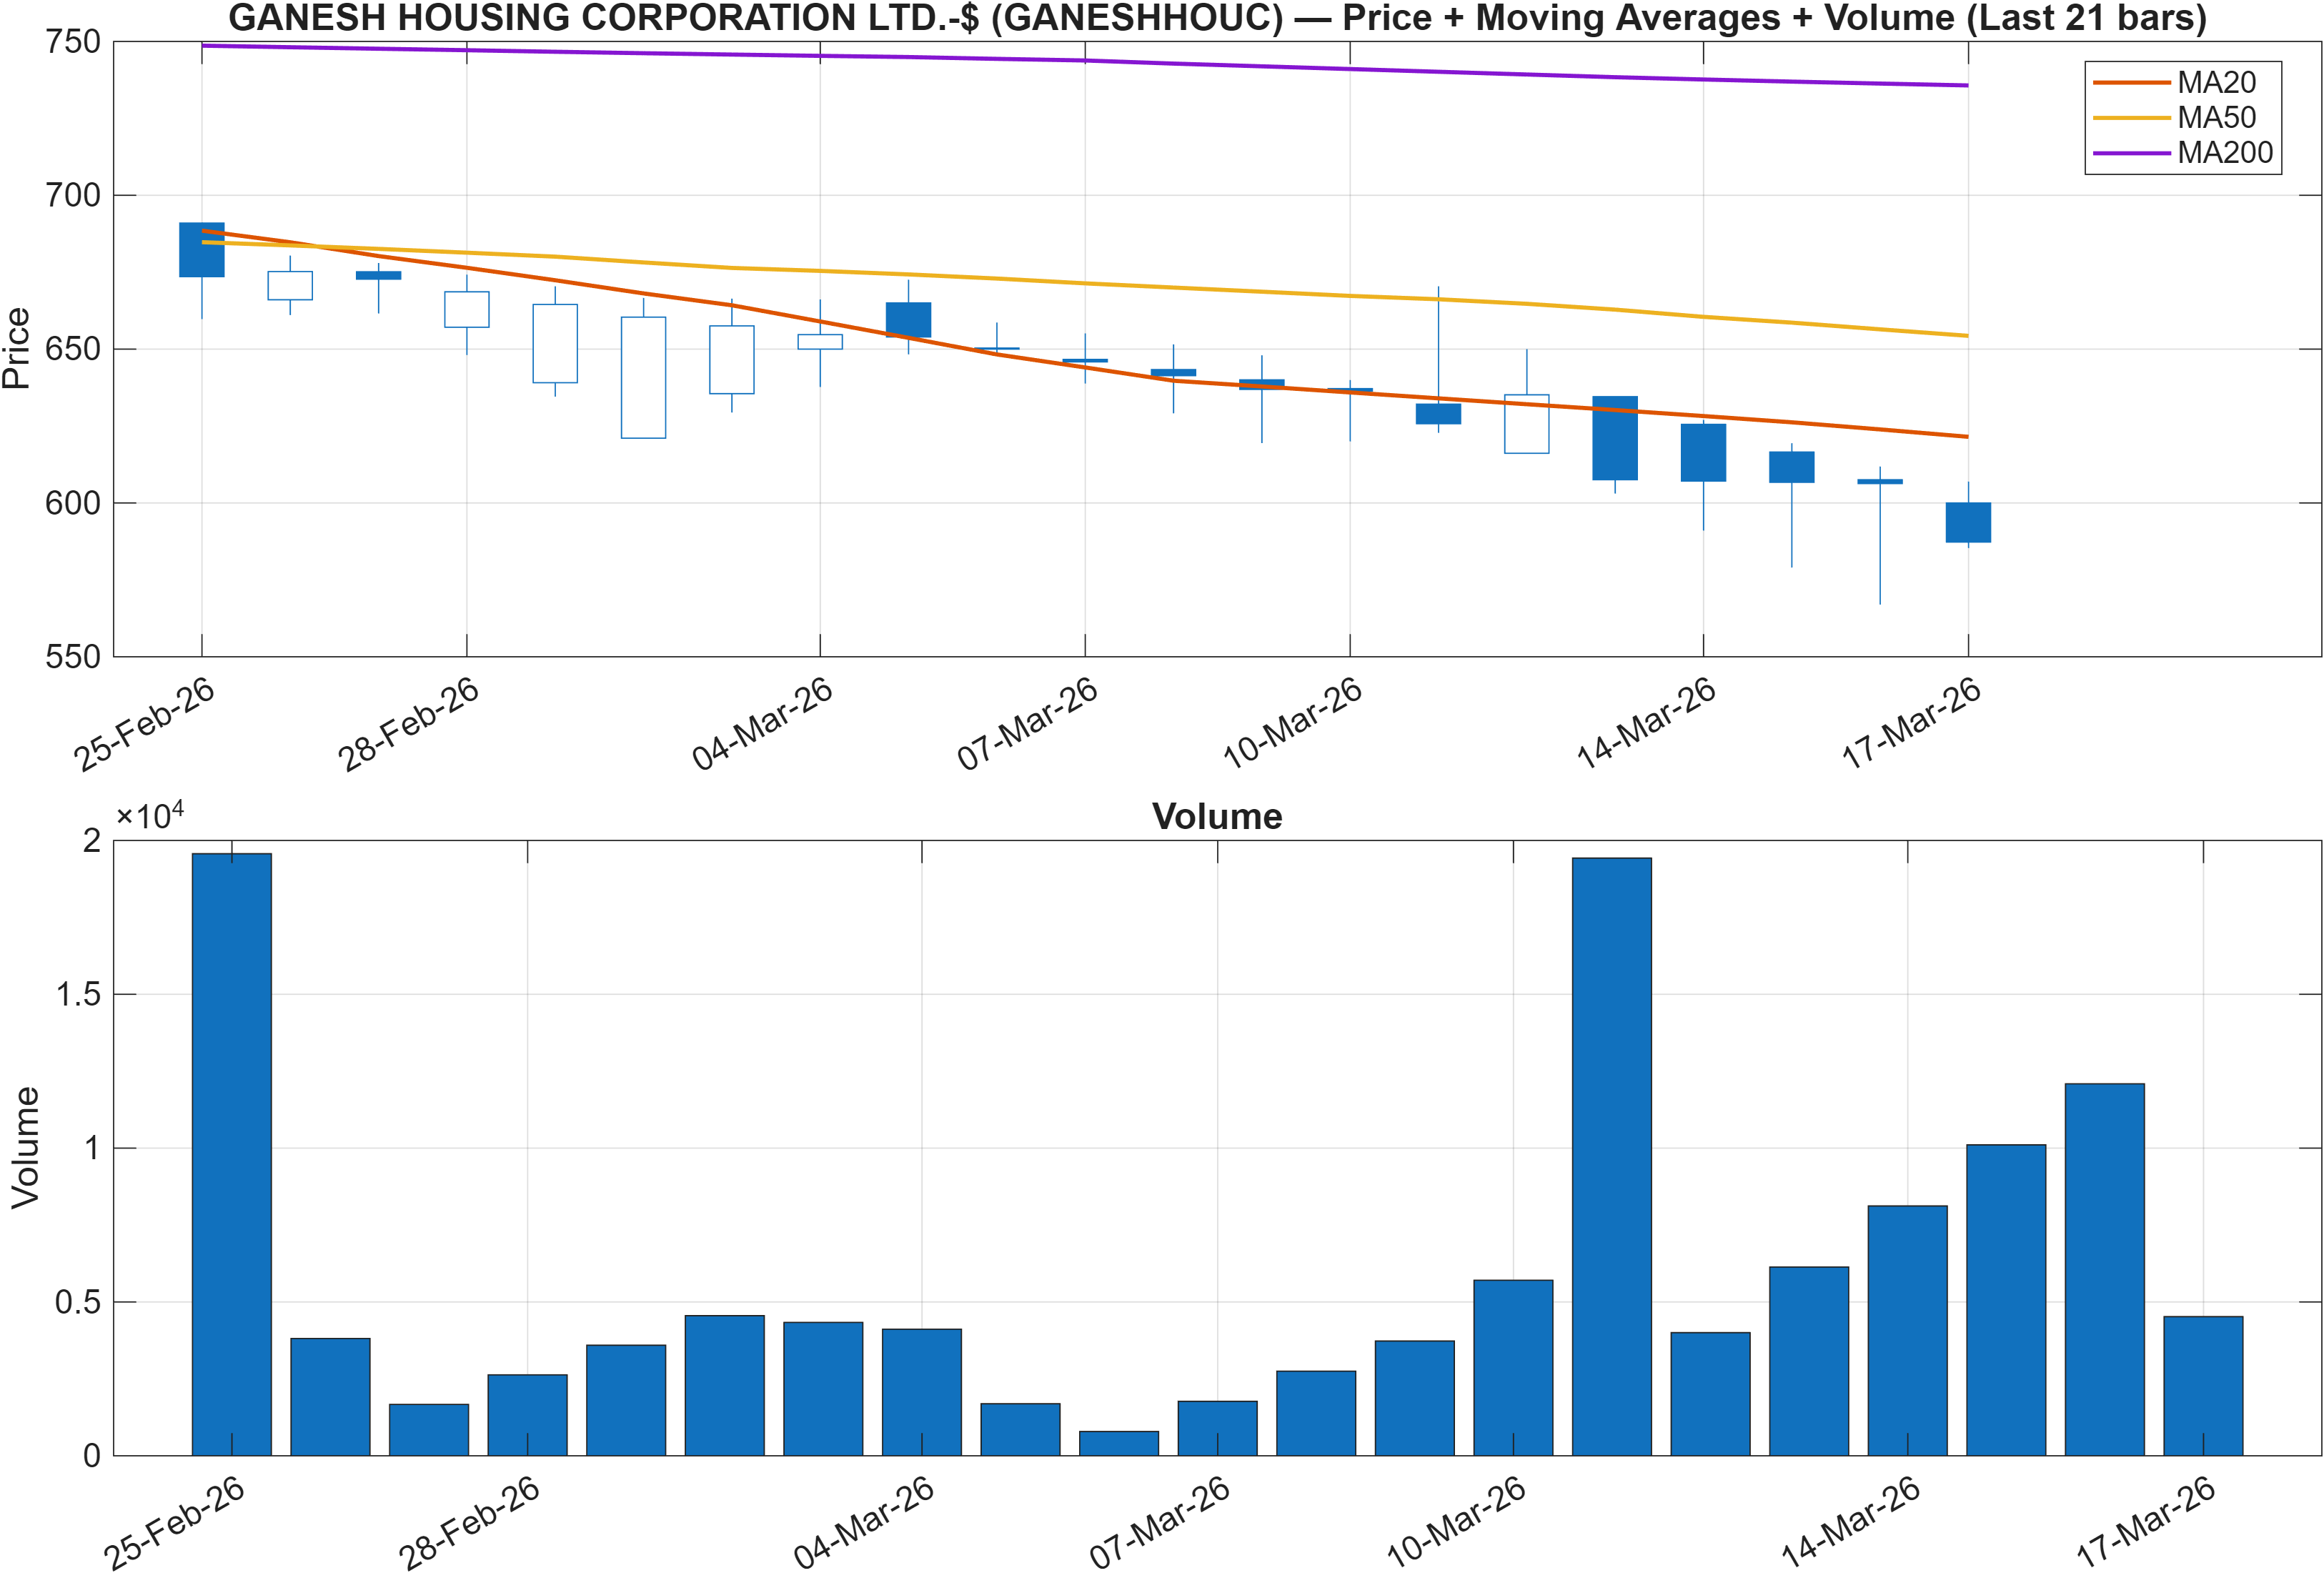
The trend layer is unambiguous: the close versus MA50 is labeled bearish, and MA50 versus MA200 is also bearish. When both relationships point in the same direction, it typically indicates that weakness is not limited to intraday noise; the intermediate trend is aligned with the longer-term trend, keeping rallies susceptible to being sold rather than extended.
This alignment also helps contextualize the long-term neutrality seen in the yearly rank (#481). A neutral long-run rank does not necessarily imply an active uptrend; instead, it can indicate that the instrument is not among the worst structural cases in the universe even while the current tape is weak. In that setting, moving averages become a practical “structure test”: until price can meaningfully reclaim the MA50 and then begin to challenge the longer-term downtrend relationship versus MA200, the default assumption remains that the market is trading in a defensive regime.
From a market-structure perspective, bearish MA stacking tends to coincide with reduced tolerance for failed breakouts: upside probes that lack follow-through often revert quickly because the average participant’s cost basis is above spot. This also matches the AI ranking profile, where the daily rank at #1163 signals poor near-term behavior versus peers. As a result, trend evidence and cross-sectional evidence are not diverging here; they are reinforcing the same regime classification.
Interpretation: Close vs MA50 = Bearish, MA50 vs MA200 = Bearish.
3) Momentum & volatility dashboard
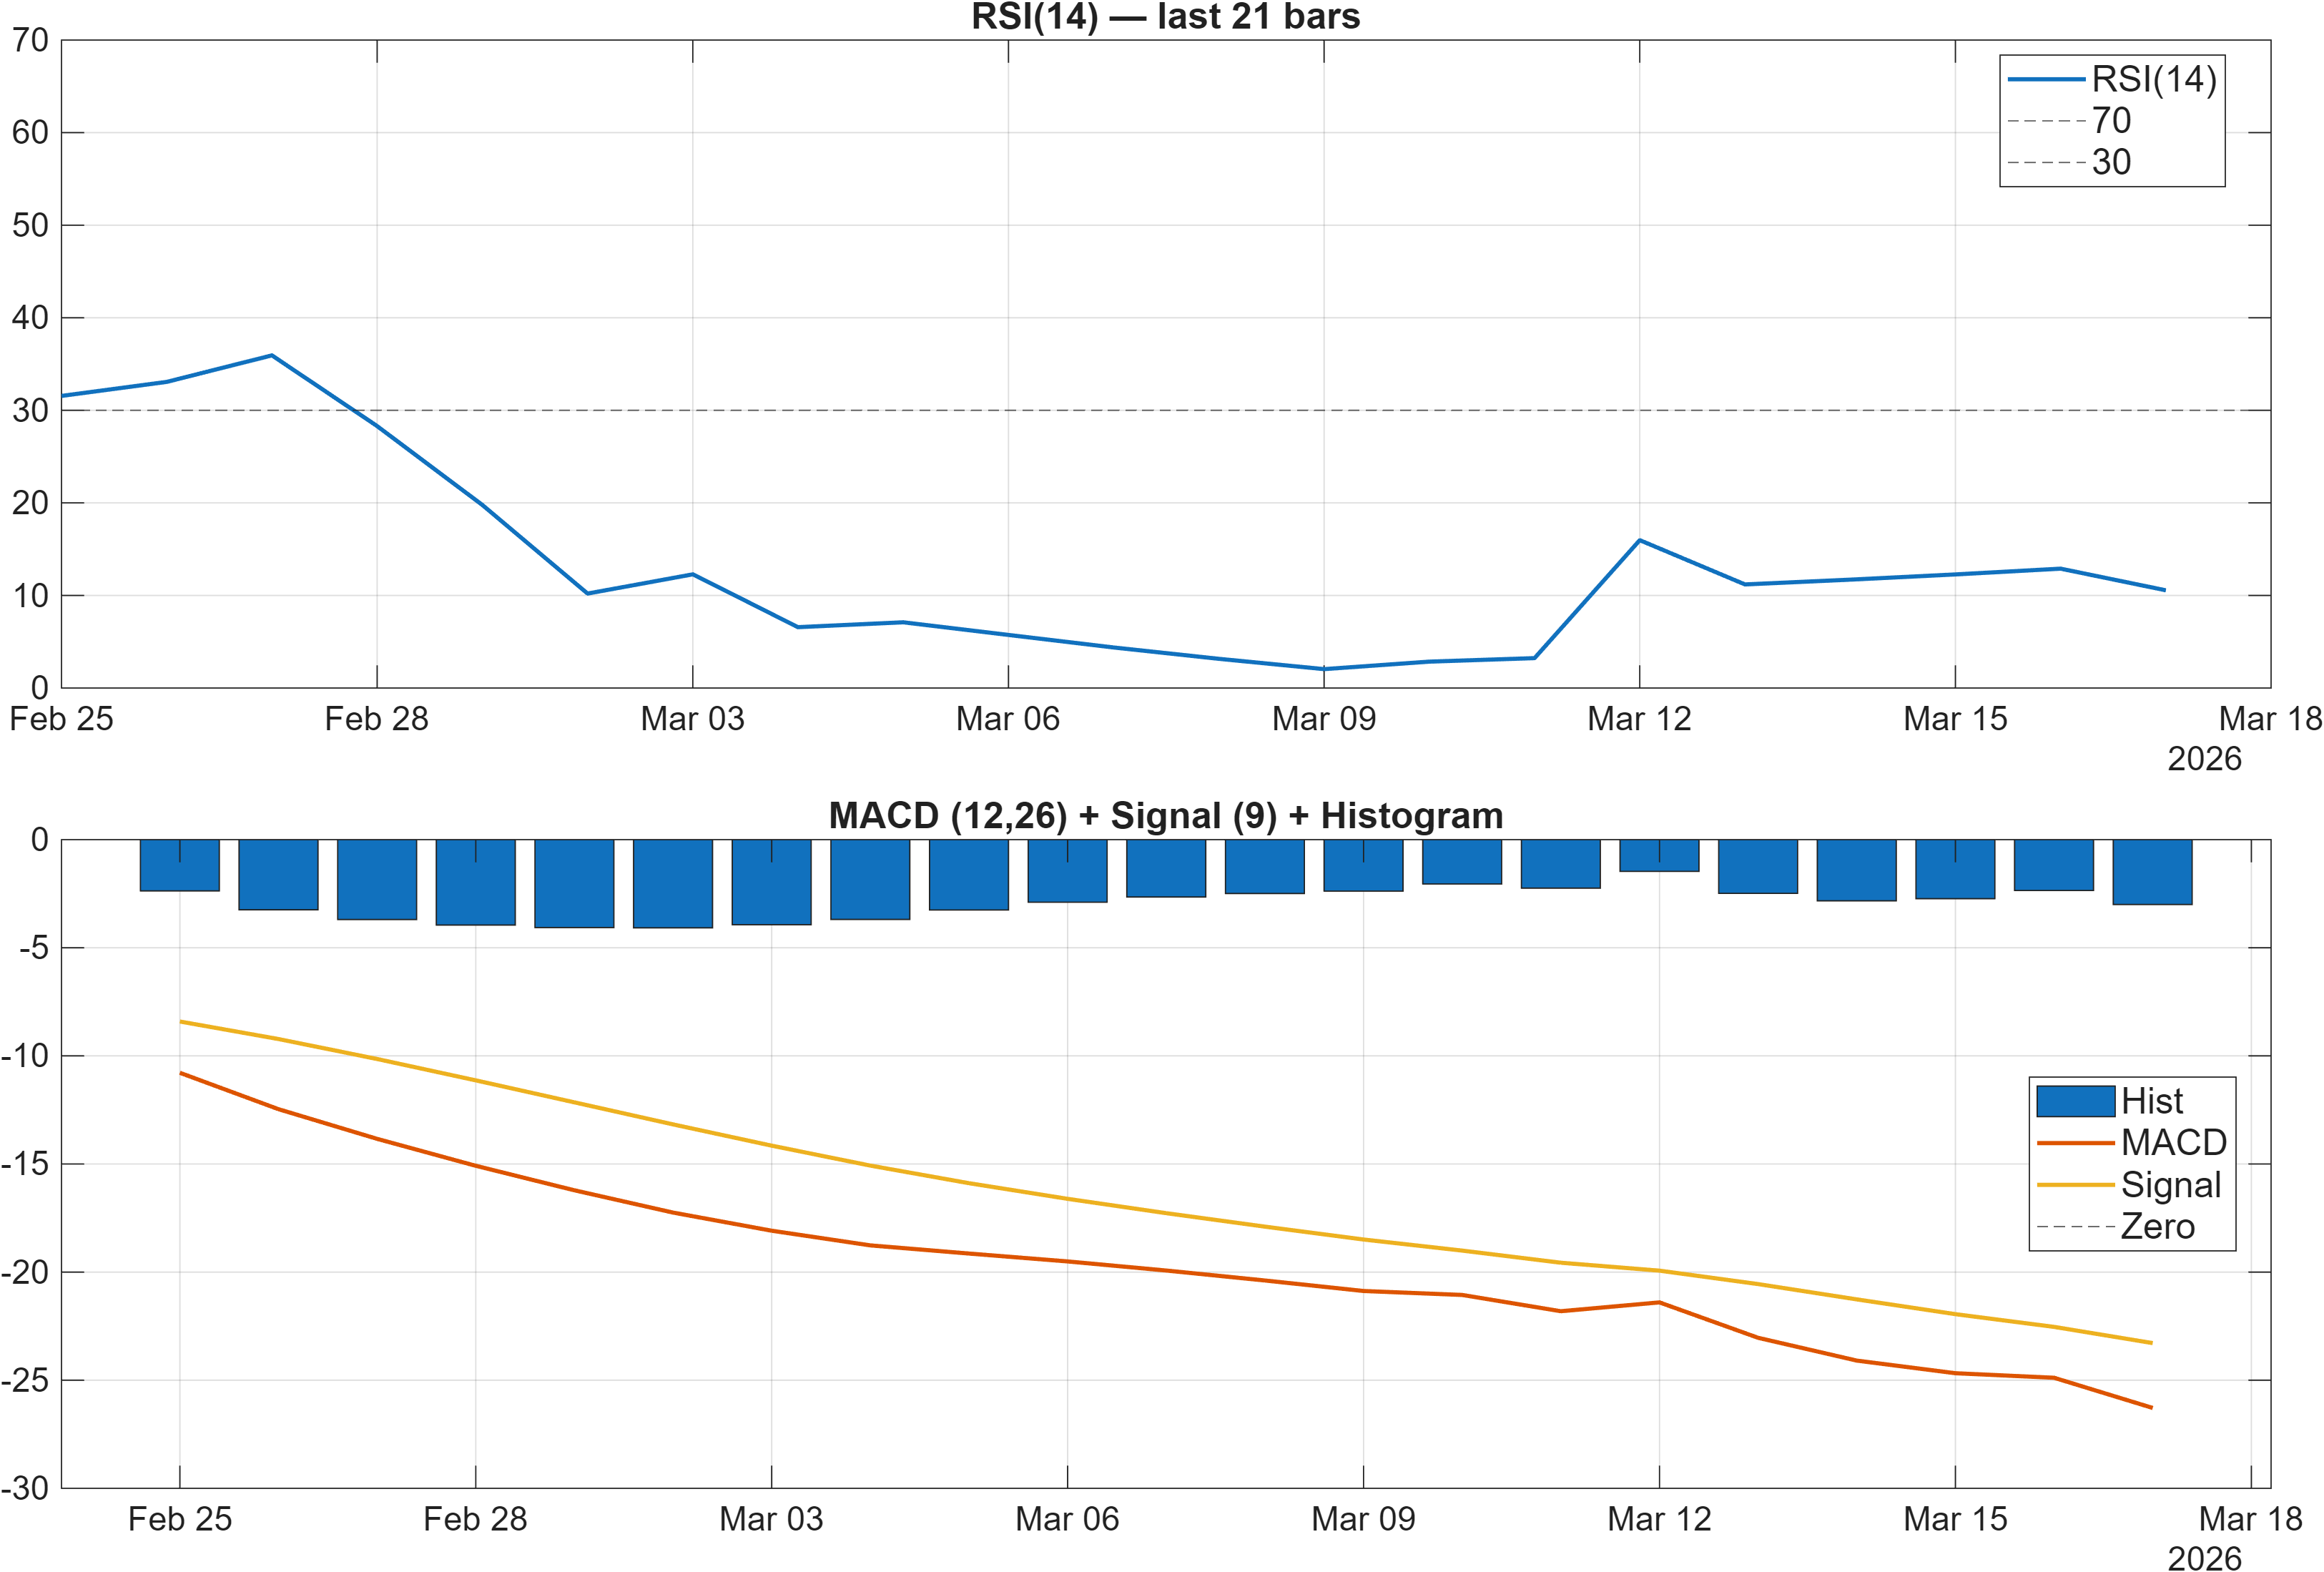
Momentum signals are currently skewed toward downside continuation rather than a confirmed reversal. RSI is labeled bearish, and the signal table places RSI(14) at 10.56, which is an extreme reading that can coincide with oversold conditions. However, “oversold” is not a reversal signal by itself; in persistent downtrends (also consistent with the bearish MA relationships), RSI can remain depressed while price continues to drift lower or form only shallow rebounds.
MACD reinforces the same directionality. The MACD histogram is reported as -2.9998 in the dashboard, and the signal table lists MACD Hist as -3 with a bearish signal. That agreement across representations suggests that downside momentum is not merely a single-indicator artifact. In this configuration, a higher-quality stabilization attempt would usually require evidence of momentum “compression” first—i.e., the histogram rising toward zero—before any durable trend transition can be inferred.
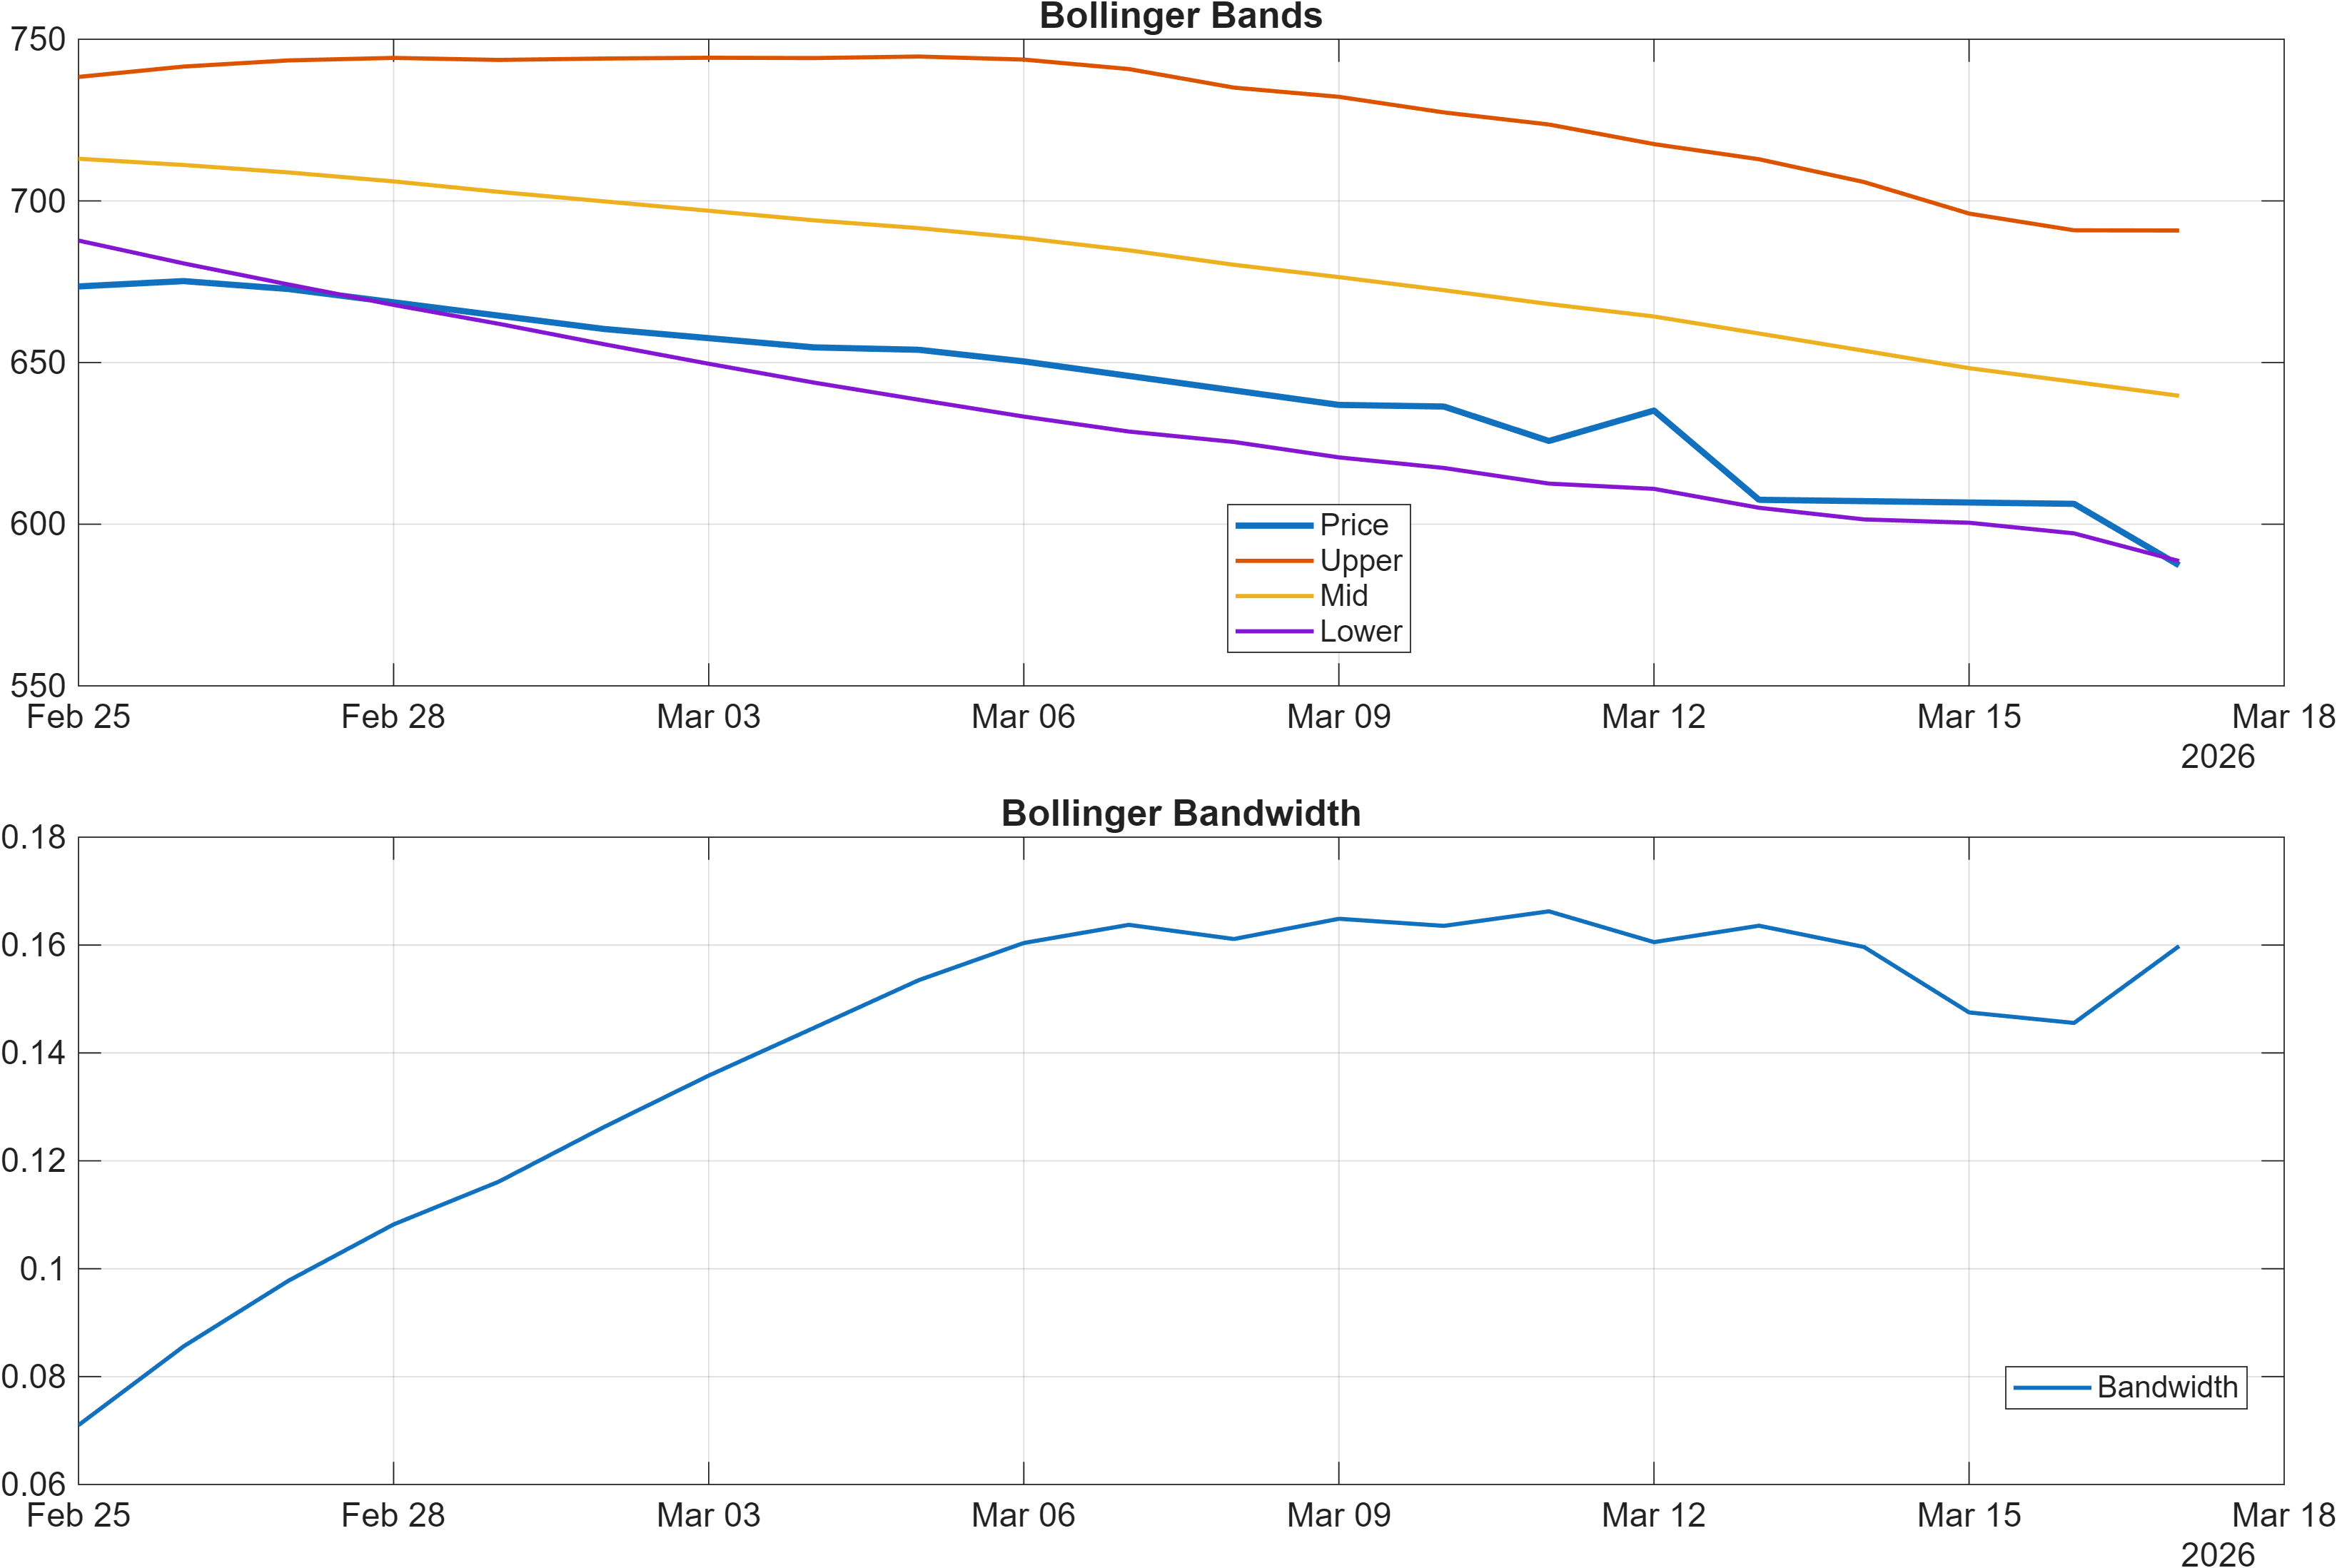
Volatility context is more nuanced. Bollinger bandwidth is 0.1598 and labeled neutral in the signal table. A neutral bandwidth regime implies volatility is not clearly expanding into a trend-acceleration phase, but neither is it signaling tight consolidation. For timing, this matters: extreme momentum readings alongside non-expanding volatility can sometimes precede short countertrend snaps, yet without a confirming shift in MACD/MA structure those moves often remain tactical rather than structural.
Interpretation: RSI bias = Bearish, MACD hist = -2.9998.
Interpretation: Bandwidth (volatility regime) latest = 0.1598.
4) Support / Resistance zones
Support ~ 617.8000 | Resistance ~ 759.9250
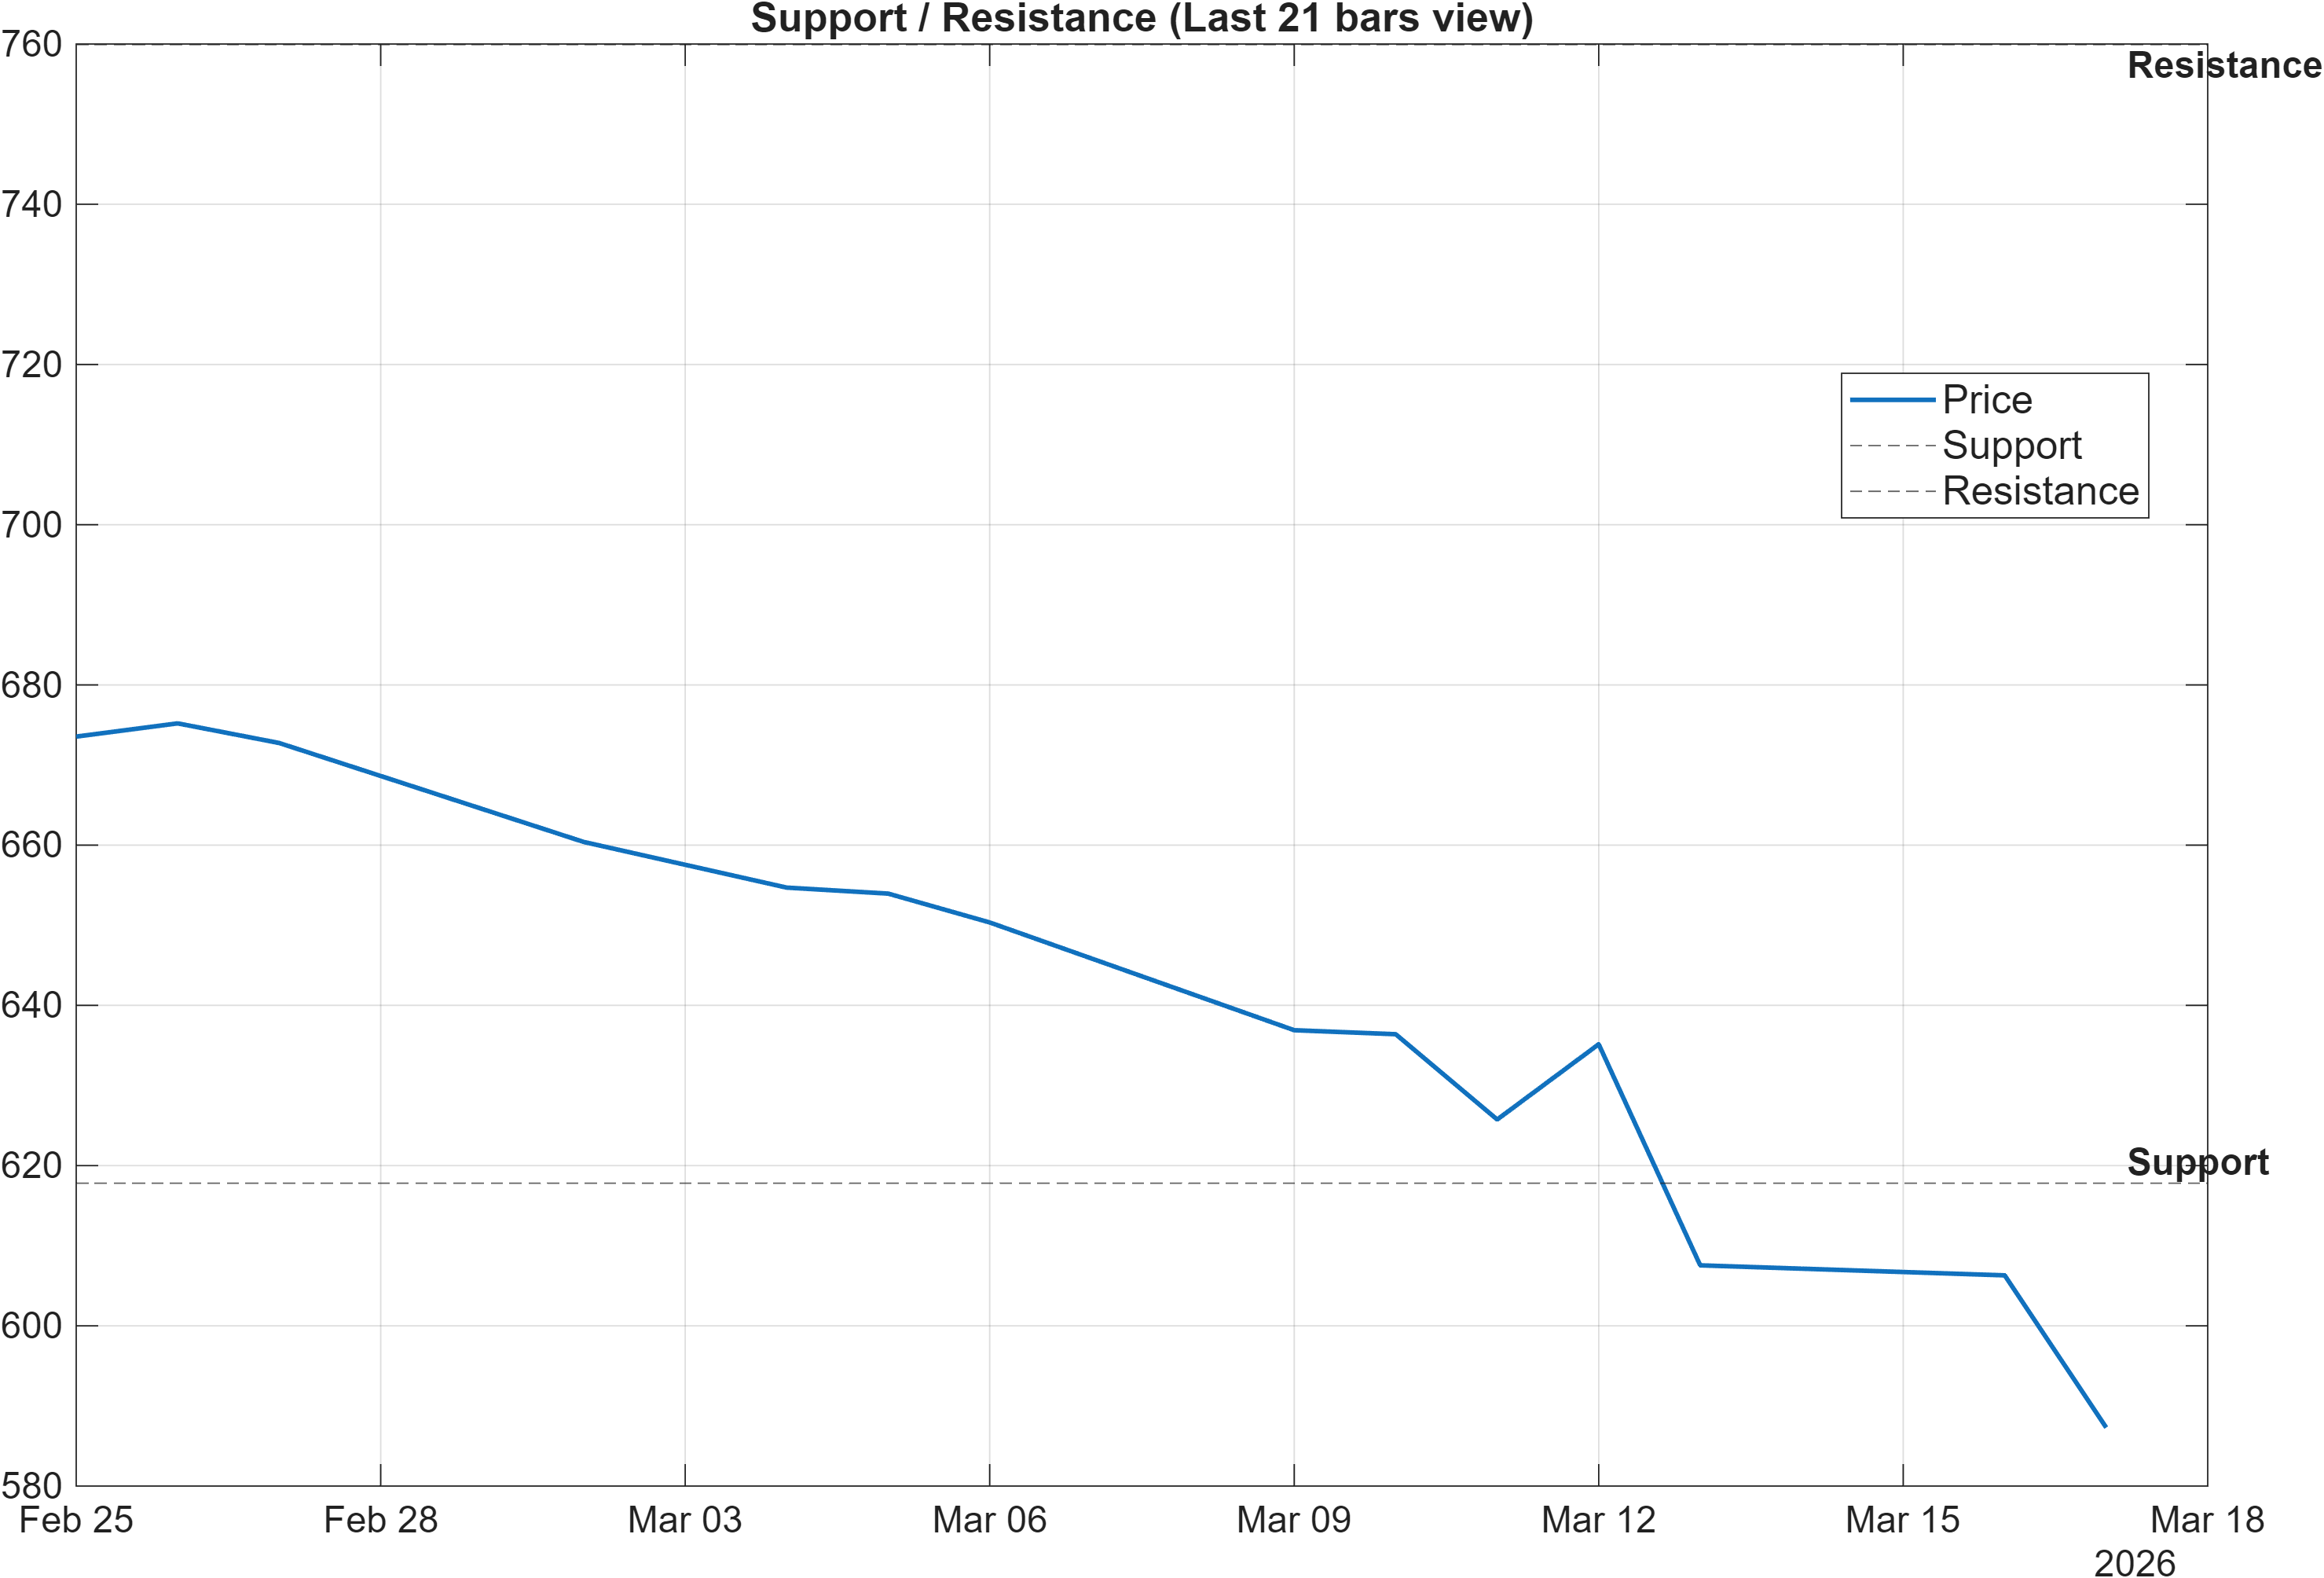
The current structure concentrates decision-making into a relatively clear band between 617.8000 (support) and 759.9250 (resistance). With the broader trend indicators leaning bearish, the analytical burden typically sits on the upside: resistance becomes the level where the market must demonstrate improved participation and acceptance, rather than just a transient rebound.
The scenario framing provided is appropriately conditional: a break above resistance with volume points toward continuation, while a close below support increases deterioration risk. This is consistent with how support/resistance acts as a probabilistic filter: a break with confirmation can signal that supply is being absorbed and that the prior downtrend is losing control. By contrast, losing support tends to reinforce the weak short-horizon ranks (daily #1163, monthly #1051) by expanding the set of investors holding losses, which can amplify reactive selling.
It is also notable that the signal table includes “MedPx vs Support” at -21.65 with a bearish label, which aligns with the idea that price action is not comfortably sitting above the defined demand zone. In a constructive stabilization sequence, analysts often look for repeated defenses of support accompanied by improving momentum (e.g., MACD histogram trending upward from -2.9998) rather than a single bounce. Until those conditions emerge, these levels function more as risk boundaries than as directional forecasts.
Scenario view: Break above resistance with volume → continuation. Close below support → signal deterioration risk.
5) Quant Technical Dashboard (18 Signals)
KGNAI AI Technical Analysis Score (Deep Reinforcement Learning): Rank #1052 out of 1222 (Rank 1 represents the strongest technical positioning and a higher probability of favorable price behavior. As ranks increase toward the maximum, the probability of favorable outcomes weakens and bearish positioning becomes more dominant.) | Label: Bearish | Score: -0.722
18-Signal Technical Confluence Score: -0.500 (Bearish)
Overall Technical Score (18-signal confluence + DRL rank blend): -0.567 (Bearish)
Note: The blended score reflects signal strength weighted against broader AI technical ranking, which may temporarily diverge.
Blended technical score breakdown: -0.567 (Bearish | Bull 3 / Bear 12 / Neutral 3)
The quantitative dashboard shows a broad-based bearish clustering rather than a narrow weakness isolated to one factor. The Deep Reinforcement Learning technical rank is #1052 out of 1222 with a -0.722 score, placing the setup in a weak relative technical cohort. That message is reinforced by the 18-signal framework: the technical confluence score is -0.500 and the blended overall technical score is -0.567, both labeled bearish.
Breadth within the signal set matters. The breakdown shows Bear 12 versus Bull 3 and Neutral 3, indicating the bearish read is not a close call. Importantly, even the bullish signals that do appear look more like “relief conditions” than full reversals: for example, Stoch %K at 19.62 is labeled bullish and can occur near short-run lows, but it does not invalidate negative trend state when MACD is bearish and RSI is at 10.56.
Volume and accumulation signals do not uniformly contradict the bearish case. While ADOSC at 20.6 is bullish and Vol ROC(20) at 18.59 is bullish, several participation slopes (e.g., OBV slope) are bearish in the table, suggesting that any accumulation evidence is not yet dominant enough to flip the aggregate regime. In other words, the system is capturing incipient activity on some volume-derived measures, but the overall market state remains controlled by trend and momentum weakness. For confirmation, the most constructive path would be seeing bearish breadth shrink (more neutrals, fewer bears) alongside improving price structure versus the moving averages and resistance.
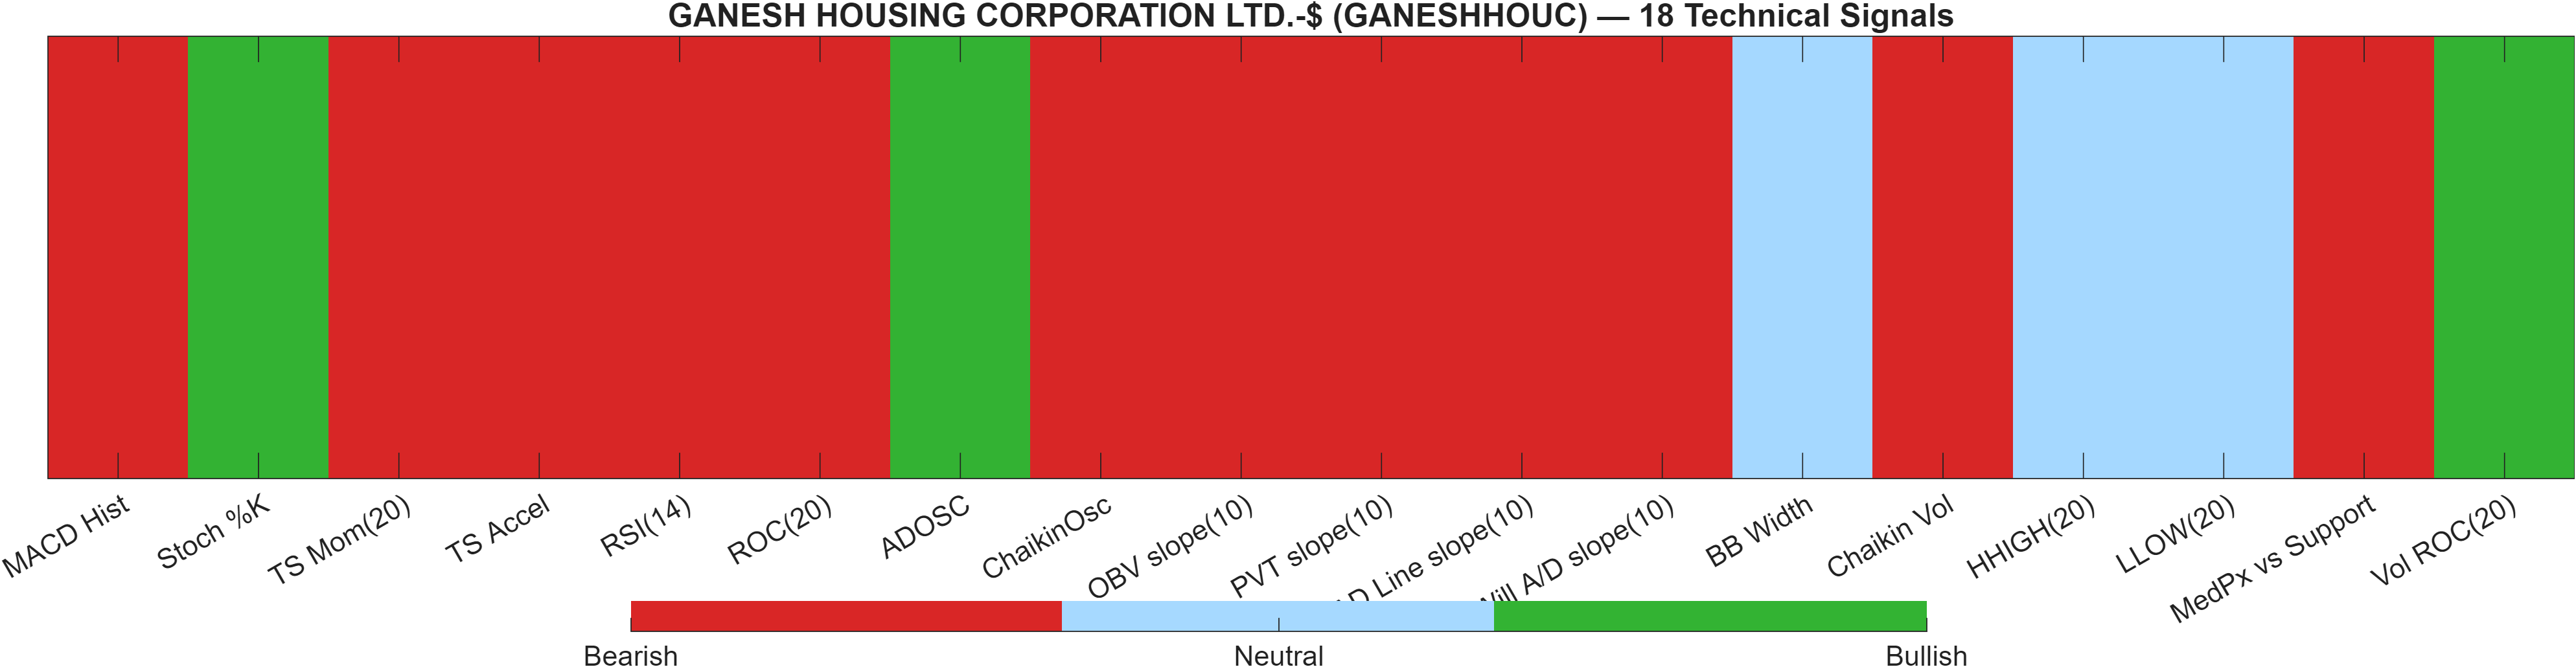
Signal table (Bull/Bear/Neutral)
| Indicator | Value | Signal |
|---|---|---|
| MACD Hist | -3 | Bearish |
| Stoch %K | 19.62 | Bullish |
| TS Mom(20) | -87.9 | Bearish |
| TS Accel | -44.17 | Bearish |
| RSI(14) | 10.56 | Bearish |
| ROC(20) | -13.02 | Bearish |
| ADOSC | 20.6 | Bullish |
| ChaikinOsc | -282.6 | Bearish |
| OBV slope(10) | -6.858e+04 | Bearish |
| PVT slope(10) | -743.7 | Bearish |
| AD Line slope(10) | -7855 | Bearish |
| Will A/D slope(10) | -135.9 | Bearish |
| BB Width | 0.1598 | Neutral |
| Chaikin Vol | 37.82 | Bearish |
| HHIGH(20) | 680.4 | Neutral |
| LLOW(20) | 567 | Neutral |
| MedPx vs Support | -21.65 | Bearish |
| Vol ROC(20) | 18.59 | Bullish |
Interpretation: Indicator-level signals form the base confluence, which is then adjusted using a separate AI-driven technical ranking model. The final technical score summarizes this combined view.
6) News sentiment + extractive gist
Note: Instrument-specific news matches were not found, so the digest includes broader market/sector headlines. Links are provided for verification.
Sentiment score (avg): 0.047 | Positive: 25% | Neutral: 63% | Negative: 12%
KGNAI AI News Sentiment Score (normalized -1 to +1): Not available (as of —) | Label: Not available | Overall news score: 0.05
Positive Developments
Recent coverage across major financial outlets indicates a constructive tone around select pockets of global equities and corporate activity, with attention on large-cap technology investment cycles and pockets of resilience in broader indices. The market narrative includes expectations of continued spending tied to AI infrastructure buildouts, which can support risk appetite at the margin even when individual stocks are technically weak. In India, the broader equity backdrop referenced in the digest points to sessions where benchmark indices advanced, led by cyclical leadership groups. For GANESHHOUC, this matters less as a direct catalyst and more as a context variable: when the macro tape is stable-to-firm, deeply oversold technical states (e.g., RSI(14) at 10.56) sometimes see sharper mean-reversion attempts. However, the current report’s news set remains non-instrument-specific, so any constructive inference should be treated as environmental rather than company-driven.
Neutral / Mixed Developments
The digest also reflects a mixed, informational flow—regulatory consultations and corporate reorganizations that may shift sector positioning over time without providing immediate directional impulse. Such items often translate into gradual sentiment effects, influencing risk preferences and factor rotations rather than creating discrete price shocks. With the overall sentiment mix heavily neutral (63%) and the average score near flat at 0.047, the news backdrop is best read as a low-conviction overlay. In a setup where technical confluence is bearish (-0.500) and the blended technical score is also bearish (-0.567), a neutral news tape typically lacks the intensity to override trend signals; instead, it can merely reduce the probability of abrupt sentiment-driven gaps.
Negative / Risk Signals
Risk-oriented coverage in the digest leans toward macro uncertainty—geopolitical stress, commodity price sensitivity, and recession-risk framing. Even if not directly linked to GANESHHOUC, these themes can tighten financial conditions and raise volatility expectations for equities broadly, especially when technicals are already fragile. While the negative share in the sentiment mix is only 12%, the presence of macro-risk narratives can still influence how markets behave around inflection points: rallies may struggle to sustain if risk premia rise, and breaks of support can accelerate when participants de-risk. For GANESHHOUC, that heightens the importance of the defined downside boundary at 617.8000—a close below this level would align poorly with the existing bearish rank cluster (daily #1163) and could deepen the adverse technical state.
- Whether price can hold above 617.8000 during broader market risk-off windows.
- Whether momentum improves via MACD histogram rising from -2.9998 toward zero.
- Whether upside attempts can reclaim 759.9250 with confirming volume behavior.
Snapshot: AI Rank (Short–Mid–Long): Mixed (Bearish tilt) (Bearish–Bearish–Neutral) · Technical Confluence: Bearish · Key Levels: Support ~617.80 | Resistance ~759.92 · News Sentiment: Neutral
Sources referenced: Reuters, Bloomberg, Yahoo Finance, MarketWatch, Investing.com
7) Sources
Not available in the provided data.
You may also like: How KGNAI AI ranks instruments across global markets
Disclaimer: KGNAI provides AI-generated analytics and educational market commentary only. This is not financial advice. Markets involve risk. Always do your own research.