
B.L.KASHYAP AND SONS LTD. (BLKASHYAP) — 20-May-2026 Technical Alignment Leans Cautious, Awaiting Resolution
BLKASHYAP enters 20-May-2026 with a notably mixed cross-horizon profile: the Daily rank (#80 of 1222) sits in the upper cohort of the universe, while the Weekly (#886) and Monthly (#965) ranks remain in the weaker portion. That split typically reflects a short-term stabilization attempt that has not yet converted into durable trend leadership. Technically, the system’s 18-signal confluence is Bearish (-0.444), while the blended score is Neutral (-0.138), implying that internal indicators are still skeptical even as broader model context moderates the conclusion. Momentum readings reinforce this: MACD histogram -0.6046 and RSI(14) 40.69 sit on the defensive side of neutral. Key decision zones are clearly defined at Support ~43.8100 and Resistance ~60.0900. News sentiment is mildly constructive (avg 0.096), but not strong enough, by itself, to resolve the technical stalemate.
- Rank stance: Short-term Neutral; Mid-term Neutral; Long-term Neutral (Daily rank stands out vs weaker weekly/monthly positioning).
- Technical confluence: Bearish (18-signal score -0.444) with blended score Neutral (-0.138).
- Key levels: Support ~43.8100 | Resistance ~60.0900.
- News sentiment bias: Neutral with slight positive tilt (avg 0.096; 37% positive vs 12% negative).
- Confirmation / invalidation: A sustained move above 60.0900 with participation would help confirm upside continuation; a close below 43.8100 would increase deterioration risk.
What KGNAI Measures
KGNAI evaluates assets using large cross-sectional datasets built from millions of structured data points. Inputs incorporate fundamental metrics, technical structures, and systematically processed news sentiment. Statistical models, machine learning, and AI frameworks are used to assess relative positioning, signal alignment, and probabilistic behavior across broad universes.
How to Read This Report
- Ranks are comparative across the tracked universe, not absolute price targets.
- Confluence reflects alignment among independent signal groups.
- Support/resistance levels are probabilistic decision zones, not guarantees.
- Sentiment provides contextual bias within the broader analytical framework.
1) KGNAI AI Analysis
Region: INDIA
Total universe size: 1222 ranked instruments
- Daily rank: #80 out of 1222 — Bullish
- Weekly rank: #886 out of 1222 — Neutral
- Monthly rank: #965 out of 1222 — Neutral
- 3-Monthly rank: #897 out of 1222 — Neutral
- 6-Monthly rank: #817 out of 1222 — Neutral
- Yearly rank: #958 out of 1222 — Neutral
The rank stack shows a clear time-horizon divergence. The Daily rank (#80) places BLKASHYAP in the upper slice of the tracked universe, consistent with a near-term improvement in relative behavior. In contrast, the Weekly (#886) and Monthly (#965) readings sit in the lower portion, suggesting the broader regime remains unproven and still requires confirmation from trend and momentum.
This pattern often appears when an instrument is attempting to transition from a longer consolidation or drawdown into a more stable advance. In such cases, the short-term model can respond quickly to stabilization and early participation, while medium/long windows remain anchored to prior weakness. Here, the 3-Monthly rank (#897) and Yearly rank (#958) reinforce that the longer-horizon backdrop is still neutral-to-soft versus peers.
From a process standpoint, the practical takeaway is not to treat the daily improvement as a “trend change” by itself. Instead, it frames a watch state: the asset is behaving better in the immediate window, but the probability of sustained follow-through typically improves only when medium-term ranks begin to rotate upward as well. Until that occurs, BLKASHYAP’s term view remains Neutral across short, mid, and long horizons, implying that risk control and level-based confirmation should carry more weight than extrapolation.
KGNAI ranks each instrument across large universes using multiple proprietary AI tests and statistical models (millions of data points). Lower ranks generally indicate stronger probability of favorable performance behavior, while higher ranks indicate weaker probability and more bearish positioning.
Term view: Short-term: Neutral. Mid-term: Neutral. Long-term: Neutral.
Want the full universe and complete rank tables? Unlock full access on KGNAI: https://www.kgnai.com/pricing
2) Price & trend overview
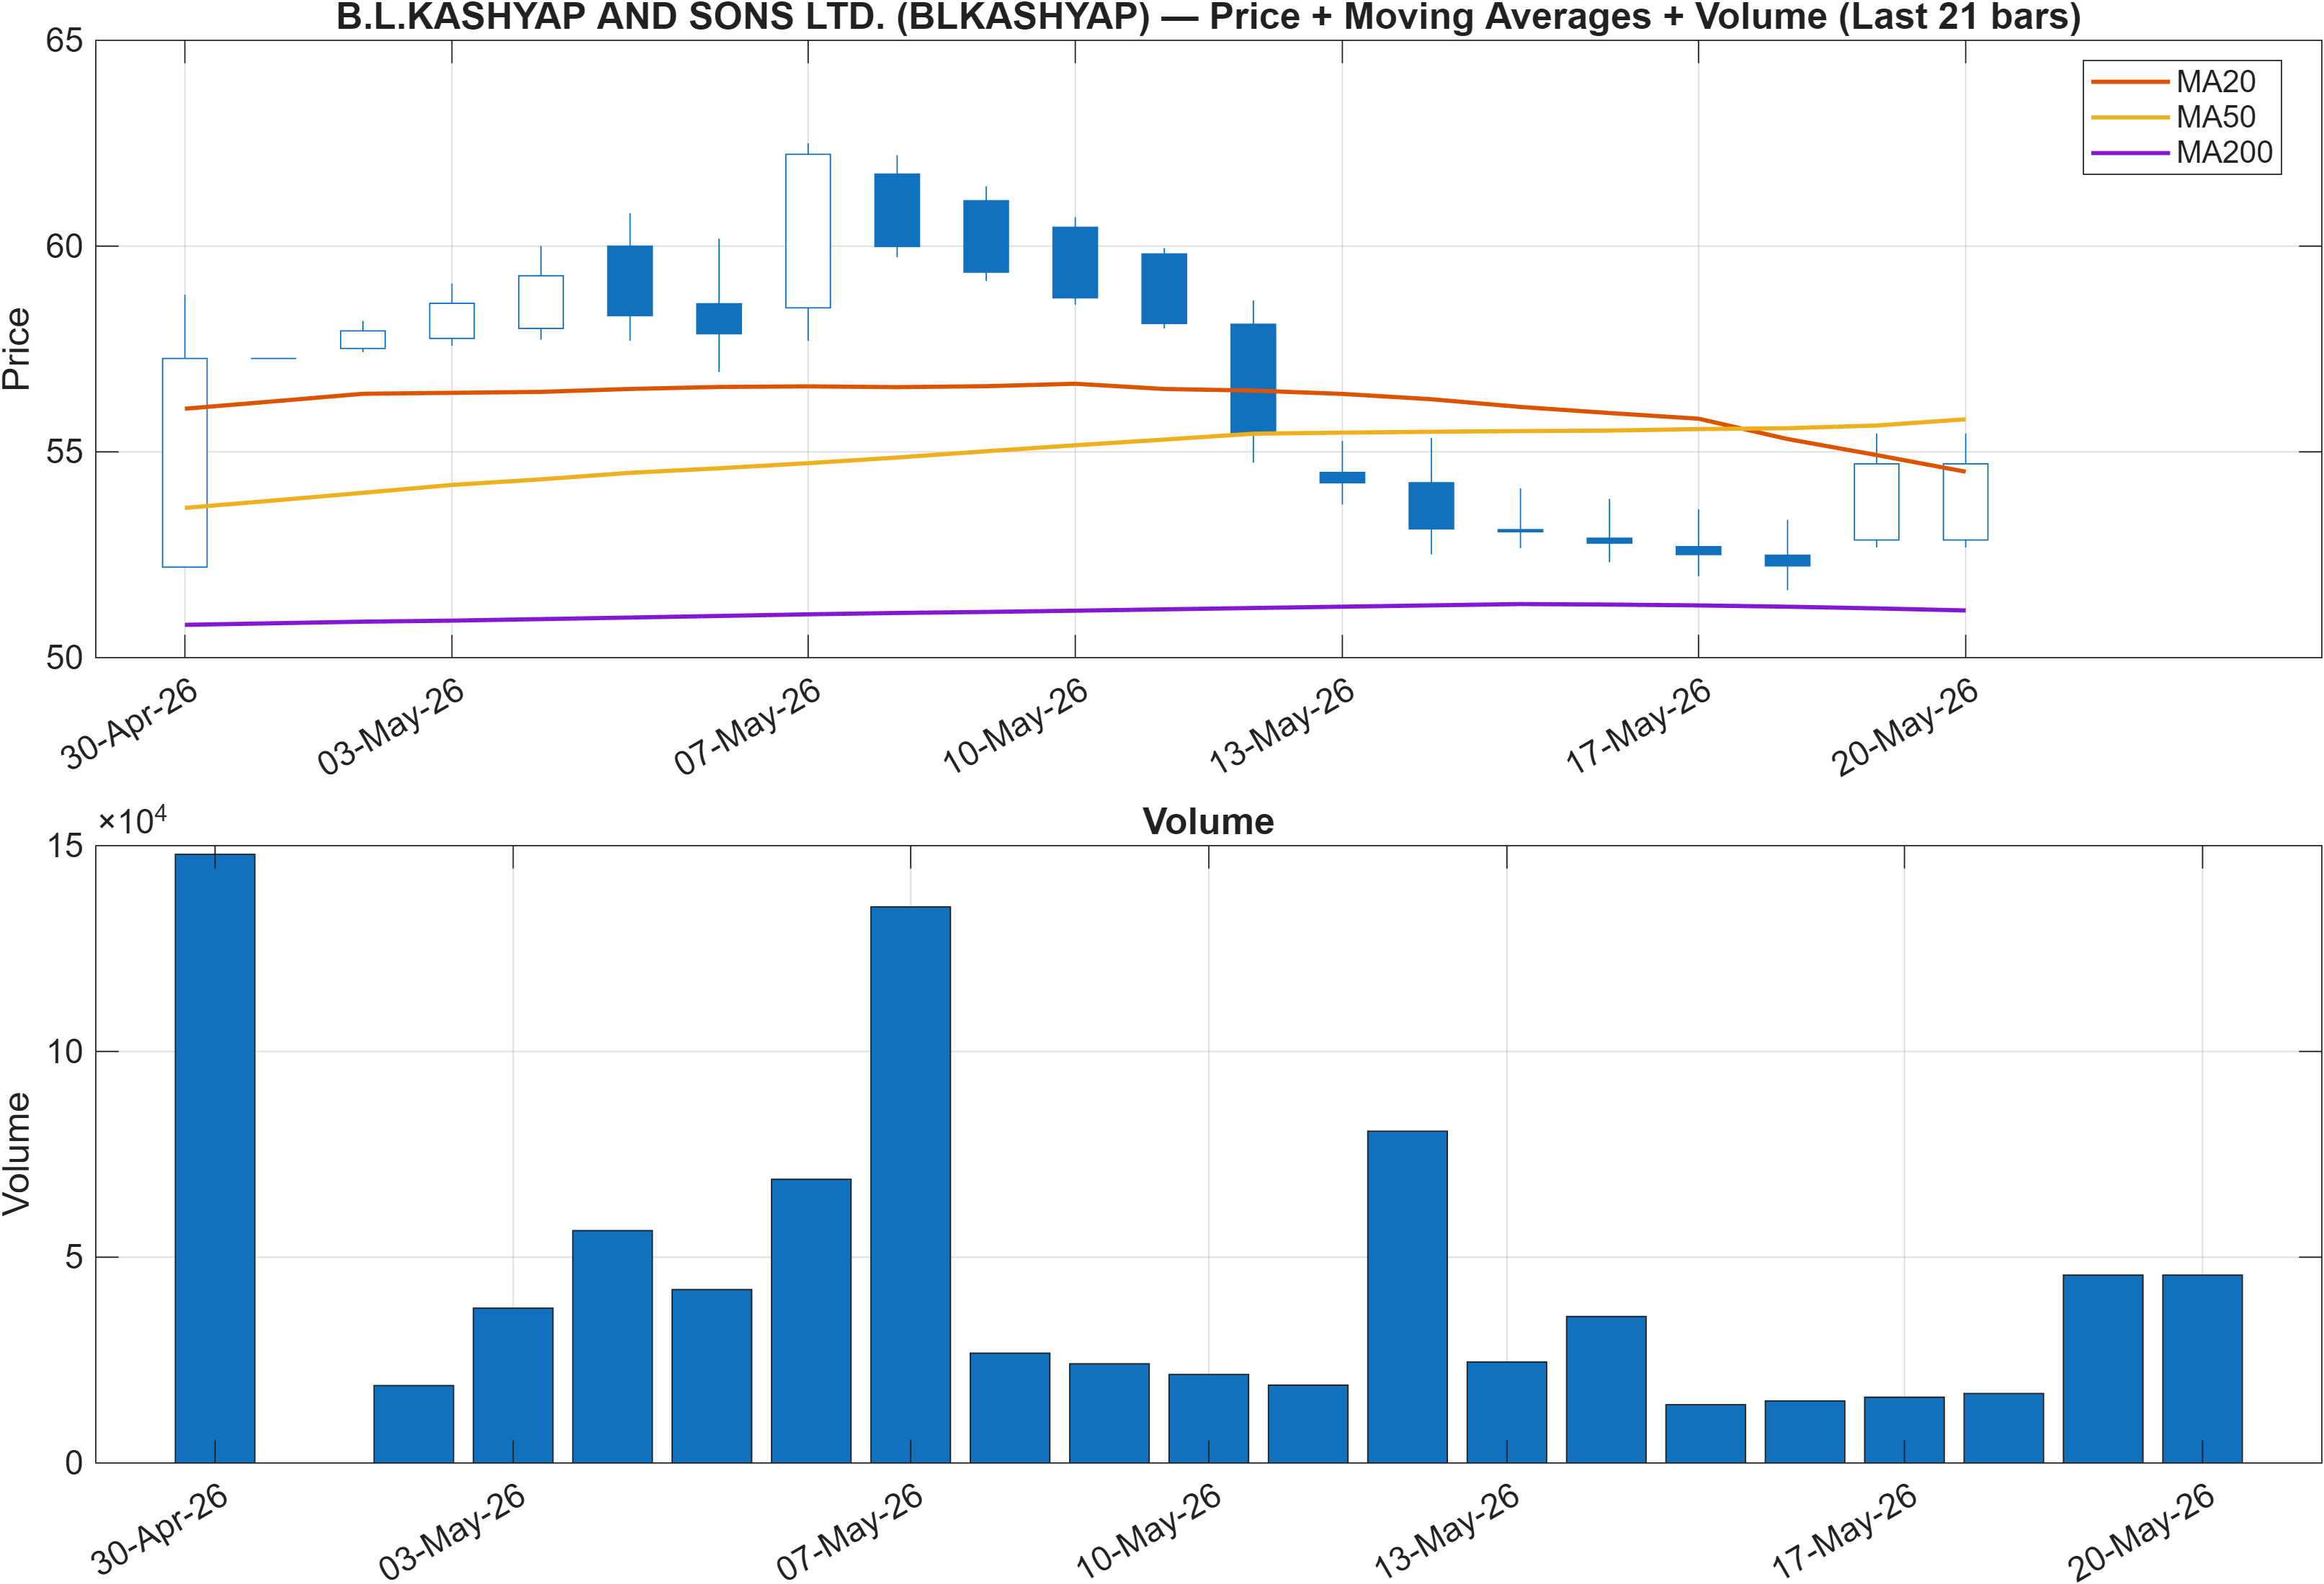
The moving-average structure is explicitly split: Close vs MA50 = Bearish while MA50 vs MA200 = Bullish. That combination typically describes an instrument that retains some longer-cycle base support (MA50 above MA200) but is currently trading below its intermediate trend gauge (price below MA50). In market-structure terms, it is a pullback within a larger recovery template, or a range state where the intermediate trend is not yet re-established.
This matters because the path back to a more stable technical posture usually requires price to reclaim the MA50 and hold it long enough for momentum oscillators to stop printing persistently weak readings. The rank divergence observed in Section 1 aligns with this: the daily model can improve as the market stabilizes, while the weekly/monthly models remain constrained by the unresolved intermediate trend.
Volume and participation (as shown in Figure 1) become the differentiator in this regime. When price is below MA50, upside attempts that lack sustained participation often fail near prior supply zones—often close to resistance markers like 60.0900 (see Section 4). Conversely, holding above the key support zone (43.8100) while compressing volatility can set up a later resolution move. The current configuration, therefore, is less about trend certainty and more about testing whether the market can absorb supply and rebuild intermediate trend alignment.
Interpretation: Close vs MA50 = Bearish, MA50 vs MA200 = Bullish.
3) Momentum & volatility dashboard
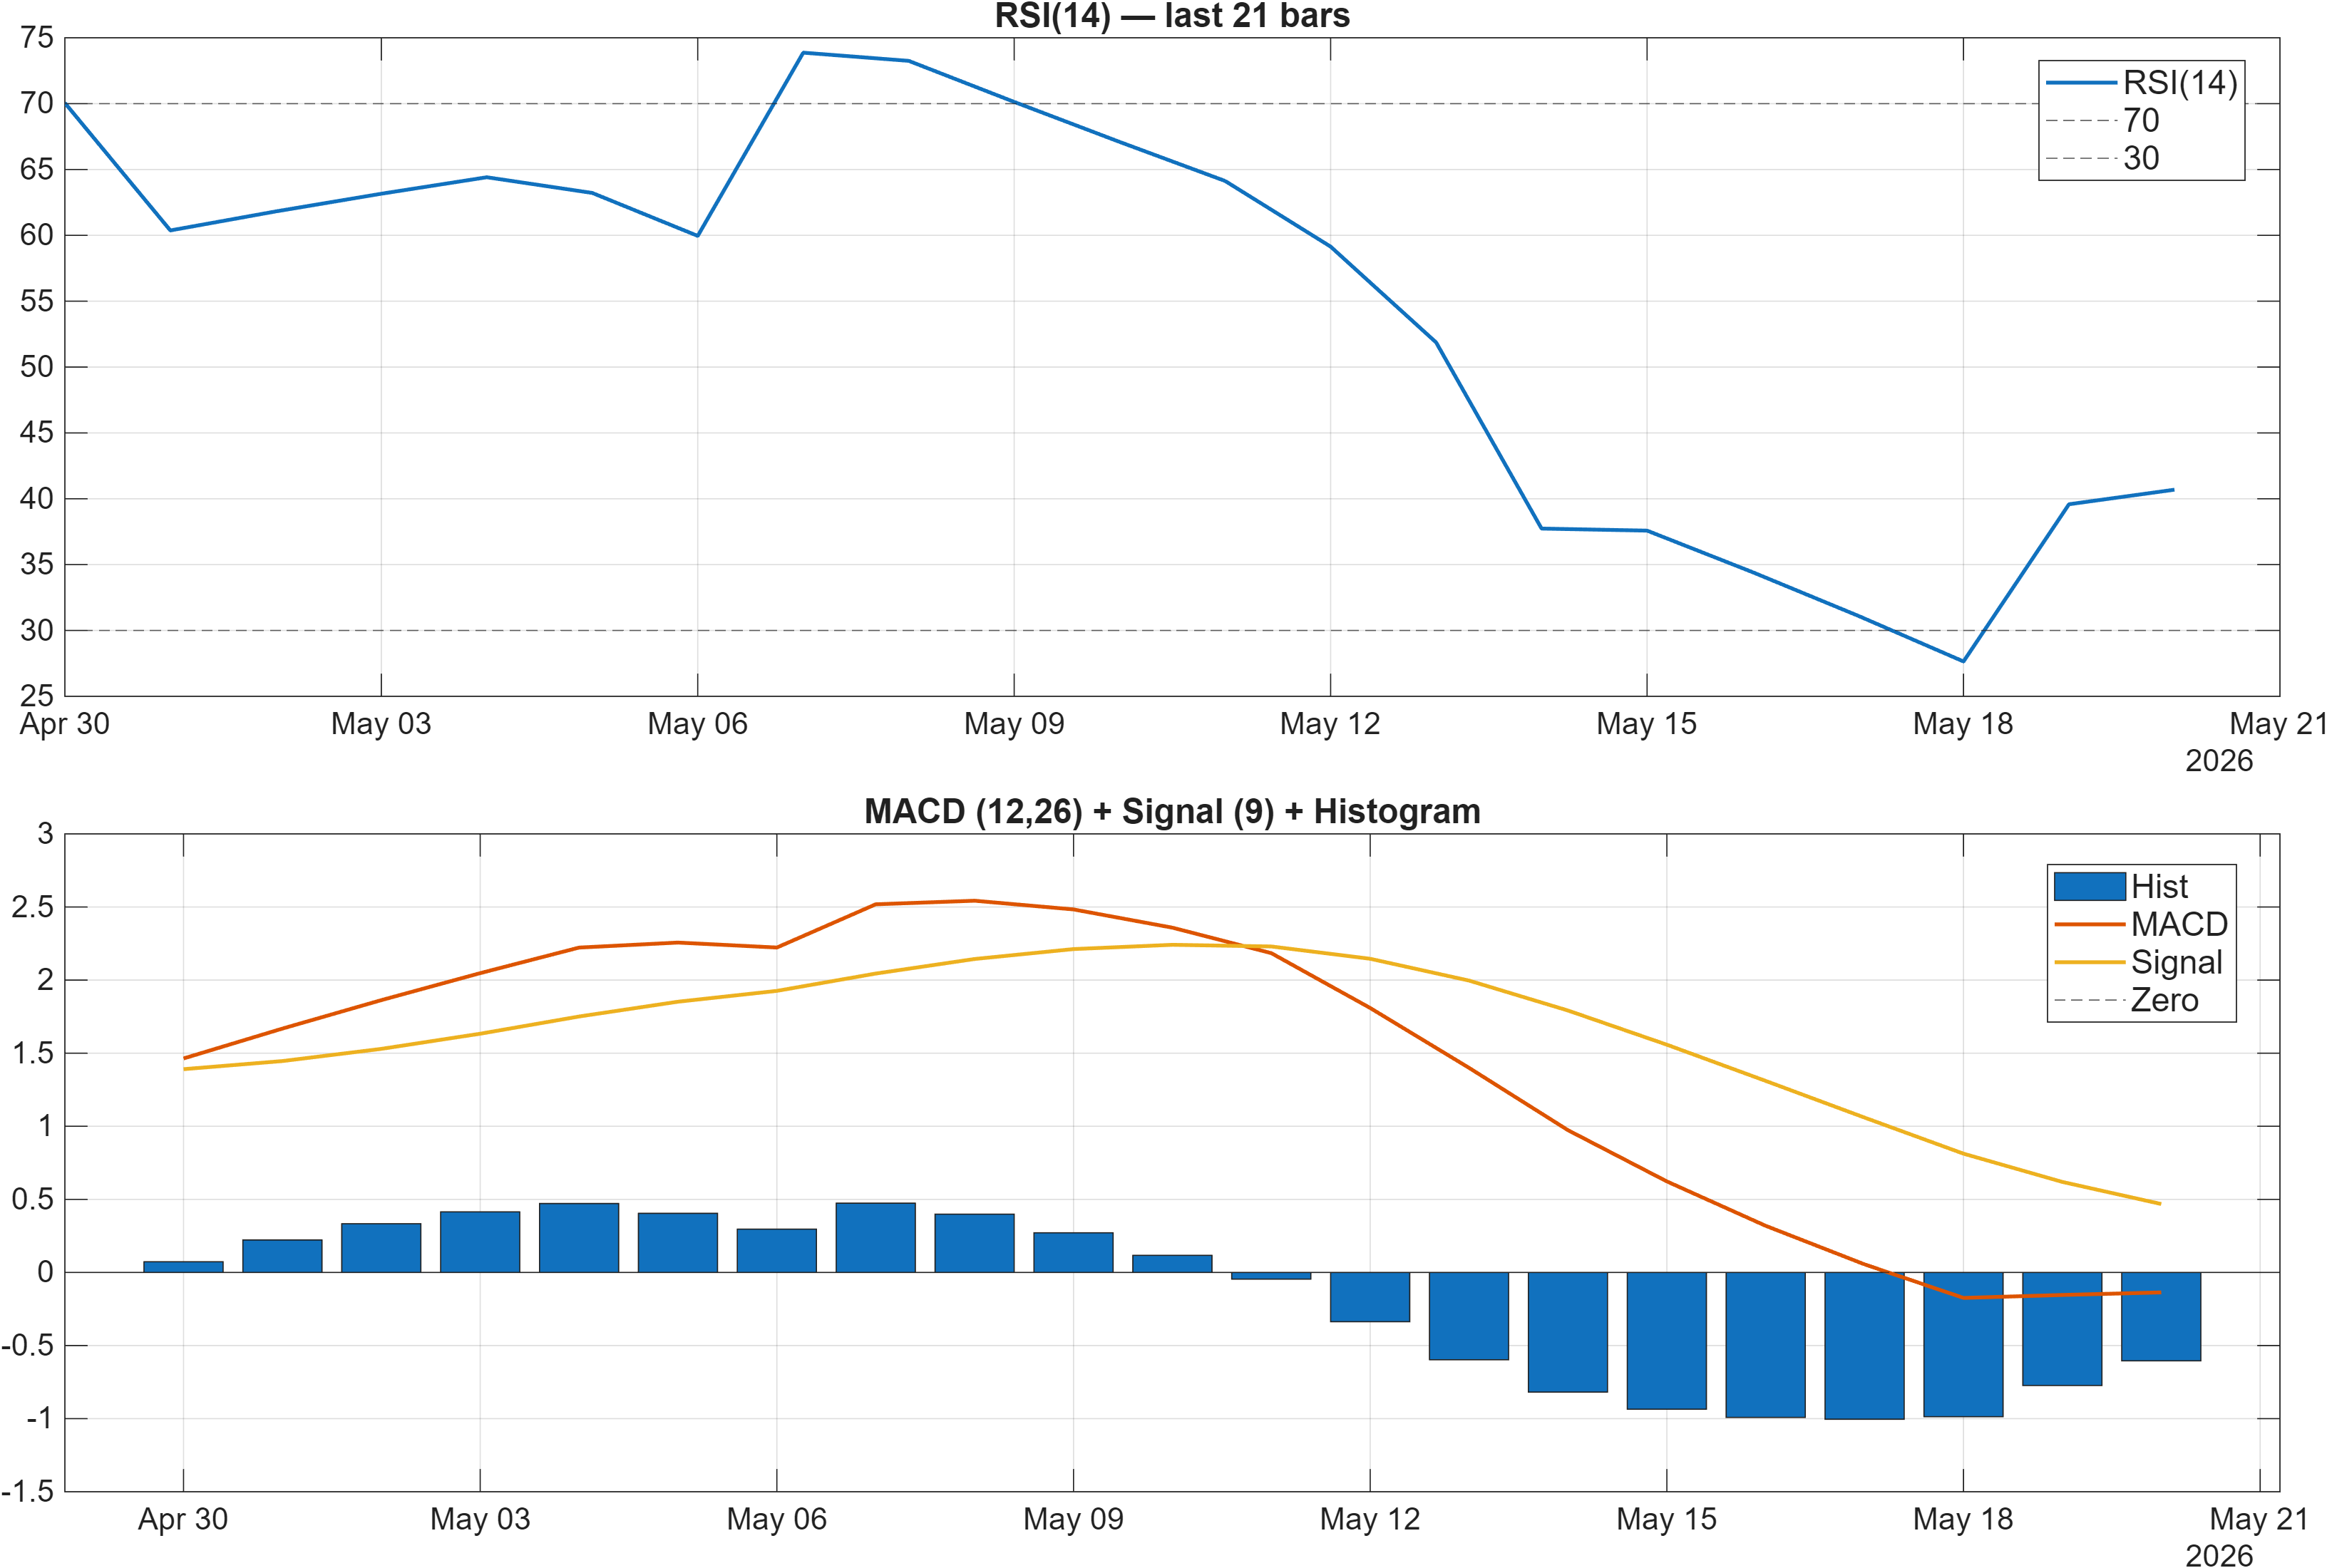
Momentum conditions lean defensive rather than expansionary. The MACD histogram at -0.6046 indicates negative momentum pressure is still present, consistent with a market that has not yet established upside acceleration. At the same time, the dashboard characterizes RSI bias as Neutral, while the signal table later tags RSI(14) at 40.69 as Bearish—a subtle but important nuance that points to momentum hovering near a threshold zone rather than firmly oversold or strongly trending.
In practice, RSI in the low-40s frequently corresponds to a market that struggles to sustain rallies without first reclaiming intermediate trend structure (often reflected by price regaining the MA50). If MACD remains negative while RSI fails to rotate higher, upside attempts can become mean-reverting bounces rather than trend continuation.
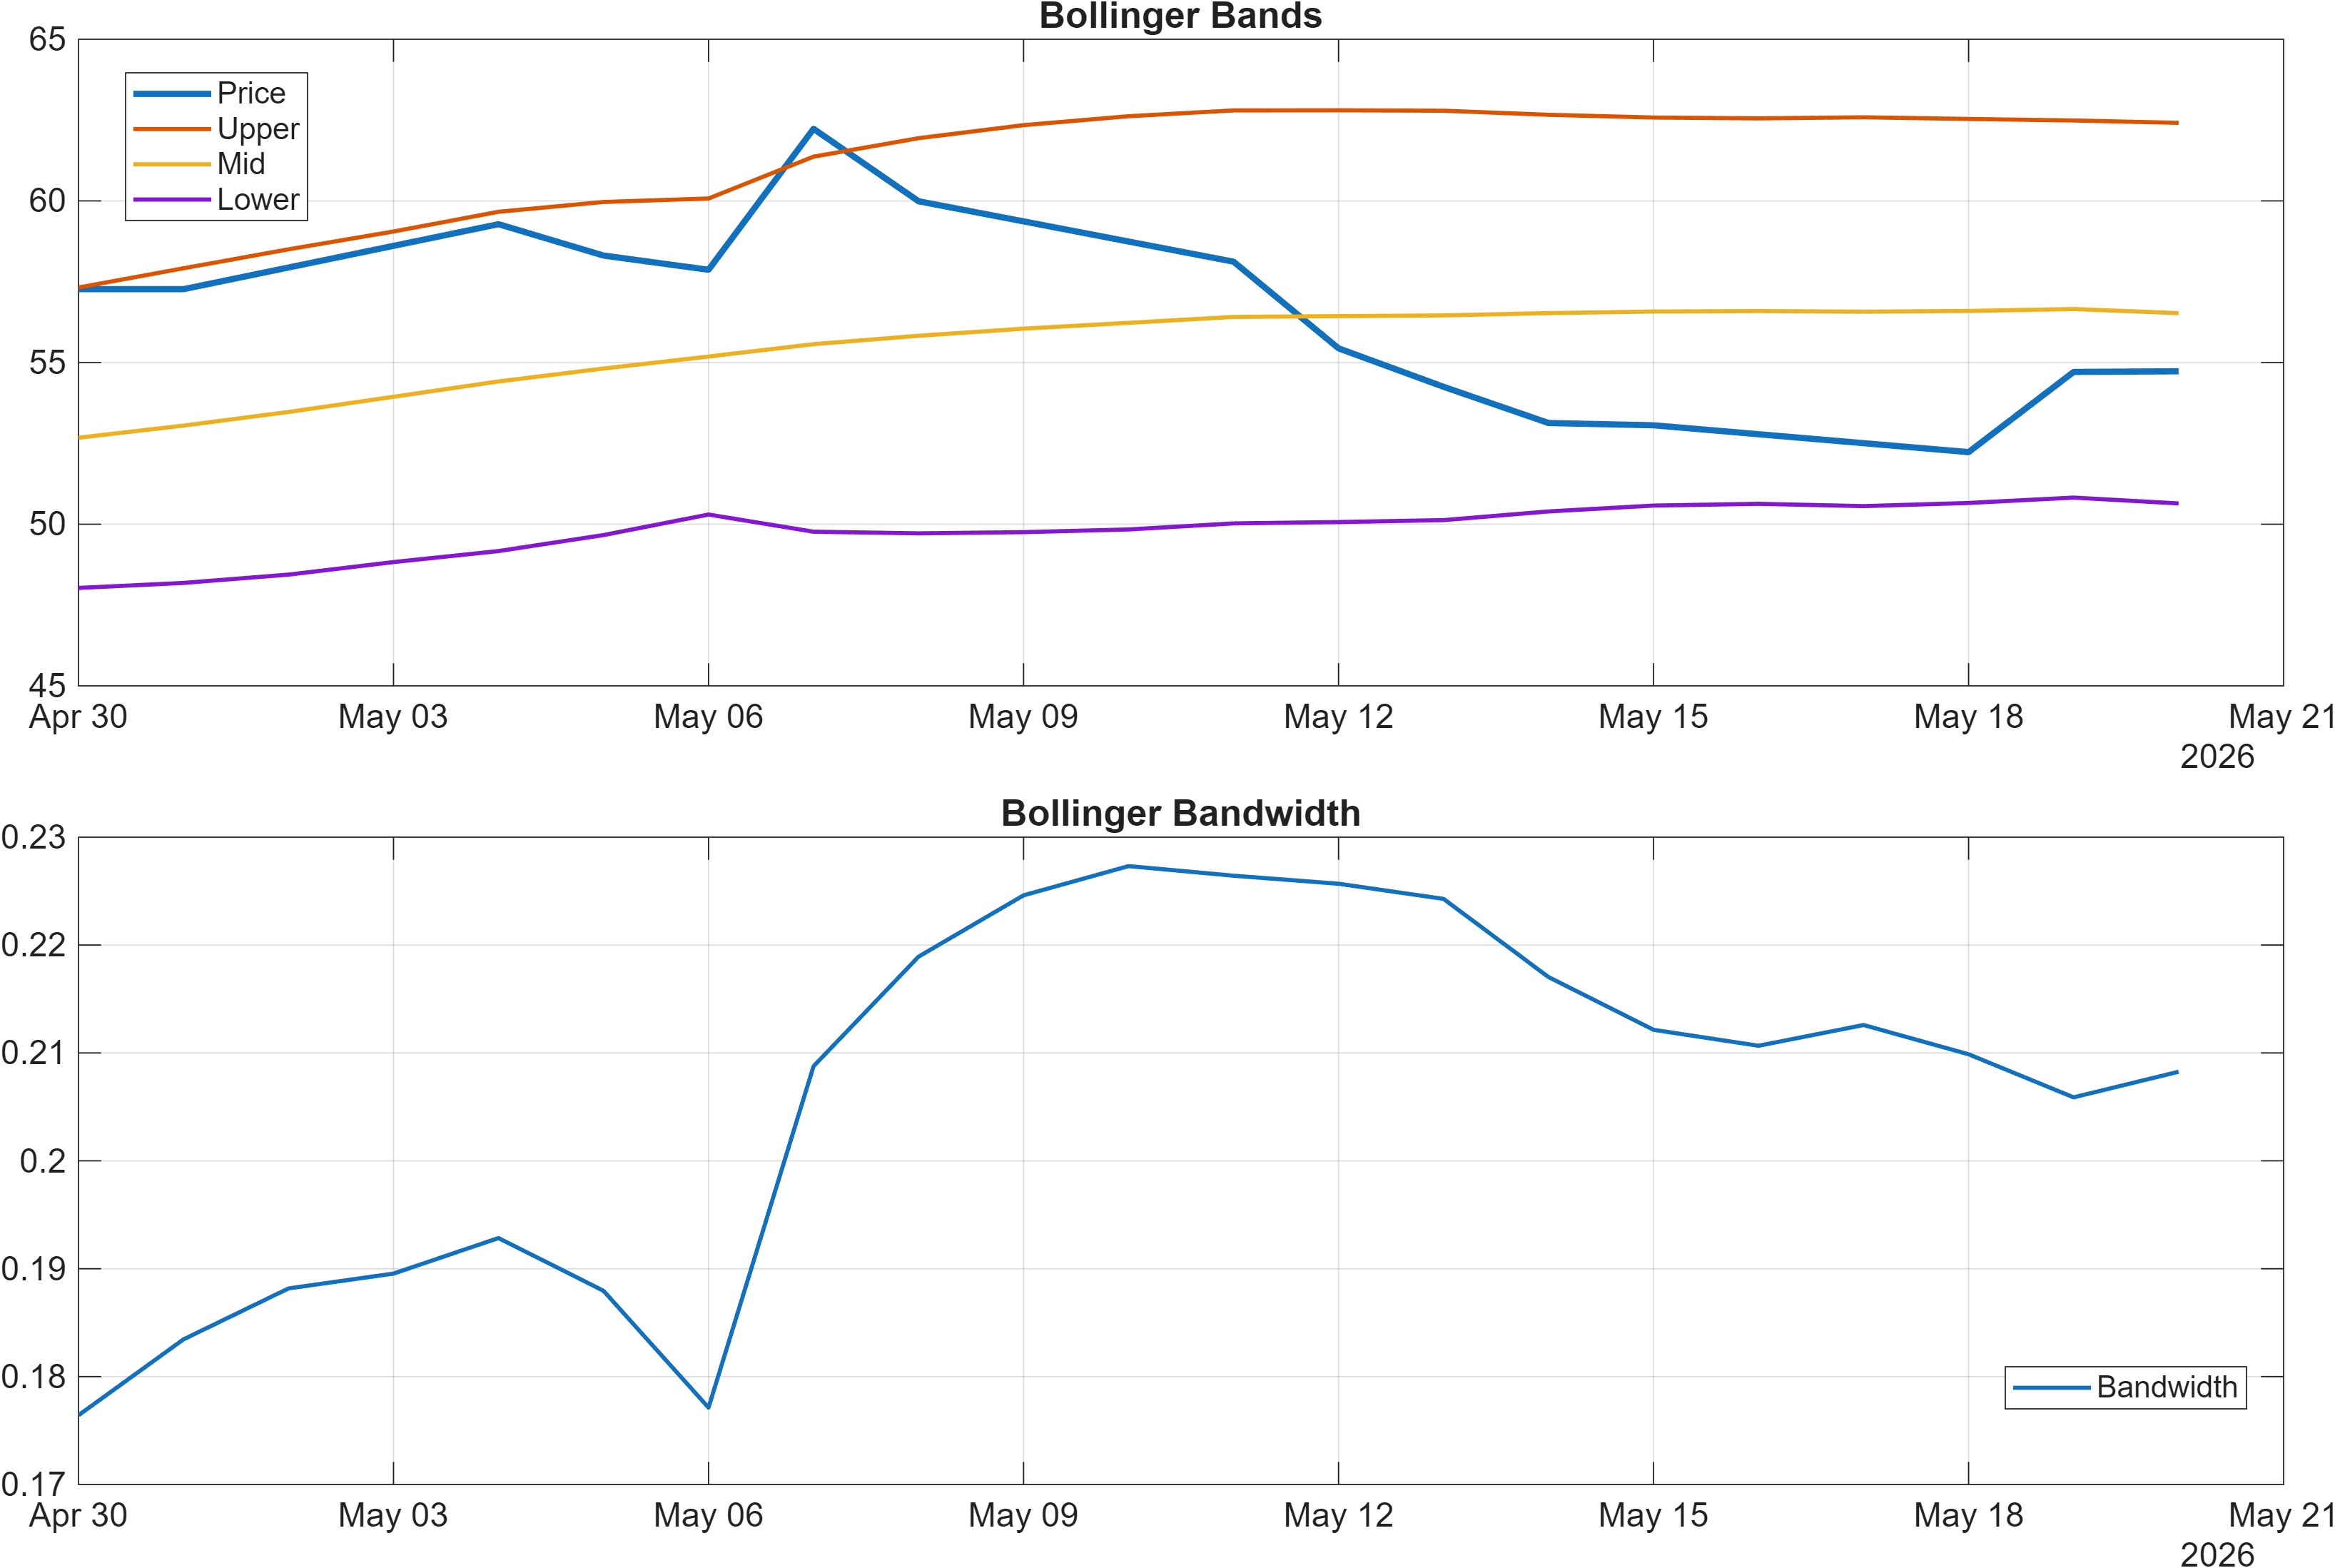
Volatility is not signaling a clear expansion phase yet. The latest Bollinger Bandwidth is 0.2083, which frames the current regime as relatively contained compared with more volatile trend legs. Compression can precede expansion, but the direction is typically resolved by level breaks and momentum confirmation. For BLKASHYAP, a constructive shift would be consistent with MACD histogram improving from -0.6046 while RSI lifts away from the low-40s zone, ideally alongside price reclaiming intermediate trend structure. Until those occur together, the dashboard reads as stabilization with incomplete momentum sponsorship.
Interpretation: RSI bias = Neutral, MACD hist = -0.6046.
Interpretation: Bandwidth (volatility regime) latest = 0.2083.
4) Support / Resistance zones
Support ~ 43.8100 | Resistance ~ 60.0900
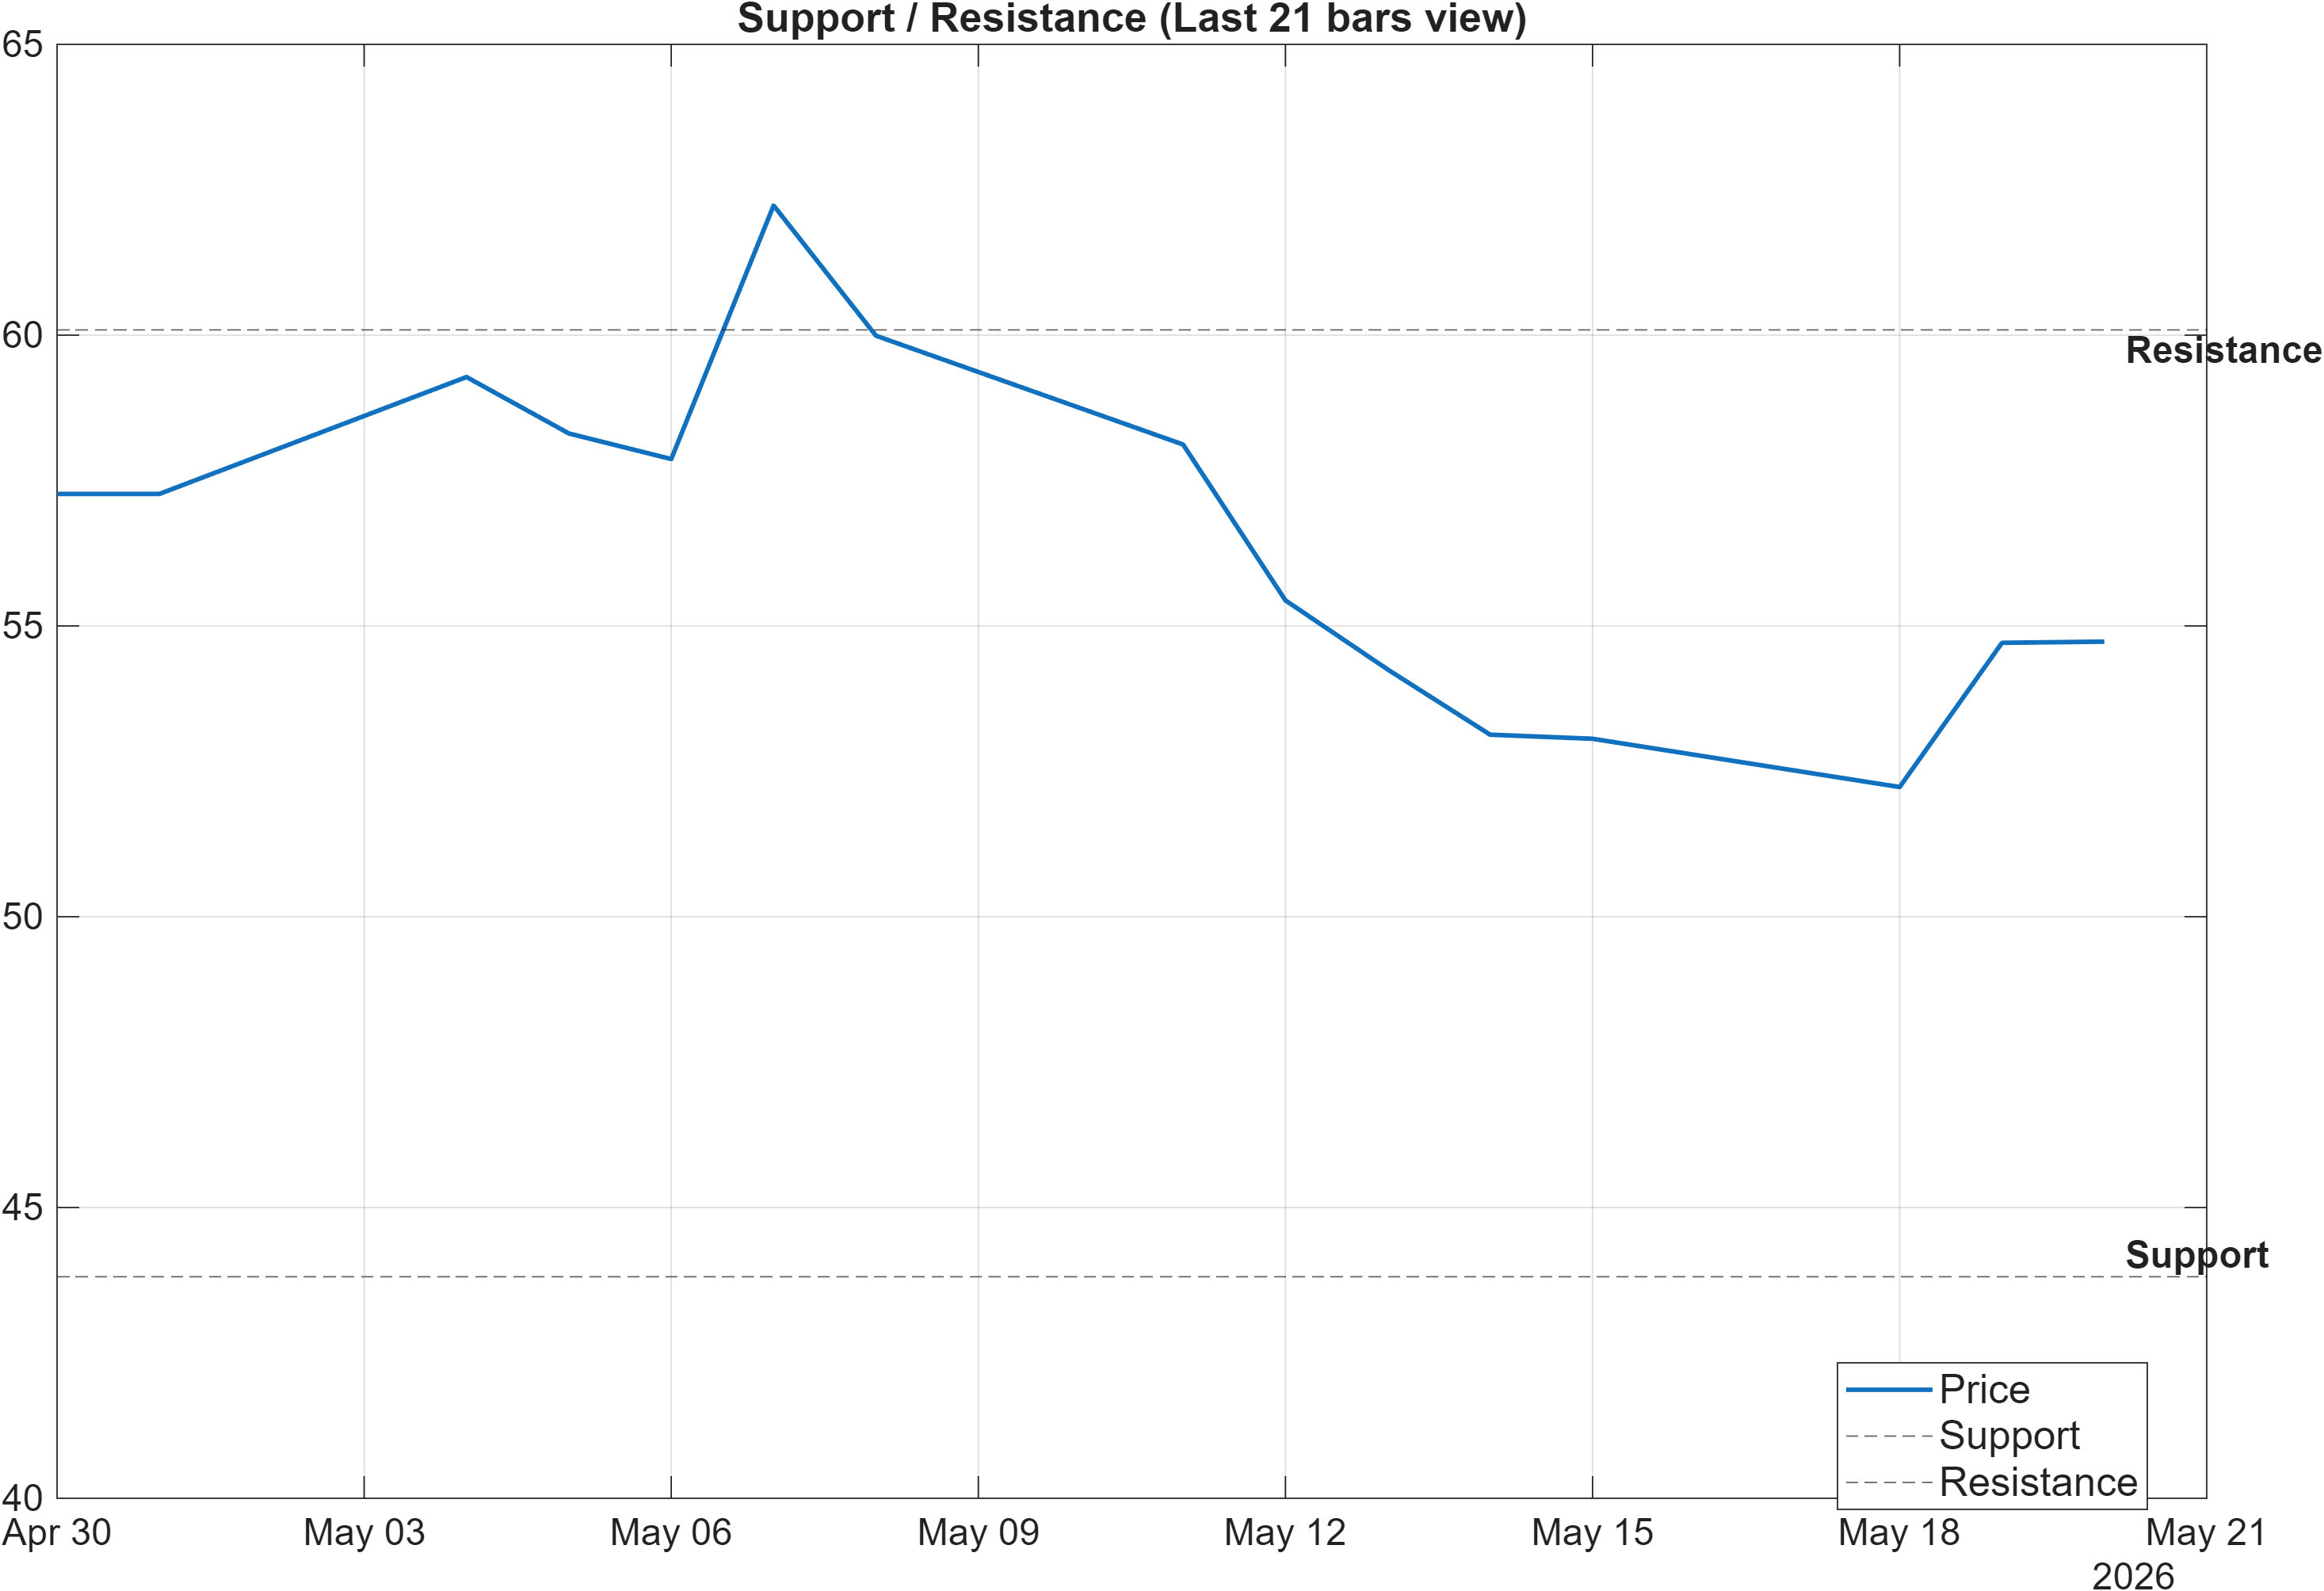
The level map is clean and therefore analytically useful: 43.8100 defines the nearest support decision zone and 60.0900 defines the resistance boundary that would meaningfully change the short-term narrative if cleared. With the trend picture split (price below MA50, yet MA50 above MA200), these zones function as regime tests rather than simple intraday markers.
A market trading below its MA50 often treats overhead resistance as an “inventory zone,” where prior buyers and short-term participants seek to exit on strength. As a result, the 60.0900 level is best read as a confirmation threshold: breaking above it with participation would help validate that the daily rank strength (#80) is being reinforced by broader market acceptance. Conversely, repeated failures below resistance can keep the instrument locked in mean-reversion, where momentum indicators (such as MACD histogram at -0.6046) remain capped.
On the downside, 43.8100 is the more critical “line in the sand” given the current mixed momentum posture. A close below support would increase the probability that the negative confluence readings (see Section 5) begin to dominate the blended view. Until price chooses a side, the highest-quality decisions typically come from observing how price behaves at these zones—speed of rejection, clustering, and whether volatility (bandwidth 0.2083) starts expanding into the break.
Scenario view: Break above resistance with volume → continuation. Close below support → signal deterioration risk.
5) Quant Technical Dashboard (18 Signals)
KGNAI AI Technical Analysis Score (Deep Reinforcement Learning): Rank #259 out of 1222 (Rank 1 represents the strongest technical positioning and a higher probability of favorable price behavior. As ranks increase toward the maximum, the probability of favorable outcomes weakens and bearish positioning becomes more dominant.) | Label: Neutral | Score: 0.576
18-Signal Technical Confluence Score: -0.444 (Bearish)
Overall Technical Score (18-signal confluence + DRL rank blend): -0.138 (Neutral)
Note: The blended score reflects signal strength weighted against broader AI technical ranking, which may temporarily diverge.
Blended technical score breakdown: -0.138 (Neutral | Bull 2 / Bear 10 / Neutral 6)
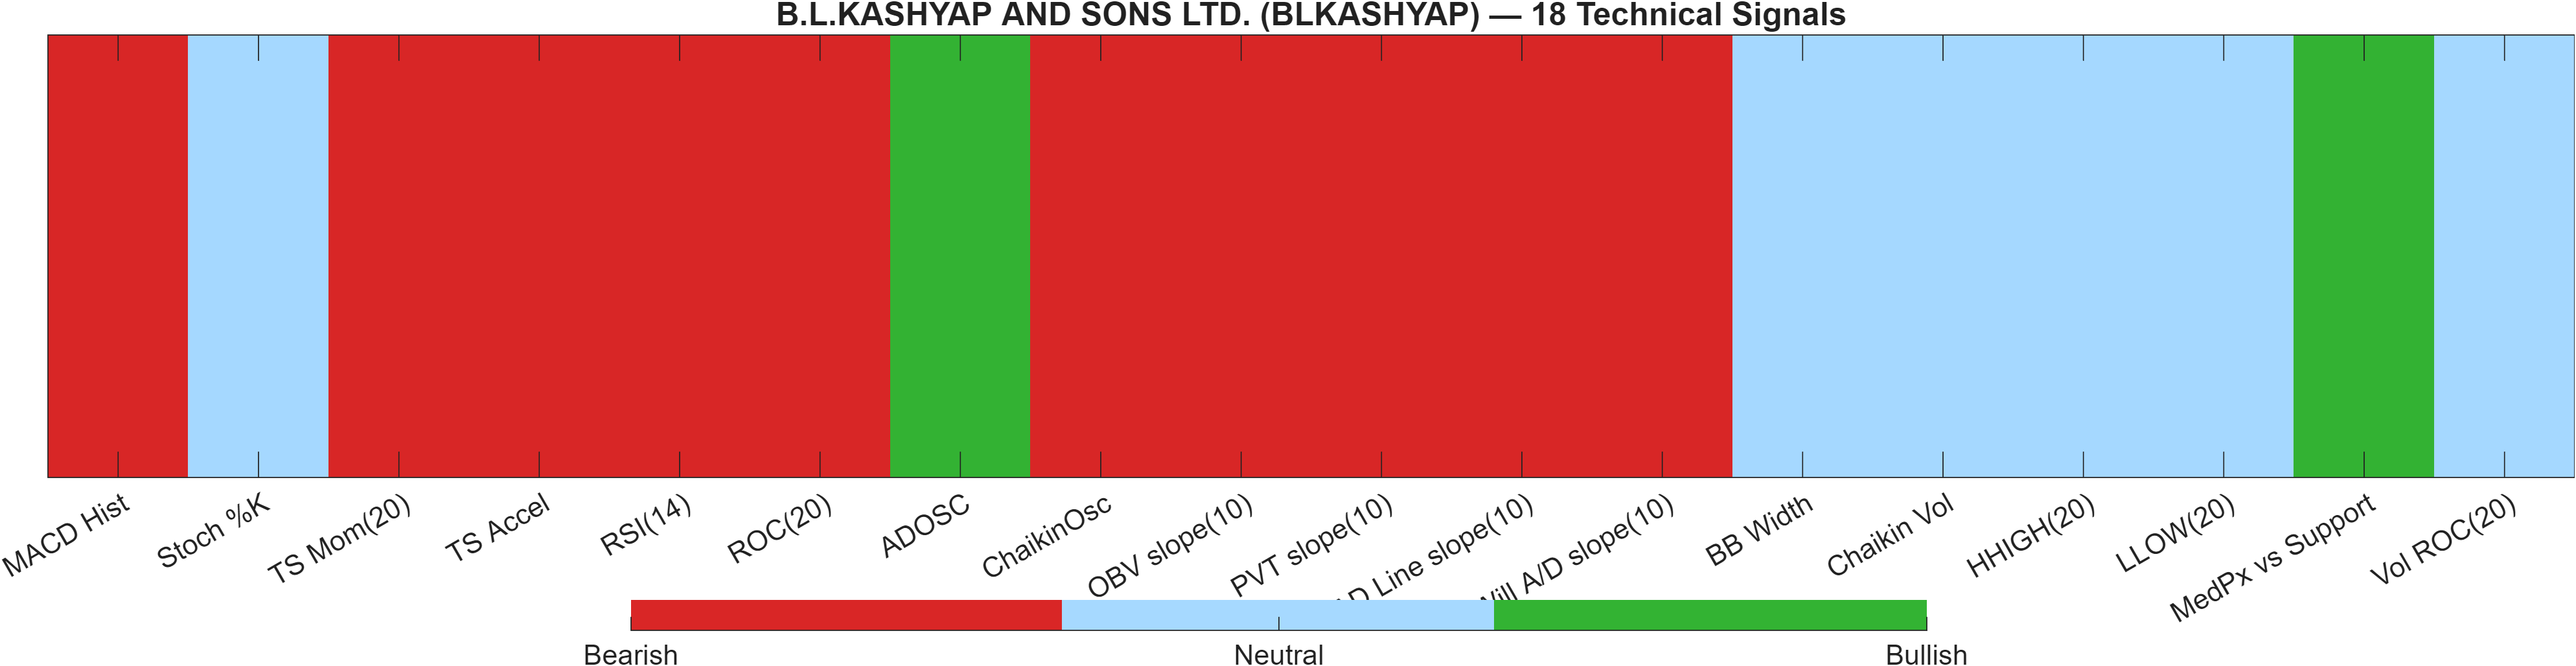
The technical stack is best described as internal weakness moderated by model context. The raw 18-signal layer is Bearish at -0.444, and the distribution (Bull 2 / Bear 10 / Neutral 6) indicates the median indicator is not yet supportive. However, the DRL technical rank is #259 of 1222 with a Neutral label and score 0.576, pulling the combined outcome to -0.138 (Neutral). This is a classic “blend divergence” state: the indicator layer is leaning risk-off, while the broader pattern-recognition layer sees sufficient stabilization to avoid a fully bearish classification.
A few indicator anchors clarify what is driving the bearish skew. Momentum and trend-pressure remain the core issue: MACD histogram -0.6046, TS Mom(20) -2.56, and ROC(20) -4.435 reflect negative impulse. Participation is also uneven: while ADOSC 83.39 is bullish, other flow/volume-derived slopes (for example, OBV slope(10) -1.761e+05) are bearish, implying that positive accumulation signals are not yet broad-based across measures.
For signal quality, the important question is whether the current bearish cluster is exhausting or persisting. If price holds above 43.8100 while momentum stops deteriorating (MACD histogram moving toward zero), the blended neutrality can remain stable. If support fails, the gap between “bearish confluence” and “neutral blend” tends to close in the bearish direction.
Signal table (Bull/Bear/Neutral)
| Indicator | Value | Signal |
|---|---|---|
| MACD Hist | -0.6046 | Bearish |
| Stoch %K | 36.94 | Neutral |
| TS Mom(20) | -2.56 | Bearish |
| TS Accel | -10.33 | Bearish |
| RSI(14) | 40.69 | Bearish |
| ROC(20) | -4.435 | Bearish |
| ADOSC | 83.39 | Bullish |
| ChaikinOsc | -7077 | Bearish |
| OBV slope(10) | -1.761e+05 | Bearish |
| PVT slope(10) | -3282 | Bearish |
| AD Line slope(10) | -7.697e+04 | Bearish |
| Will A/D slope(10) | -10.33 | Bearish |
| BB Width | 0.2083 | Neutral |
| Chaikin Vol | -7.754 | Neutral |
| HHIGH(20) | 62.5 | Neutral |
| LLOW(20) | 51.64 | Neutral |
| MedPx vs Support | 10.25 | Bullish |
| Vol ROC(20) | — | Neutral |
Interpretation: Indicator-level signals form the base confluence, which is then adjusted using a separate AI-driven technical ranking model. The final technical score summarizes this combined view.
6) News sentiment + extractive gist
Note: Instrument-specific news matches were not found, so the digest includes broader market/sector headlines. Links are provided for verification.
Sentiment score (avg): 0.096 | Positive: 37% | Neutral: 50% | Negative: 12%
KGNAI AI News Sentiment Score (normalized -1 to +1): Not available (as of —) | Label: Not available | Overall news score: 0.10
Positive Developments
Recent coverage across major financial outlets indicates a mildly constructive tone concentrated in pockets of the equity market rather than in a single, unified catalyst. Risk appetite appears selective: certain result-driven stories show strong price reactions, which is consistent with the sentiment split where positive items (37%) outnumber negative (12%). In parallel, parts of the global technology complex have shown attempts to rebound as investors reassess positioning, suggesting that macro-level risk-on/risk-off rotation remains active. For BLKASHYAP, this matters mainly as a background condition: when broader risk appetite is stable, it can support follow-through if the chart resolves above defined resistance. However, the technical dashboard still carries bearish internal signals (e.g., MACD histogram -0.6046), so any constructive news backdrop would need to coincide with price confirmation to become actionable within the model framework.
Neutral / Mixed Developments
The neutral share of coverage (50%) reflects a market that is still negotiating higher-rate sensitivity, policy uncertainty, and cross-asset rotations. Broader commentary emphasizes the interaction between inflation concerns, treasury yields, and equity positioning—conditions that can keep volatility episodic without delivering a clean trend. This environment often produces range-bound price behavior, which aligns with BLKASHYAP’s current technical mixture: longer-cycle moving-average structure retains some support (MA50 above MA200), yet price remains below MA50. With Bollinger Bandwidth at 0.2083, a contained volatility regime can persist until a catalyst or positioning shift triggers expansion.
Negative / Risk Signals
Risk framing remains present through references to short-term bearish equity tone, resistance-heavy index structure, and sensitivity to geopolitically driven commodity moves. Such conditions can tighten liquidity and shorten holding periods, particularly for names that have not fully reclaimed intermediate trend structure. For BLKASHYAP, the key risk is that a fragile momentum profile (including RSI(14) 40.69 and negative MACD histogram) can deteriorate quickly if the market fails to defend the nearby support zone. In a risk-off burst, breakdowns below well-defined levels tend to accelerate because participants anchor to those thresholds. That is why 43.8100 functions as more than a chart line—it is the level that separates “stabilizing despite bearish confluence” from “bearish confluence asserting control.”
- What to monitor next: Price behavior near 60.0900—does a break hold or reject?
- What to monitor next: Any volatility expansion from 0.2083 bandwidth alongside improving momentum (MACD histogram moving toward zero).
- What to monitor next: Whether 43.8100 is defended on closes during broader market risk-off sessions.
Snapshot: AI Rank (Short–Mid–Long): Neutral (Neutral–Neutral–Neutral) · Technical Confluence: Bearish · Key Levels: Support ~43.81 | Resistance ~60.09 · News Sentiment: Neutral
Sources referenced: Reuters, Bloomberg, Yahoo Finance, MarketWatch, Investing.com
7) Sources
- US stocks today: US stocks slip as inflation worries push Treasury yields higher — https://economictimes.indiatimes.com/markets/us-stocks/news/us-stocks-todayus-stocks-slip-as-inflation-worries-push-yields-higher/articleshow/131210865.cms
- RITES Q4 Results: Cons PAT slips 1.4% YoY to Rs 131 crore, revenue up 27% — https://economictimes.indiatimes.com/markets/stocks/earnings/rites-q4-results-cons-pat-slips-1-4-yoy-to-rs-131-crore-revenue-up-27/articleshow/131206028.cms
- US software stocks attempt a rebound as investors reassess AI risks — https://economictimes.indiatimes.com/markets/us-stocks/news/us-software-stocks-attempt-a-rebound-as-investors-reassess-ai-risks/articleshow/131205474.cms
- Ahead of Market: 10 things that will decide stock market action on Wednesday — https://economictimes.indiatimes.com/markets/stocks/news/ahead-of-market-10-things-that-will-decide-stock-market-action-on-wednesday/articleshow/131205396.cms
- NY Fed's Perli says rate control toolkit can navigate lower reserve demand — https://economictimes.indiatimes.com/markets/us-stocks/news/ny-feds-perli-says-rate-control-toolkit-can-navigate-lower-reserve-demand/articleshow/131205273.cms
- US SEC proposes broad changes to share registration, company reporting rules — https://economictimes.indiatimes.com/markets/us-stocks/news/us-sec-proposes-broad-changes-to-share-registration-company-reporting-rules/articleshow/131205219.cms
- Market Trading Guide: Tata Tech, Nazara Tech among 5 stock recommendations for Wednesday for gains up to 22% — https://economictimes.indiatimes.com/markets/stocks/news/market-trading-guide-tata-technazara-techamong-5-stock-recommendations-forwednesday-for-gains-up-to-22/slideshow/131205192.cms
- Nyse’s owner plans its own futures market for computing power — https://economictimes.indiatimes.com/markets/us-stocks/news/nyses-owner-plans-its-own-futures-market-for-computing-power/articleshow/131205028.cms
You may also like: How KGNAI AI ranks instruments across global markets
Disclaimer: KGNAI provides AI-generated analytics and educational market commentary only. This is not financial advice. Markets involve risk. Always do your own research.