
TECHM — Tech Mahindra Ltd. (22-May-2026) | Neutral setup with mixed timeframe ranks
Tech Mahindra Ltd. (TECHM) presents a largely neutral balance of evidence as of 22-May-2026, with a notable divergence between time horizons. Cross-sectional positioning is mixed: the weekly rank (#112 out of 1220) sits in the upper cohort, while the daily rank (#881 out of 1220) is weaker, consistent with a market that is not offering clean directional follow-through. The technical stack also points to a “two-sided” tape: the moving-average read is split (close vs MA50 bearish; MA50 vs MA200 bullish), and momentum indicators lean cautious despite a positive MACD histogram (1.8314). Volatility, as reflected by Bollinger Bandwidth (0.1073), suggests neither a compressed “spring” nor an expanded trend regime. With support ~1355.7083 and resistance ~1508.5750, TECHM appears range-framed; confirmation risk is concentrated around these decision zones.
Key Takeaways
- Short / Mid / Long rank stance: Neutral / Neutral / Neutral (weekly rank is the notable outlier: #112 bullish vs daily #881 neutral).
- Technical confluence: Neutral (18-signal confluence 0.111; overall technical score -0.082).
- Key levels: Support ~ 1355.7083 | Resistance ~ 1508.5750.
- News sentiment bias: Mildly constructive-to-neutral (avg sentiment 0.094; normalized score -0.01, labeled bullish; positives 25%, negatives 6%).
- Confirmation / invalidation: A sustained break above 1508.5750 with volume would strengthen continuation conditions; a close below 1355.7083 increases deterioration risk per the scenario framework.
What KGNAI Measures
KGNAI evaluates assets using large cross-sectional datasets built from millions of structured data points. Inputs incorporate fundamental metrics, technical structures, and systematically processed news sentiment. Statistical models, machine learning, and AI frameworks are used to assess relative positioning, signal alignment, and probabilistic behavior across broad universes.
How to Read This Report
- Ranks are comparative across the tracked universe, not absolute price targets.
- Confluence reflects alignment among independent signal groups.
- Support/resistance levels are probabilistic decision zones, not guarantees.
- Sentiment provides contextual bias within the broader analytical framework.
KGNAI Signal + Technical Snapshot + News Sentiment Digest
As of: 22-May-2026
Ticker: TECHM
1) KGNAI AI Analysis
Region: INDIA
Total universe size: 1220 ranked instruments
- Daily rank: #881 out of 1220 — Neutral
- Weekly rank: #112 out of 1220 — Bullish
- Monthly rank: #465 out of 1220 — Neutral
- 3-Monthly rank: #427 out of 1220 — Neutral
- 6-Monthly rank: #691 out of 1220 — Neutral
- Yearly rank: #739 out of 1220 — Neutral
The rank stack points to a timeframe divergence rather than a unified directional profile. The weekly rank (#112/1220) sits in the upper decile, but it is not reinforced by either the very near-term (daily #881/1220) or longer windows (yearly #739/1220, 6-monthly #691/1220). This pattern is consistent with episodic strength that has not translated into persistent multi-horizon leadership.
The densest cluster of “Neutral” labels across monthly and 3-monthly ranks (#465 and #427) implies that the asset is behaving more like a market-relative “middle” instrument than a sustained leader or laggard. From a market-structure perspective, that often corresponds to choppy mean-reverting flows, where short bursts of trend can appear (supporting a stronger weekly print) but fade without confirmation.
KGNAI’s stated term view is Neutral across short-, mid-, and long-term horizons, which aligns with the multi-window rank distribution: one bullish weekly observation is not enough to dominate the broader set. For positioning discipline, the practical implication is that conviction should be conditional: treat the stronger weekly reading as a candidate signal that requires validation from price structure, momentum, and level behavior rather than as a standalone “go” signal.
KGNAI ranks each instrument across large universes using multiple proprietary AI tests and statistical models (millions of data points). Lower ranks generally indicate stronger probability of favorable performance behavior, while higher ranks indicate weaker probability and more bearish positioning.
Term view: Short-term: Neutral. Mid-term: Neutral. Long-term: Neutral.
Want the full universe and complete rank tables? Unlock full access on KGNAI: https://www.kgnai.com/pricing
2) Price & trend overview
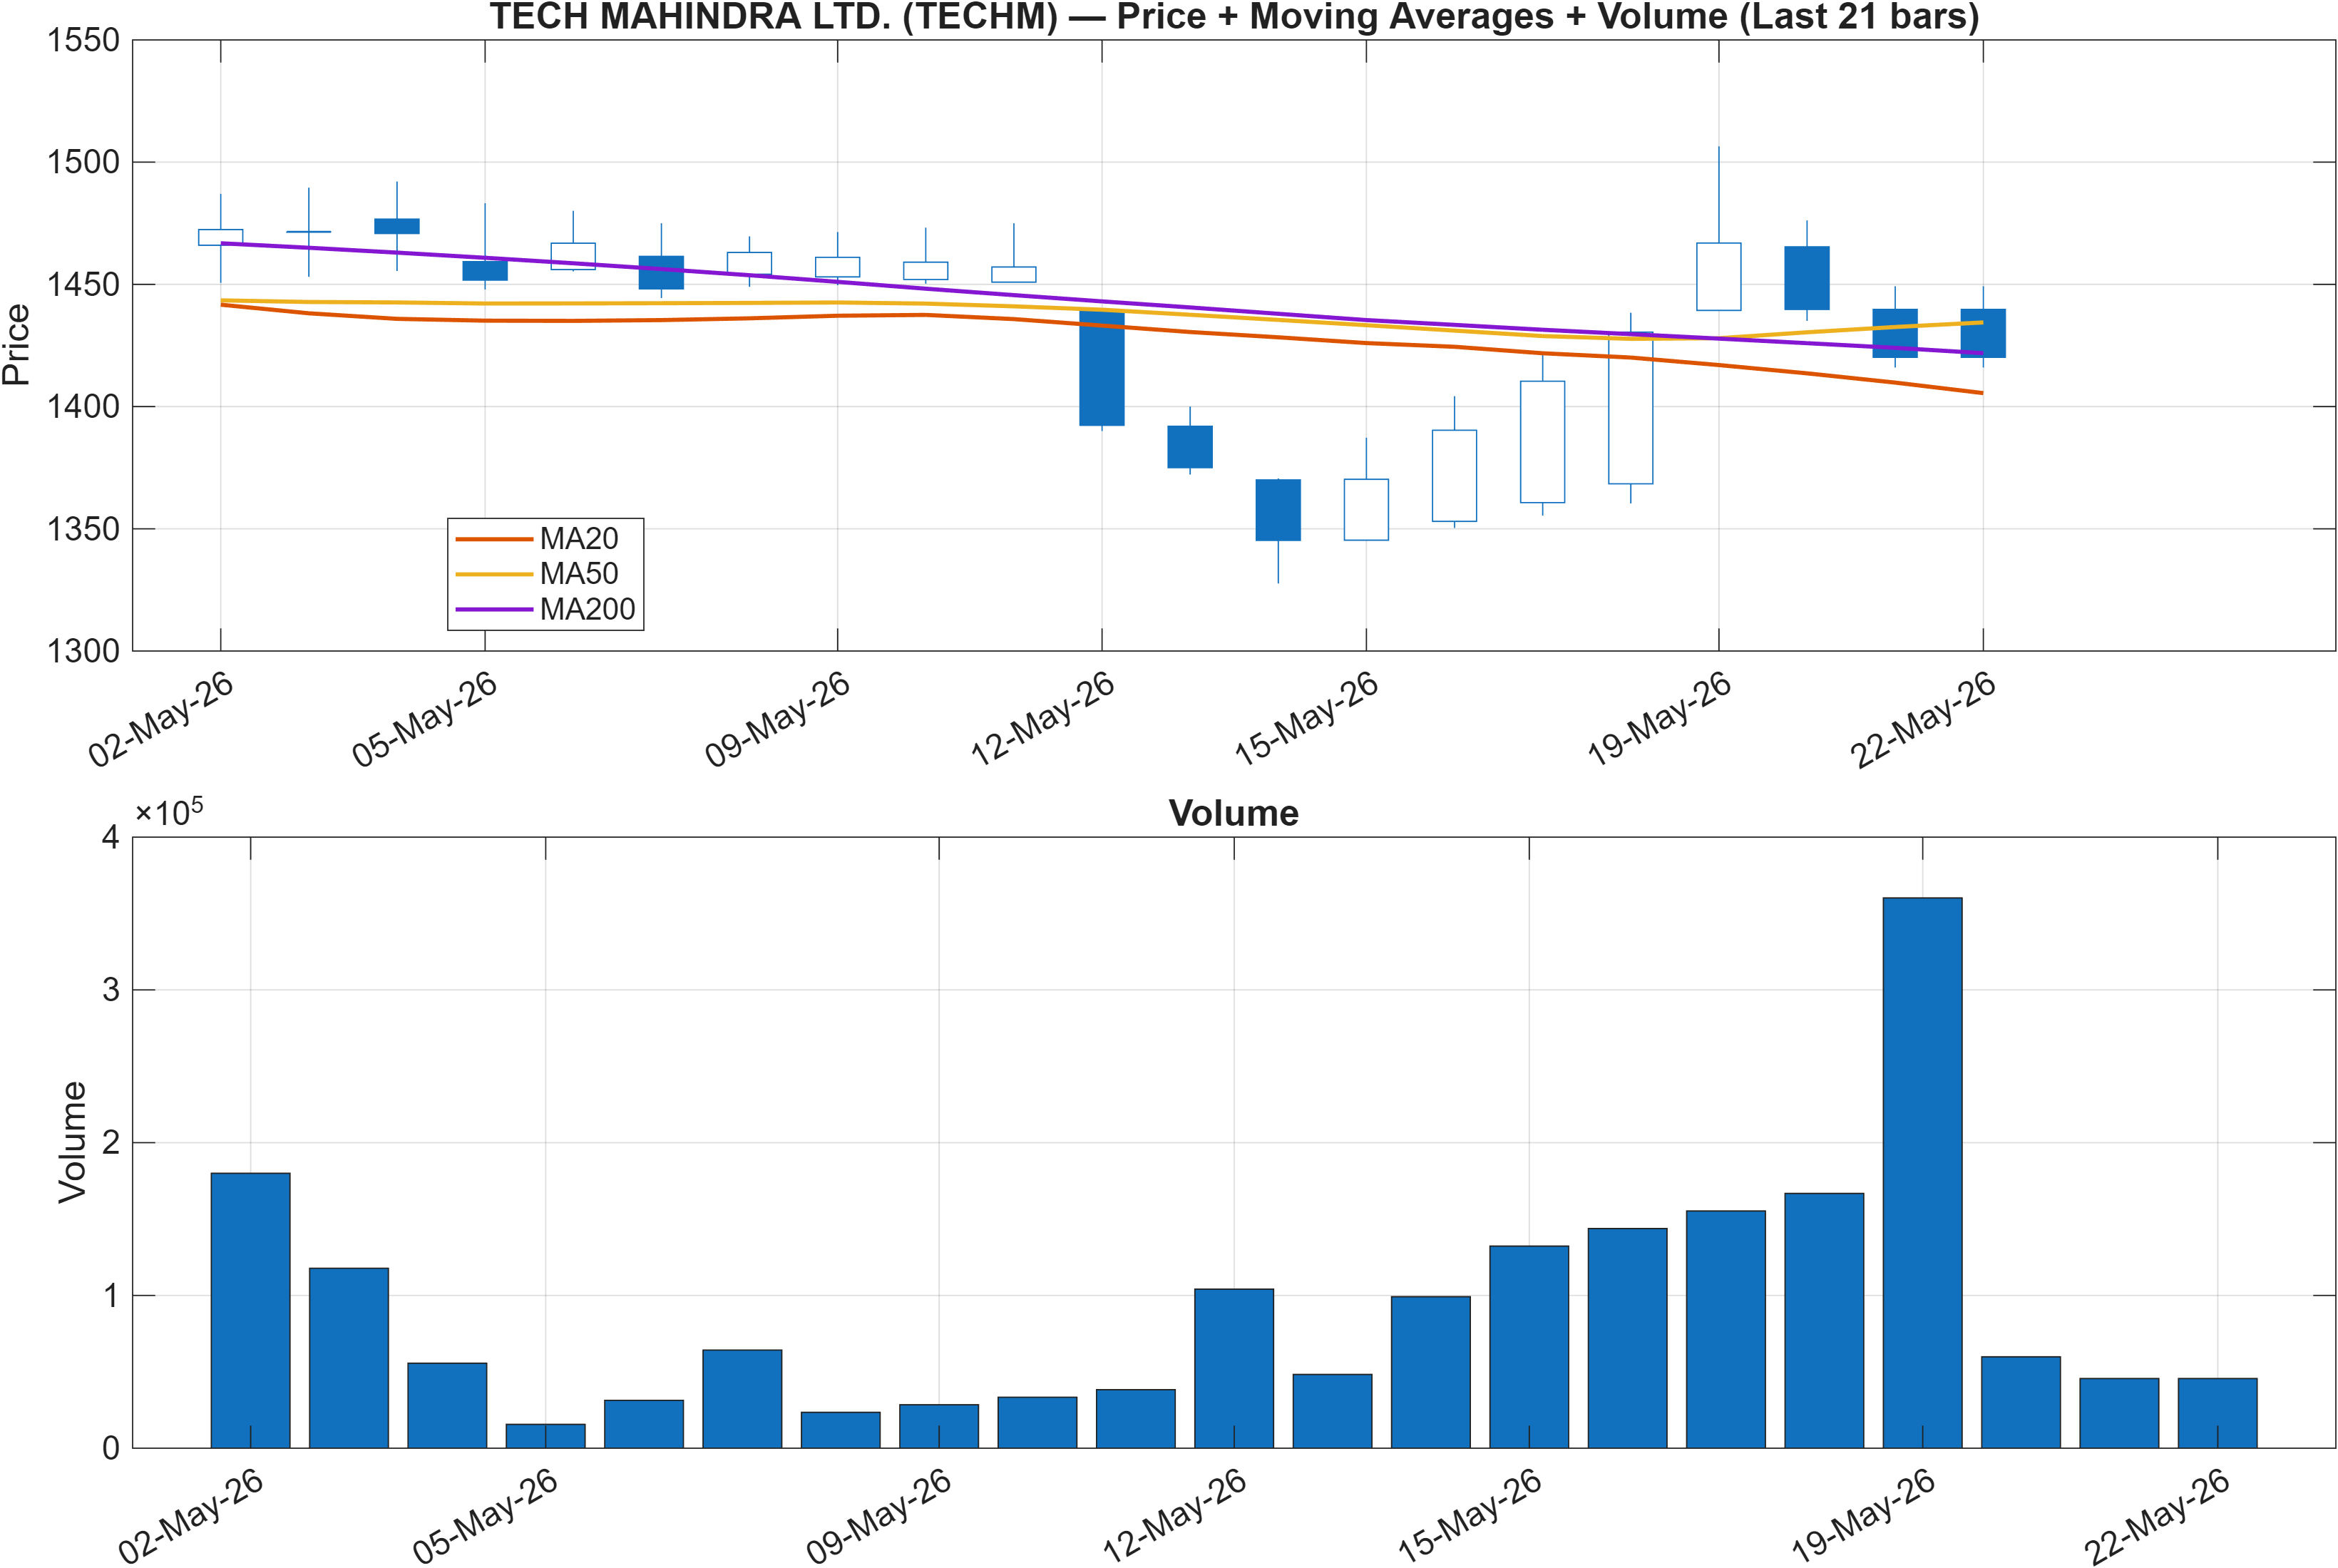
The moving-average structure is internally split, which typically maps to a transition or consolidation regime rather than a clean trend. The stated read—close vs MA50 = bearish while MA50 vs MA200 = bullish—suggests that the longer-term baseline remains constructive, but recent price action is trading with softer near-term tone relative to the intermediate trend filter.
When this alignment occurs, markets often oscillate between “dip buyers” defending the longer-term structure and “rally sellers” reacting to the failure to reclaim the MA50. That creates an environment where breakouts can struggle to sustain unless accompanied by renewed momentum confirmation. The cross-sectional ranks are consistent with this: a strong weekly rank (#112) can emerge during short bursts of relative strength, but the weaker daily rank (#881) indicates that immediate follow-through may be uneven.
This also frames the importance of price behavior around the published decision zones. With support ~1355.7083 and resistance ~1508.5750, the market is effectively defining a corridor where trend signals can flip quickly. In this context, trend assessment should be conditional: strength becomes more credible if price can transition from “below MA50” behavior toward sustained acceptance above intermediate references, while weakness becomes more concerning if the market begins to respect the underside of former support and fails to recover quickly.
Absent that resolution, the most robust interpretation is regime ambiguity: longer-term structure is not outright bearish, but the near-term tape is not consistently rewarding directional exposure.
3) Momentum & volatility dashboard
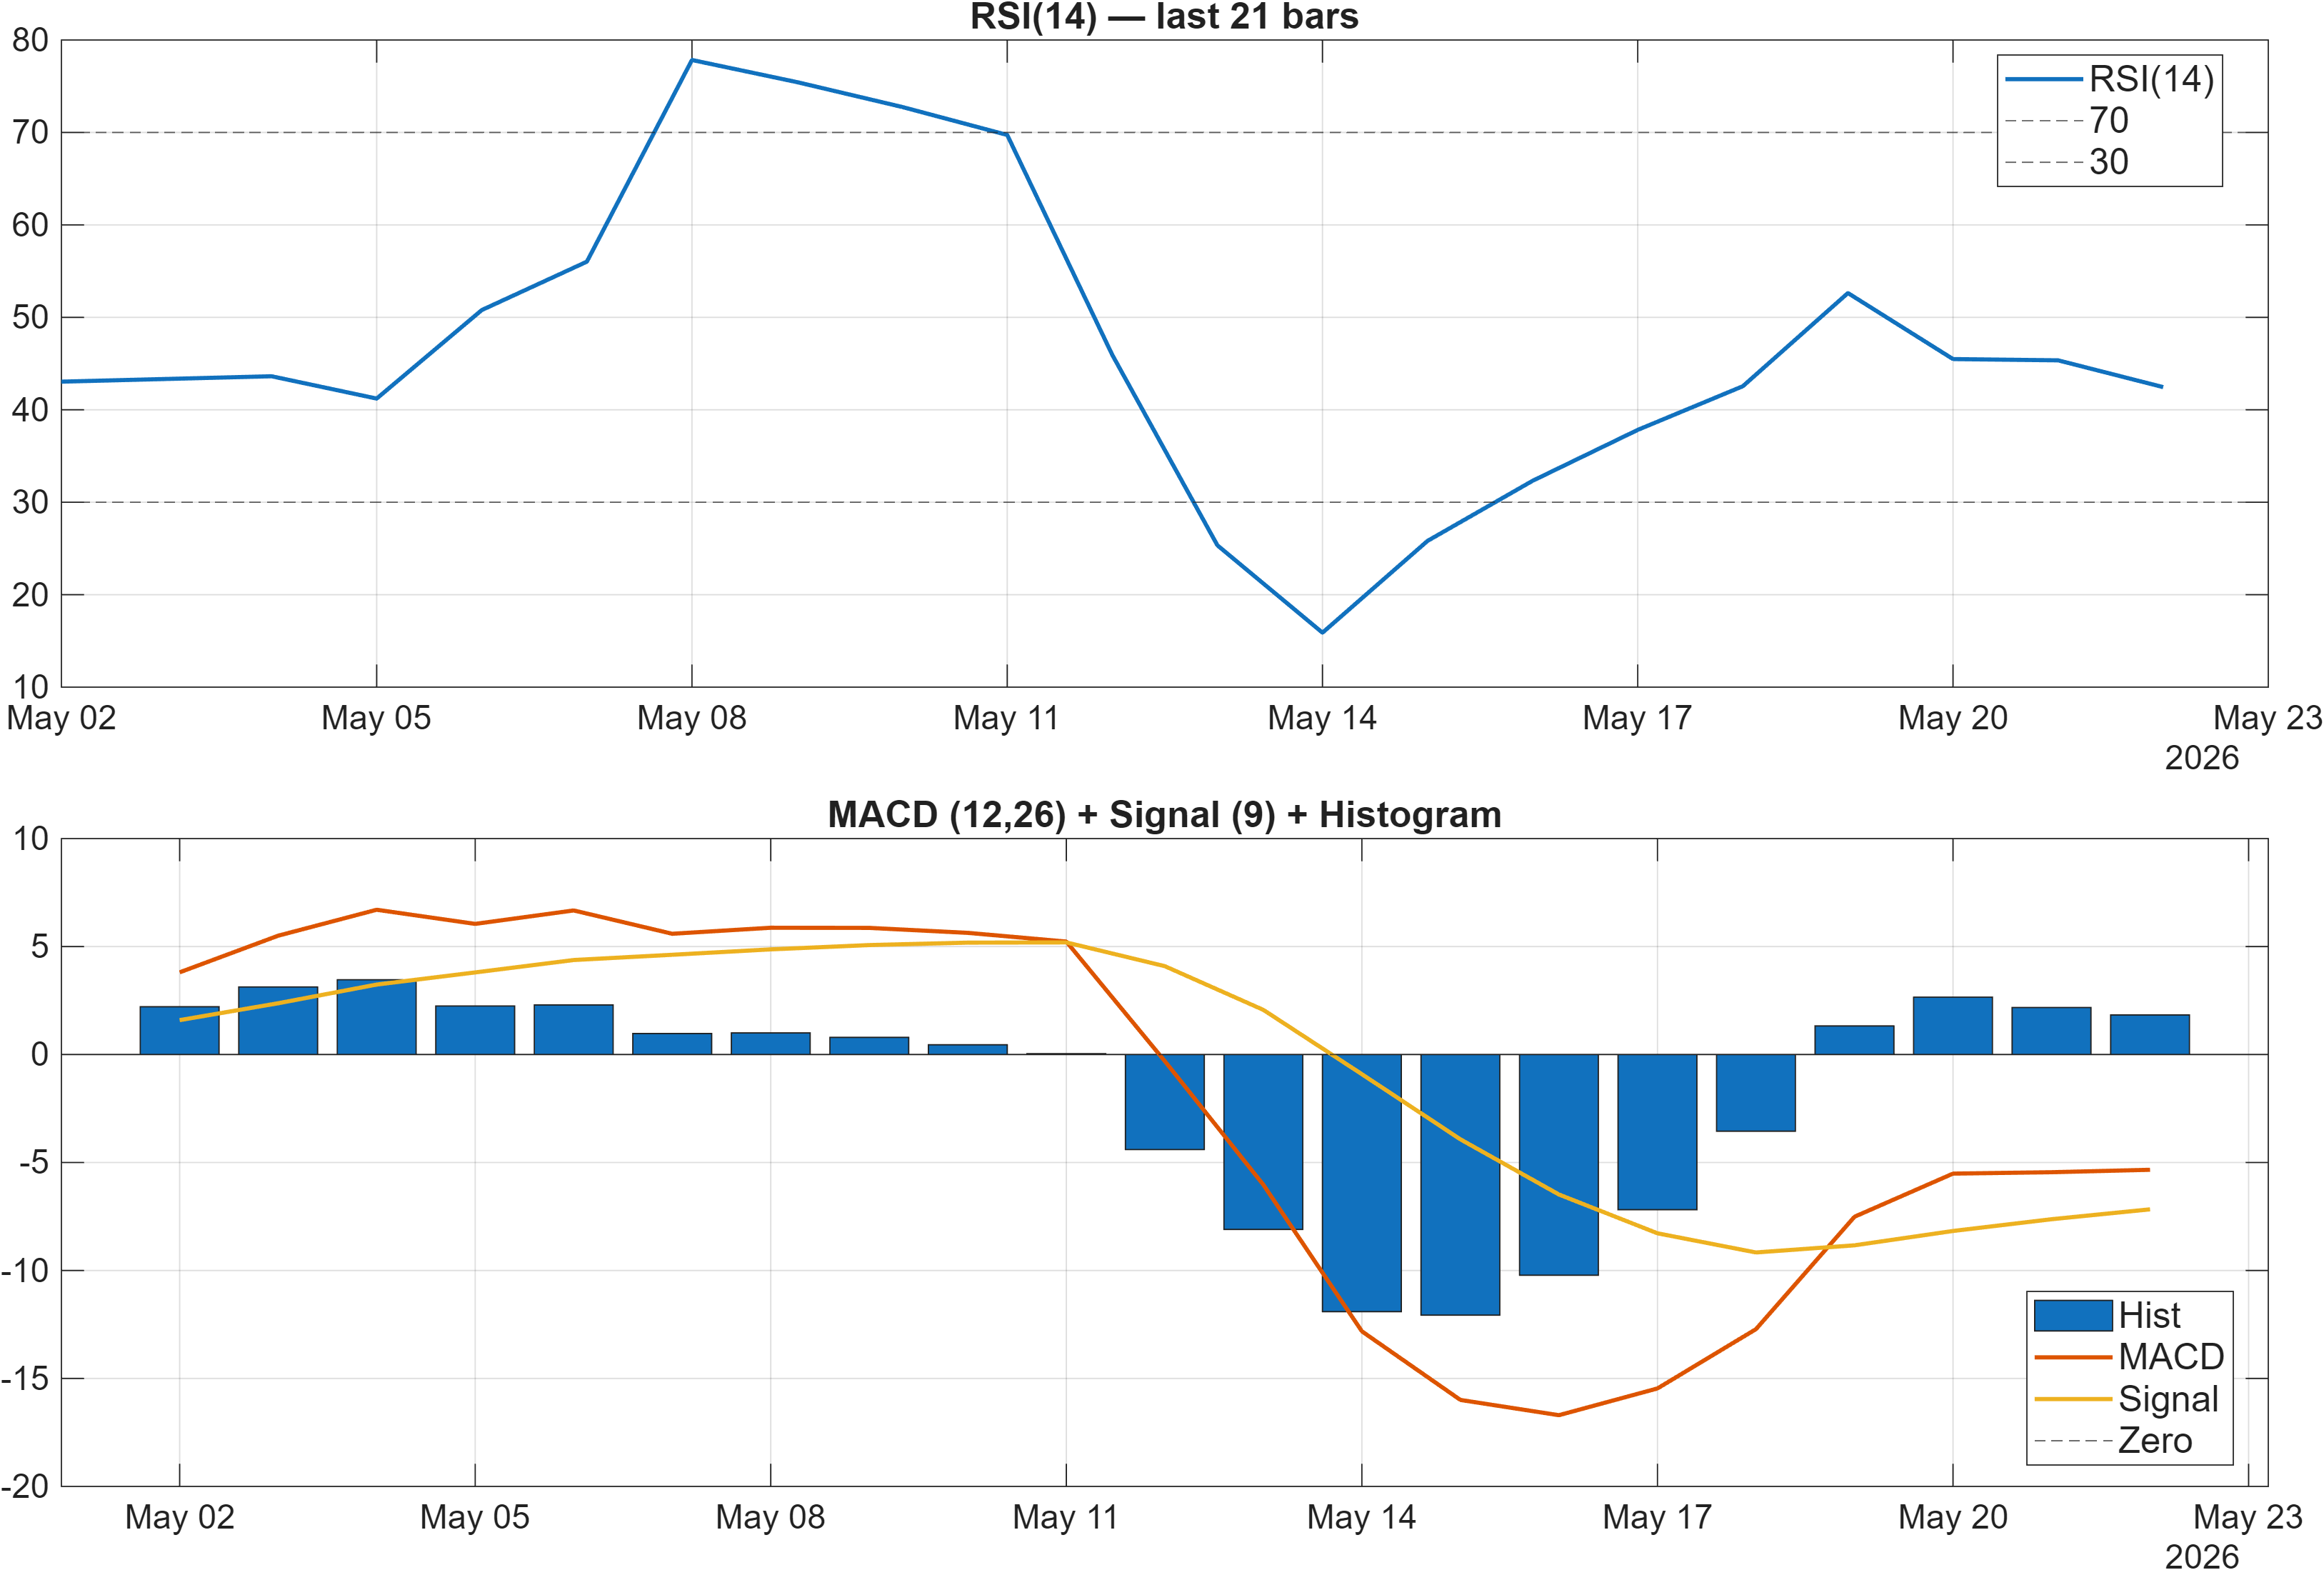
Momentum signals lean mixed-to-cautious rather than trend-confirming. RSI is characterized as neutral at the dashboard level, but the signal table records RSI(14) = 42.45 as Bearish, which is consistent with subdued upside momentum. At the same time, the MACD histogram is positive (1.8314) and is labeled Bullish, implying that downside momentum may be stabilizing even if it has not transitioned into persistent strength.
The “rate-of-change” family tilts defensive: ROC(20) = -3.521 is bearish, and both TS Mom(20) = -51.46 and TS Accel = -63.38 are bearish. This combination often aligns with a market that is attempting to base but remains vulnerable to renewed selling if resistance is approached without broader participation.
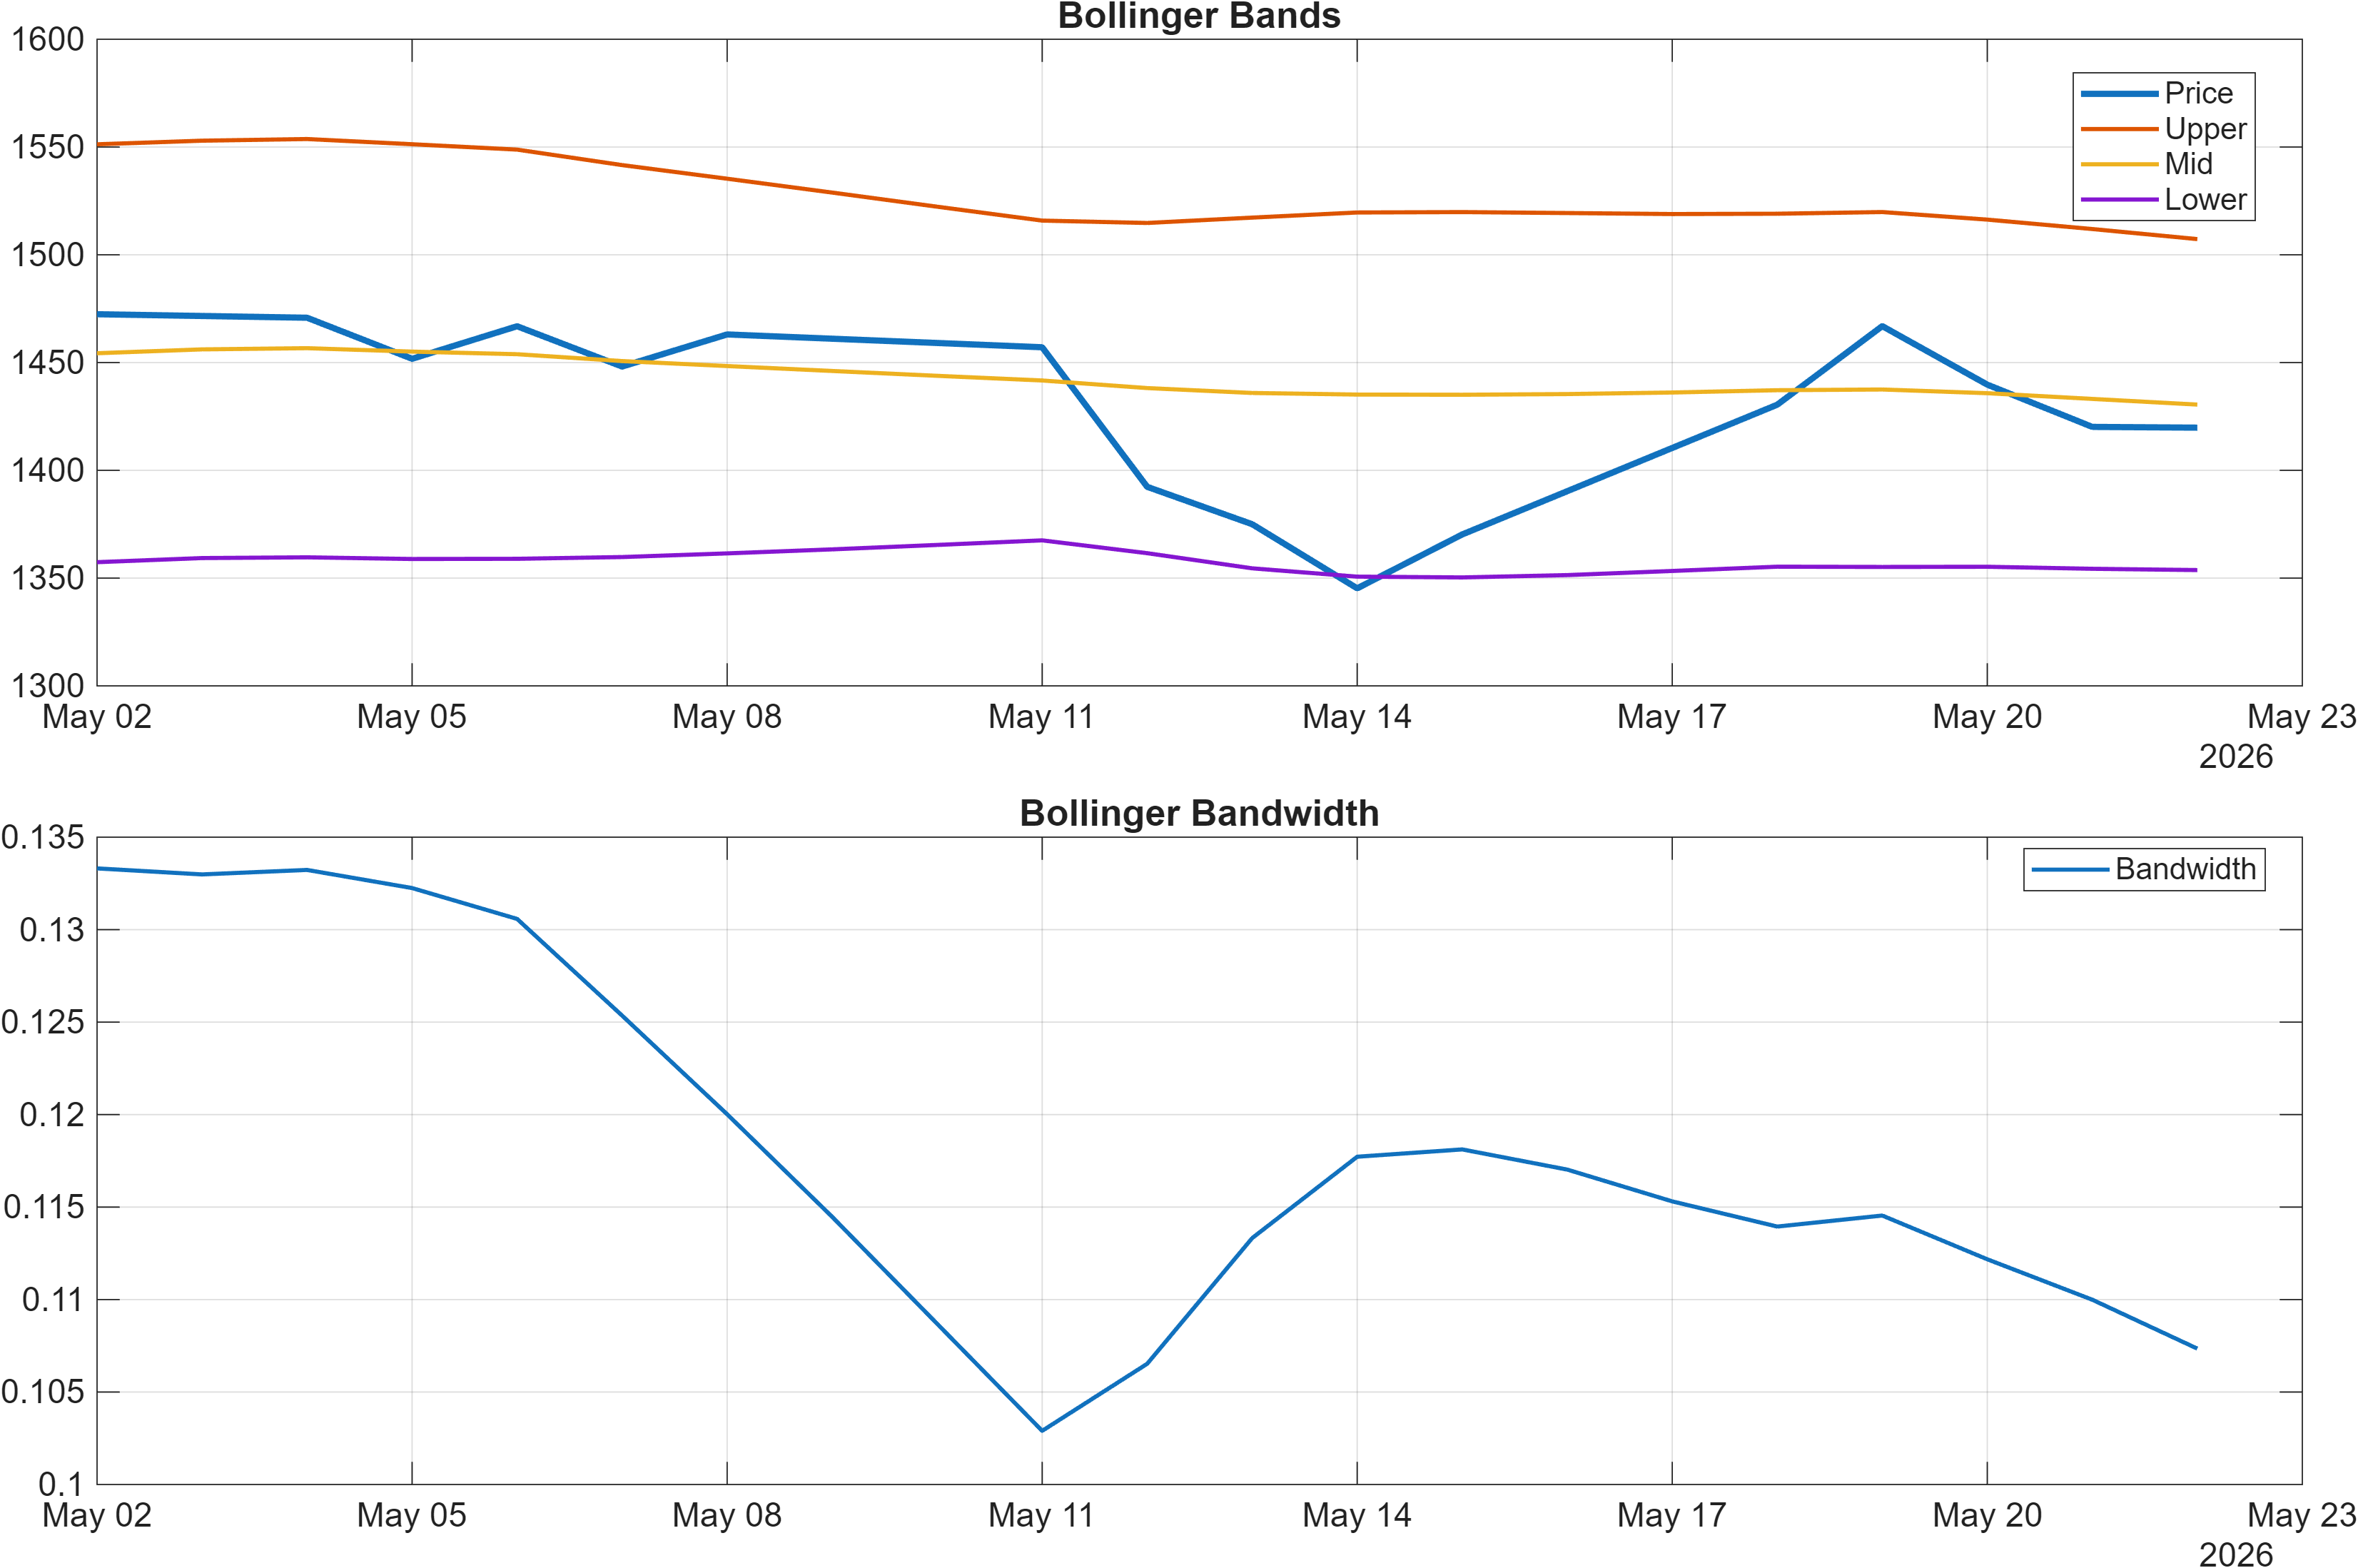
Volatility is not signaling an extreme regime shift. Bollinger Bandwidth = 0.1073 is labeled neutral, which typically corresponds to a market where breakouts require additional catalysts (flow + momentum alignment) rather than being volatility-driven. In practical signal terms, a positive MACD histogram without supportive RSI/ROC confirmation often resolves into either a slow grind higher (if resistance breaks) or a failed recovery attempt (if sellers defend key levels).
4) Support / Resistance zones
Support ~ 1355.7083 | Resistance ~ 1508.5750
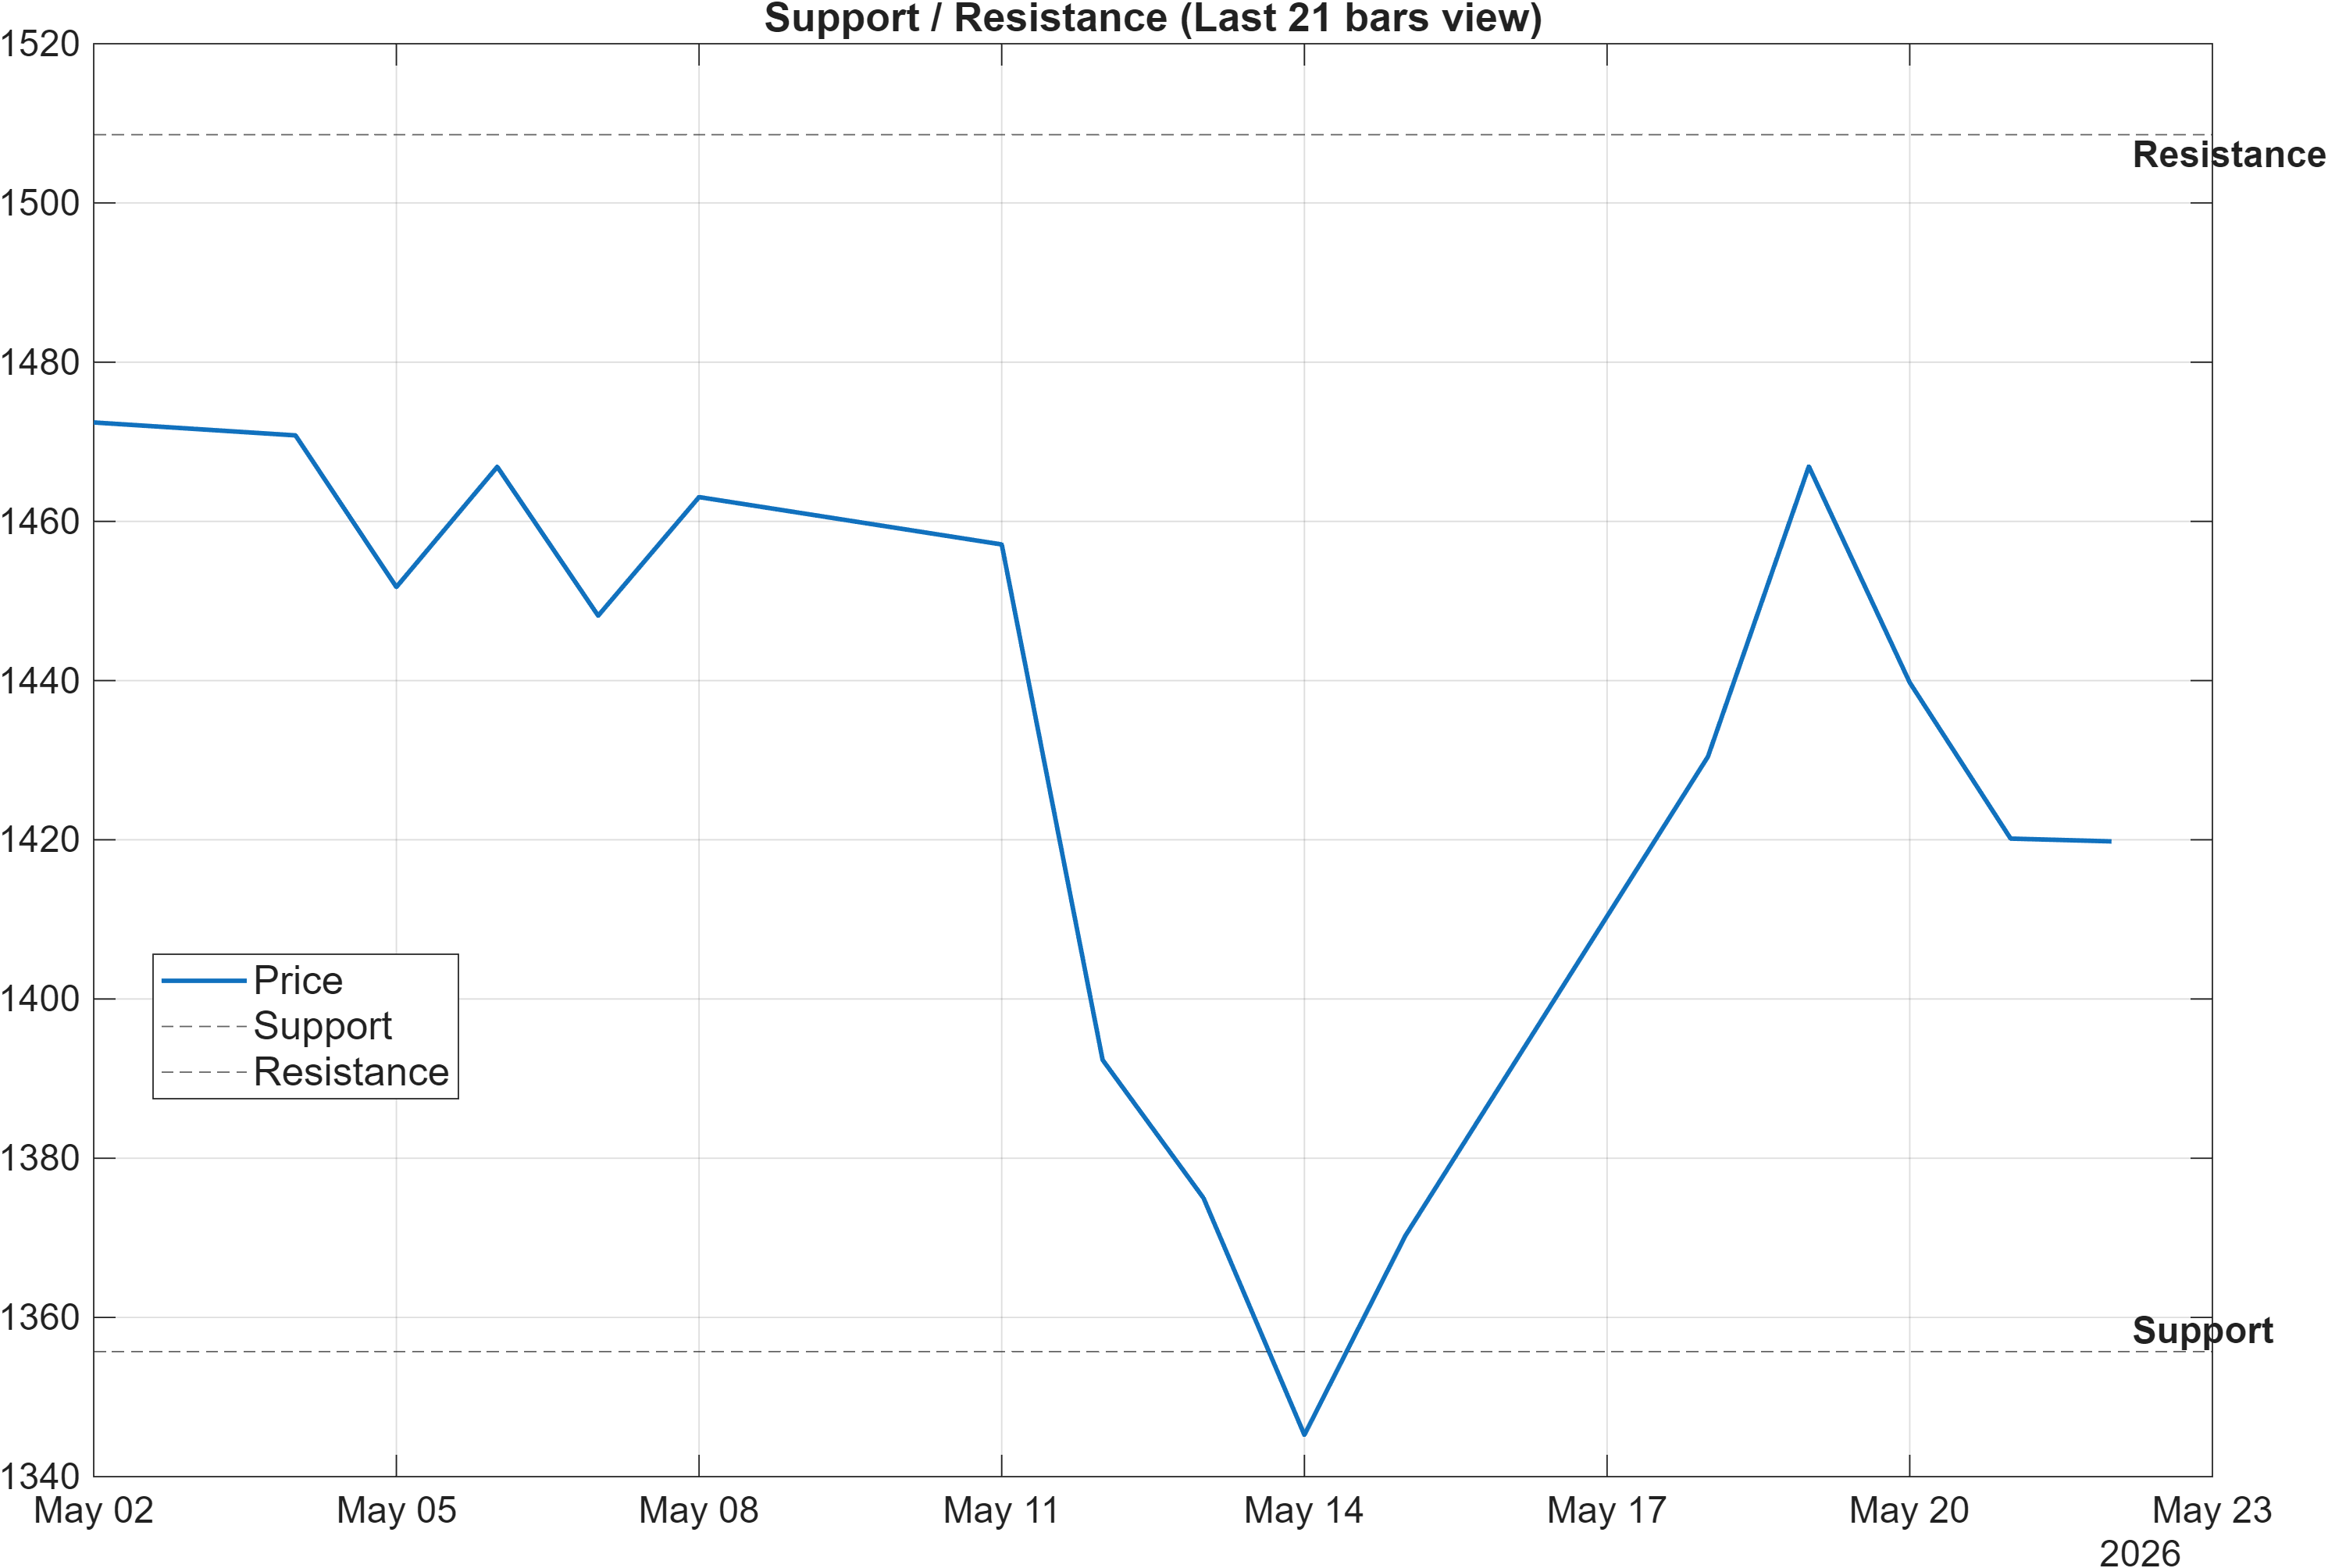
The level structure is clean and helps contextualize the otherwise neutral signal mix. With support ~1355.7083 and resistance ~1508.5750, the market is defining a bounded decision area where confirmation risk is high: signals can look constructive inside the range but remain non-committal until price proves acceptance beyond the boundary.
The scenario language is explicit: a break above resistance with volume supports continuation, while a close below support increases deterioration risk. This matters because several momentum measures are not yet in a robust “trend-following” posture (e.g., ROC(20) = -3.521, RSI(14) = 42.45 bearish in the table). As a result, a resistance break would ideally be accompanied by broad-based confirmation (momentum and participation) rather than a single-session overshoot.
On the support side, the technical dashboard includes a constructive internal check: MedPx vs Support = 76.92 is labeled bullish, suggesting the market is not currently priced in a fragile position relative to the identified floor. However, volume dynamics are less supportive, with Vol ROC(20) = -61.3 bearish; that combination can imply that level defense may rely on thinner participation, making the support zone more sensitive to shocks.
Structurally, this is a “levels-first” setup: directional confidence increases only if price action resolves the range. Until then, the most analytically consistent stance is to treat rallies into 1508.5750 and pullbacks toward 1355.7083 as tests of acceptance/rejection rather than as proof of trend.
5) Quant Technical Dashboard (18 Signals)
KGNAI AI Technical Analysis Score (Deep Reinforcement Learning): Rank #935 out of 1220 (Rank 1 represents the strongest technical positioning and a higher probability of favorable price behavior. As ranks increase toward the maximum, the probability of favorable outcomes weakens and bearish positioning becomes more dominant.) | Label: Neutral | Score: -0.533
18-Signal Technical Confluence Score: 0.111 (Neutral)
Overall Technical Score (18-signal confluence + DRL rank blend): -0.082 (Neutral)
Note: The blended score reflects signal strength weighted against broader AI technical ranking, which may temporarily diverge.
Blended technical score breakdown: -0.082 (Neutral | Bull 8 / Bear 6 / Neutral 4)
The quant dashboard emphasizes signal balance over dominance. The 18-signal confluence prints 0.111 (Neutral), while the blended overall technical score is -0.082 (Neutral). The internal split—Bull 8 / Bear 6 / Neutral 4—captures why “no directional edge” is a reasonable stance: there are enough supportive readings to prevent a clean bearish thesis, but enough bearish momentum/volatility flags to prevent a high-conviction bullish thesis.
A key nuance is the divergence between the confluence layer and the reinforcement-learning technical rank. The DRL technical rank is #935/1220 with a score of -0.533, which is weaker relative positioning even though the confluence is slightly positive. This is often observed when indicator snapshots improve (e.g., MACD histogram bullish) but the broader pattern library still classifies the structure as lower-quality or less persistent.
Within the indicator set, participation-type measures are relatively constructive (e.g., accumulation/distribution family shows multiple bullish labels), while core momentum/velocity is more conflicted (e.g., RSI(14) = 42.45 bearish; ROC(20) = -3.521 bearish). That blend tends to describe a market attempting to stabilize through flows but still lacking the “price acceleration” that typically underwrites sustained uptrends.
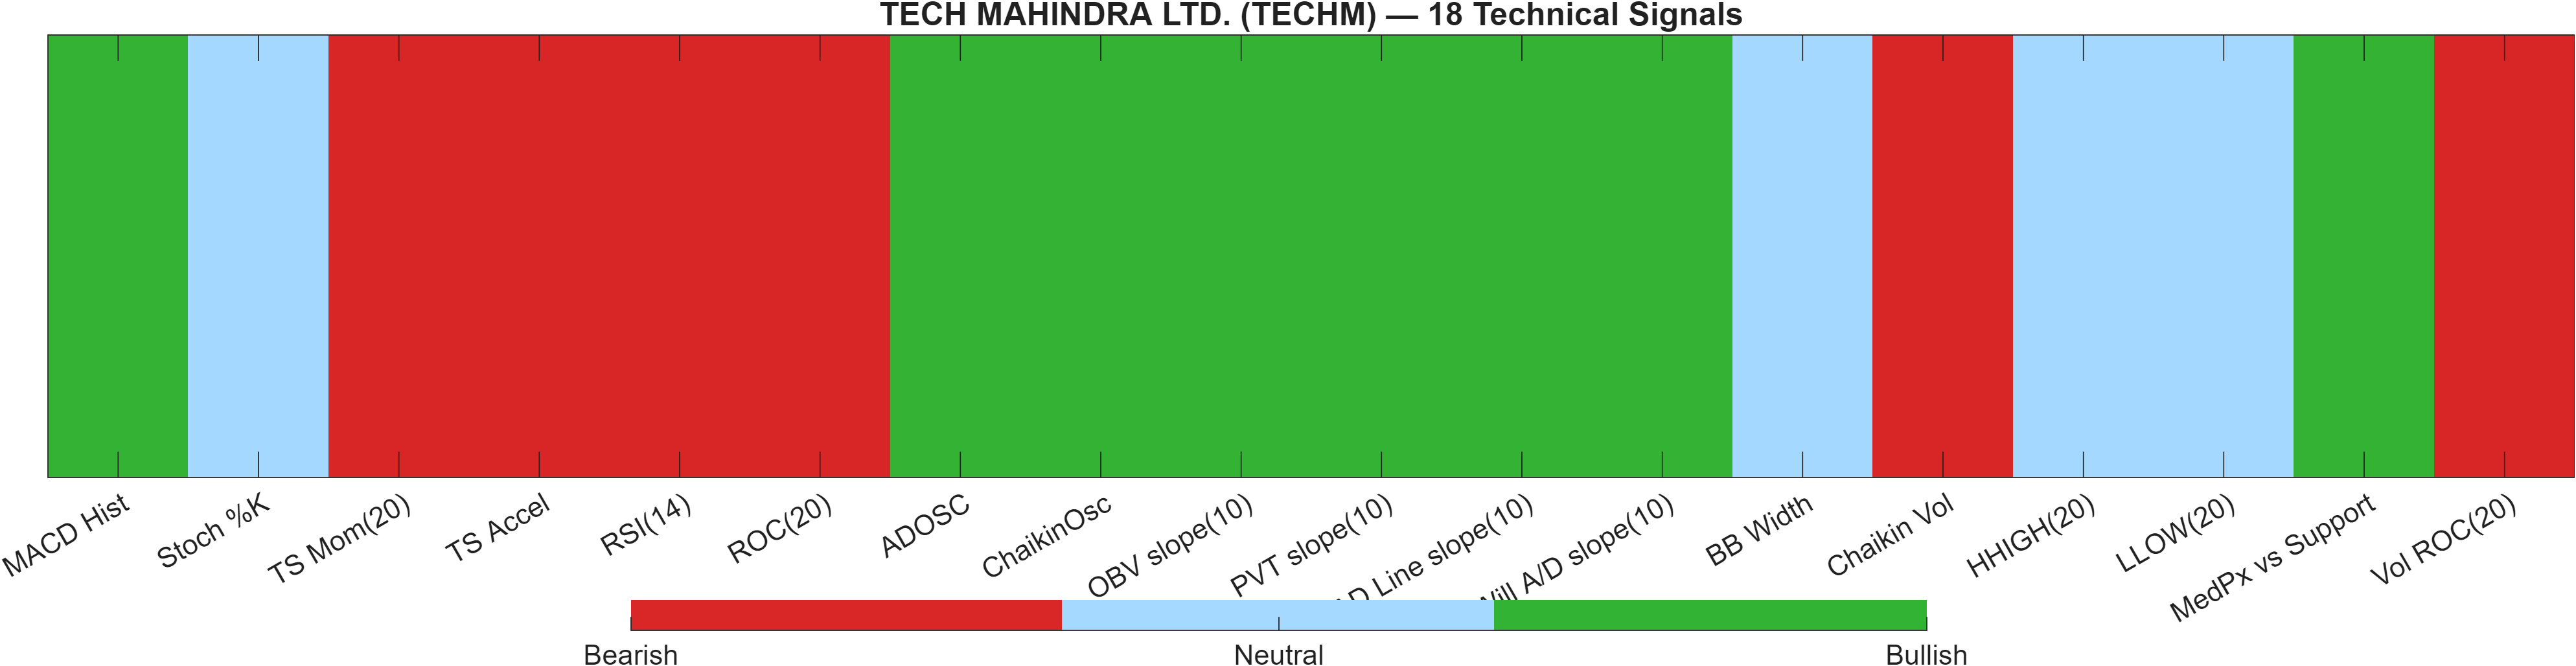
Signal table (Bull/Bear/Neutral)
| Indicator | Value | Signal |
|---|---|---|
| MACD Hist | 1.831 | Bullish |
| Stoch %K | 51.73 | Neutral |
| TS Mom(20) | -51.46 | Bearish |
| TS Accel | -63.38 | Bearish |
| RSI(14) | 42.45 | Bearish |
| ROC(20) | -3.521 | Bearish |
| ADOSC | 20.53 | Bullish |
| ChaikinOsc | 7719 | Bullish |
| OBV slope(10) | 7.054e+05 | Bullish |
| PVT slope(10) | 1.388e+04 | Bullish |
| AD Line slope(10) | 9.514e+04 | Bullish |
| Will A/D slope(10) | 106.2 | Bullish |
| BB Width | 0.1073 | Neutral |
| Chaikin Vol | 42.41 | Bearish |
| HHIGH(20) | 1506 | Neutral |
| LLOW(20) | 1328 | Neutral |
| MedPx vs Support | 76.92 | Bullish |
| Vol ROC(20) | -61.3 | Bearish |
Interpretation: Indicator-level signals form the base confluence, which is then adjusted using a separate AI-driven technical ranking model. The final technical score summarizes this combined view.
6) News sentiment + extractive gist
Note: Instrument-specific news matches were not found, so the digest includes broader market/sector headlines. Links are provided for verification.
Sentiment score (avg): 0.094 | Positive: 25% | Neutral: 69% | Negative: 6%
KGNAI AI News Sentiment Score (normalized -1 to +1): -0.01 (as of 2026-04-22) | Label: Bullish | Overall news score: 0.29
Positive Developments
Recent coverage across major financial outlets indicates a mildly constructive backdrop for risk appetite, with pockets of optimism around tactical stock setups and selective sector participation. This aligns with the distribution skew in the sentiment summary—25% positive versus 6% negative—even though the overall environment is not decisively bullish. For TECHM specifically, the implication is indirect: supportive market tone can help a range resolve upward, but only if price also confirms through levels and trend filters. The slightly positive average sentiment (0.094) sits alongside a near-flat normalized score (-0.01, still labeled bullish), suggesting that the news flow provides contextual lift rather than a dominant directional driver. In a technically neutral setup (overall technical score -0.082), this kind of “soft-positive” narrative tends to matter most at inflection points—particularly if resistance is tested and requires incremental demand to convert a rally into acceptance.
Neutral / Mixed Developments
The dominant share of the news digest is neutral (69%), consistent with a market narrative that is information-rich but not uniformly directional. Macro and cross-asset updates can support a bid one day and fade the next, which often maps to the sort of mixed technical posture visible here: positive MACD hist (1.8314) alongside weaker momentum gauges (e.g., RSI(14) = 42.45 bearish in the signal table). For TECHM, neutral flow tends to reinforce level-driven trading—participants wait for price to prove itself at 1508.5750 or 1355.7083 rather than committing early. This also fits the volatility read: BB Width 0.1073 (neutral) does not suggest a headline-driven volatility expansion that would force rapid repricing.
Negative / Risk Signals
Risk framing in broader market coverage has not disappeared, and the presence of negative items—while limited (6%)—matters because TECHM’s technical state is not strongly buffered by momentum. Bearish readings in the signal table such as Vol ROC(20) = -61.3 and ROC(20) = -3.521 imply that participation and price velocity can deteriorate quickly if the market experiences a risk-off impulse. In that scenario, the support zone near 1355.7083 becomes the key “integrity test”: a close below it would be consistent with the report’s stated deterioration risk condition. Given the mixed timeframe ranks (weekly strength vs weaker daily positioning), negative macro or sector sentiment could also be the catalyst that causes the weekly outperformance signal to fail to translate into sustained continuation.
- Price behavior at 1508.5750: rejection vs acceptance (ideally with volume confirmation per the scenario framework).
- Support integrity near 1355.7083: whether the market rebounds quickly after tests or begins closing below the zone.
- Momentum confirmation: whether RSI(14) and ROC(20) improve as MACD remains positive.
Sources referenced: Reuters, Bloomberg, Yahoo Finance, MarketWatch, Investing.com
7) Sources
Not available in the provided data.
You may also like: How KGNAI AI ranks instruments across global markets
Disclaimer: KGNAI provides AI-generated analytics and educational market commentary only. This is not financial advice. Markets involve risk. Always do your own research.