
SBC (SBC Exports Limited) — 17-May-2026 Technical & Rank Note with Bullish Ranks but Neutral Confluence
As of 17-May-2026, SBC (SBC Exports Limited) screens with consistently strong cross-sectional positioning across KGNAI’s ranked universe of 1222 instruments, with the most favorable readings concentrated in longer horizons (notably the 3-Monthly rank #5 and Yearly rank #4). However, the nearer-term technical picture is more conditional: price-to-average structure flags Close vs MA50 = Bearish while the longer moving-average relationship remains supportive (MA50 vs MA200 = Bullish). Momentum is not decisively directional with RSI(14) at 50.53 (neutral bias) and MACD histogram -0.1405 leaning negative. Volatility conditions remain contained with Bollinger bandwidth 0.0562, raising the importance of level-based confirmation around the stated support and resistance zones.
- Short / Mid / Long rank stance: Bullish / Bullish / Bullish (best strength shows up in longer horizons, including #5 3-Monthly and #4 Yearly).
- Technical confluence label: Neutral (Overall Technical Score 0.148; 18-signal confluence 0.111).
- Key levels: Support ~ 29.8550 | Resistance ~ 34.5650.
- News sentiment bias: Neutral (avg 0.102; Positive 37%, Neutral 58%, Negative 5%).
- Confirmation / invalidation condition: A sustained push above 34.5650 with volume supports continuation; a close below 29.8550 increases deterioration risk per the level framework.
KGNAI evaluates assets using large cross-sectional datasets built from millions of structured data points. Inputs incorporate fundamental metrics, technical structures, and systematically processed news sentiment. Statistical models, machine learning, and AI frameworks are used to assess relative positioning, signal alignment, and probabilistic behavior across broad universes.
- Ranks are comparative across the tracked universe, not absolute price targets.
- Confluence reflects alignment among independent signal groups.
- Support/resistance levels are probabilistic decision zones, not guarantees.
- Sentiment provides contextual bias within the broader analytical framework.
1) KGNAI AI Analysis
Region: INDIA
Total universe size: 1222 ranked instruments
- Daily rank: #54 out of 1222 — Bullish
- Weekly rank: #86 out of 1222 — Bullish
- Monthly rank: #20 out of 1222 — Bullish
- 3-Monthly rank: #5 out of 1222 — Bullish
- 6-Monthly rank: #20 out of 1222 — Bullish
- Yearly rank: #4 out of 1222 — Bullish
Cross-horizon alignment vs near-term friction
SBC’s ranking stack is unusually coherent across timeframes: the instrument sits in the upper tier on daily and weekly horizons (e.g., #54 and #86), while the longer windows move into top-decile territory with #20 monthly and a particularly strong #5 3-month profile, extending to #4 on the yearly horizon. This configuration typically reflects persistence in relative strength rather than a single isolated burst of performance.
The key analytical nuance is that rank strength does not require every technical component to be fully “risk-on” at the same time. Here, broader positioning remains bullish across short, mid, and long horizons, but later sections show parts of the technical layer reading neutral. That combination often indicates either (a) consolidation within a larger constructive regime, or (b) a transition phase where longer-horizon strength is being tested by shorter-term momentum softness.
In practice, the rank spread between the strongest horizons (3-month and yearly) and the weaker horizons (weekly) suggests monitoring whether shorter-term signals rotate back into alignment. If that happens, the probability of follow-through typically improves; if it does not, the market may be signaling a more range-bound phase despite strong long-horizon ranks.
KGNAI ranks each instrument across large universes using multiple proprietary AI tests and statistical models (millions of data points). Lower ranks generally indicate stronger probability of favorable performance behavior, while higher ranks indicate weaker probability and more bearish positioning.
Term view: Short-term: Bullish. Mid-term: Bullish. Long-term: Bullish.
Want the full universe and complete rank tables? Unlock full access on KGNAI: https://www.kgnai.com/pricing
2) Price & trend overview
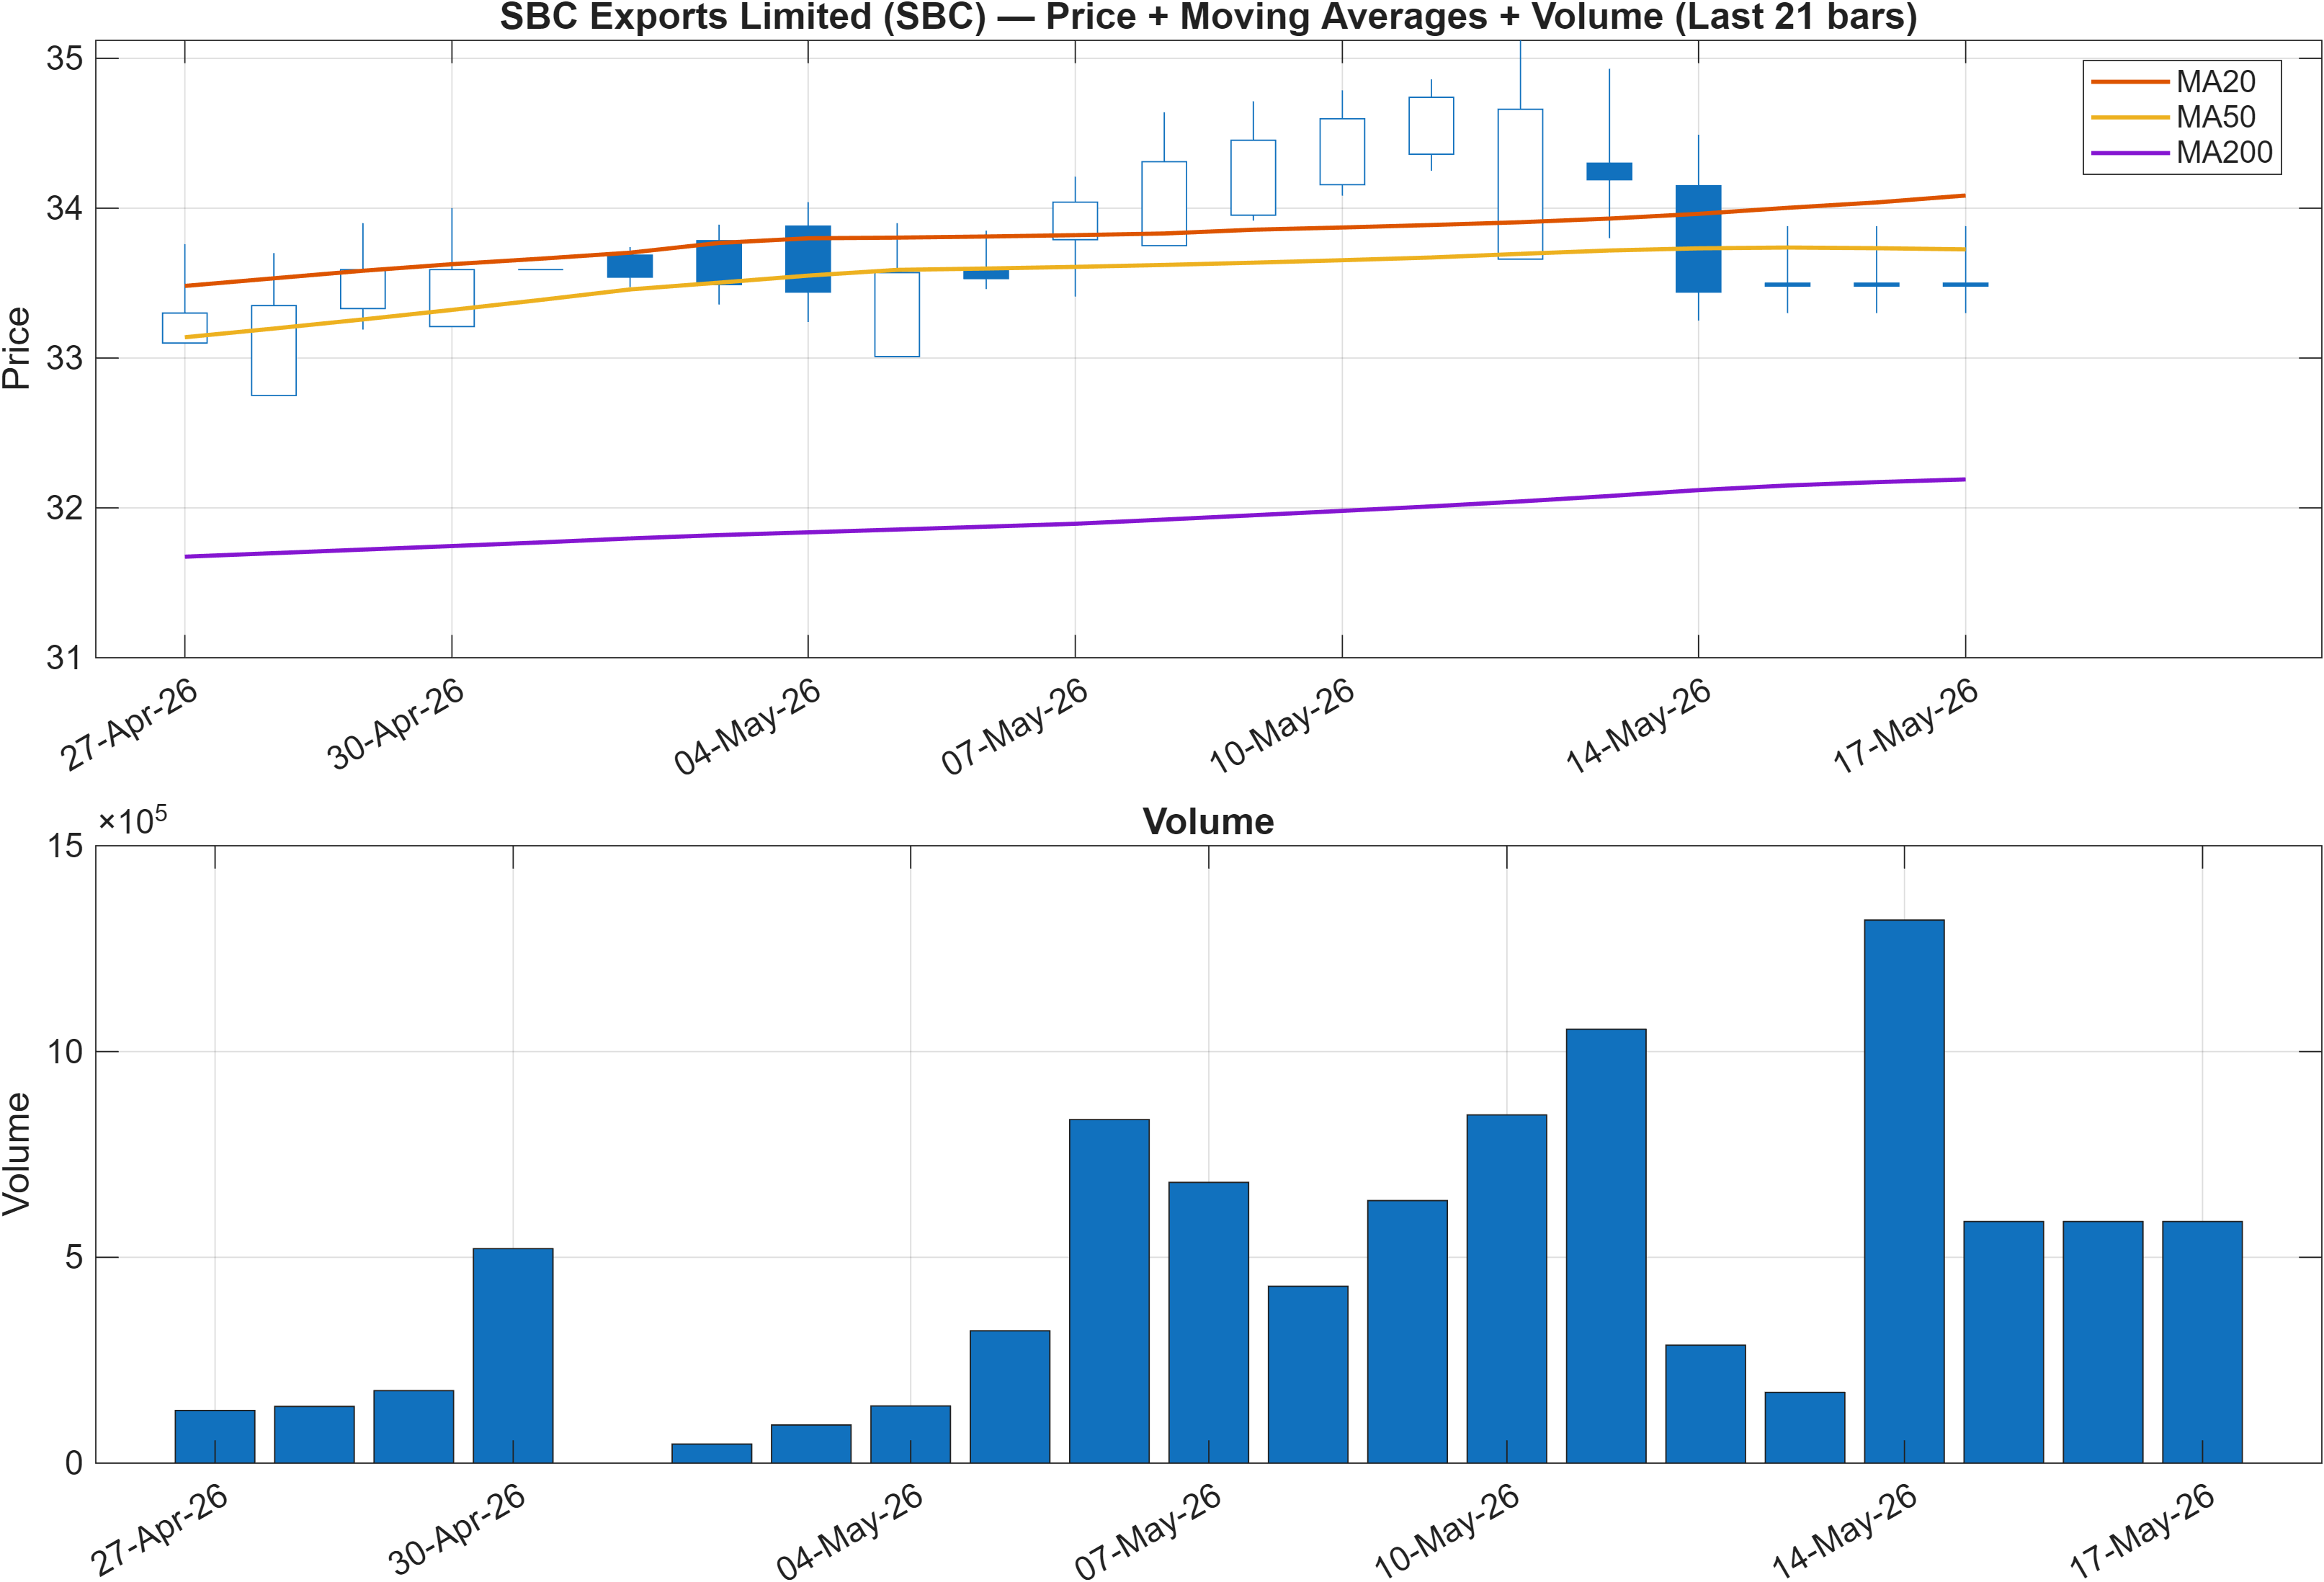
Regime split: longer trend support vs shorter trend pressure
The moving-average interpretation is explicitly split: Close vs MA50 = Bearish while MA50 vs MA200 = Bullish. Structurally, that tends to occur when a market is still above (or has recently maintained) a longer-term uptrend framework, but is experiencing a pullback or consolidation that places price below its intermediate reference line. For trend-following readers, this is less a “trend reversal” signal and more a test of trend durability.
This split matters because it often aligns with the broader rank picture: strong multi-month and yearly rankings can coexist with a temporarily weaker near-term tape. The analytical question becomes whether the current phase is a controlled retracement (frequently followed by stabilization) or whether it evolves into a deeper reset that eventually drags the MA50 lower and threatens the MA200 relationship.
From a positioning standpoint, the most disciplined way to treat this structure is to connect it to the level framework discussed later: with support at 29.8550 and resistance at 34.5650, price behavior around these zones becomes the practical arbiter of whether the bearish close-vs-MA50 condition is merely cyclical weakness inside a broader bullish regime, or the start of a wider regime transition. Until that resolution, trend evidence is mixed across timeframes rather than uniformly directional.
Interpretation: Close vs MA50 = Bearish, MA50 vs MA200 = Bullish.
3) Momentum & volatility dashboard
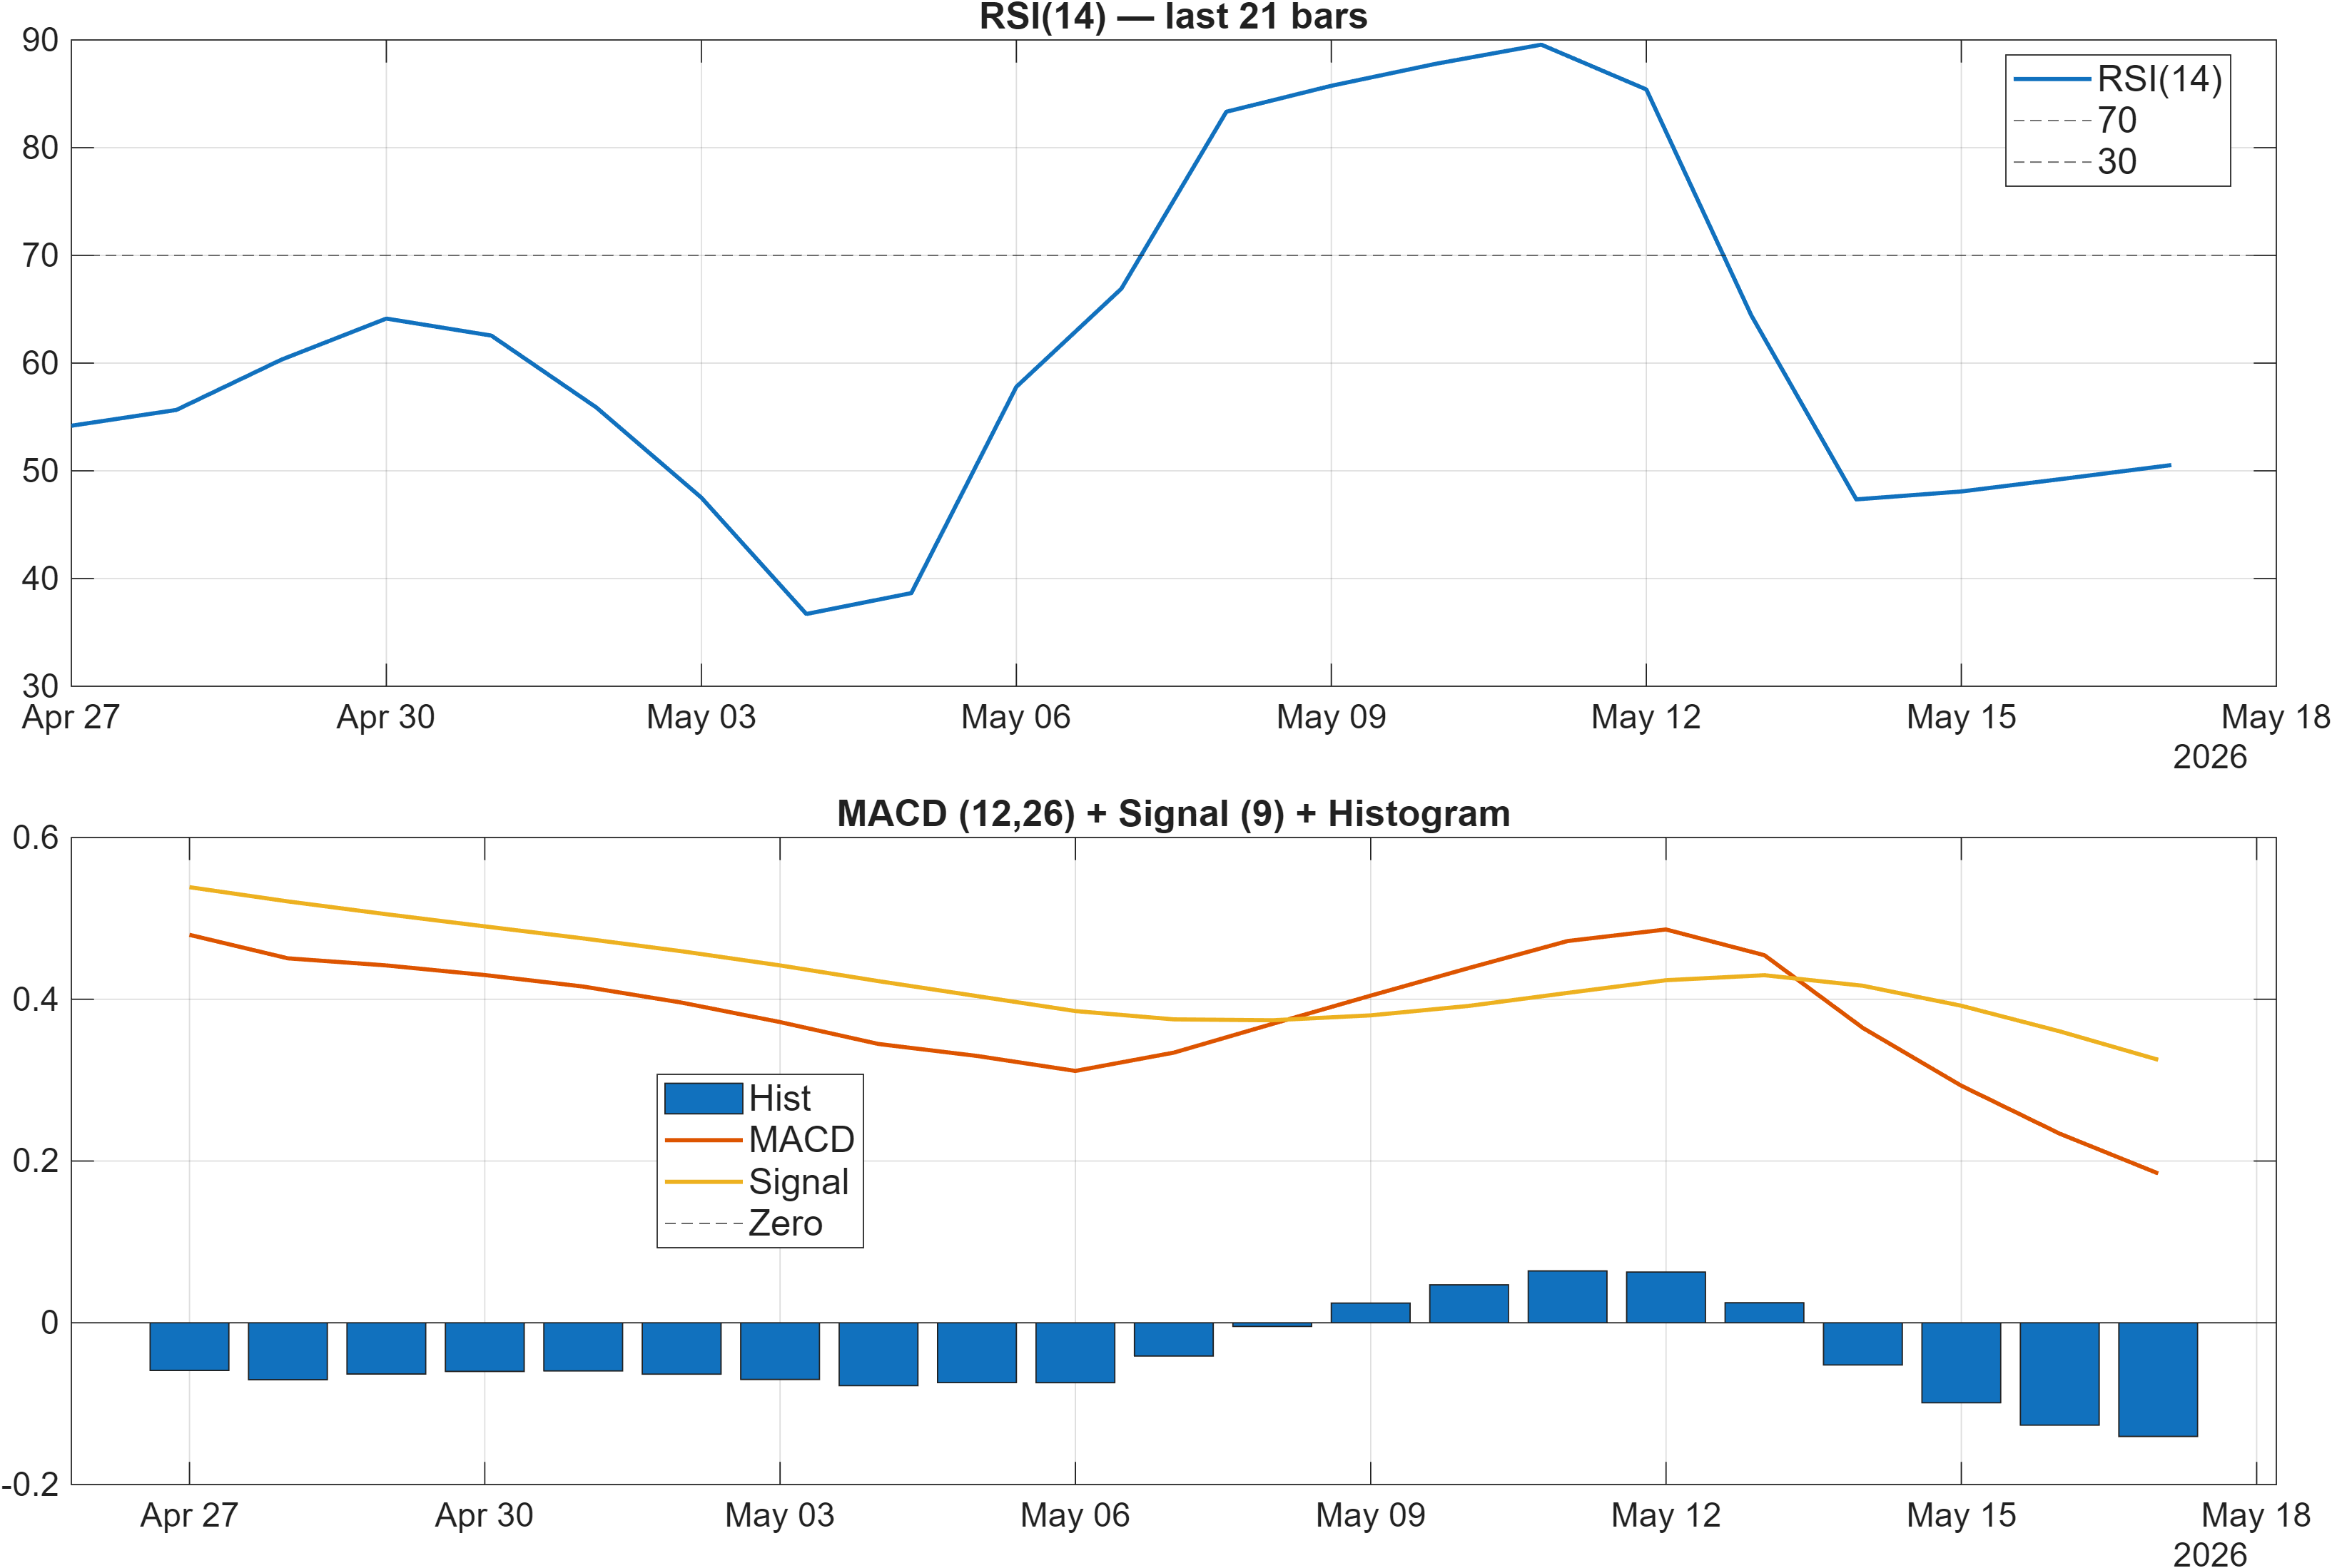
Interpretation: RSI bias = Neutral, MACD hist = -0.1405.
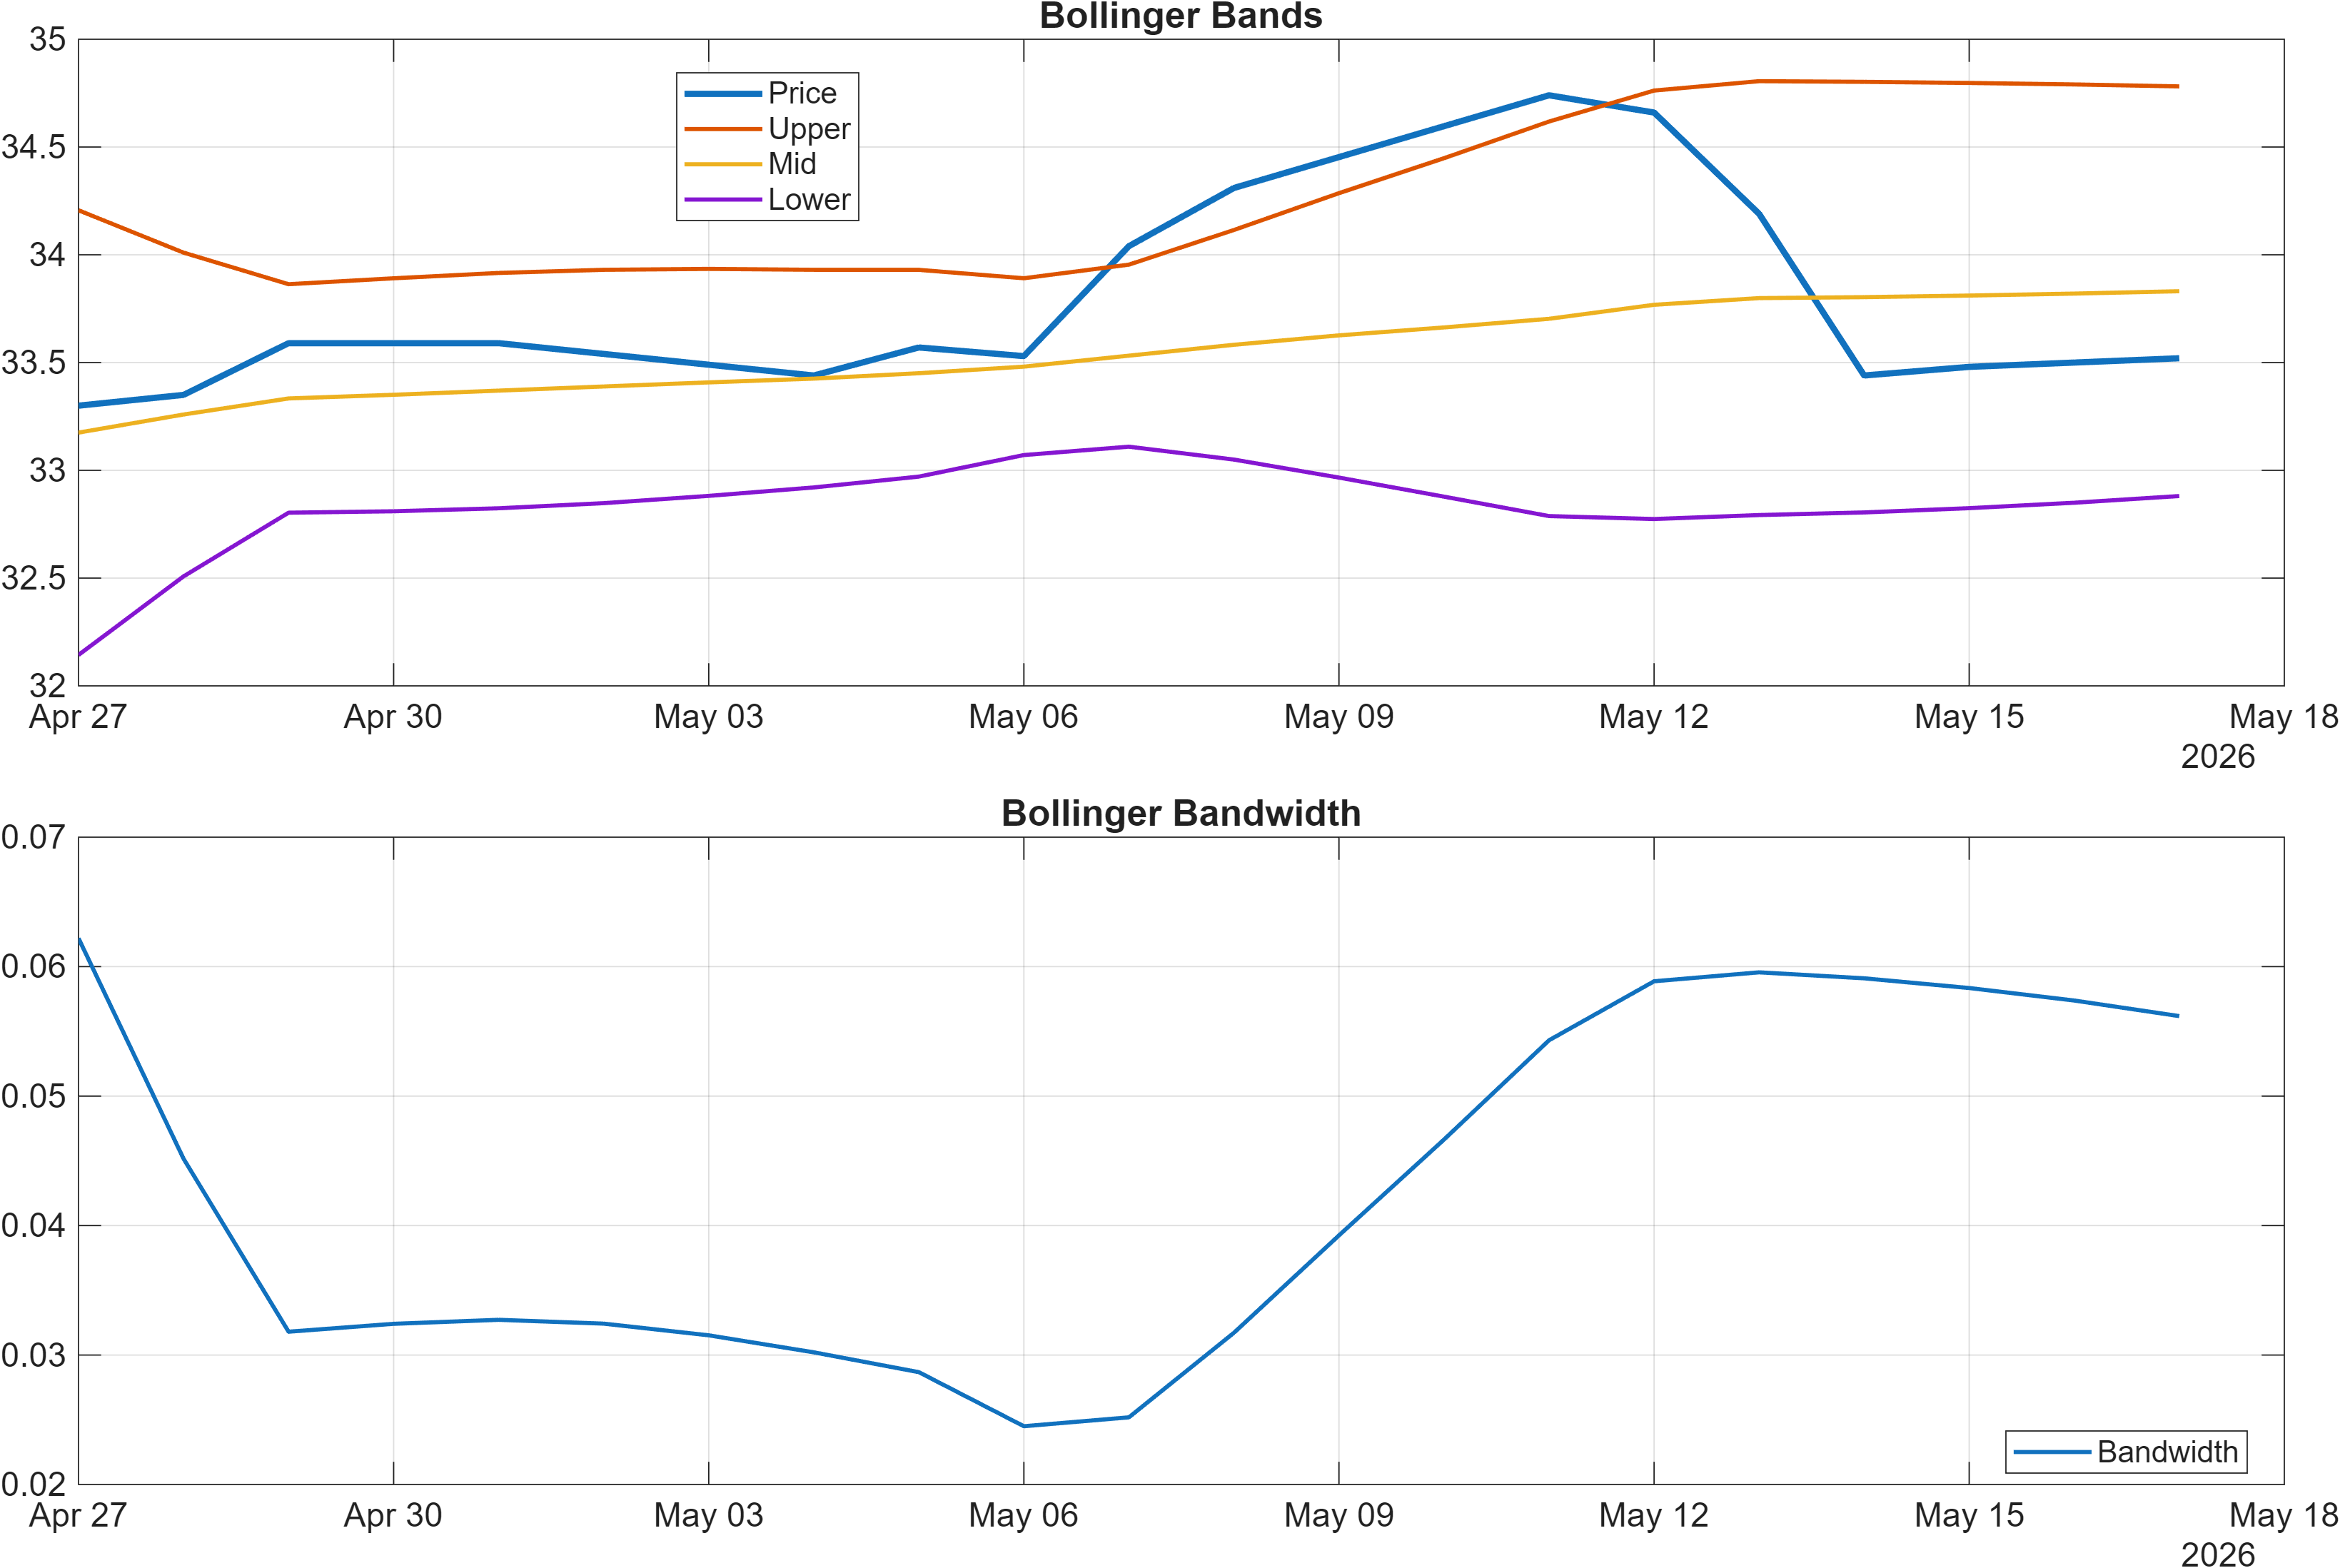
Momentum neutrality with slight bearish tilt; volatility compression risk
Momentum signals present a controlled, non-extended profile. RSI(14) at 50.53 places the oscillator near its balance point, consistent with the stated RSI bias = Neutral. In isolation, that suggests neither overheating nor capitulation dynamics. By contrast, the MACD histogram at -0.1405 introduces a mild bearish undertone—often associated with weakening short-term trend impulse or a lagging confirmation problem.
Volatility conditions are also important context. The latest Bollinger bandwidth 0.0562 (and the BB Width reading of 0.05618 in the broader dashboard) indicates a relatively contained volatility regime. Compressed bandwidth tends to coincide with range formation and can precede expansion phases; however, the direction of any expansion is not implied by bandwidth alone. This is one reason the report’s decision zones (support and resistance) carry more weight than oscillators when volatility is muted.
For confirmation-focused readers, this mixture—neutral RSI, slightly negative MACD histogram, and low bandwidth—often expresses “signal compression”: the market is not providing a strong momentum trend, so breakouts or breakdowns tend to be more meaningful when they occur alongside volume confirmation. Absent that, momentum can oscillate around neutral and produce false starts, which is consistent with a neutral technical label despite bullish ranks.
Interpretation: Bandwidth (volatility regime) latest = 0.0562.
4) Support / Resistance zones
Support ~ 29.8550 | Resistance ~ 34.5650
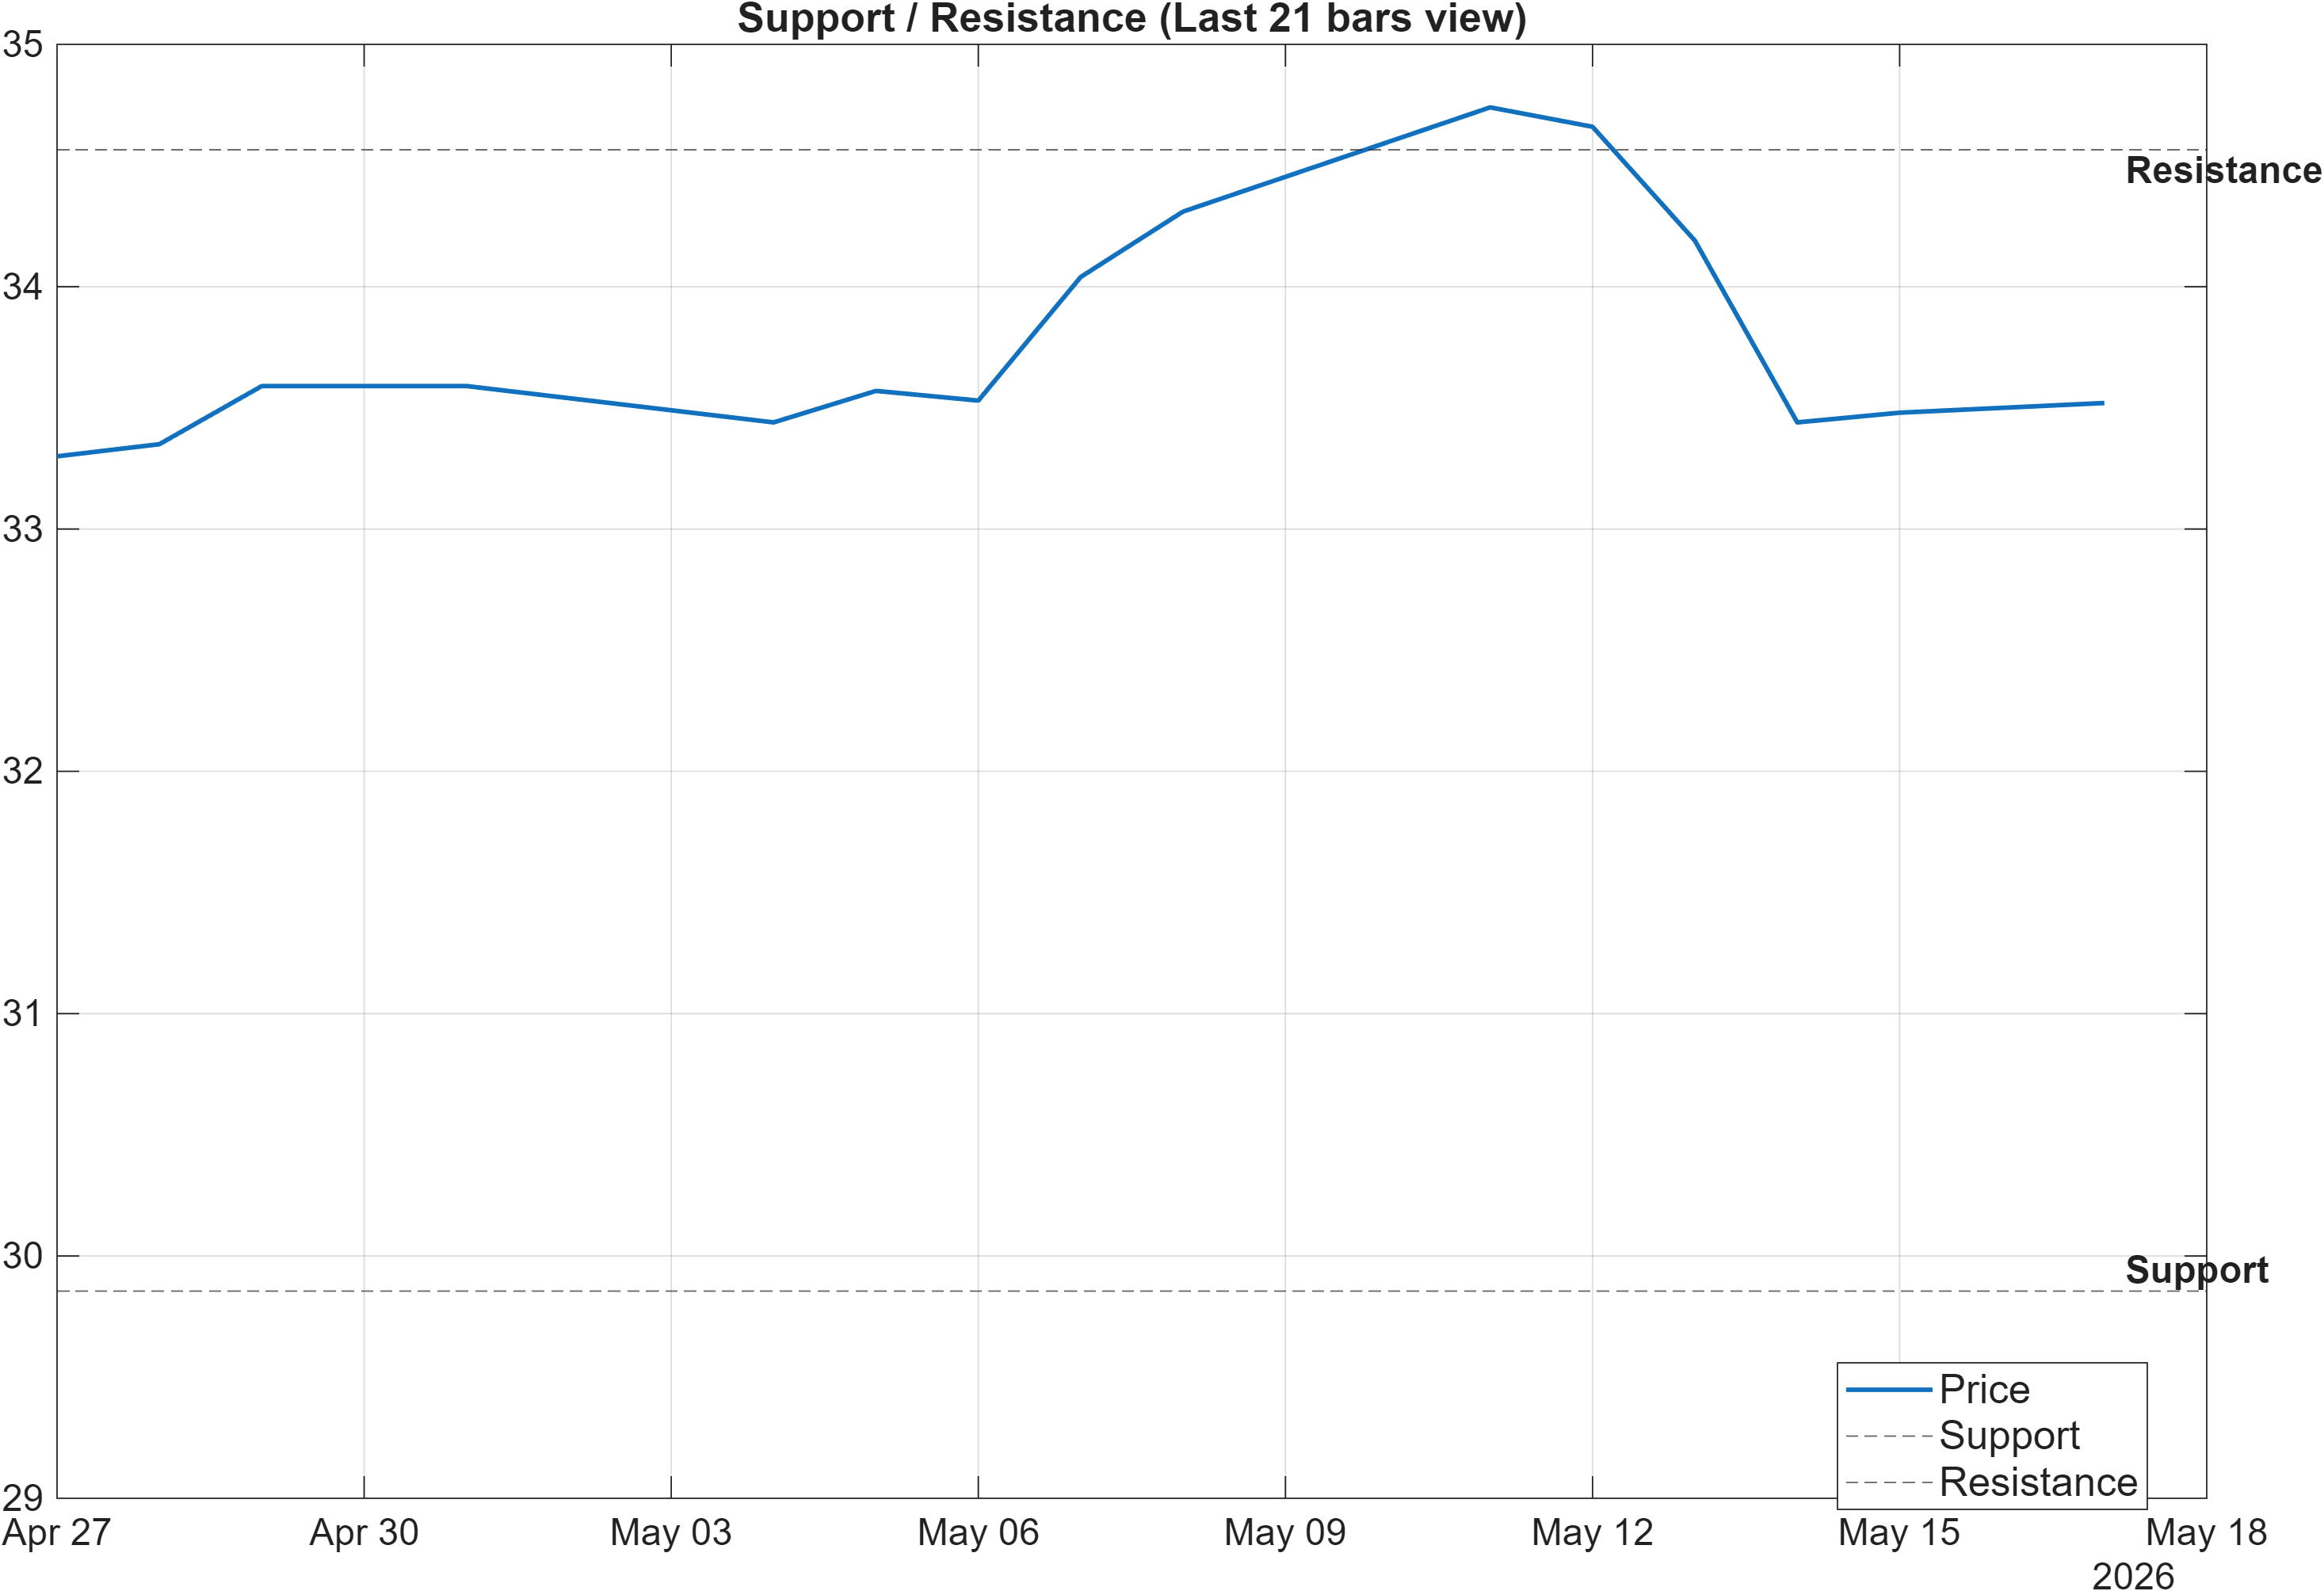
Decision-zone framing: continuation requires proof, deterioration has a clear trigger
The current framework is level-driven: 29.8550 defines the key support zone and 34.5650 defines the key resistance zone. With momentum indicators not strongly directional (RSI neutral at 50.53) and volatility relatively tight (bandwidth 0.0562), these zones become the primary “information points” for assessing whether the market is resolving toward continuation or reverting deeper into consolidation.
A resistance break is explicitly conditional: the scenario language calls for a break above resistance with volume to support continuation. That condition aligns with the broader context where the longer moving-average relationship remains bullish (MA50 vs MA200 = Bullish) even as the nearer-term close vs MA50 is bearish. In other words, a confirmed move above 34.5650 would improve alignment across the structure by reducing the short-term friction.
On the downside, the invalidation trigger is similarly unambiguous: a close below 29.8550 is framed as deterioration risk. Given the strong multi-horizon ranks (including #4 yearly), a clean break of support would be analytically notable because it would represent a direct conflict between level-based price behavior and cross-sectional strength. In that case, attention typically shifts from “continuation potential” to “regime reassessment,” particularly if negative momentum persists (e.g., MACD histogram remaining below zero).
Scenario view: Break above resistance with volume → continuation. Close below support → signal deterioration risk.
5) Quant Technical Dashboard (18 Signals)
KGNAI AI Technical Analysis Score (Deep Reinforcement Learning): Rank #467 out of 1222 (Rank 1 represents the strongest technical positioning and a higher probability of favorable price behavior. As ranks increase toward the maximum, the probability of favorable outcomes weakens and bearish positioning becomes more dominant.) | Label: Neutral | Score: 0.236
18-Signal Technical Confluence Score: 0.111 (Neutral)
Overall Technical Score (18-signal confluence + DRL rank blend): 0.148 (Neutral)
Note: The blended score reflects signal strength weighted against broader AI technical ranking, which may temporarily diverge.
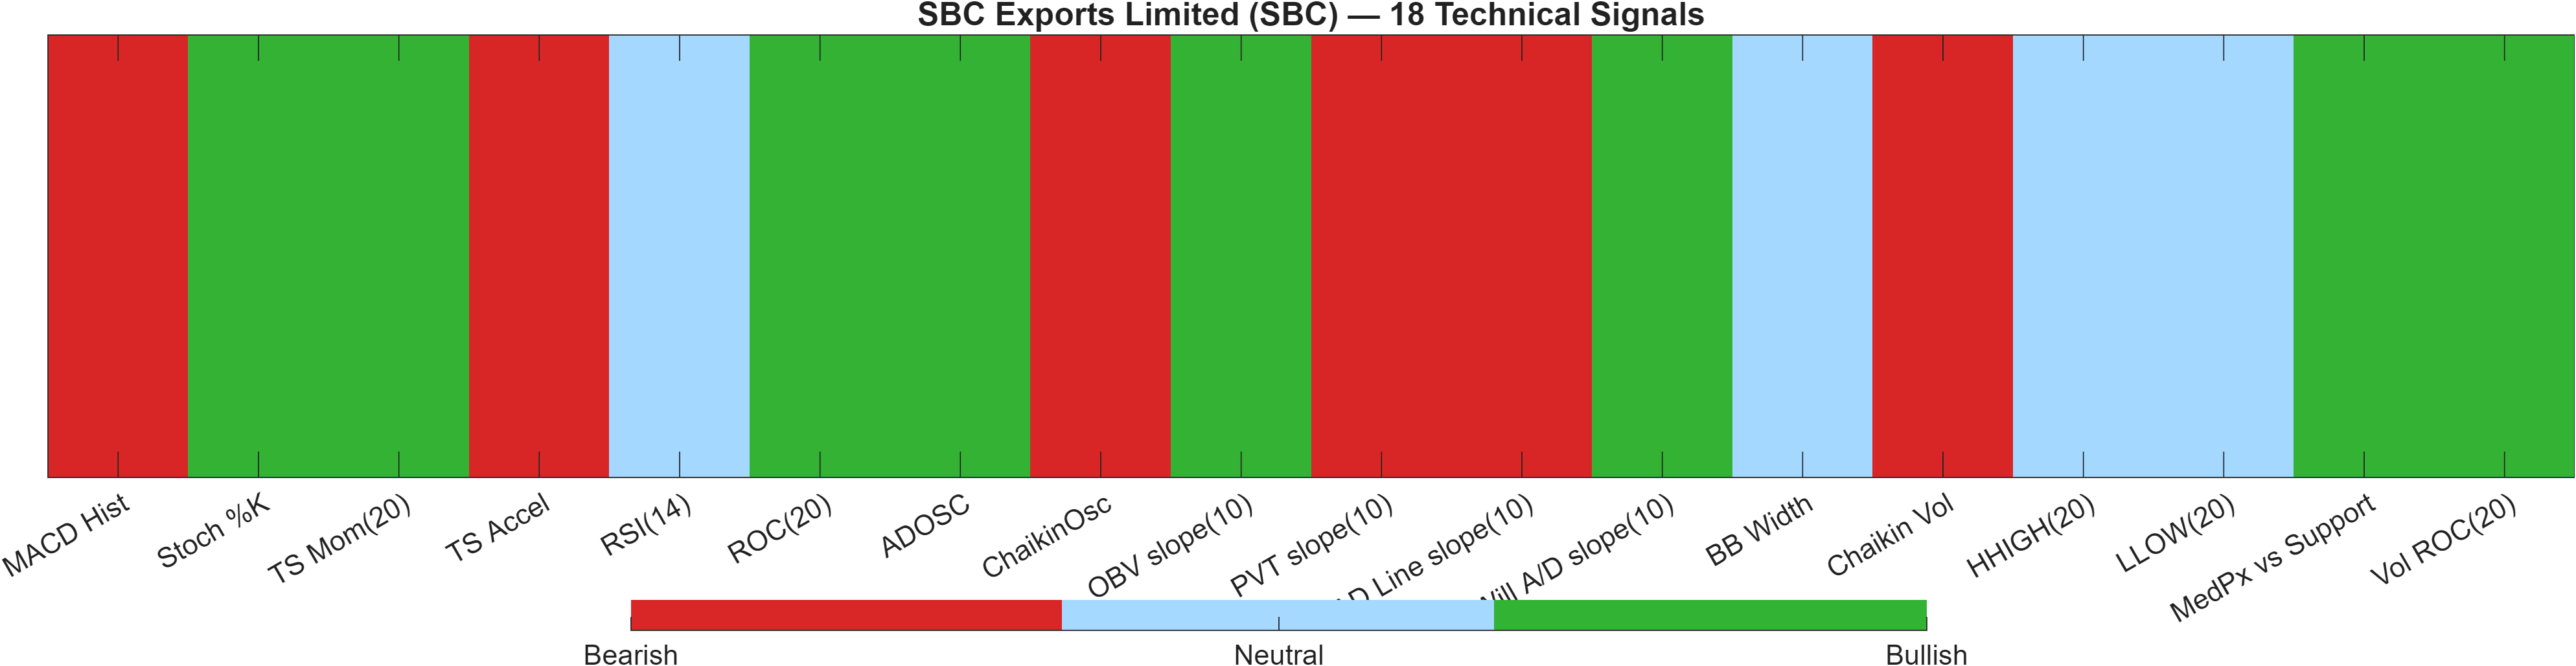
Blended technical score breakdown: 0.148 (Neutral | Bull 8 / Bear 6 / Neutral 4)
Confluence vs model rank: why “Neutral” can coexist with bullish horizon ranks
The technical layer is best read as a balance-of-evidence system rather than a single trigger. The Deep Reinforcement Learning technical rank is #467 out of 1222 with a Neutral label and score 0.236. In parallel, the 18-signal confluence score is 0.111 (Neutral), and the blended overall technical score is 0.148 (Neutral), reflecting a mixed distribution (Bull 8 / Bear 6 / Neutral 4).
The internal composition helps explain the neutrality. Momentum is not broadly risk-on: MACD histogram -0.1405 is bearish, and acceleration (TS Accel -1.12) is also bearish. At the same time, several participation and rate-of-change inputs lean constructive (for example, Stoch %K 12.3 is bullish and Vol ROC(20) 326.3 is bullish), which can be consistent with episodic demand even if trend impulse is currently muted.
This “mixed stack” is precisely where level confirmation gains importance. With ranks bullish across horizons but technical confluence neutral, SBC is better framed as an instrument with favorable relative positioning that is awaiting stronger technical synchronization (e.g., momentum turning more uniformly positive) to reduce whipsaw risk. Until then, the report’s support/resistance zones can function as the cleaner, more falsifiable structure for decision-making.
Signal table (Bull/Bear/Neutral)
| Indicator | Value | Signal |
|---|---|---|
| MACD Hist | -0.1405 | Bearish |
| Stoch %K | 12.3 | Bullish |
| TS Mom(20) | 0.13 | Bullish |
| TS Accel | -1.12 | Bearish |
| RSI(14) | 50.53 | Neutral |
| ROC(20) | 0.5097 | Bullish |
| ADOSC | 48.28 | Bullish |
| ChaikinOsc | -3.277e+05 | Bearish |
| OBV slope(10) | 1.777e+06 | Bullish |
| PVT slope(10) | -1.727e+04 | Bearish |
| AD Line slope(10) | -1.693e+05 | Bearish |
| Will A/D slope(10) | 0.03 | Bullish |
| BB Width | 0.05618 | Neutral |
| Chaikin Vol | 14.26 | Bearish |
| HHIGH(20) | 35.12 | Neutral |
| LLOW(20) | 32.75 | Neutral |
| MedPx vs Support | 3.735 | Bullish |
| Vol ROC(20) | 326.3 | Bullish |
Interpretation: Indicator-level signals form the base confluence, which is then adjusted using a separate AI-driven technical ranking model. The final technical score summarizes this combined view.
6) News sentiment + extractive gist
Sentiment score (avg): 0.102 | Positive: 37% | Neutral: 58% | Negative: 5%
KGNAI AI News Sentiment Score (normalized -1 to +1): Not available (as of —) | Label: Not available | Overall news score: 0.10
Positive Developments
Recent coverage across major financial outlets indicates a constructive narrative skew in parts of the news flow, broadly consistent with the headline sentiment mix showing 37% positive and an average sentiment score of 0.102. The positive side of the digest emphasizes management commentary and strategic initiatives, with attention on underlying activity trends and expansion efforts referenced in recent reporting. This “constructive but not euphoric” tone fits the broader analytical setup: the cross-sectional ranks remain bullish across horizons (including #5 over 3 months and #4 yearly), yet the technical layer is still neutral, implying that optimism in narrative may be ahead of full confirmation in near-term price momentum. As a result, positive news should be weighed less as a catalyst on its own and more as contextual support—particularly relevant if price can reclaim technical alignment above resistance.
Neutral / Mixed Developments
The neutral portion of the flow is dominant at 58%, suggesting a market that is still processing information without forming a strong consensus directional impulse. Coverage in this bucket leans informational—updates, calls, and routine releases—rather than clearly incremental surprises. This neutrality is directionally consistent with the technical snapshot: RSI(14) at 50.53 is balanced, and volatility is comparatively contained (bandwidth 0.0562), conditions that often coincide with range trade behavior rather than trend acceleration. With the KGNAI normalized news sentiment score explicitly listed as Not available, the interpretation relies on the provided aggregate sentiment breakdown rather than a separate normalized signal.
Negative / Risk Signals
Negative items are a smaller slice at 5%, but they matter because the technical layer is not strongly bullish—making any adverse narrative more capable of influencing short-term price behavior near decision levels. Recent coverage across major outlets highlights areas where reported performance may appear weaker on the surface, and where structural changes or revisions have weighed on comparisons in recent periods. In a setup where Close vs MA50 = Bearish and the MACD histogram is -0.1405, negative framing can reinforce the existing short-term softness even if longer-horizon ranks remain favorable. Risk is therefore best expressed through the level framework: a sustained break below 29.8550 would be the clearer signal that negative pressure is translating into material technical deterioration.
- Whether price behavior confirms above 34.5650 alongside improving momentum (watch if MACD histogram stops deteriorating from -0.1405).
- Whether volatility expands from the current compressed state (0.0562) with directionally consistent follow-through.
- Whether sentiment distribution shifts materially away from the current 58% neutral baseline.
Sources referenced: Reuters, Bloomberg, Yahoo Finance, MarketWatch, Investing.com
Snapshot: AI Rank (Short–Mid–Long): Bullish (Bullish–Bullish–Bullish) · Technical Confluence: Neutral · Key Levels: Support ~29.86 | Resistance ~34.56 · News Sentiment: Neutral
7) Sources
- SBC Medical Group Holdings Inc (SBC) Q1 2026 Earnings Call Highlights: Navigating Revenue ...
- SBC Medical Group Q1 Earnings Call Highlights
- SBC Medical Group Holdings Announces First Quarter 2026 Financial Results
- SBC Medical to Announce 1Q 2026 Financial Results
- SBC Medical Announces Full-Scale Rollout of Aesthetic Healthcare-Focused Interpretation App "Talk Bridge" Across All Shonan Beauty Clinic Locations
- Emerging Growth Research Releases Flash Report on SBC Medical Group; Reiterates Buy-Extended Rating and $9.00 Price Target
- SBC Medical Announces Closing of Previously Announced Secondary Public Offering of 3.1 million shares of Common Stock
- SBC: View Secondary Offering as a Positive For Share Trading Liquidity
You may also like: How KGNAI AI ranks instruments across global markets
Disclaimer: KGNAI provides AI-generated analytics and educational market commentary only. This is not financial advice. Markets involve risk. Always do your own research.