
BRITANNIA (Britannia Industries Limited) Technical & AI Rank Review — 24-May-2026 | Mid/Long Bullish, Near-Term Friction
Britannia Industries Limited (BRITANNIA) enters 24-May-2026 with a constructive medium- and longer-horizon rank profile versus a 1,220-instrument India universe, while the nearer-term tape shows momentum headwinds. KGNAI’s cross-horizon ranks lean stronger in the longer windows (notably the 6-Monthly rank #29 and Yearly rank #78), but the Weekly rank #475 and moving-average posture argue for patience on timing. The technical composite reinforces that split: the 18-signal confluence score -0.389 (Bearish) contrasts with a blended overall technical score -0.295 (Neutral), indicating stabilization attempts amid still-negative internal breadth. Key price decision zones remain well-defined at support ~5305.1000 and resistance ~5810.5500. Meanwhile, news sentiment is statistically positive (sentiment avg 0.143; KGNAI normalized 0.97), but the digest is sector/broader-market in nature rather than instrument-specific.
- Rank stance: Short-term Neutral; Mid-term Bullish; Long-term Bullish (6-Monthly rank #29 supports the long-horizon bias).
- Technical confluence: Bearish on 18-signal score -0.389, but Neutral on blended overall technical -0.295.
- Key levels: Support ~5305.1000 | Resistance ~5810.5500.
- News sentiment bias: Bullish normalized score 0.97 (as of 2026-05-01), with 0% negative share in the aggregated mix.
- Confirmation / invalidation: A break above 5810.5500 with volume supports continuation; a close below 5305.1000 increases deterioration risk per the scenario framework.
What KGNAI Measures
KGNAI evaluates assets using large cross-sectional datasets built from millions of structured data points. Inputs incorporate fundamental metrics, technical structures, and systematically processed news sentiment. Statistical models, machine learning, and AI frameworks are used to assess relative positioning, signal alignment, and probabilistic behavior across broad universes.
How to Read This Report
- Ranks are comparative across the tracked universe, not absolute price targets.
- Confluence reflects alignment among independent signal groups.
- Support/resistance levels are probabilistic decision zones, not guarantees.
- Sentiment provides contextual bias within the broader analytical framework.
1) KGNAI AI Analysis
Region: INDIA
Total universe size: 1220 ranked instruments
- Daily rank: #201 out of 1220 — Bullish
- Weekly rank: #475 out of 1220 — Neutral
- Monthly rank: #86 out of 1220 — Bullish
- 3-Monthly rank: #79 out of 1220 — Bullish
- 6-Monthly rank: #29 out of 1220 — Bullish
- Yearly rank: #78 out of 1220 — Bullish
Cross-horizon ranks show a timeframe asymmetry that matters for positioning. The 6-Monthly rank #29 places BRITANNIA in the upper tier of the 1,220-instrument universe, and the Monthly rank #86 plus 3-Monthly rank #79 keep the intermediate tape constructive. By contrast, the Weekly rank #475 sits closer to the middle of the distribution, signaling that the most recent flow is less supportive than the broader trend.
The Daily rank #201 adds nuance: it is still positive on a relative basis, but not as strong as the longer windows, consistent with a market that can firm up day-to-day while remaining technically “heavy” on traditional momentum indicators (expanded in Sections 2–3). This pattern often appears when a longer-horizon base is forming but the near-term is still digesting prior selling.
Within KGNAI’s stated term view—Short-term: Neutral; Mid-term: Bullish; Long-term: Bullish—the practical interpretation is not “all-clear,” but hierarchy: longer horizons currently carry the more favorable probabilistic profile, while shorter horizons require confirmation from price structure and breadth. The implication is to treat any upside attempt as needing validation against defined resistance (Section 4) and against internal technical breadth (Section 5), rather than relying on rank strength alone.
2) Price & trend overview
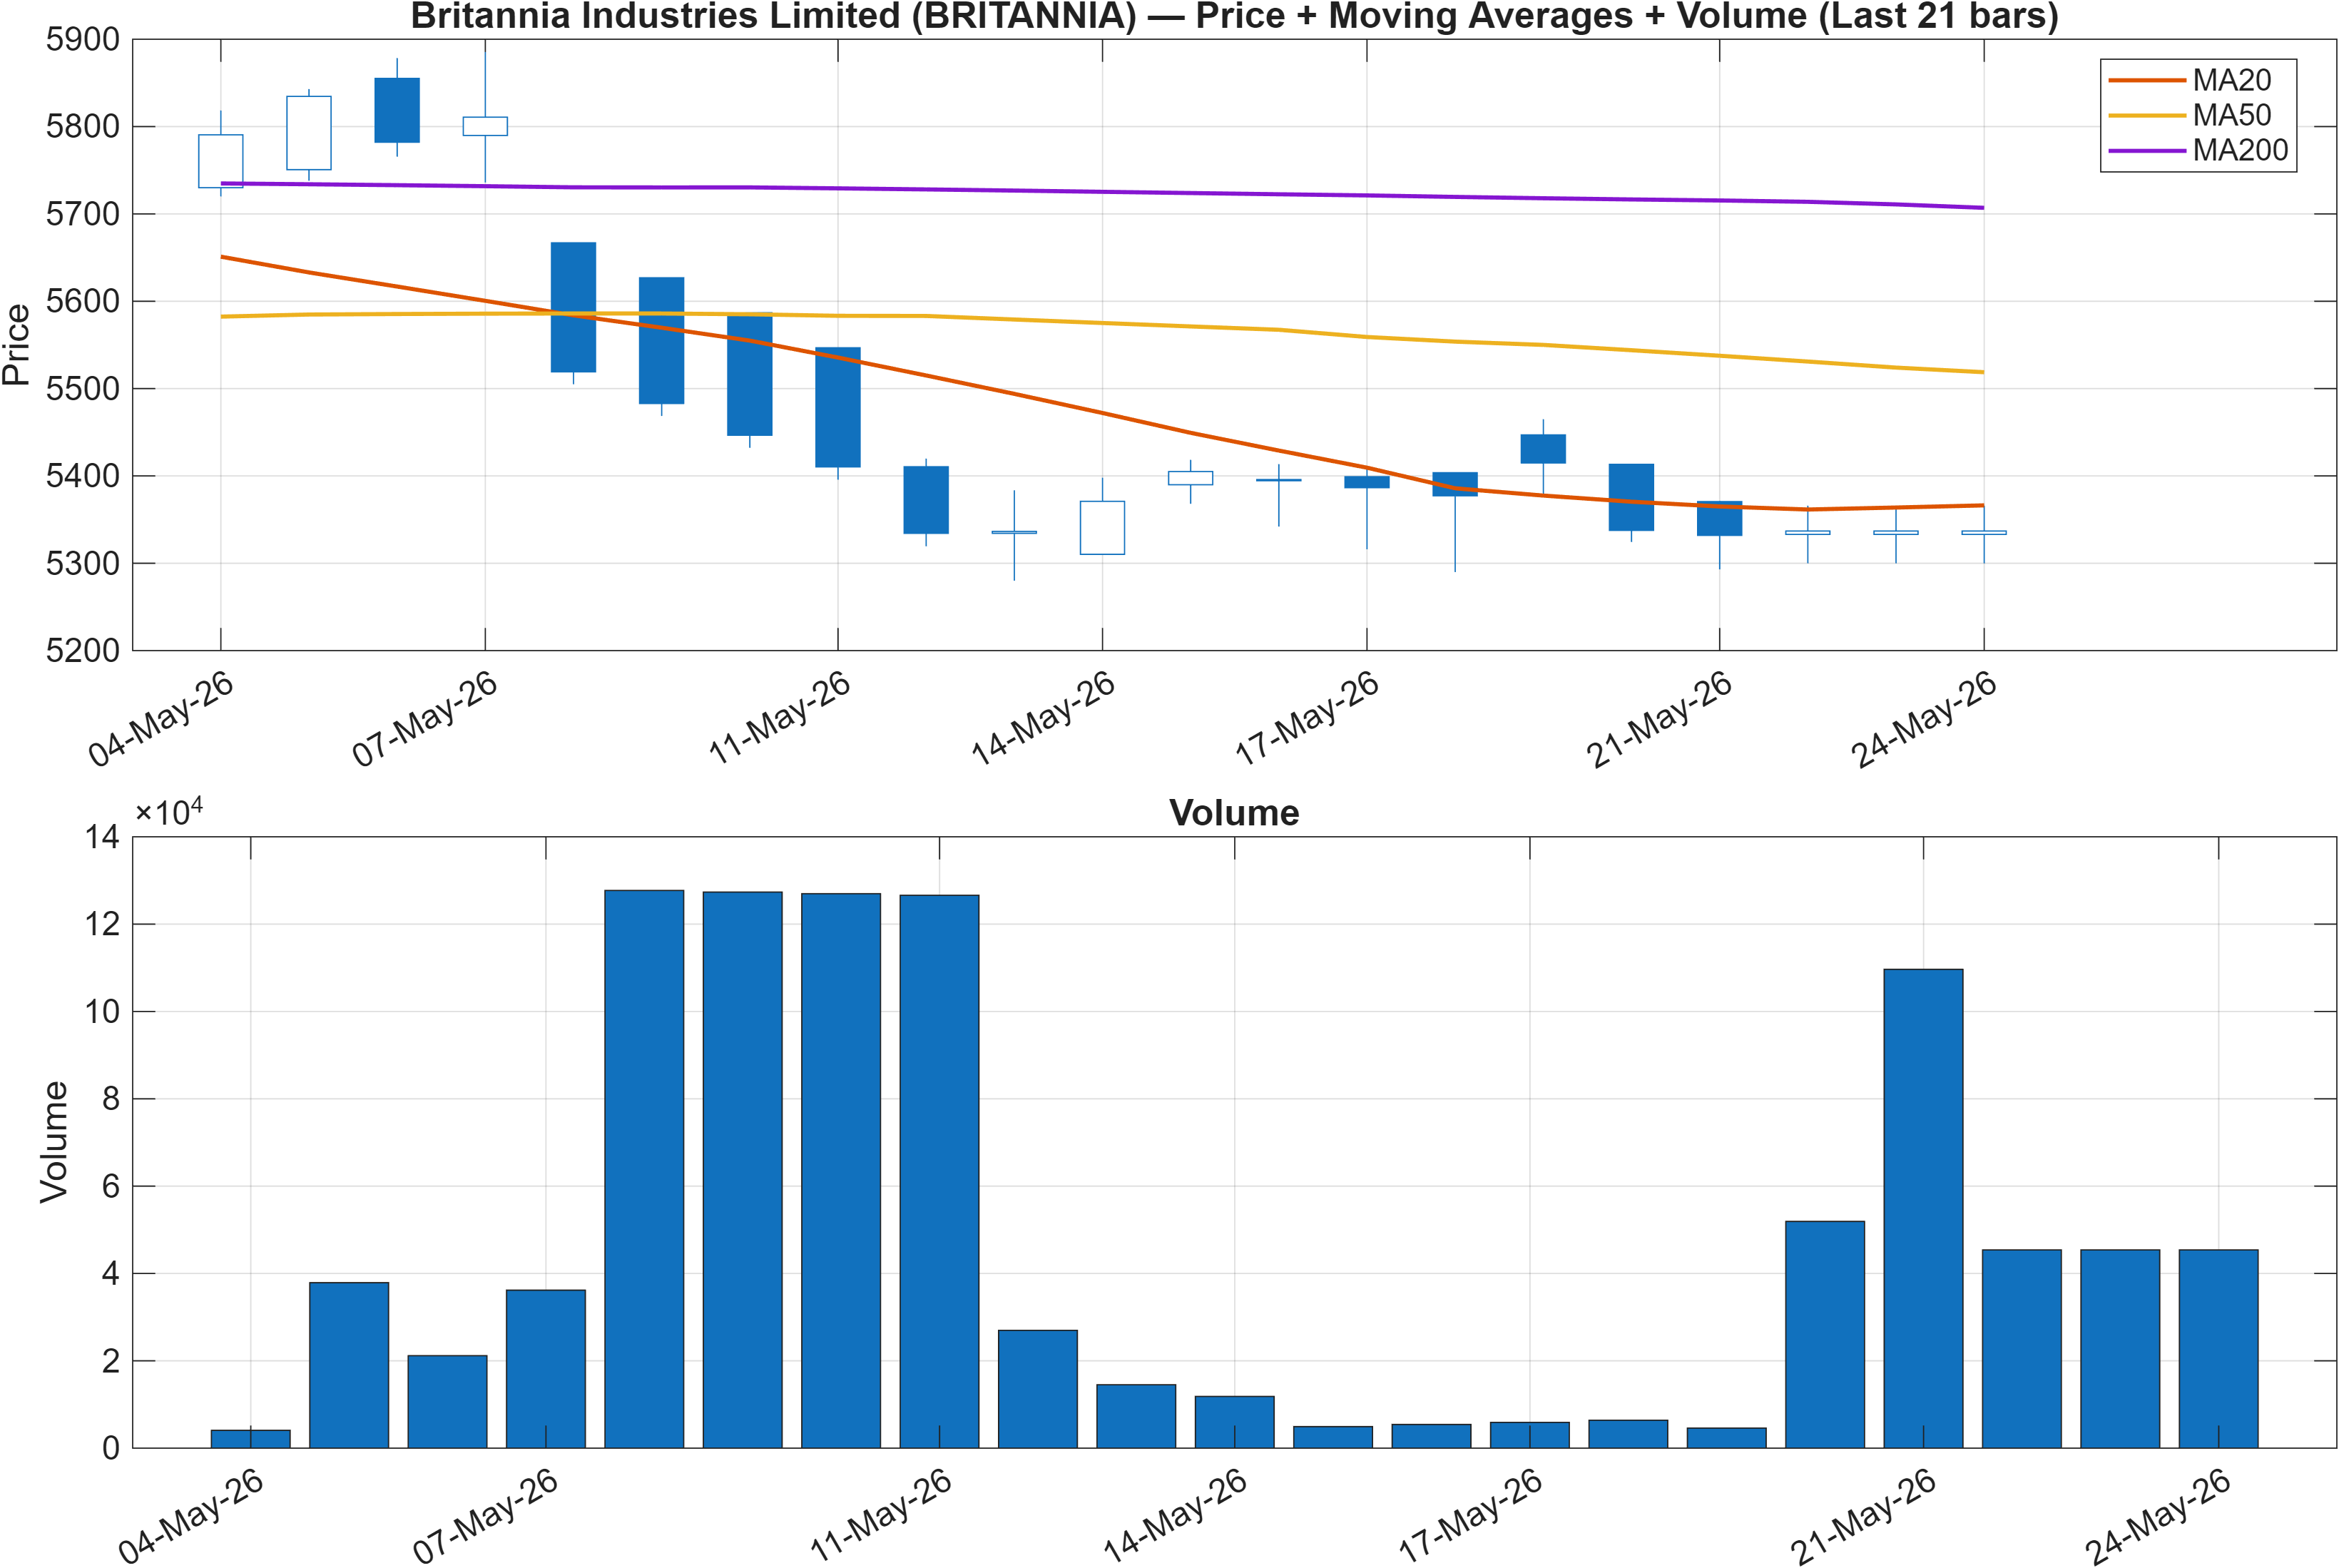
Interpretation: Close vs MA50 = Bearish, MA50 vs MA200 = Bearish.
Trend structure is currently characterized by dual moving-average friction: price is below the MA50 (Close vs MA50 = Bearish) and the MA50 is below the MA200 (MA50 vs MA200 = Bearish). This configuration typically implies that rallies face overhead supply until the short-to-intermediate average stops declining and begins to re-approach the long-term average.
The notable tension is that this trend posture coexists with stronger KGNAI ranks on longer horizons, including the Yearly rank #78 and especially the 6-Monthly rank #29. When rank strength and moving-average trend disagree, the market is often in a transition zone: either (a) the tape is early in a recovery process that ranks detect before moving averages flip, or (b) the longer-horizon relative ranking is holding up while the chart remains structurally weak.
The decision framework becomes more level-driven than narrative-driven. With support ~5305.1000 and resistance ~5810.5500, the chart is effectively defining the battleground where trend repair must occur. A move toward resistance without accompanying improvement in internal momentum (Section 3) and confluence (Section 5) can be consistent with a bear-market-style rebound. Conversely, stabilization above support while ranks remain favorable can signal that downside is being absorbed and that trend repair is underway, even if the MA50/MA200 relationship remains bearish for a time.
In short, the trend state is not yet “clean”, and the emphasis shifts to monitoring how price behaves when it interacts with the predefined zones rather than extrapolating from the moving averages alone.
3) Momentum & volatility dashboard
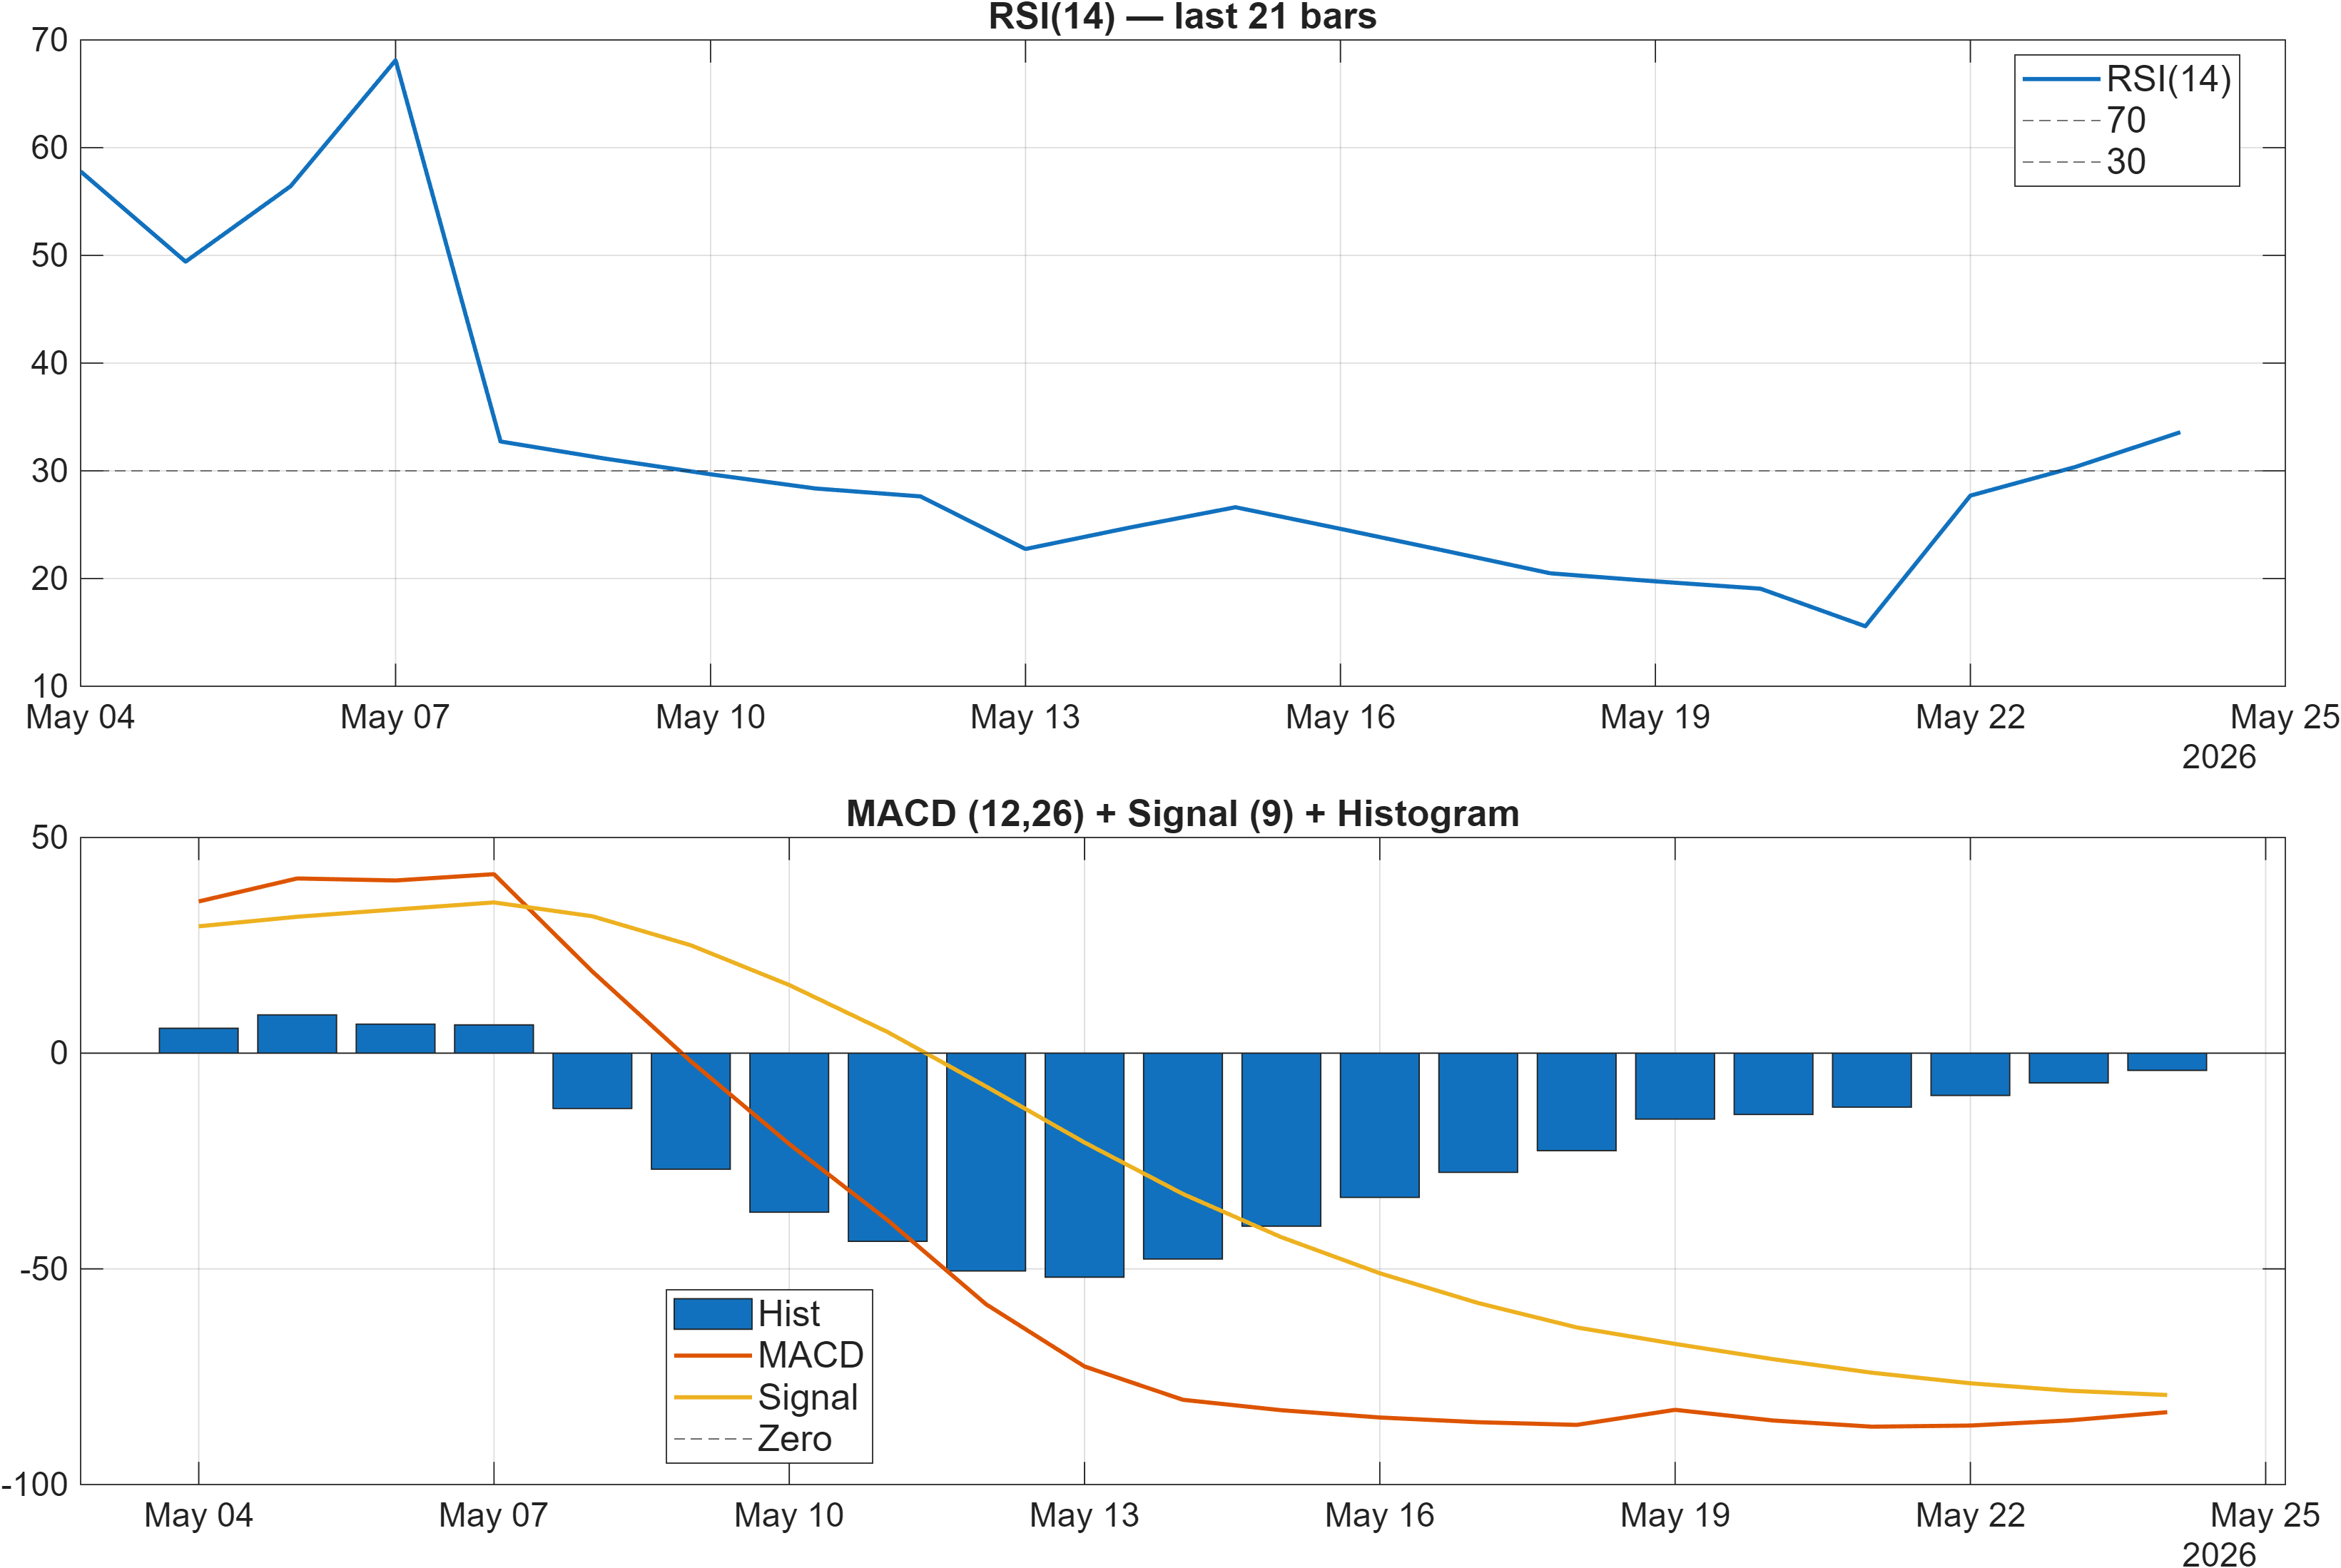
Interpretation: RSI bias = Bearish, MACD hist = -3.9857.
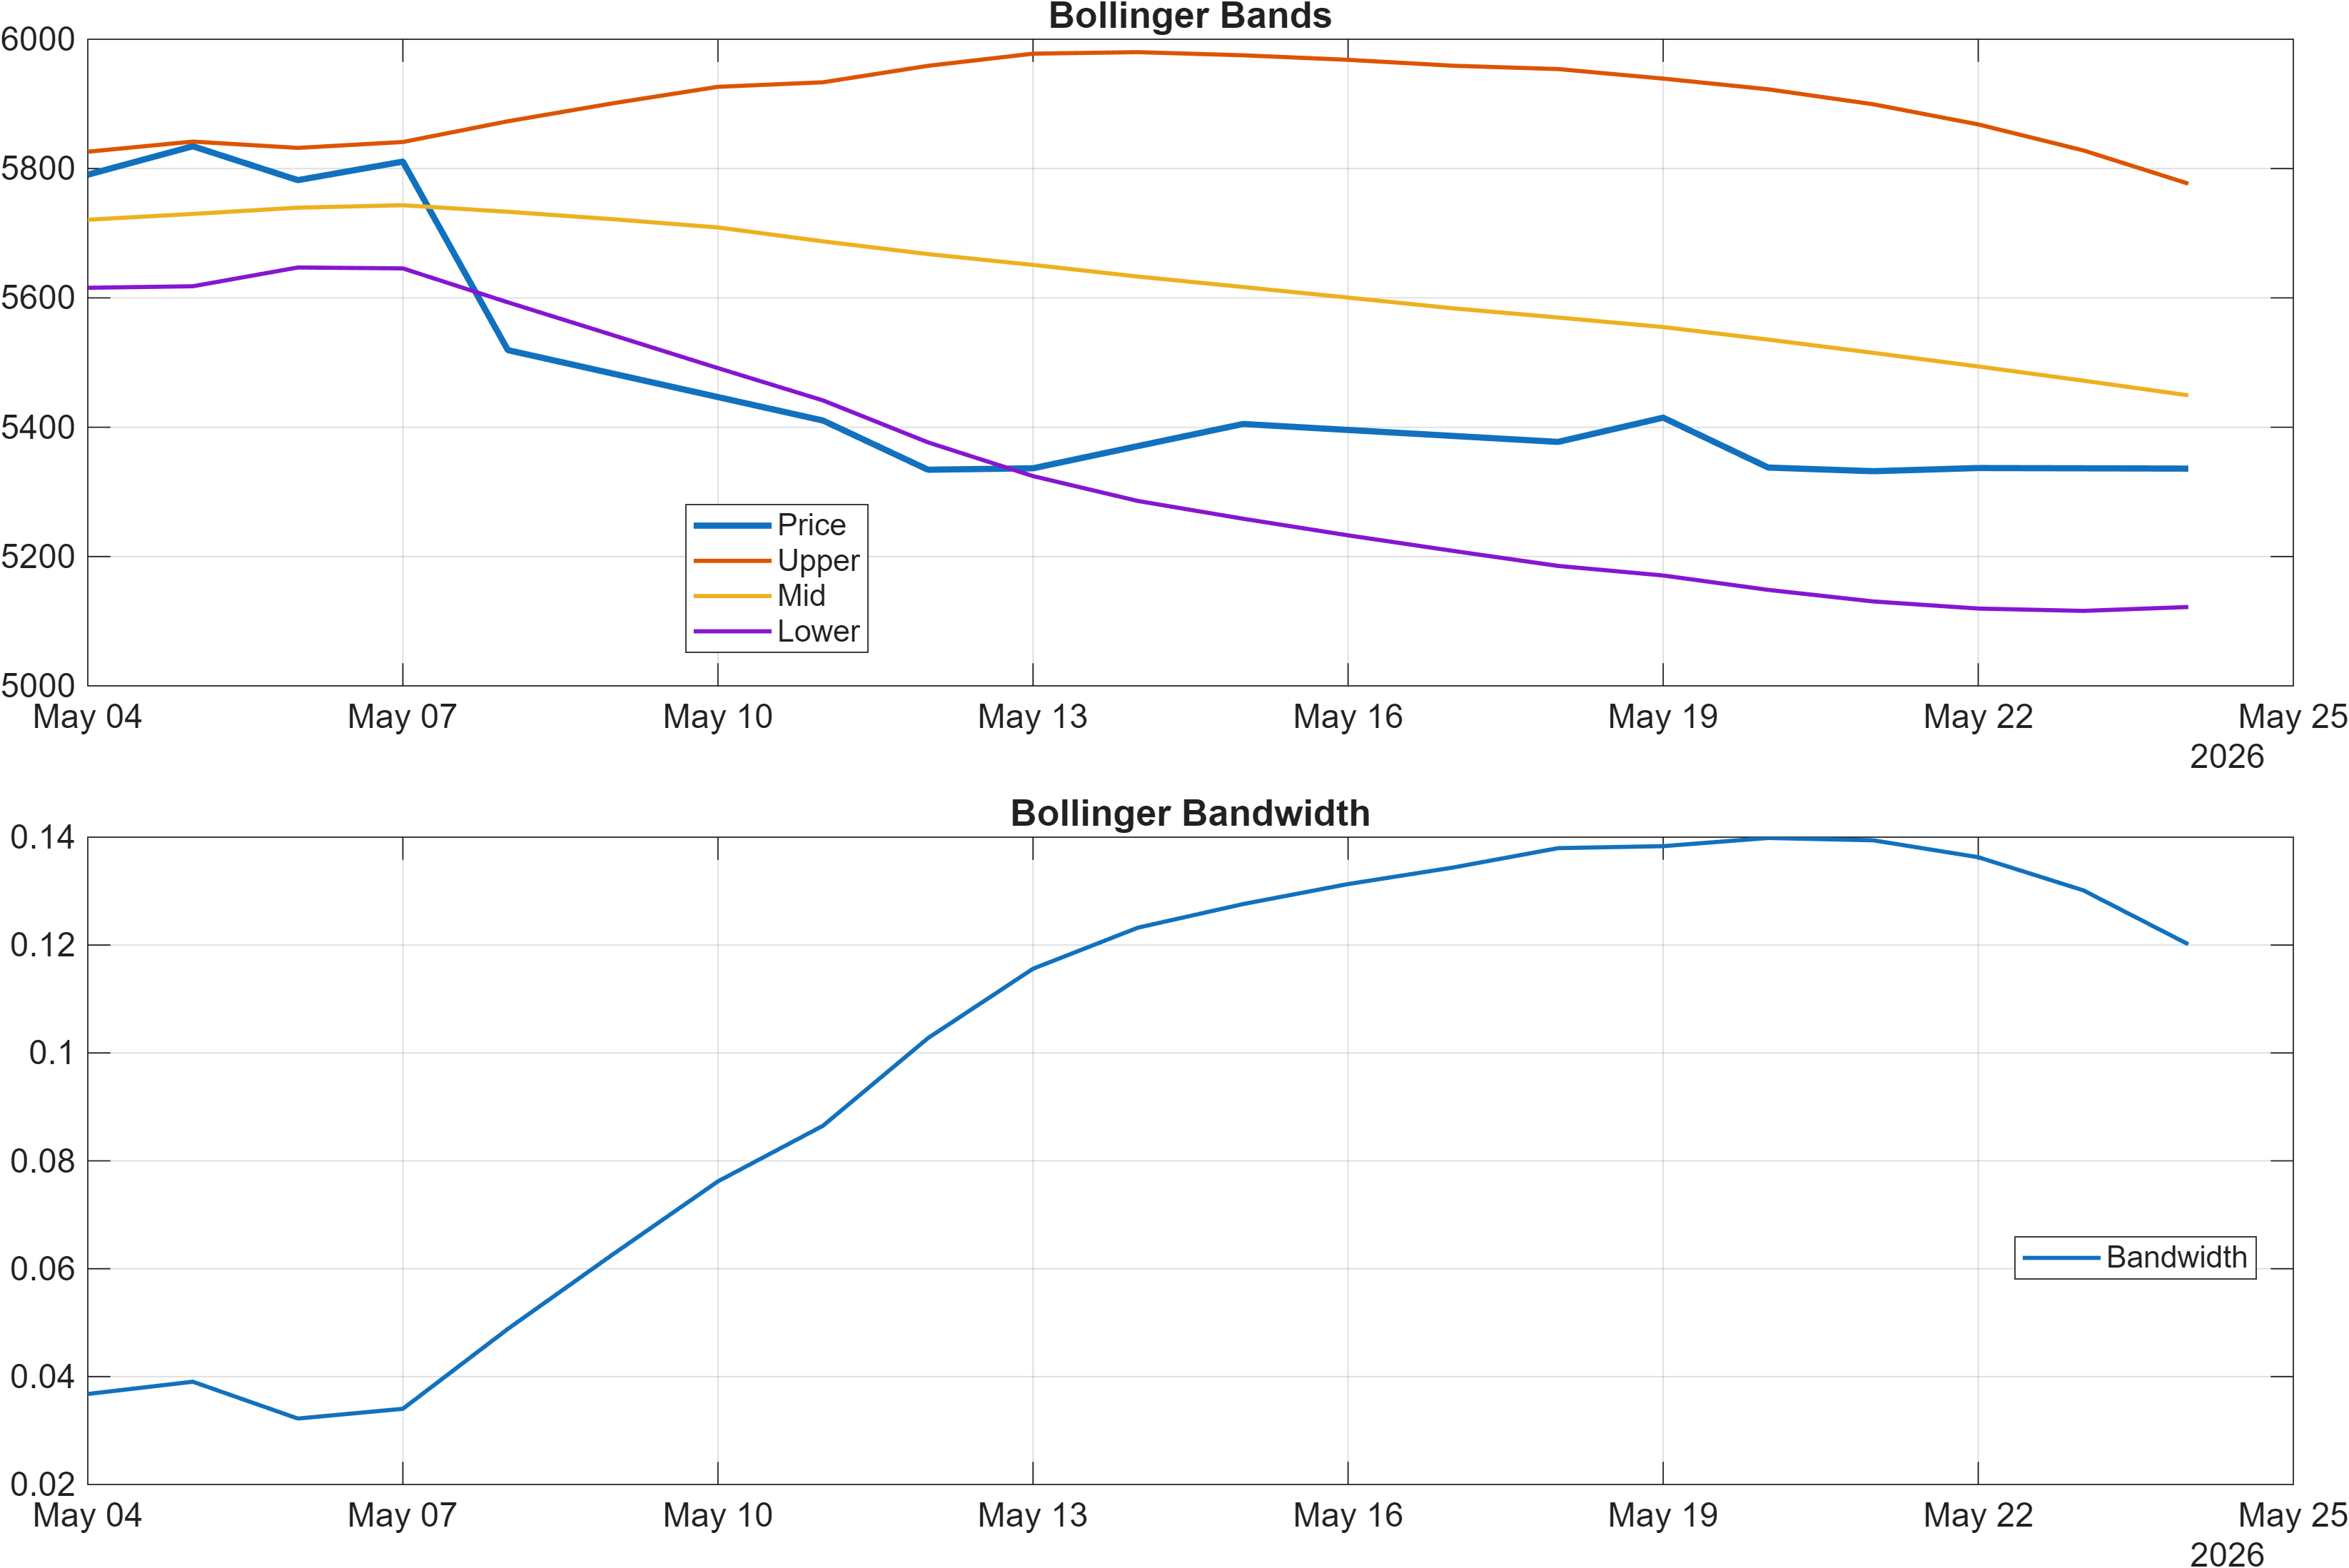
Interpretation: Bandwidth (volatility regime) latest = 0.1201.
Momentum currently leans defensive. The RSI(14) at 33.59 carries a bearish bias, consistent with a market that has not yet re-established sustained upside momentum. The MACD histogram at -3.9857 also remains negative, reinforcing that downside pressure has not fully cleared from the intermediate rhythm of returns.
The volatility regime adds context rather than direction. Bollinger Bandwidth at 0.1201 suggests a relatively contained volatility state compared with more “expansive” regimes. In practice, a lower bandwidth environment often precedes a directional move, but it does not specify whether the move resolves up or down. That makes the nearby price levels (support/resistance) more relevant as probabilistic pivot zones than a pure momentum chase.
There are early signs of potential stabilization, but they are not dominant within the momentum set. For example, the Stochastic %K is 26.8 (Neutral), which can occur as a market moves from weak to basing—yet the broader momentum readings remain negative, including ROC(20) at -8.545. The net message is asymmetry: momentum is still a constraint, so any bullish longer-horizon ranking is best interpreted as “relative resilience,” not immediate trend confirmation.
A more durable shift would typically be reflected by improvement in RSI behavior (moving away from the low-30s) and a MACD histogram that begins to contract toward zero. Until then, the momentum dashboard argues for treating upside attempts as needing confirmation rather than assuming persistence.
4) Support / Resistance zones
Support ~ 5305.1000 | Resistance ~ 5810.5500
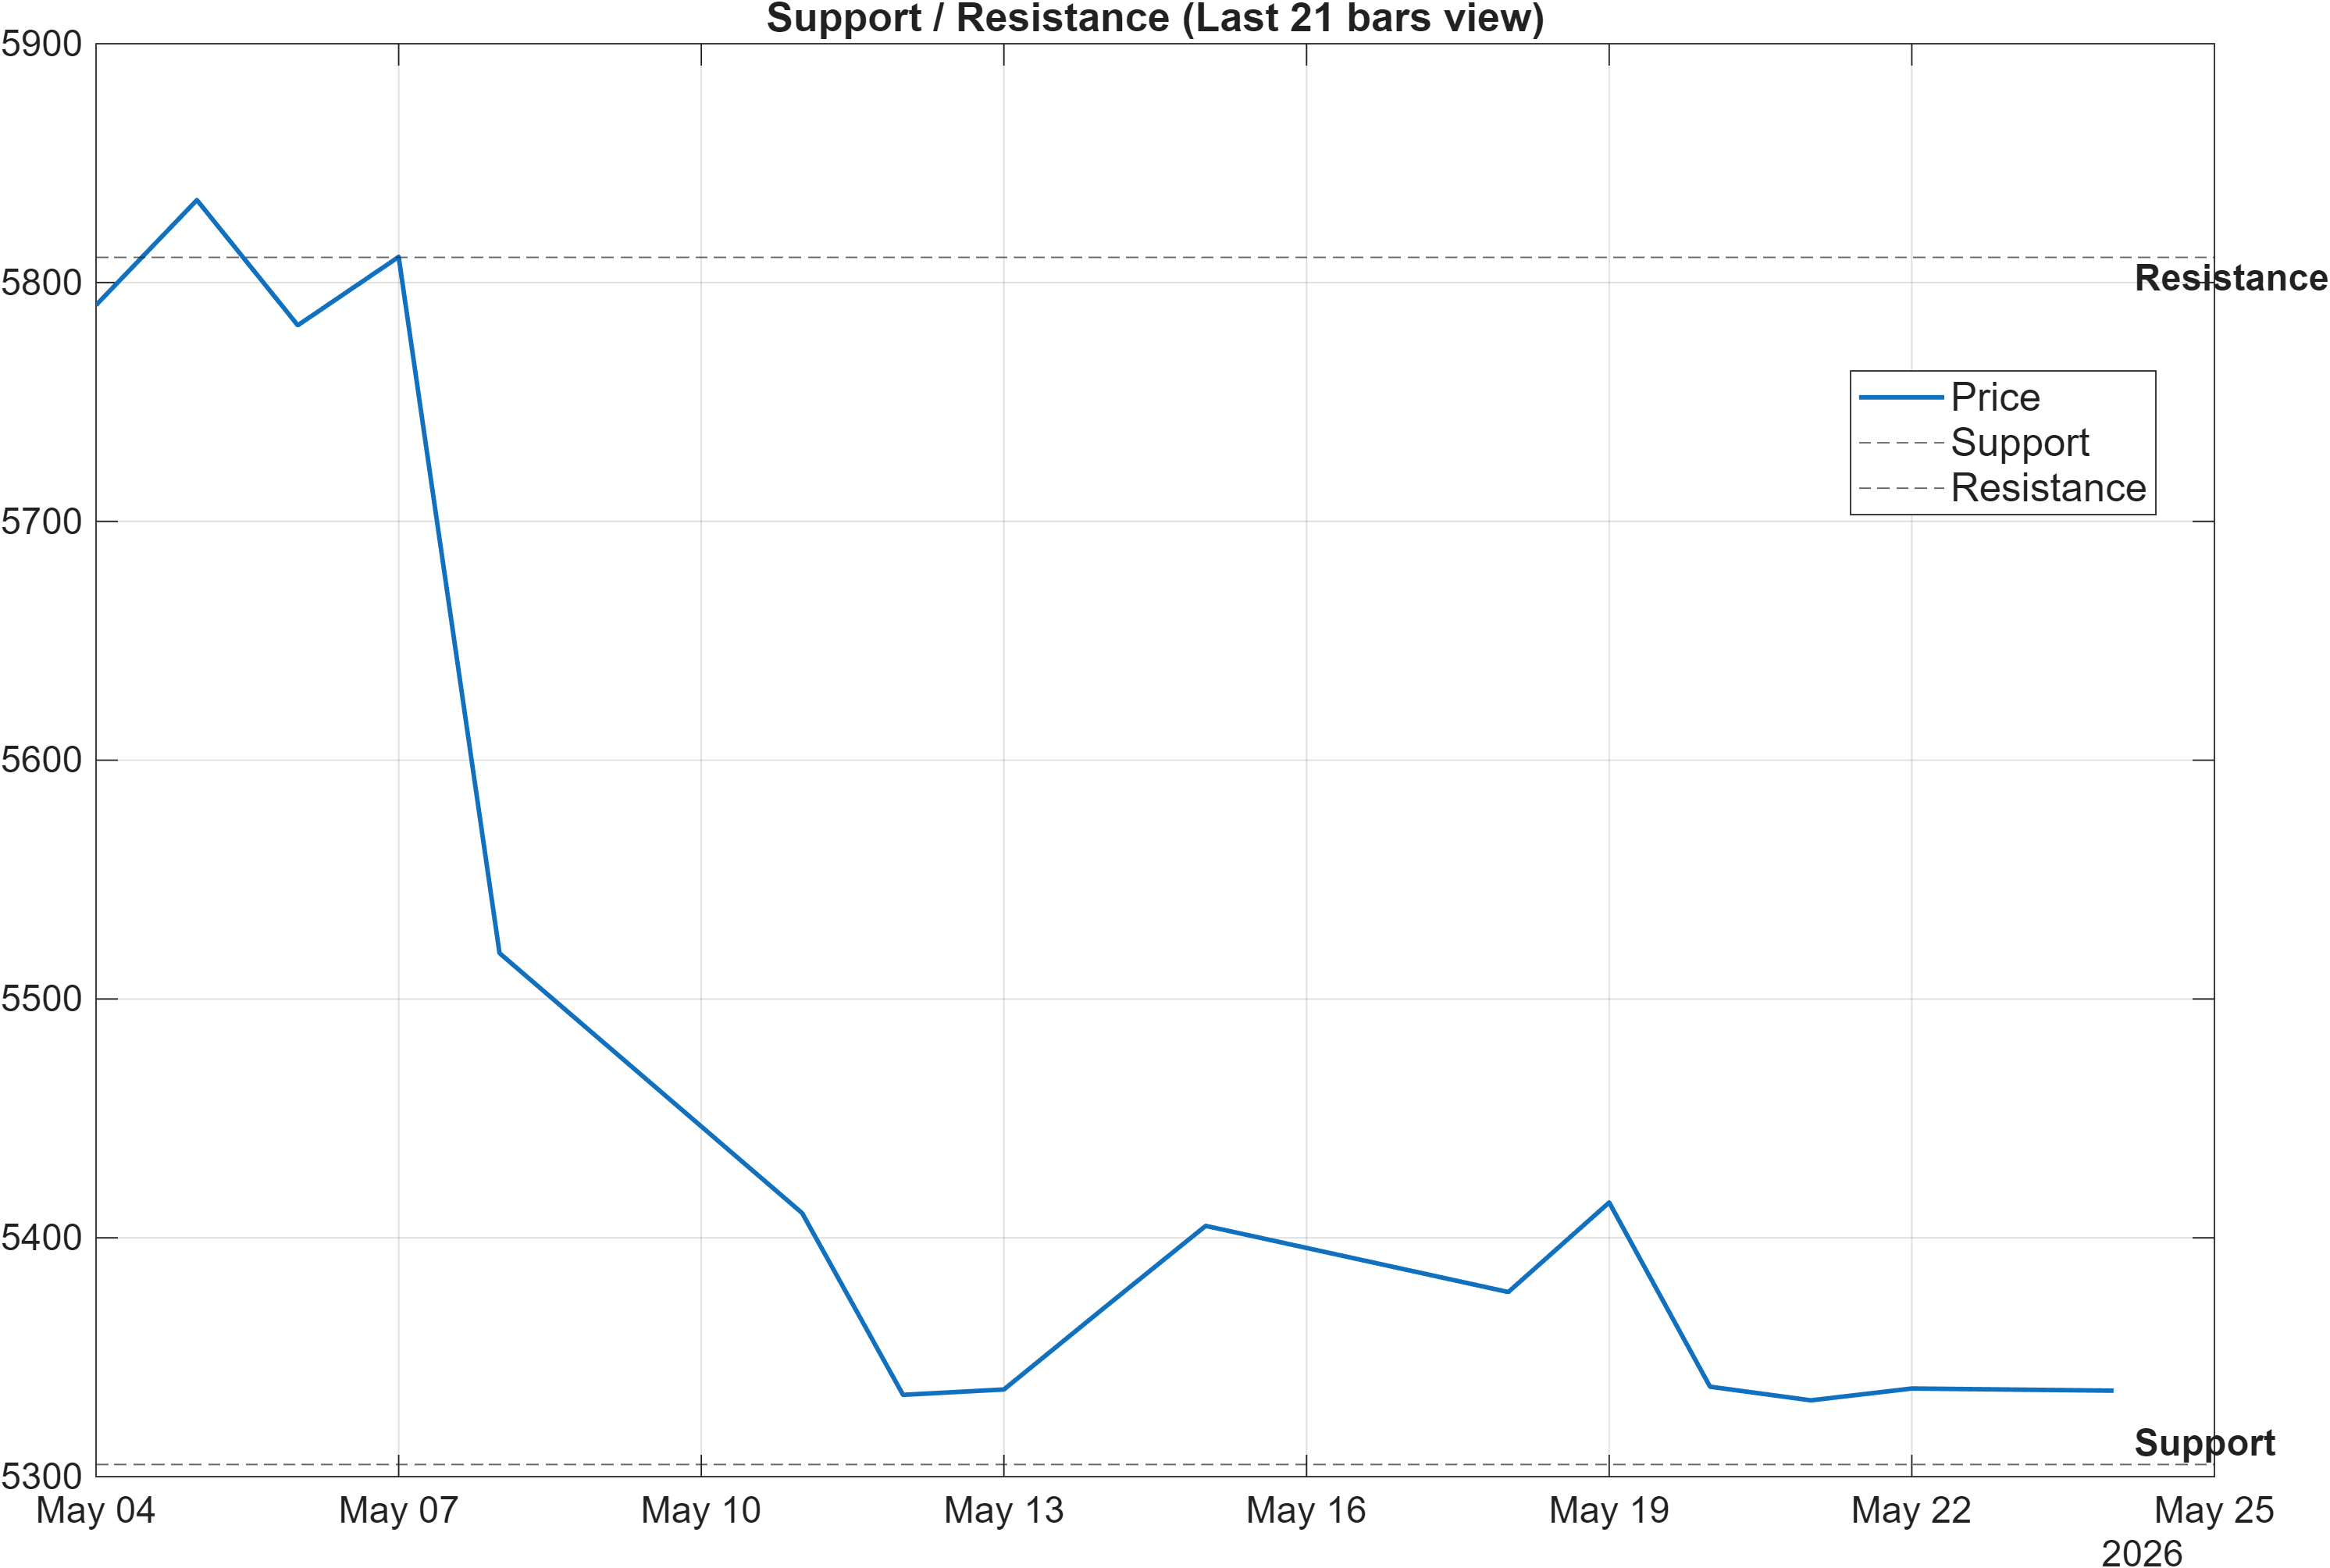
Scenario view: Break above resistance with volume → continuation. Close below support → signal deterioration risk.
The current setup is best handled as a two-sided level map rather than a one-direction forecast. With support at 5305.1000 and resistance at 5810.5500, BRITANNIA is framed by a relatively tight decision corridor for swing-trend evaluation. These zones matter more given the mixed signal stack: longer-horizon ranks are strong (e.g., #29 on the 6-month window), while trend and momentum indicators remain pressured.
On the upside, the scenario condition is explicit: a break above 5810.5500 with volume supports continuation. This is particularly relevant because several internal measures remain bearish (e.g., MACD histogram -3.986 in the signal table and bearish MA relationships), so a resistance break accompanied by volume would function as a confirmation event—a sign that buyers are not only lifting price but doing so with participation.
On the downside, a close below 5305.1000 increases deterioration risk. That would be consistent with the bearish elements already present in momentum (e.g., RSI(14) 33.59, ROC(20) -8.545) and would likely pressure the currently favorable mid/long rankings over time if the weakness persists.
Between these levels, the more defensible approach is to monitor how price behaves near each zone—rejection versus acceptance—rather than over-weighting any single indicator. The defined boundaries provide a clean framework for aligning risk with observable market behavior.
5) Quant Technical Dashboard (18 Signals)
KGNAI AI Technical Analysis Score (Deep Reinforcement Learning): Rank #656 out of 1220 (Rank 1 represents the strongest technical positioning and a higher probability of favorable price behavior. As ranks increase toward the maximum, the probability of favorable outcomes weakens and bearish positioning becomes more dominant.) | Label: Neutral | Score: -0.075
18-Signal Technical Confluence Score: -0.389 (Bearish)
Overall Technical Score (18-signal confluence + DRL rank blend): -0.295 (Neutral)
Note: The blended score reflects signal strength weighted against broader AI technical ranking, which may temporarily diverge.
Blended technical score breakdown: -0.295 (Neutral | Bull 3 / Bear 10 / Neutral 5)
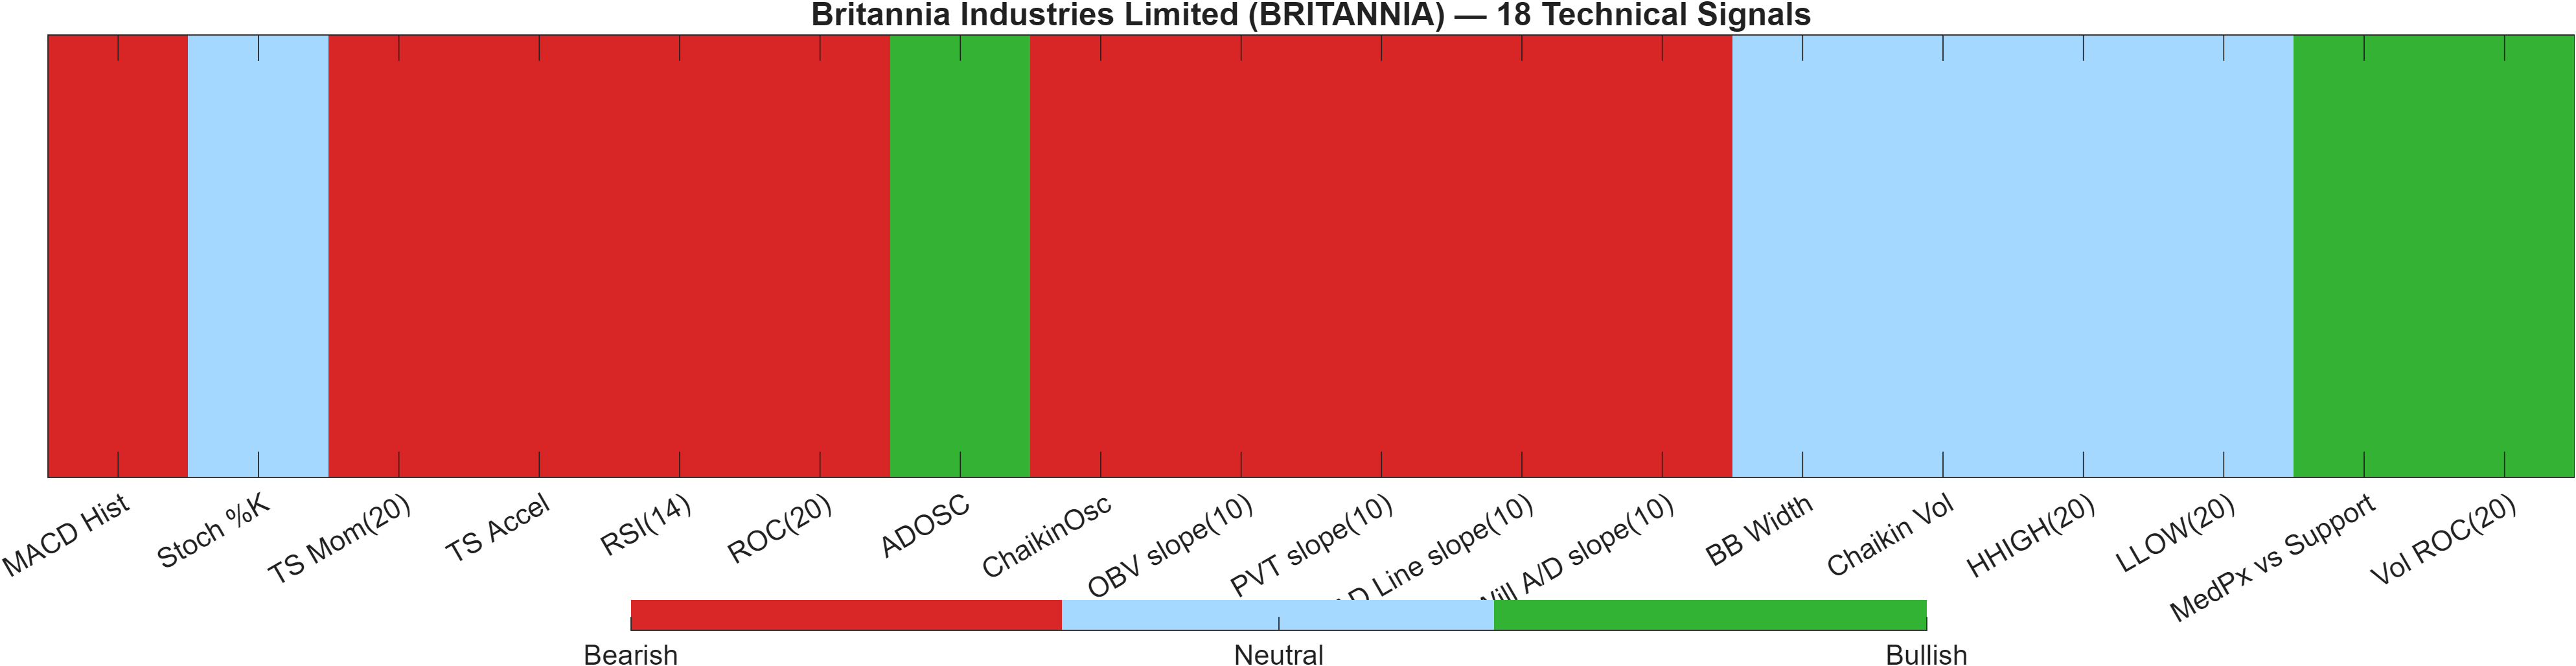
Signal table (Bull/Bear/Neutral)
| Indicator | Value | Signal |
|---|---|---|
| MACD Hist | -3.986 | Bearish |
| Stoch %K | 26.8 | Neutral |
| TS Mom(20) | -497.7 | Bearish |
| TS Accel | -742.7 | Bearish |
| RSI(14) | 33.59 | Bearish |
| ROC(20) | -8.545 | Bearish |
| ADOSC | 52.92 | Bullish |
| ChaikinOsc | -2.423e+04 | Bearish |
| OBV slope(10) | -1.244e+05 | Bearish |
| PVT slope(10) | -781.6 | Bearish |
| AD Line slope(10) | -1.003e+04 | Bearish |
| Will A/D slope(10) | -71.15 | Bearish |
| BB Width | 0.1201 | Neutral |
| Chaikin Vol | -23.35 | Neutral |
| HHIGH(20) | 5885 | Neutral |
| LLOW(20) | 5280 | Neutral |
| MedPx vs Support | 27.88 | Bullish |
| Vol ROC(20) | 19.81 | Bullish |
Interpretation: Indicator-level signals form the base confluence, which is then adjusted using a separate AI-driven technical ranking model. The final technical score summarizes this combined view.
The 18-signal set is currently skewed bearish at the indicator layer, but the higher-level blend softens that conclusion. The confluence score of -0.389 is explicitly bearish, consistent with a dashboard where 10 signals are Bearish versus only 3 Bullish. Yet the overall blended technical score -0.295 is labeled neutral, influenced by the separate DRL-based technical model (rank #656, score -0.075), which is not deeply negative.
The bearish cluster is concentrated in momentum and participation measures: MACD Hist -3.986 and RSI(14) 33.59 align with weakness, while multiple volume/breadth slopes (e.g., OBV slope(10) -1.244e+05) point to unfavorable accumulation dynamics. That combination often corresponds to rallies that struggle to sustain unless participation improves.
Offsetting this, a small set of bullish components highlights where stabilization could emerge. ADOSC 52.92 (Bullish) suggests some positive accumulation pressure in the mix, and Vol ROC(20) 19.81 (Bullish) indicates volume change is not uniformly contracting. Additionally, BB Width 0.1201 (Neutral) and the neutral high/low markers (HHIGH(20) 5885, LLOW(20) 5280) imply the market is operating within definable bounds rather than a chaotic volatility expansion.
The key analytical point is compression of conviction: the indicator layer is still negative, but the blended framework is no longer fully bearish. For tactical decision-making, that typically elevates the importance of confirming price action at 5810.5500 and defending 5305.1000.
6) News sentiment + extractive gist
Note: Instrument-specific news matches were not found, so the digest includes broader market/sector headlines. Links are provided for verification.
Sentiment score (avg): 0.143 | Positive: 37% | Neutral: 63% | Negative: 0%
KGNAI AI News Sentiment Score (normalized -1 to +1): 0.97 (as of 2026-05-01) | Label: Bullish | Overall news score: 0.90
Positive Developments
Recent coverage across major financial outlets indicates a constructive earnings-and-dividend backdrop in parts of the Indian large-cap landscape, with multiple reports emphasizing robust quarterly outcomes and shareholder return actions in select names. This matters for BRITANNIA primarily as market context, since instrument-specific matches were not available in the provided data. In aggregate, the news sentiment mix remains supportive—37% positive, 63% neutral, and 0% negative—which is consistent with the elevated KGNAI normalized score of 0.97 (as of 2026-05-01) and overall news score of 0.90. From a market-structure perspective, such a tone can help sustain bid behavior during technical basing phases, even when indicators like RSI and MACD remain weak. The main takeaway is not a company-specific catalyst, but a favorable informational regime that can reduce headline drag while price tests key zones.
Neutral / Mixed Developments
The neutral portion of the digest clusters around macro-sensitive positioning and near-term uncertainty across risk assets, with commentary that frames markets as responsive to upcoming earnings, policy expectations, and shifting risk premia. With 63% neutral items dominating the distribution, the message is that information flow is more context-setting than directional. For BRITANNIA, this aligns with the broader signal picture: longer-horizon ranks remain constructive (e.g., Monthly #86, 3-Monthly #79), but trend and momentum still show friction. In such environments, neutral news flow tends to reinforce a range-and-level regime, where support at 5305.1000 and resistance at 5810.5500 can act as the primary trading reference points until a clearer catalyst or technical break develops.
Negative / Risk Signals
Although the aggregated sentiment shows 0% negative in the scoring breakdown, the risk-oriented items embedded in broader coverage highlight potential volatility triggers—notably around global risk appetite, positioning unwind dynamics, and the sensitivity of equities to shifting institutional flows. This matters because BRITANNIA’s technical internals are not fully repaired: the 18-signal confluence score -0.389 (Bearish) and momentum readings (e.g., MACD histogram -3.9857) suggest that the chart may be more vulnerable to adverse risk shocks than a fully trend-aligned instrument. In other words, even if the longer-horizon ranking remains favorable, downside events can express quickly when participation measures are weak. Risk-aware interpretation keeps the focus on the explicit invalidation condition: a close below 5305.1000 would align technical weakness with any adverse backdrop, increasing the probability of follow-through selling.
- What to monitor next: Whether price can approach 5810.5500 with improving participation versus renewed rejection.
- What to monitor next: Whether momentum indicators (RSI/MACD) show contraction of bearish pressure while volatility (BB Width 0.1201) remains contained.
- What to monitor next: Any change in the balance between neutral and positive coverage, given the current 0.143 average sentiment and 0% negative share.
Sources referenced: Reuters, Bloomberg, Yahoo Finance, MarketWatch, Investing.com
7) Sources
Not available in the provided data.
You may also like: How KGNAI AI ranks instruments across global markets
Disclaimer: KGNAI provides AI-generated analytics and educational market commentary only. This is not financial advice. Markets involve risk. Always do your own research.