
IDFCFIRSTB (IDFC First Bank Ltd) Technical Outlook — 27-May-2026 | Neutral Short-Term, Bearish Mid-Term Bias
IDFC First Bank Ltd (IDFCFIRSTB) sits at a cross-current between constructive near-term technical posture and weaker medium-horizon relative ranking. Across KGNAI’s 1221-instrument India universe, the short-term rank reads Neutral while the monthly and 3-month ranks fall into Bearish territory, signaling that recent price behavior has not translated into durable, cross-sectional leadership. Technically, trend structure remains supportive with price holding above key moving averages, and momentum gauges (notably RSI and MACD histogram) skew positive. At the same time, the volatility regime looks compressed via Bollinger bandwidth, raising the odds of a directional expansion that will require confirmation at defined decision zones. News sentiment is positively biased in the provided dataset, but it is not instrument-specific; it should be treated as contextual rather than catalytic. The focus below is alignment versus divergence: where signals agree, and where confirmation is still required.
- Rank stance: Short-term Neutral; Mid-term Bearish; Long-term Neutral.
- Technical confluence: 18-signal confluence is Neutral, while the blended technical score is Bullish—a mild positive tilt with caveats.
- Key levels: Support ~ 59.2200 and resistance ~ 70.8950 define the primary decision corridor.
- News sentiment bias: Positive in the provided digest (not instrument-specific).
- Confirmation / invalidation: A break above 70.8950 with volume supports continuation; a close below 59.2200 increases deterioration risk.
What KGNAI Measures
KGNAI evaluates assets using large cross-sectional datasets built from millions of structured data points. Inputs incorporate fundamental metrics, technical structures, and systematically processed news sentiment. Statistical models, machine learning, and AI frameworks are used to assess relative positioning, signal alignment, and probabilistic behavior across broad universes.
How to Read This Report
- Ranks are comparative across the tracked universe, not absolute price targets.
- Confluence reflects alignment among independent signal groups.
- Support/resistance levels are probabilistic decision zones, not guarantees.
- Sentiment provides contextual bias within the broader analytical framework.
1) KGNAI AI Analysis
Region: INDIA
Total universe size: 1221 ranked instruments
- Daily rank: #555 out of 1221 — Neutral
- Weekly rank: #848 out of 1221 — Neutral
- Monthly rank: #1141 out of 1221 — Bearish
- 3-Monthly rank: #1003 out of 1221 — Bearish
- 6-Monthly rank: #868 out of 1221 — Neutral
- Yearly rank: #964 out of 1221 — Neutral
The rank stack is best read as a time-horizon divergence. The daily rank at #555 places IDFCFIRSTB near the middle of the universe (broadly “market-like” behavior), while the weekly rank at #848 drifts into the weaker half. More notably, the monthly rank at #1141 and 3-month rank at #1003 sit in the lower tier, indicating that medium-horizon cross-sectional strength remains limited even if the near-term tape appears constructive.
This configuration often shows up when short-term technicals improve faster than relative leadership. In practice, it argues for tighter confirmation standards: constructive setups can work, but they tend to be more sensitive to failed breakouts and liquidity-driven reversals when the medium-term rank picture is still bearish. The longer-term ranks are not decisively negative—#868 (6-month) and #964 (year) are labeled Neutral—suggesting the asset is not in clear long-horizon leadership or capitulation.
The stated term view—Short-term Neutral, Mid-term Bearish, Long-term Neutral—fits a “selective participation” profile. For decision-making, treat any near-term strength as needing validation through levels and breadth-style confirmation from independent signals (momentum, volume/flow proxies, and volatility regime), rather than assuming persistence from a single improvement in rank.
Want the full universe and complete rank tables? Unlock full access on KGNAI: https://www.kgnai.com/pricing
2) Price & trend overview
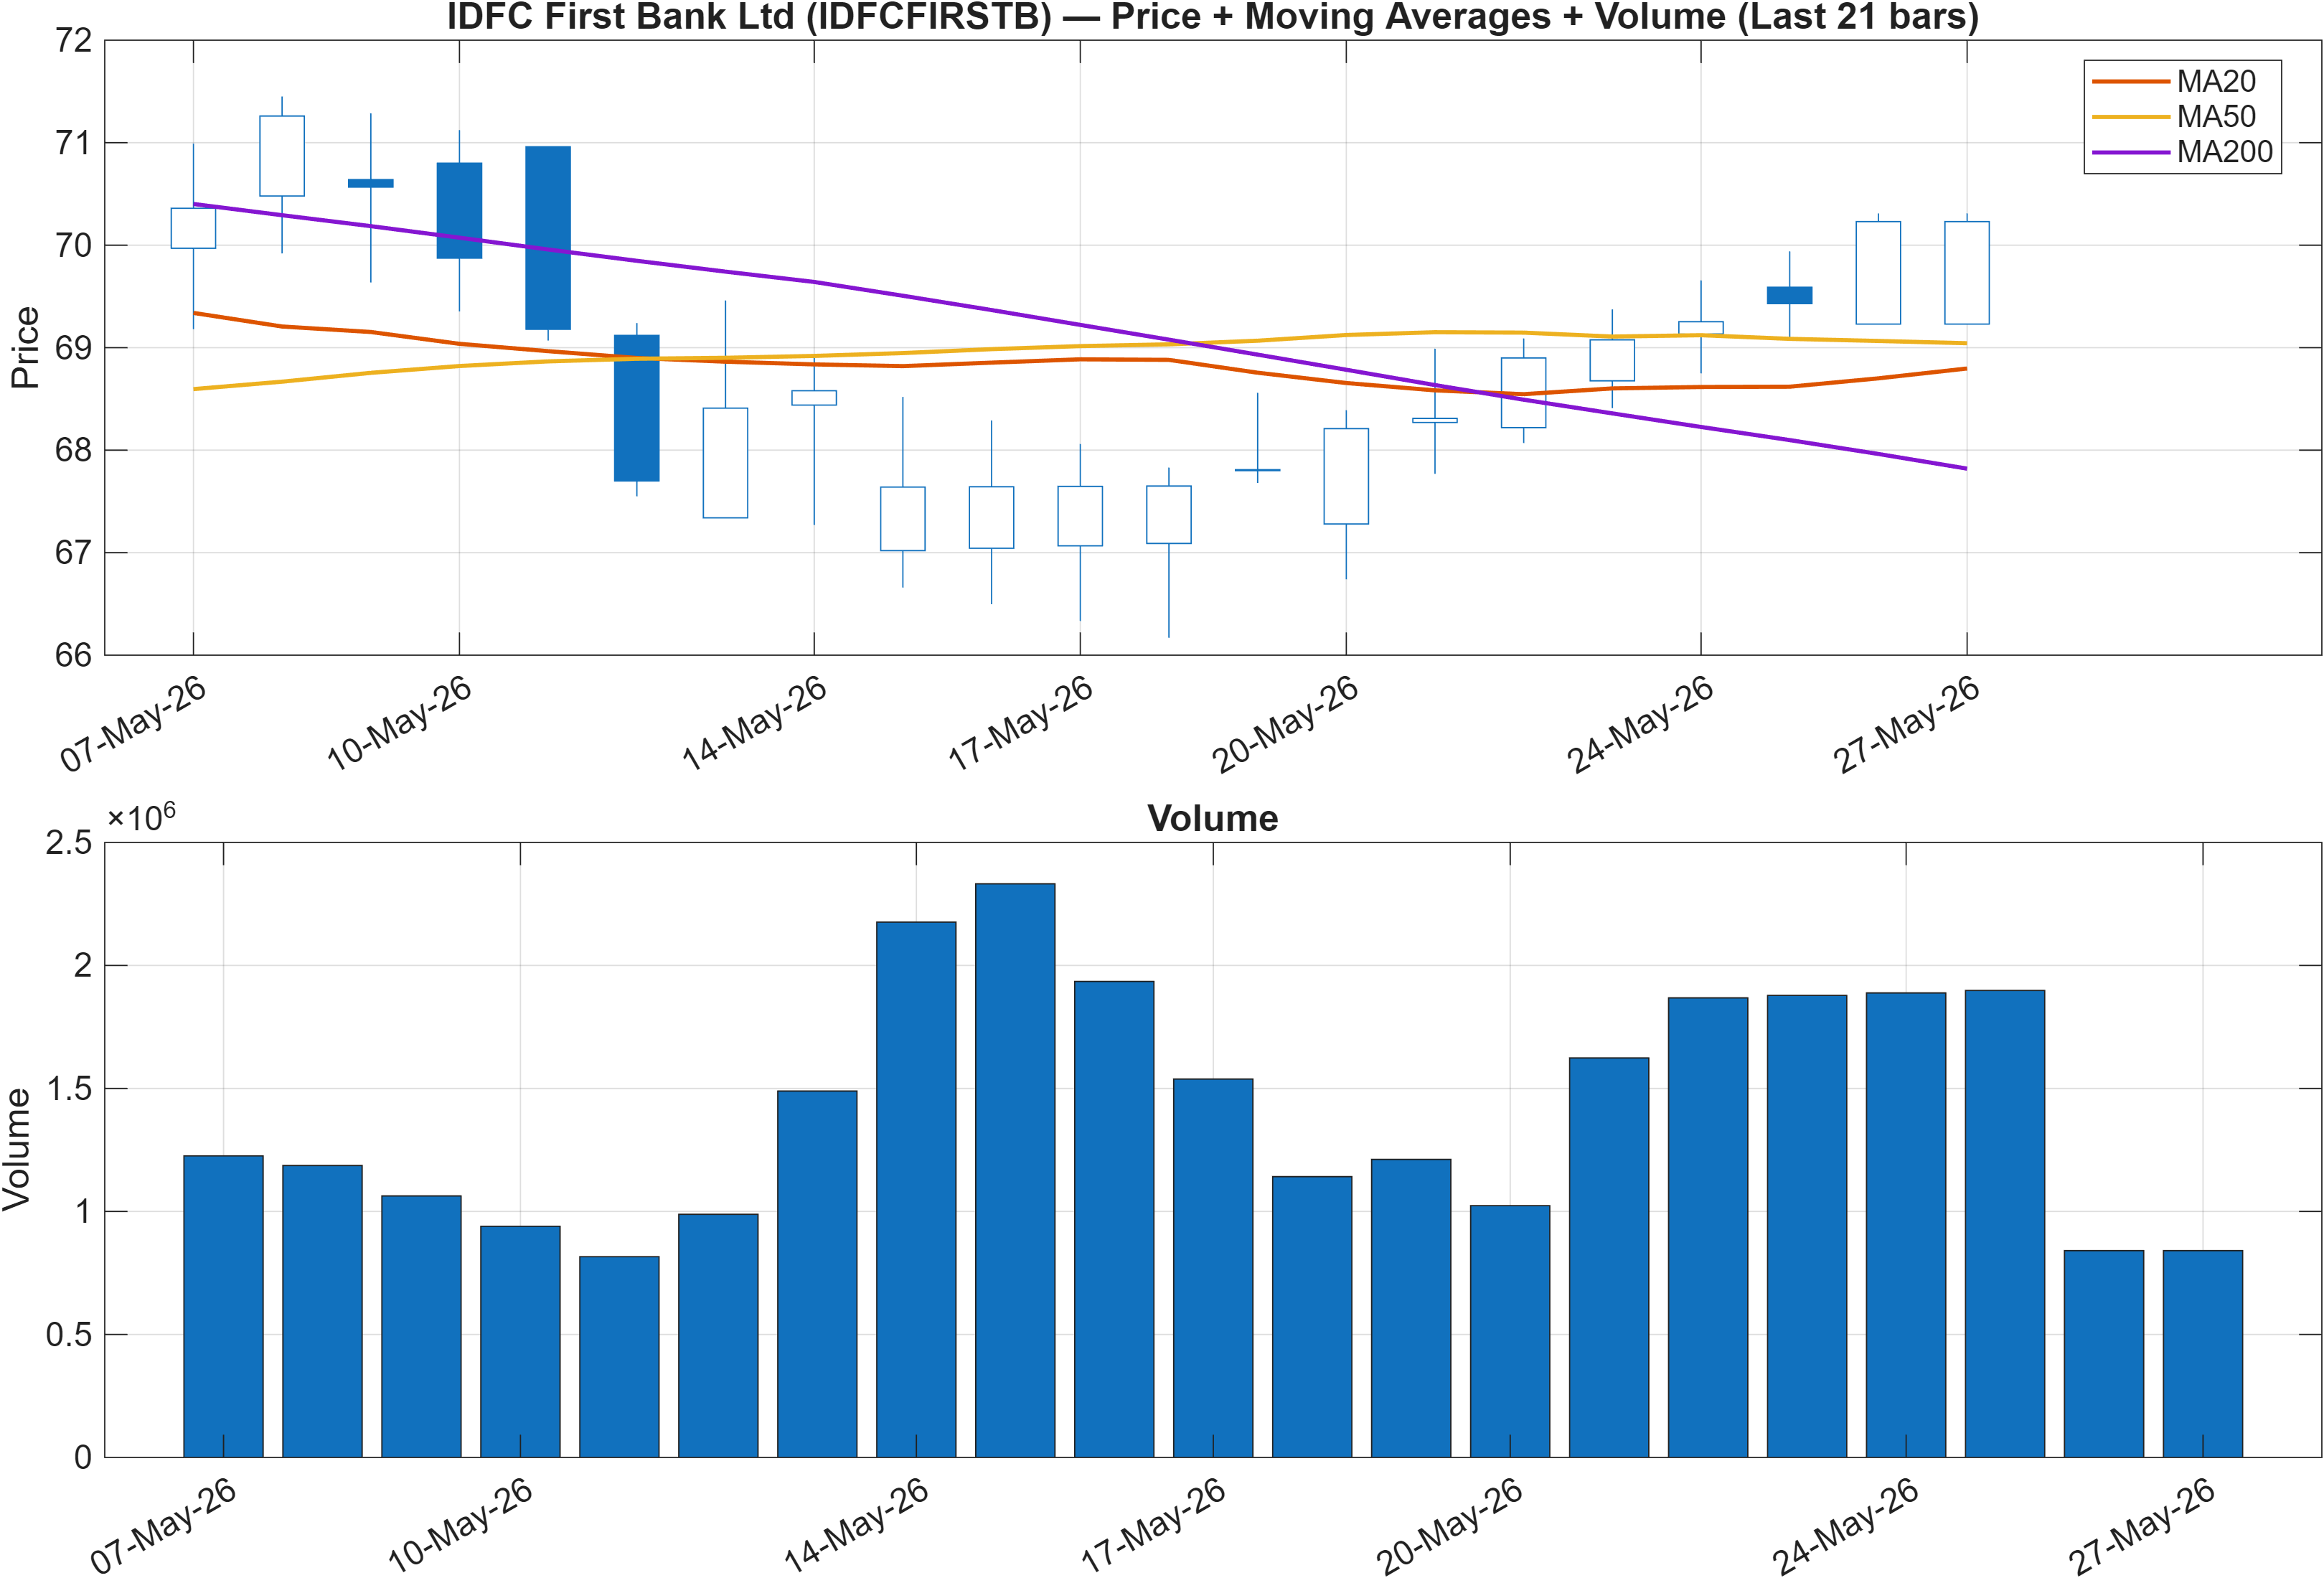
The trend read is constructive on the classic moving-average map: close vs MA50 is Bullish and MA50 vs MA200 is Bullish. That combination typically reflects a market that has established a higher time-frame trend structure, even if the more recent return window has been uneven enough to keep the medium-term rank picture bearish (monthly #1141).
Alignment vs. divergence: structure supports, ranking lags
The key analytical tension is that a bullish MA stack can coexist with weak cross-sectional ranking when the move is either (a) maturing and becoming more mean-reversion-prone, or (b) still not strong enough versus peers to be classified as leadership. Here, the daily rank near the midpoint (#555) supports the idea that price action may be improving, but not yet exhibiting persistent outperformance.
What “trend bullish” does—and doesn’t—confirm
A bullish MA relationship is a state descriptor, not an all-clear. Confirmation still depends on whether momentum can remain constructive (RSI bias bullish; MACD histogram 0.1506) while volatility transitions from compression (bandwidth ~ 0.0646) into an expansion that holds above key levels. The nearby resistance zone at 70.8950 is therefore not just a price ceiling; it is the level where the trend story either graduates into continuation, or fails into range behavior.
Practically, this section argues that trend structure is supportive, but the broader model framing still treats the setup as confirmation-dependent, consistent with the Neutral short-term stance.
3) Momentum & volatility dashboard
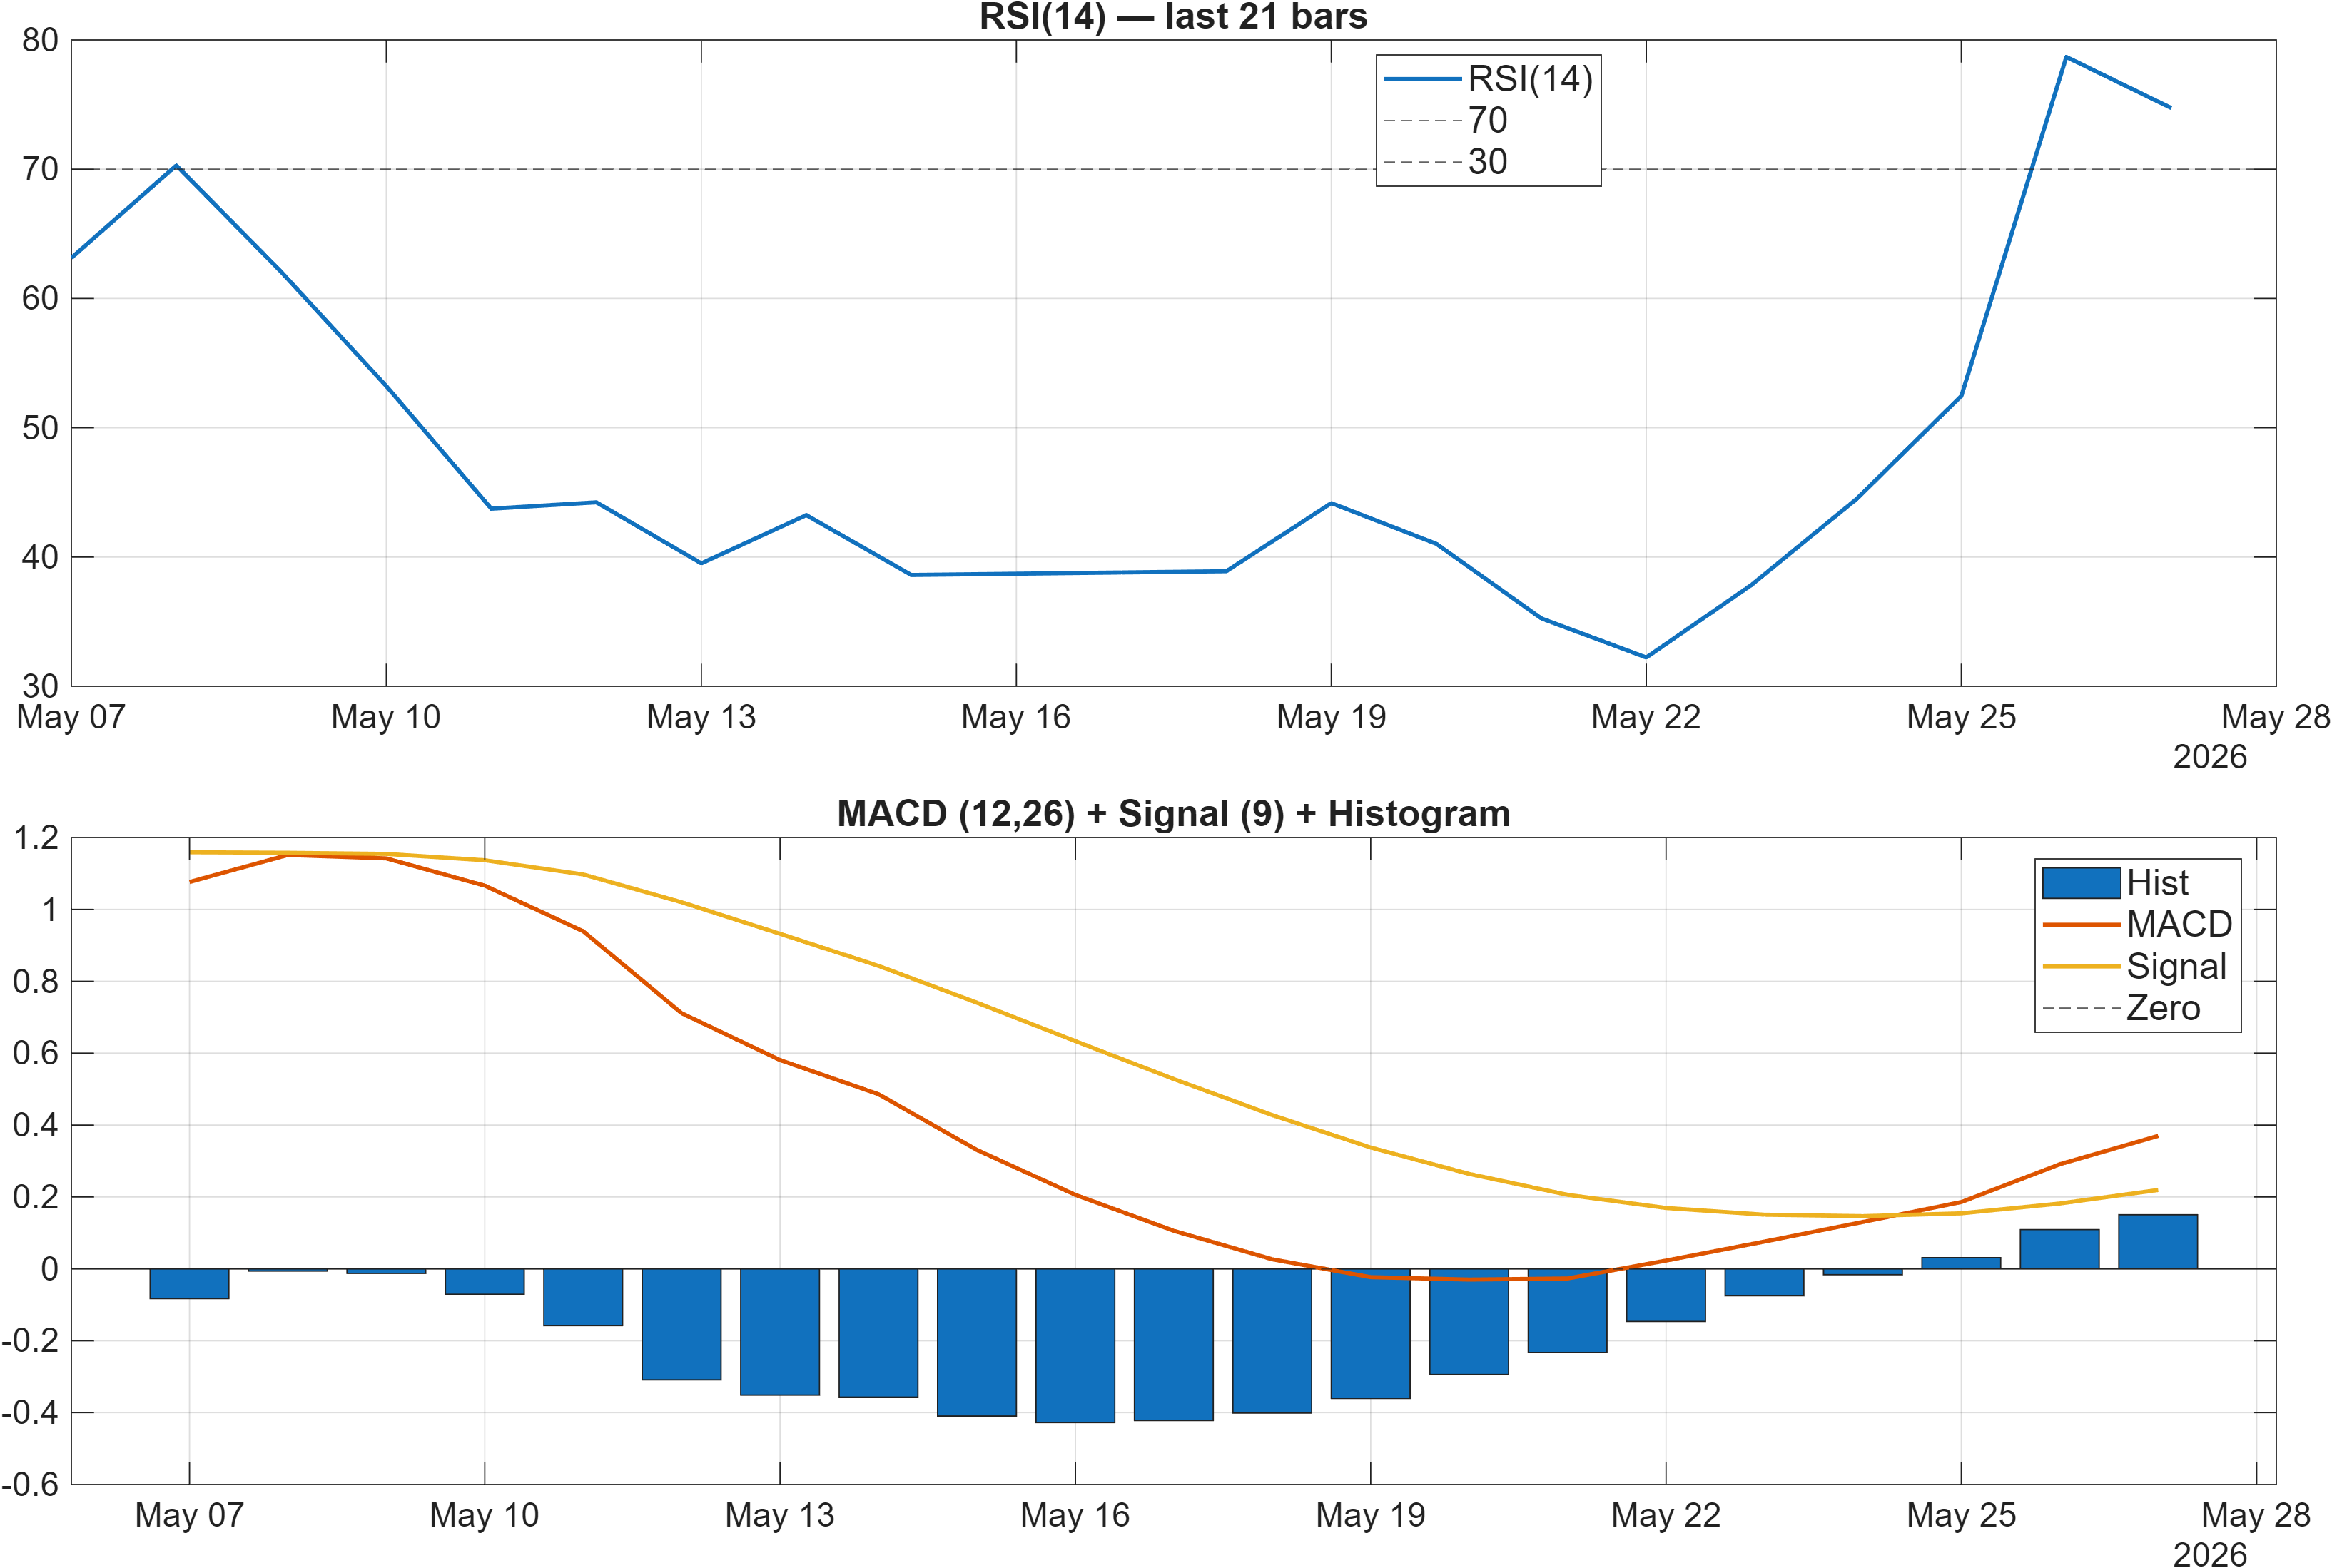
Momentum inputs tilt constructive but are not perfectly uniform. The dashboard states RSI bias = Bullish with RSI(14) at 74.73, and MACD histogram at 0.1506, both consistent with positive impulse. However, elevated RSI can also coincide with late-stage momentum when follow-through becomes more sensitive to pullbacks, particularly when other time-series momentum tests conflict.
Signal compression vs. expansion: volatility sets the “trigger” condition
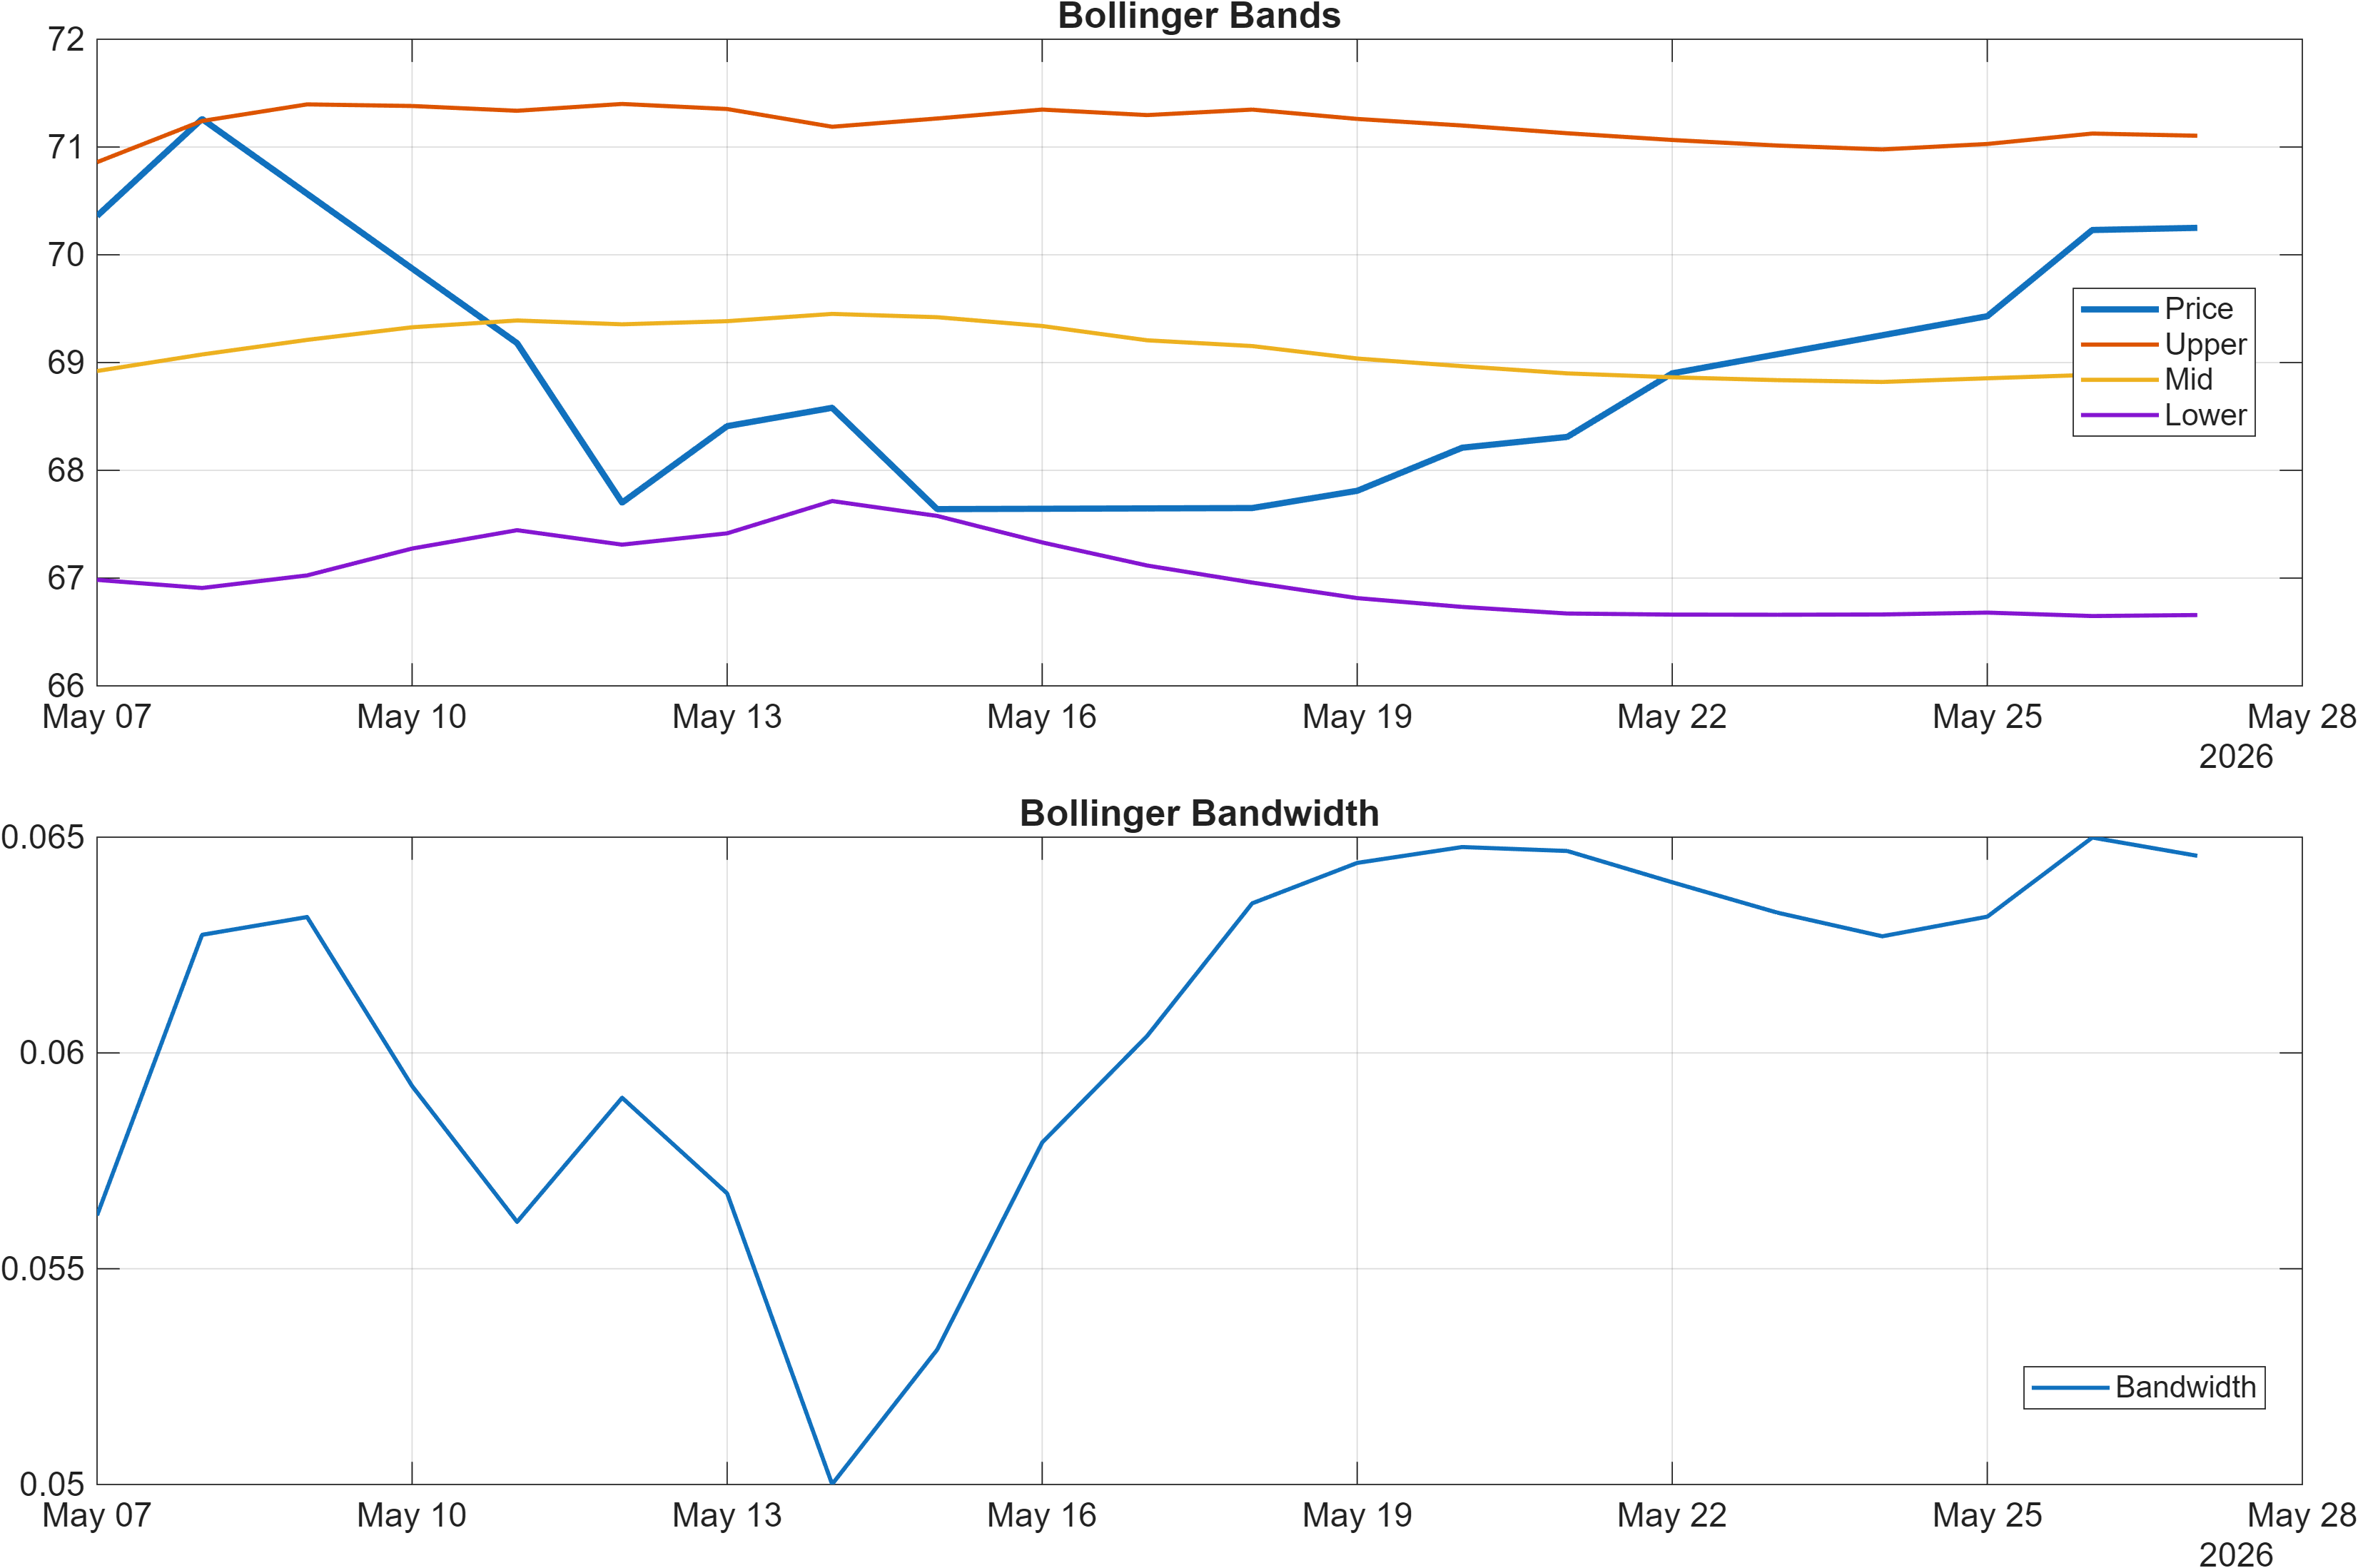
Volatility is currently defined by a compressed regime: Bollinger bandwidth latest is 0.0646 (also reflected as BB Width 0.06457 in the signal table). Compression tends to shift emphasis from forecasting direction to defining reaction levels. In such regimes, the probability distribution often tightens until a breakout or breakdown forces repricing.
Momentum disagreement inside the same panel
The indicator table shows a notable split: MACD histogram is bullish, but several rate-of-change/time-series momentum components are bearish (TS Mom(20) -1.03, ROC(20) -1.417). That combination can occur when a recent rebound lifts oscillator-style measures, while the trailing window still reflects earlier softness. In that case, the market is effectively “asking” for continuation proof rather than assuming it.
Taken together, the momentum/volatility dashboard supports a constructive but conditional read: bullish impulse exists, but the compressed bandwidth means the next expansion—especially around resistance—will do most of the confirming.
4) Support / Resistance zones
Support ~ 59.2200 | Resistance ~ 70.8950
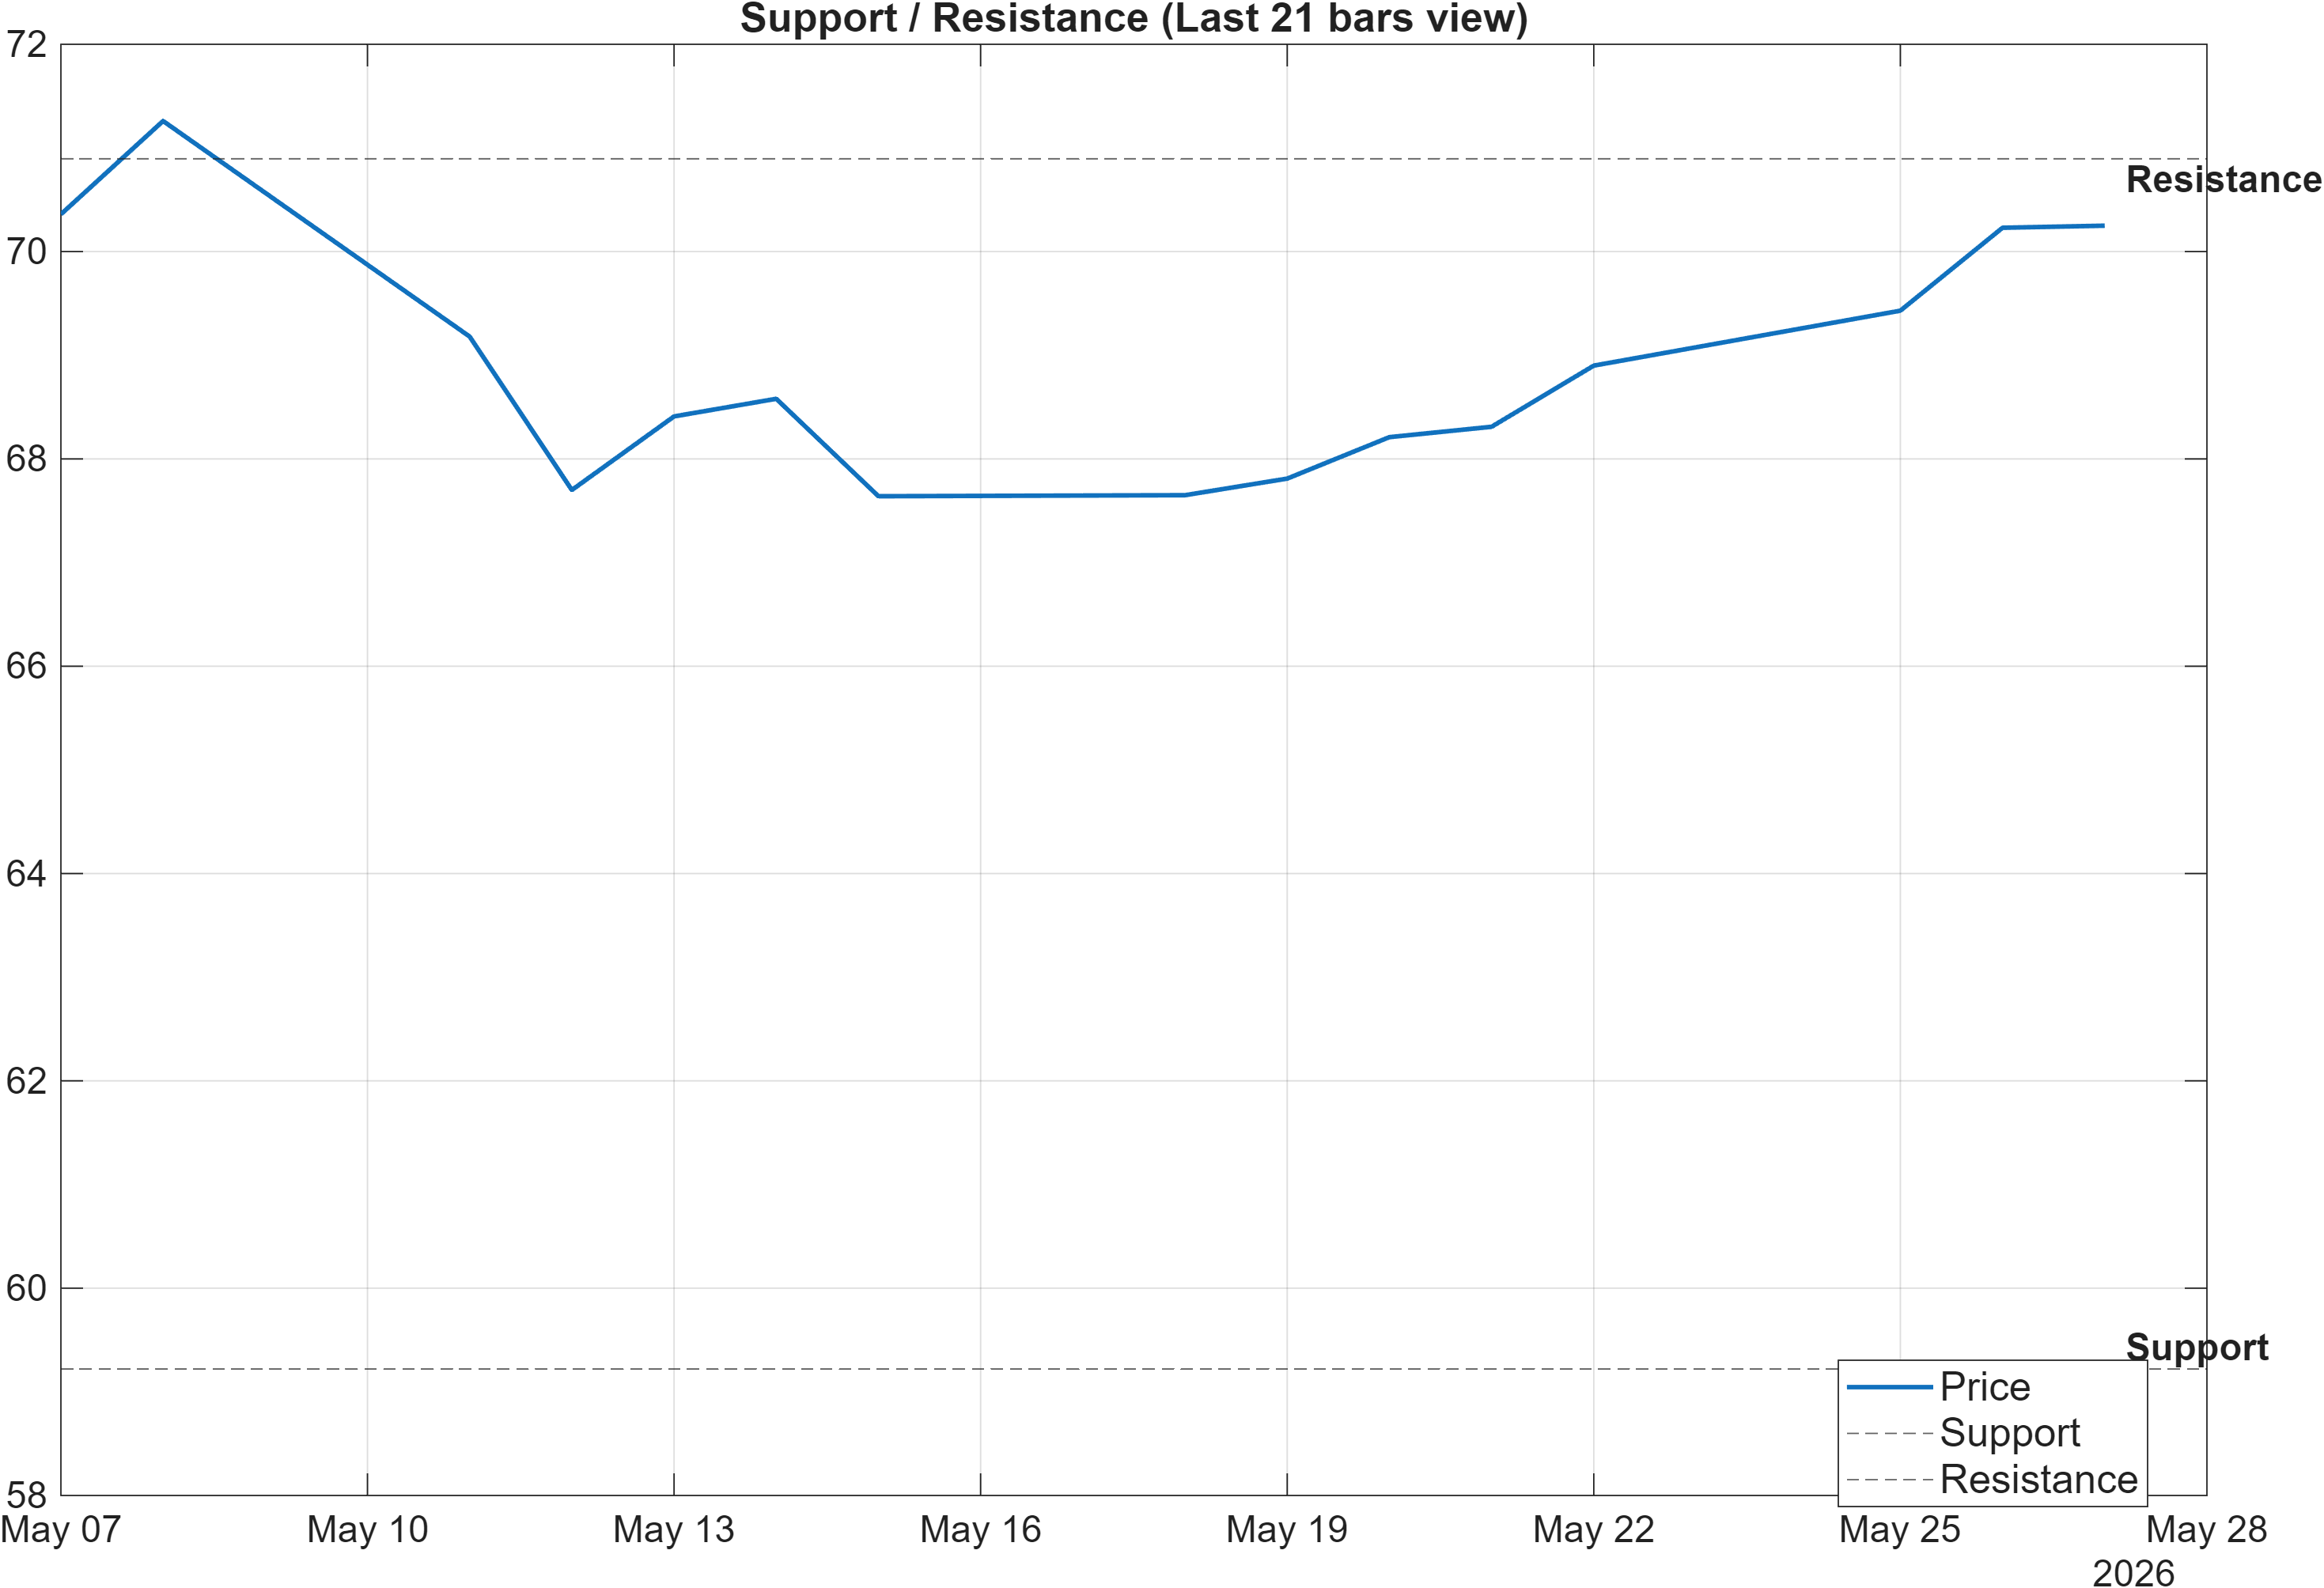
With volatility compressed (bandwidth ~ 0.0646), the distance between 59.2200 support and 70.8950 resistance becomes the core operating map. The provided scenario guidance is explicit: break above resistance with volume → continuation, while a close below support → signal deterioration risk. Those statements align well with the current mix of bullish trend structure and mixed momentum internals.
Decision zones, not “targets”
Treat these levels as probabilistic zones where behavior should change. A clean acceptance above 70.8950 would be consistent with bullish MA alignment and positive MACD histogram (0.1506), and would also reduce the practical impact of the mid-term bearish ranks (#1141 monthly; #1003 3-month) by demonstrating strength that can persist beyond a short bounce.
Where invalidation becomes measurable
Conversely, a close below 59.2200 would undercut the framework’s constructive elements and would likely re-validate the weaker medium-horizon rank posture. Given RSI(14) at 74.73, downside rejection from resistance can also occur without breaking support; that would be a regime-consistent outcome in a compressed-volatility market (range behavior persists until expansion resolves).
This section’s message is discipline: the setup is readable, but it is level-defined. Directional conviction is earned by acceptance beyond the corridor edges, not by the existence of compression alone.
5) Quant Technical Dashboard (18 Signals)
KGNAI AI Technical Analysis Score (Deep Reinforcement Learning): Rank #249 out of 1221 (Rank 1 represents the strongest technical positioning and a higher probability of favorable price behavior. As ranks increase toward the maximum, the probability of favorable outcomes weakens and bearish positioning becomes more dominant.) | Label: Neutral | Score: 0.592
18-Signal Technical Confluence Score: 0.222 (Neutral)
Overall Technical Score (18-signal confluence + DRL rank blend): 0.333 (Bullish)
Note: The blended score reflects signal strength weighted against broader AI technical ranking, which may temporarily diverge.
Blended technical score breakdown: 0.333 (Bullish | Bull 9 / Bear 5 / Neutral 4)
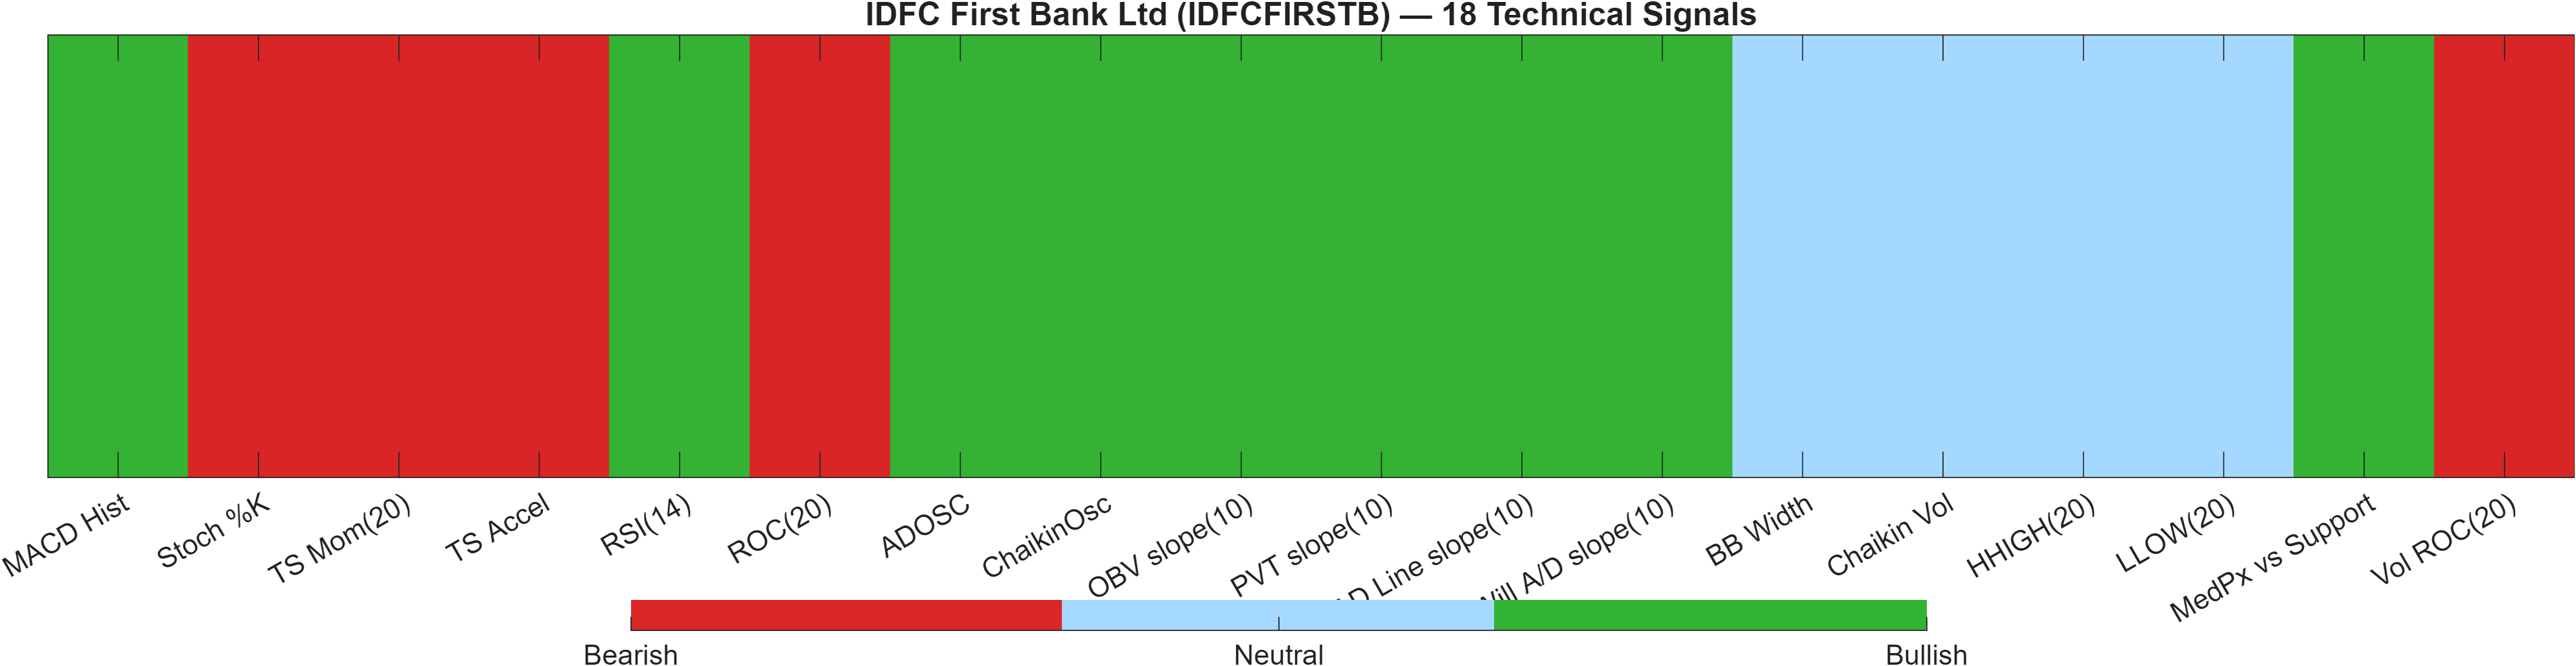
Signal table (Bull/Bear/Neutral)
| Indicator | Value | Signal |
|---|---|---|
| MACD Hist | 0.1506 | Bullish |
| Stoch %K | 98.07 | Bearish |
| TS Mom(20) | -1.03 | Bearish |
| TS Accel | -4.43 | Bearish |
| RSI(14) | 74.73 | Bullish |
| ROC(20) | -1.417 | Bearish |
| ADOSC | 96.3 | Bullish |
| ChaikinOsc | 1.29e+06 | Bullish |
| OBV slope(10) | 1.337e+07 | Bullish |
| PVT slope(10) | 5.165e+04 | Bullish |
| AD Line slope(10) | 3.809e+06 | Bullish |
| Will A/D slope(10) | 6.99 | Bullish |
| BB Width | 0.06457 | Neutral |
| Chaikin Vol | -33.47 | Neutral |
| HHIGH(20) | 71.45 | Neutral |
| LLOW(20) | 66.17 | Neutral |
| MedPx vs Support | 10.55 | Bullish |
| Vol ROC(20) | -29.15 | Bearish |
The dashboard’s most useful message is how the model reconciles mixed micro-signals. The 18-signal confluence score is 0.222 (Neutral), reflecting internal disagreements: bullish momentum/flow components (RSI(14) 74.73, ADOSC 96.3) coexist with bearish timing/velocity inputs (Stoch %K 98.07 as Bearish; Vol ROC(20) -29.15 as Bearish). In other words, participation/accumulation proxies skew positive, but some overbought and volume-change measures warn that continuation may require cleaner confirmation.
Model blend: why Neutral confluence can still yield a Bullish overall technical score
The DRL technical rank at #249 (label Neutral, score 0.592) improves the blended outcome, lifting the overall technical score to 0.333 (Bullish). This is consistent with a market that has improved technically versus the broader universe even if the signal set is not uniformly aligned. The breakdown—Bull 9 / Bear 5 / Neutral 4—supports a slight positive skew rather than a broad-based trend thrust.
The key risk is signal fragility near resistance: with BB Width ~ 0.06457, a volatility expansion can rapidly flip several oscillators and volume-change measures. That’s why level behavior (support 59.2200, resistance 70.8950) remains central even when the blended score leans bullish.
Interpretation: Indicator-level signals form the base confluence, which is then adjusted using a separate AI-driven technical ranking model. The final technical score summarizes this combined view.
6) News sentiment + extractive gist
Note: Instrument-specific news matches were not found, so the digest includes broader market/sector headlines. Links are provided for verification.
Sentiment score (avg): 0.320 | Positive: 81% | Neutral: 19% | Negative: 0%
KGNAI AI News Sentiment Score (normalized -1 to +1): 0.99 (as of 2026-02-23) | Label: Bullish | Overall news score: 0.87
Positive Developments
Recent coverage across major financial outlets indicates a constructive tone in broader risk assets, with upbeat narratives around large-cap technology leadership and improving sentiment as markets digest macro and geopolitical headlines. Within the provided dataset, the news sentiment distribution skews heavily positive (81% positive; 0% negative) and the normalized sentiment score is elevated (0.99), which can reduce friction for bullish technical follow-through when price is near breakout levels. For IDFCFIRSTB specifically, this should be treated as background support rather than a direct catalyst because the matches are not instrument-specific. Still, supportive macro-equity tone can matter most when the technical setup is already “set” (bullish MA structure; MACD histogram 0.1506) and volatility is tight (bandwidth ~ 0.0646), as incremental flows can be enough to force a range break.
Neutral / Mixed Developments
The same coverage also reflects a mixed macro backdrop: shifting expectations around yields, inflation sensitivity, and cross-asset positioning can keep markets headline-reactive even when the aggregate sentiment score is positive (avg 0.320). For this report, the practical implication is that sentiment should be used as a context filter—a mild tailwind—while execution remains anchored to technical confirmation. With IDFCFIRSTB’s universe ranks split (daily #555 vs monthly #1141), the risk is that neutral macro cross-currents amplify rotation behavior, keeping the stock in a decision corridor rather than sustaining directional extension immediately.
Negative / Risk Signals
Risk framing in the dataset centers on episodic spikes in macro uncertainty and geopolitical developments that can tighten financial conditions or shift risk appetite quickly. Even with 0% negative items in the sentiment distribution, the market impact of adverse risk headlines can be nonlinear—especially during compressed-volatility regimes where price can move sharply once bandwidth expands. For IDFCFIRSTB, the key vulnerability is a failed breakout attempt: overbought-adjacent momentum signatures (RSI(14) 74.73; Stoch %K 98.07 flagged Bearish) can coincide with quick reversals if liquidity thins or risk-off reappears. This reinforces the discipline of treating 70.8950 as a confirmation line and 59.2200 as a deterioration threshold.
- Whether sentiment remains constructive while price tests the 70.8950 resistance zone.
- Any pickup in volatility alongside the current compressed bandwidth (~0.0646), which may signal regime transition.
- Whether medium-horizon ranks (monthly #1141, 3-month #1003) begin to improve as confirmation emerges.
Snapshot: AI Rank (Short–Mid–Long): Mixed (Neutral–Bearish–Neutral) · Technical Confluence: Neutral · Key Levels: Support ~59.22 | Resistance ~70.89 · News Sentiment: Positive
Sources referenced: Reuters, Bloomberg, Yahoo Finance, MarketWatch, Investing.com
7) Sources
The original source list contained multiple direct links and headlines. In accordance with the report format, the news section above is summarized without reproducing headline lists or URLs.
You may also like: How KGNAI AI ranks instruments across global markets
Disclaimer: KGNAI provides AI-generated analytics and educational market commentary only. This is not financial advice. Markets involve risk. Always do your own research.