
CANBK (Canara Bank) — 29-May-2026 Technical & Rank Update with Cautious Bullish Near-Term Bias
Canara Bank (CANBK) enters 29-May-2026 with a near-term posture that is constructive but not uniform across timeframes. Cross-sectional ranks inside a 1221-instrument India universe place the short horizon in the upper tier (daily and weekly both Bullish), while intermediate-to-long horizons remain Neutral, signaling that recent strength has not fully translated into durable multi-month leadership. Technically, the evidence is more aligned: the 18-signal framework and the blended technical score are both Bullish, supported by positive momentum readings (including MACD histogram 1.0430) and a volatility regime that is measurable rather than extreme (Bollinger bandwidth 0.0914). Structurally, the analysis centers on the 124.4125 support and 143.5000 resistance zones as probabilistic decision levels, with confirmation dependent on breakout/hold behavior rather than assumption.
- Rank stance: Short-term Bullish; Mid-term Neutral; Long-term Neutral.
- Technical confluence: Bullish (18-signal confluence 0.611; blended technical score 0.585).
- Key levels: Support ~ 124.4125 | Resistance ~ 143.5000.
- News sentiment bias: Neutral on mix (avg sentiment 0.071) despite a Bullish normalized score (0.95 as of 2025-11-07).
- Confirmation / invalidation: Strength is better confirmed on a break above 143.5000 with volume; deterioration risk rises on a close below 124.4125.
KGNAI evaluates assets using large cross-sectional datasets built from millions of structured data points. Inputs incorporate fundamental metrics, technical structures, and systematically processed news sentiment. Statistical models, machine learning, and AI frameworks are used to assess relative positioning, signal alignment, and probabilistic behavior across broad universes.
- Ranks are comparative across the tracked universe, not absolute price targets.
- Confluence reflects alignment among independent signal groups.
- Support/resistance levels are probabilistic decision zones, not guarantees.
- Sentiment provides contextual bias within the broader analytical framework.
1) KGNAI AI Analysis
Region: INDIA
Total universe size: 1221 ranked instruments
- Daily rank: #194 out of 1221 — Bullish
- Weekly rank: #230 out of 1221 — Bullish
- Monthly rank: #543 out of 1221 — Neutral
- 3-Monthly rank: #818 out of 1221 — Neutral
- 6-Monthly rank: #640 out of 1221 — Neutral
- Yearly rank: #741 out of 1221 — Neutral
Cross-horizon positioning: short-term leadership without long-horizon confirmation
The rank stack is best read as a timeframe dispersion profile. CANBK sits in the upper quintile on the day-to-week horizons (daily #194, weekly #230 out of 1221), which is consistent with near-term demand and improving relative behavior versus the broader set. That said, the signal is not uniformly persistent: monthly rank #543 shifts the instrument toward the middle of the distribution, and the 3-month (#818) and yearly (#741) standings point to weaker multi-quarter traction relative to peers.
This pattern often maps to a market state where recent price action is improving faster than the longer-term regime can adapt—useful for tactical context, but it typically increases sensitivity to confirmation events (trend continuation versus mean reversion). In practical positioning terms, the KGNAI term view explicitly reflects this: Short-term Bullish, Mid-term Neutral, Long-term Neutral.
A constructive interpretation is that CANBK is attempting to transition from “average” longer-horizon behavior into a stronger cohort; the cautious interpretation is that the move remains fragile until longer horizons improve. Subsequent sections evaluate whether technical confluence (0.611/0.585) and structural levels (124.4125/143.5000) support a regime shift or suggest a near-term-only impulse.
Want the full universe and complete rank tables? Unlock full access on KGNAI: https://www.kgnai.com/pricing
2) Price & trend overview
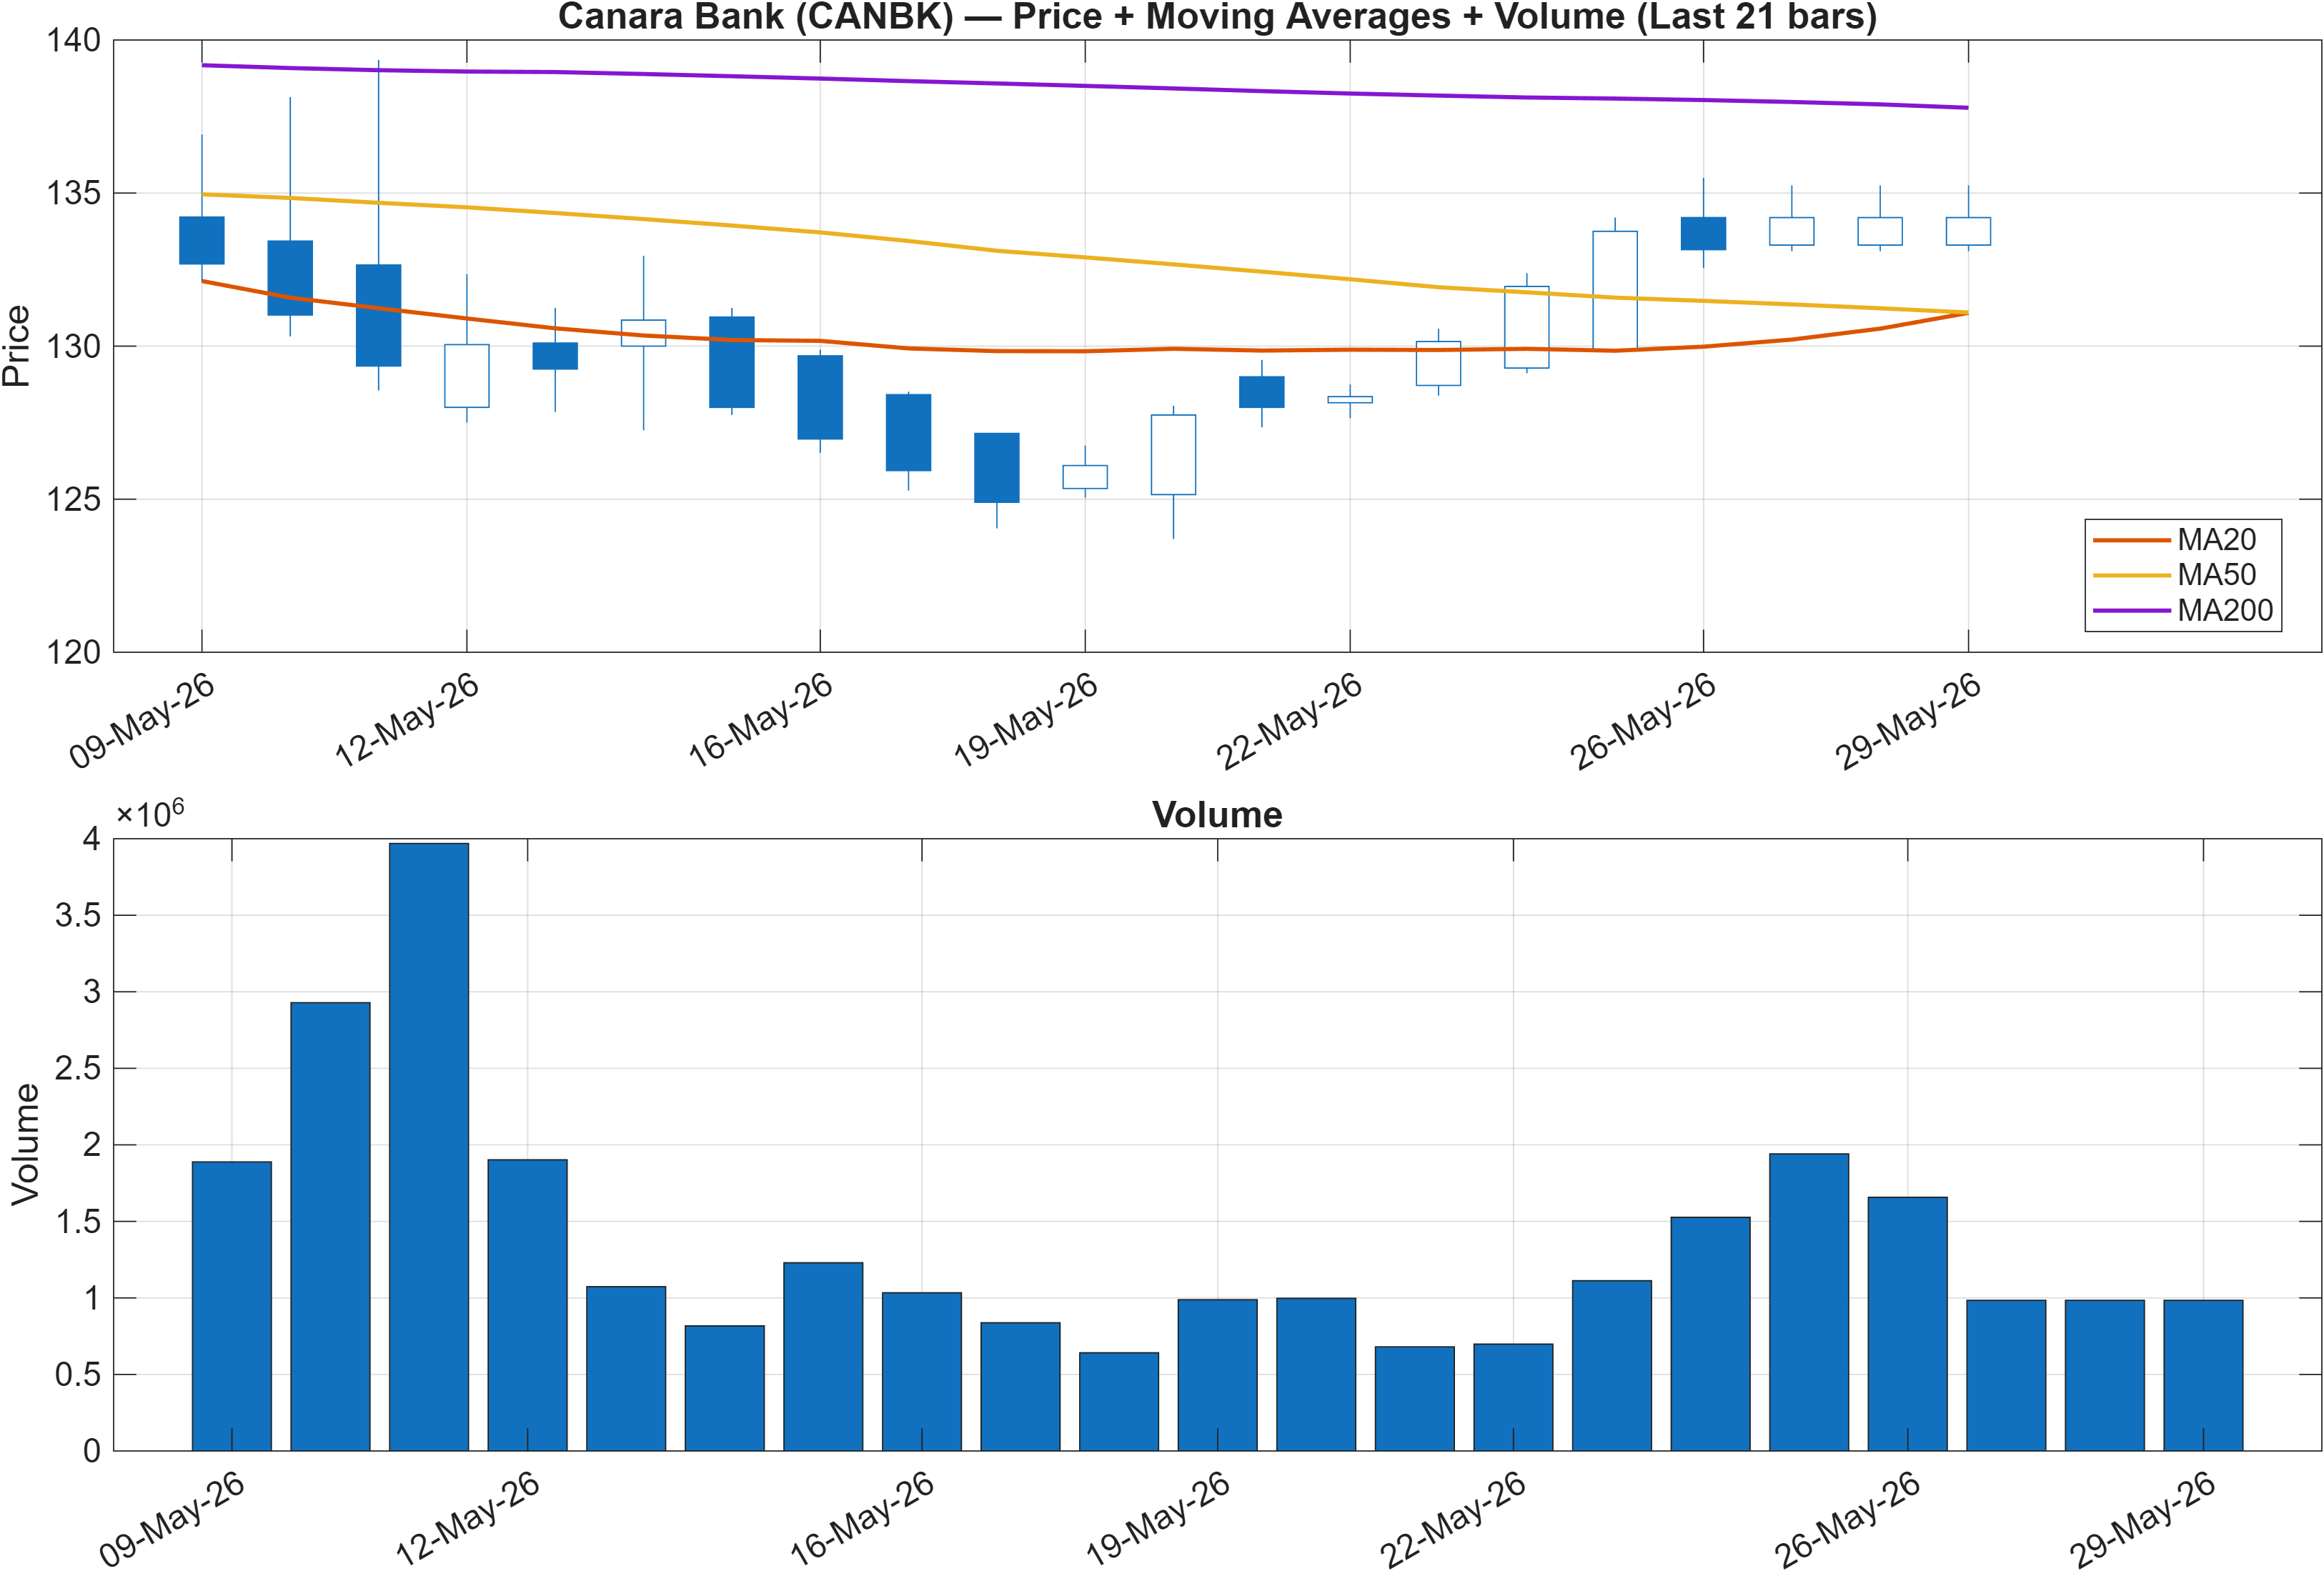
Moving-average structure: near-term strength inside a mixed trend stack
The trend read is explicitly defined here by two moving-average relationships: Close vs MA50 = Bullish, while MA50 vs MA200 = Bearish. That combination tends to occur when price has improved over the intermediate window, but the broader long-duration trend has not fully repaired. It aligns with the rank dispersion observed earlier: short-term ranks are supportive (daily #194, weekly #230), while longer horizons remain Neutral (including #741 yearly).
From a market-structure perspective, this is a transition regime: the instrument can behave well tactically even as long-horizon trend filters remain cautious. This mix often raises the importance of how price behaves at structural boundaries—particularly the nearby resistance zone at 143.5000—because a clean continuation through resistance can help reconcile the MA stack over time, while rejection can reinforce the longer-horizon neutrality.
Volume is the other “tie-breaker” in this configuration. The report’s own scenario language highlights continuation only on a break above resistance with volume; absent that, the MA conflict implies the move is more susceptible to pullbacks that re-test support (124.4125). In other words, this trend state is less about calling direction and more about monitoring whether recent strength can become structurally persistent.
3) Momentum & volatility dashboard
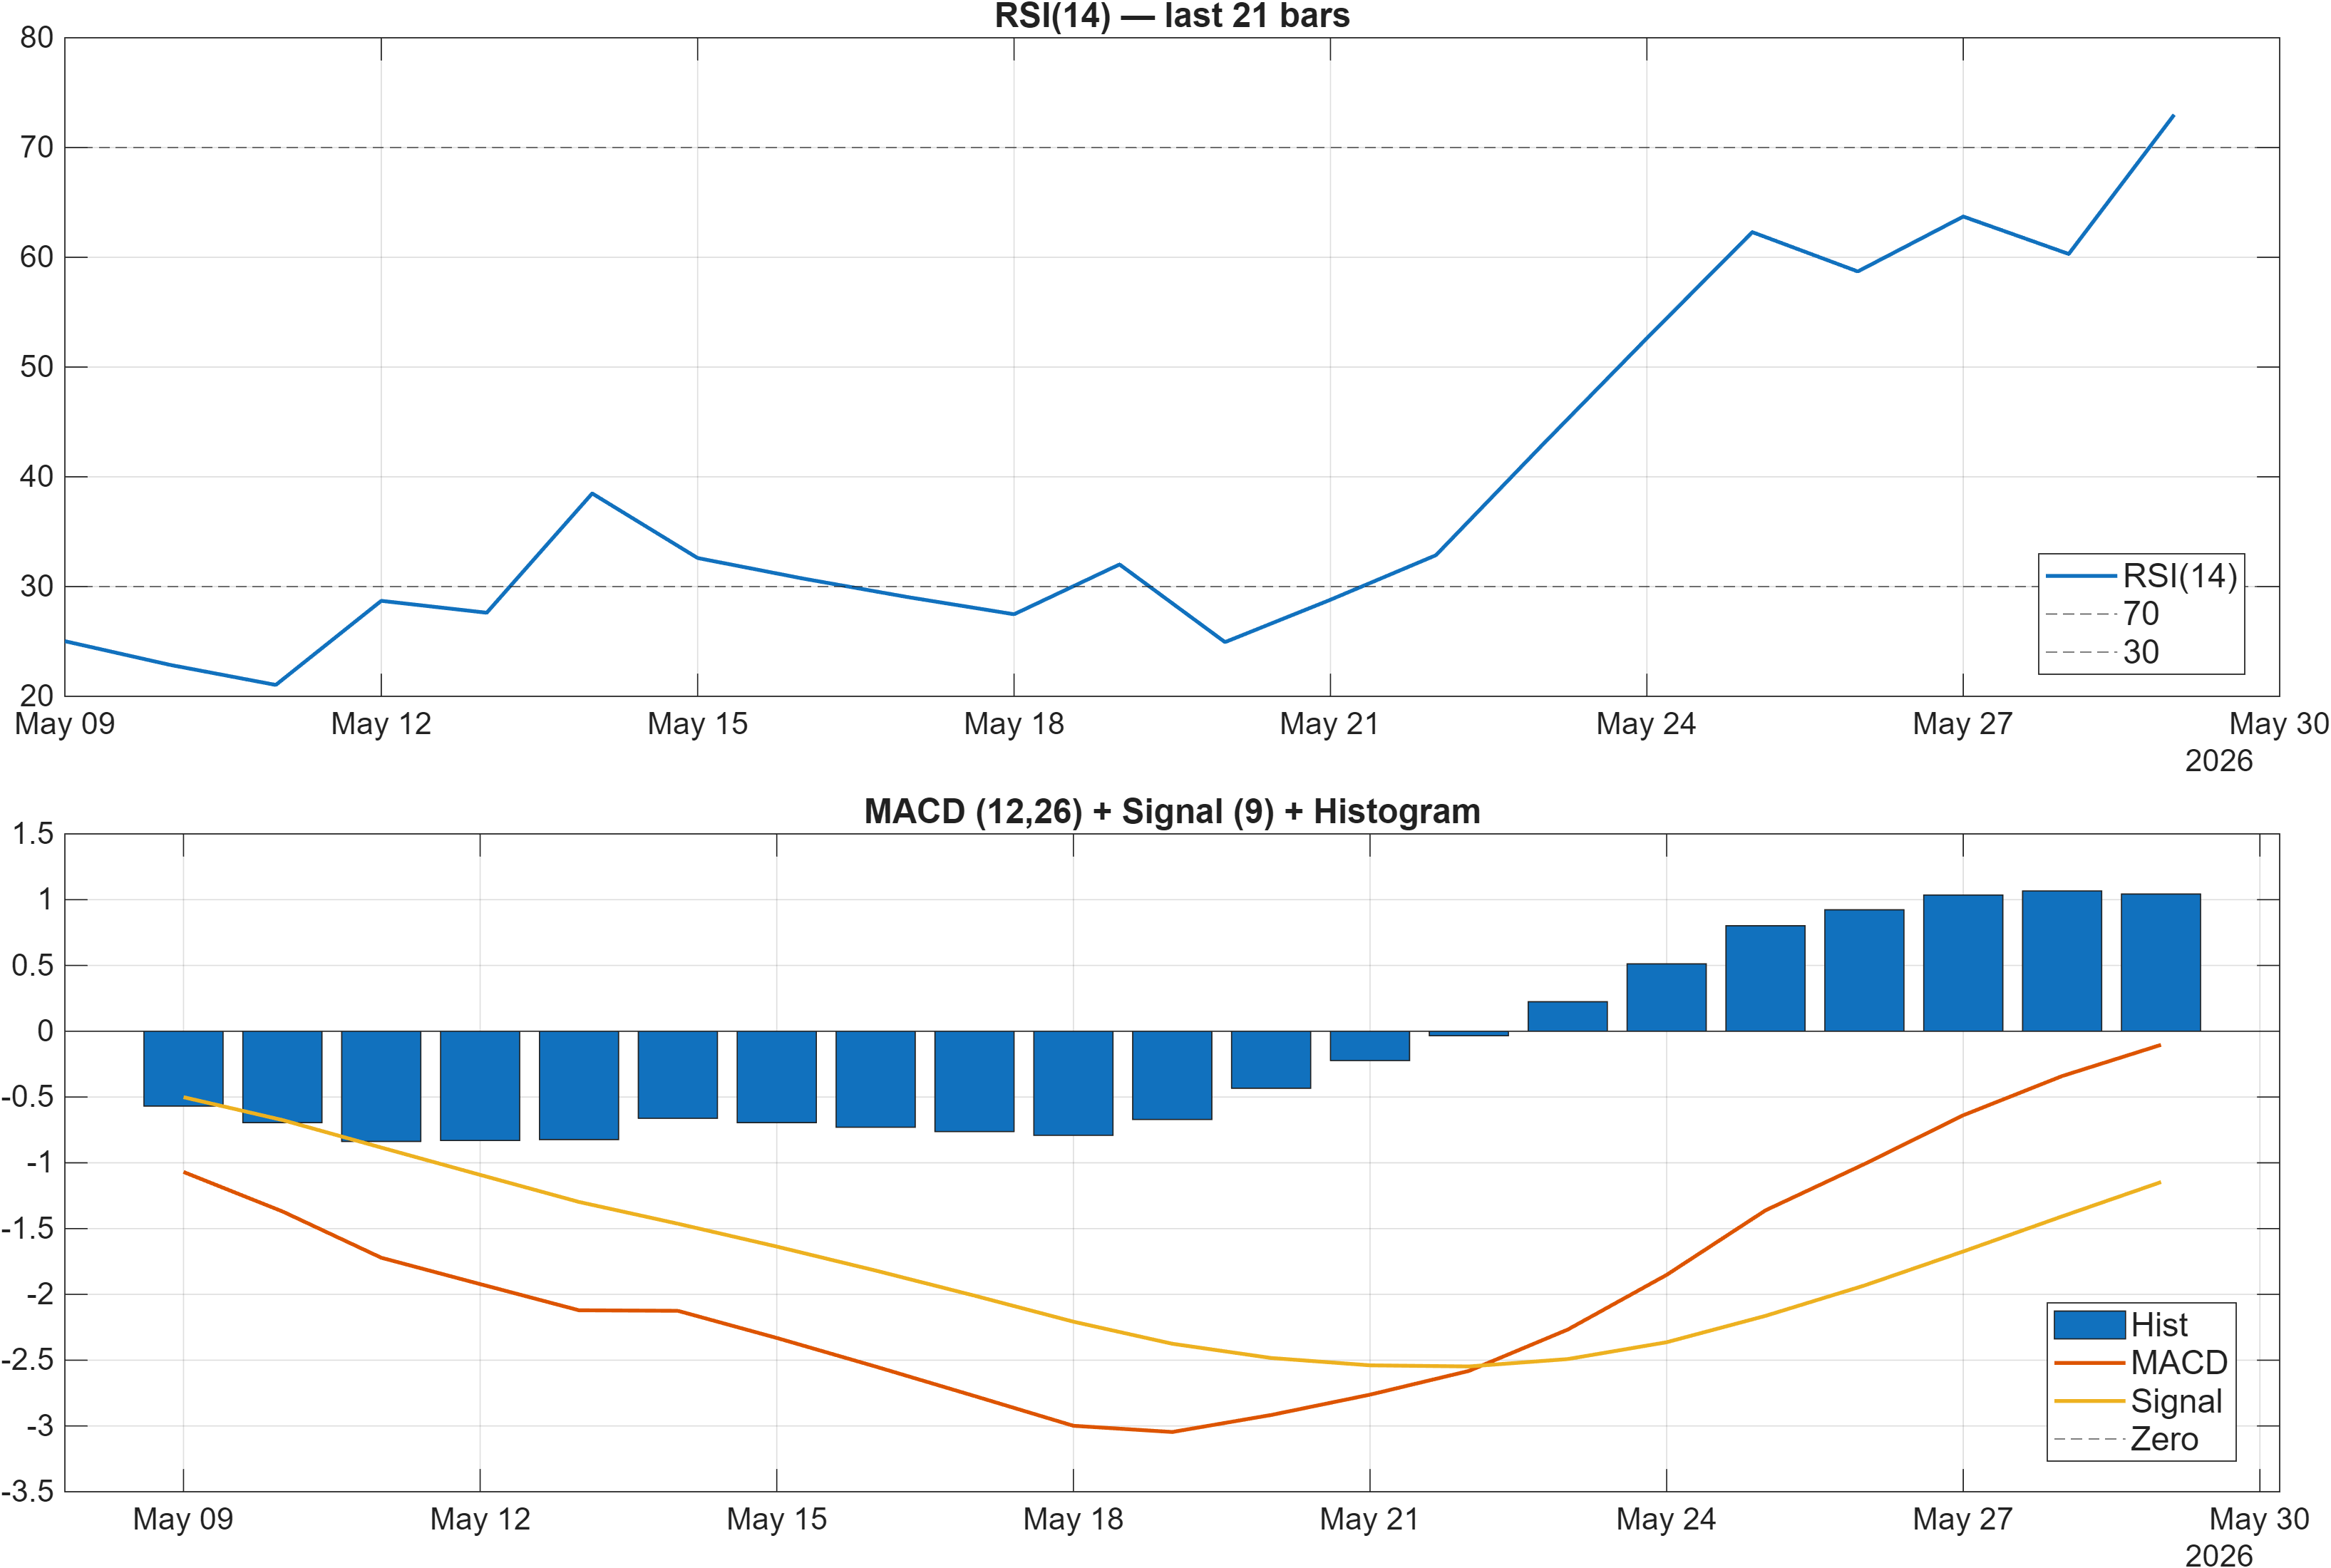
Interpretation: RSI bias = Bullish, MACD hist = 1.0430.
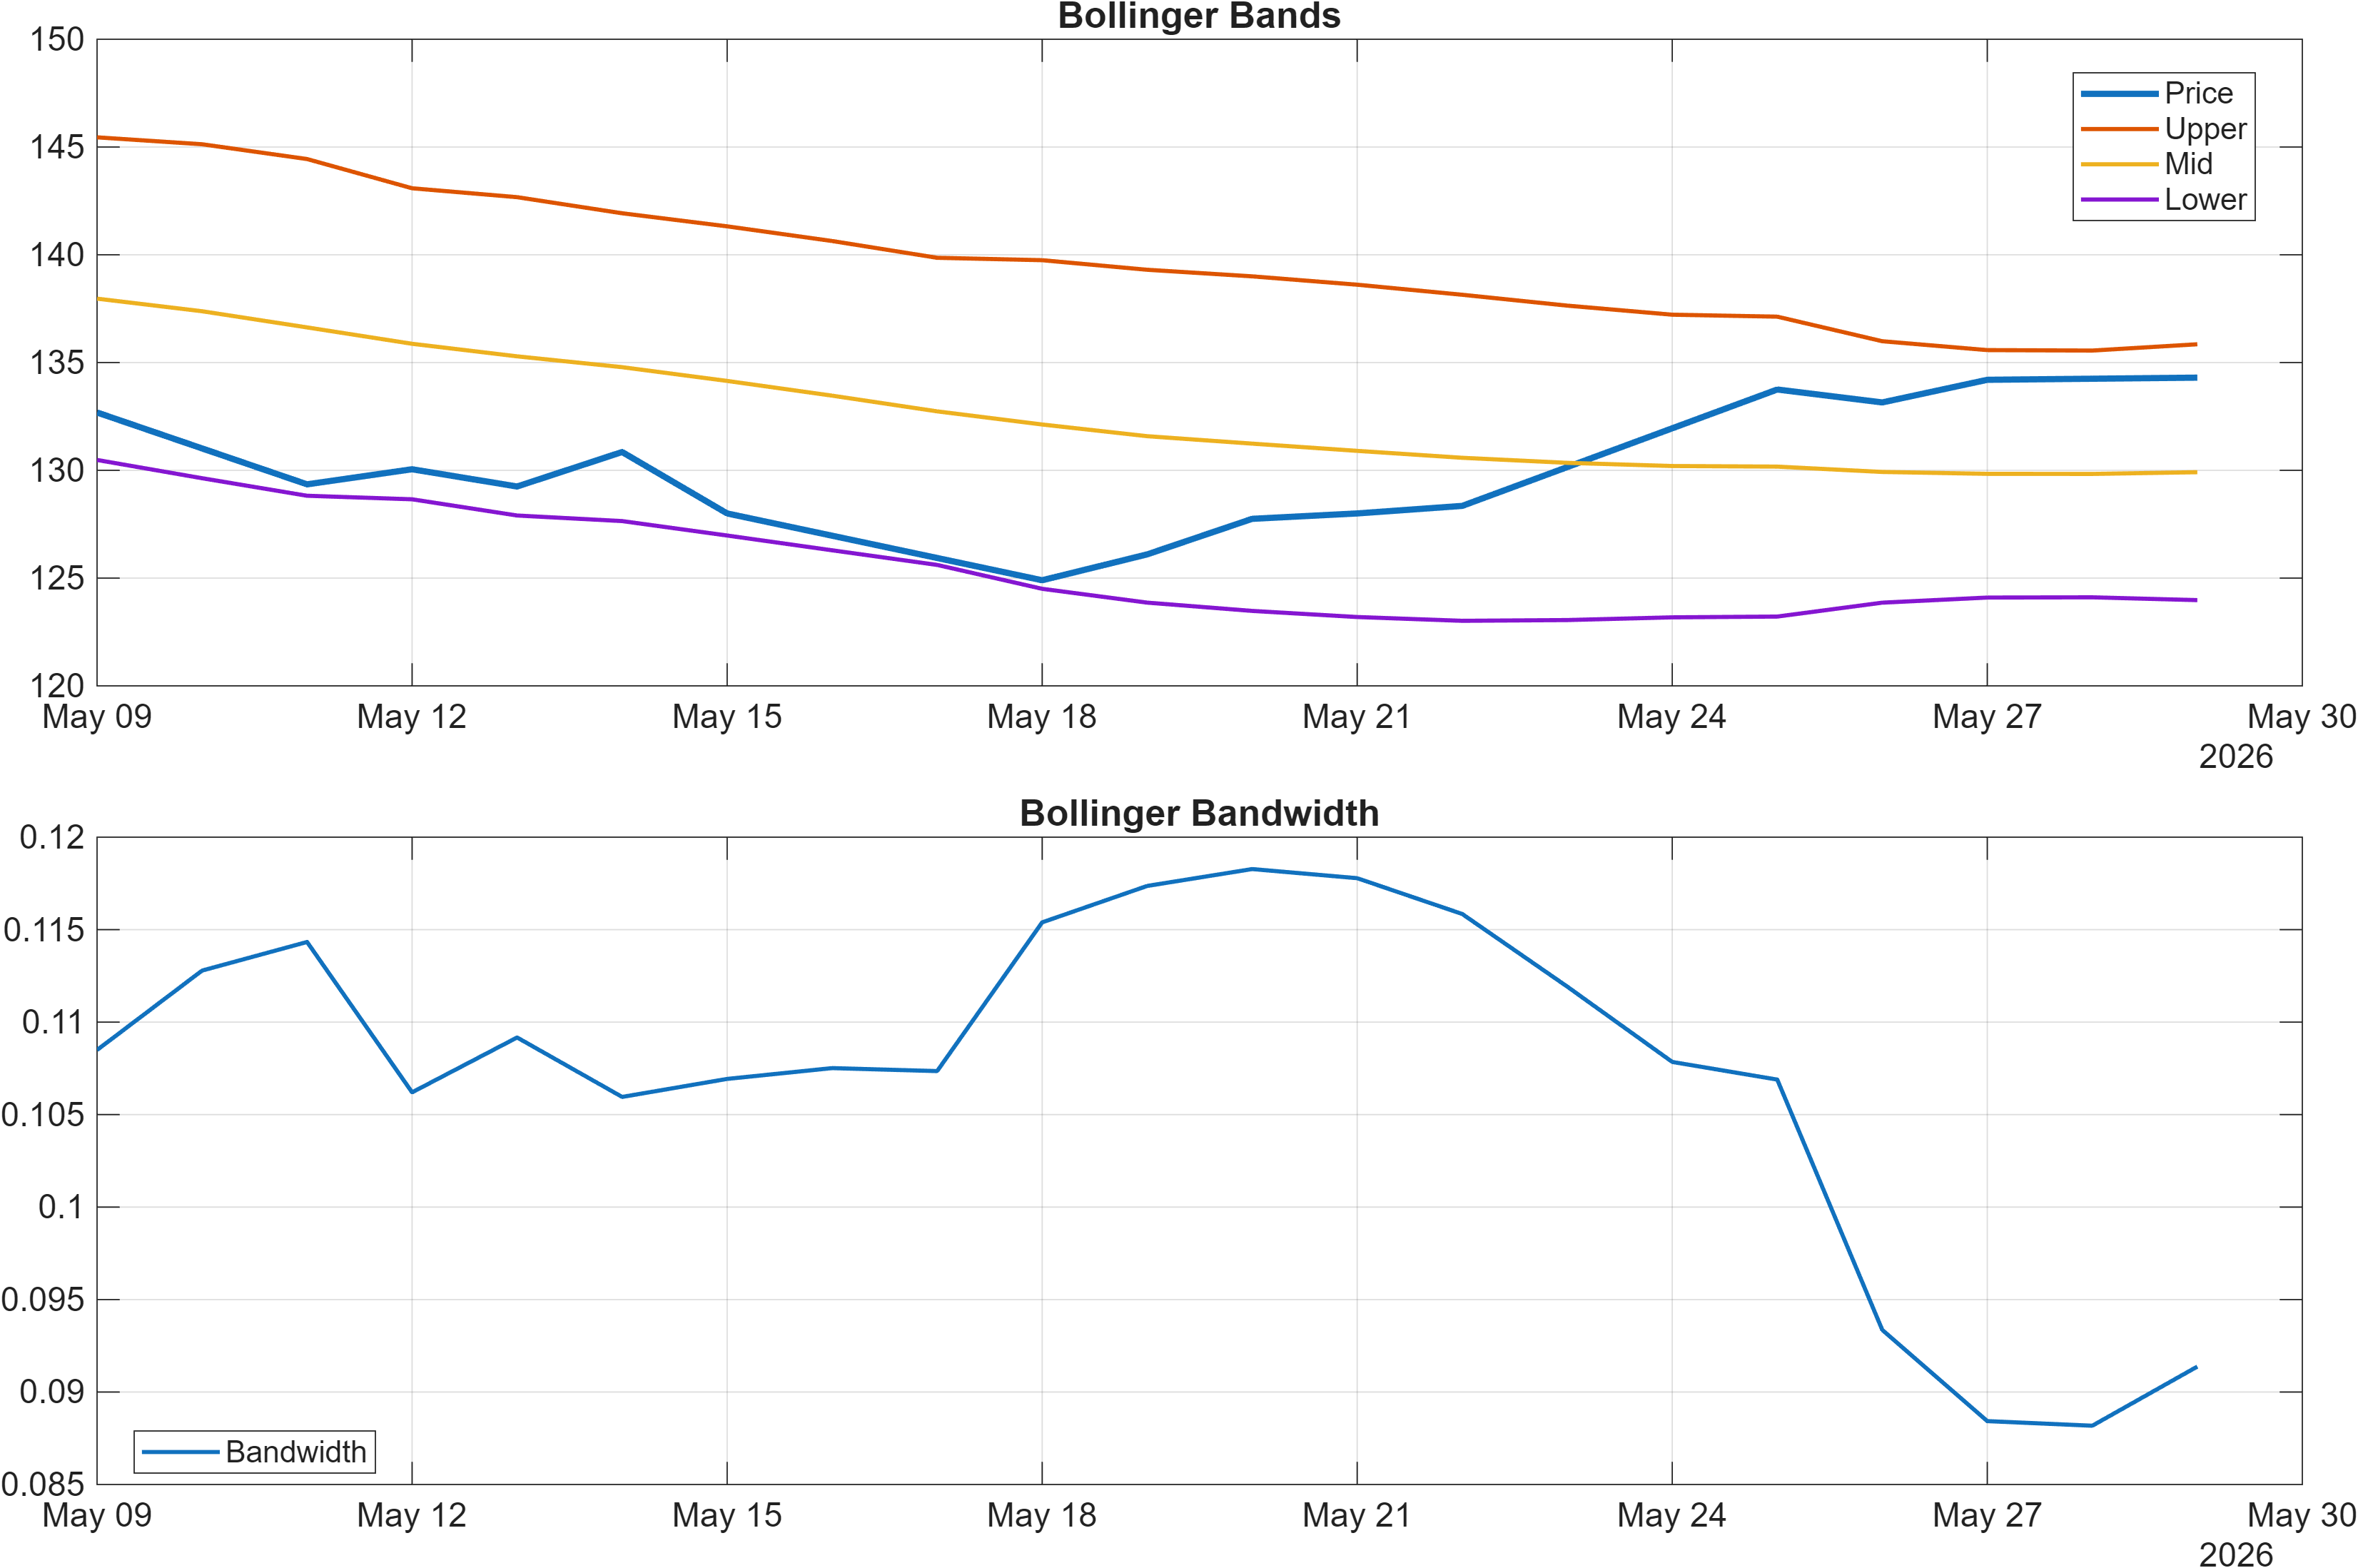
Interpretation: Bandwidth (volatility regime) latest = 0.0914.
Momentum remains positive, but overbought risk management becomes relevant
Momentum inputs show directional agreement: RSI is flagged Bullish with RSI(14) at 72.99, and the MACD regime is supportive with a histogram of 1.0430. This combination often corresponds to a market phase where upward impulse remains intact, but positioning discipline matters because RSI in the low-70s can coincide with compression in incremental upside if price fails to extend through resistance.
Volatility context adds nuance. The Bollinger bandwidth at 0.0914 suggests volatility is present but not at an obvious extreme; it is consistent with a market that can still move, yet is not necessarily in a disorderly expansion. In practical signal behavior, that bandwidth level can support continuation if price builds above intermediate averages, but it also means breakouts are typically more credible when they occur with volume (again consistent with the resistance test at 143.5000).
The interplay across indicators matters: positive MACD and RSI bias can persist longer than expected, but the rank profile (short-term bullish; longer-term neutral) implies that momentum is leading trend, not following it. That creates a “prove it” environment where the next structural move—either expansion above resistance or a pullback toward support—will likely determine whether momentum converts into a higher-quality trend state.
4) Support / Resistance zones
Support ~ 124.4125 | Resistance ~ 143.5000
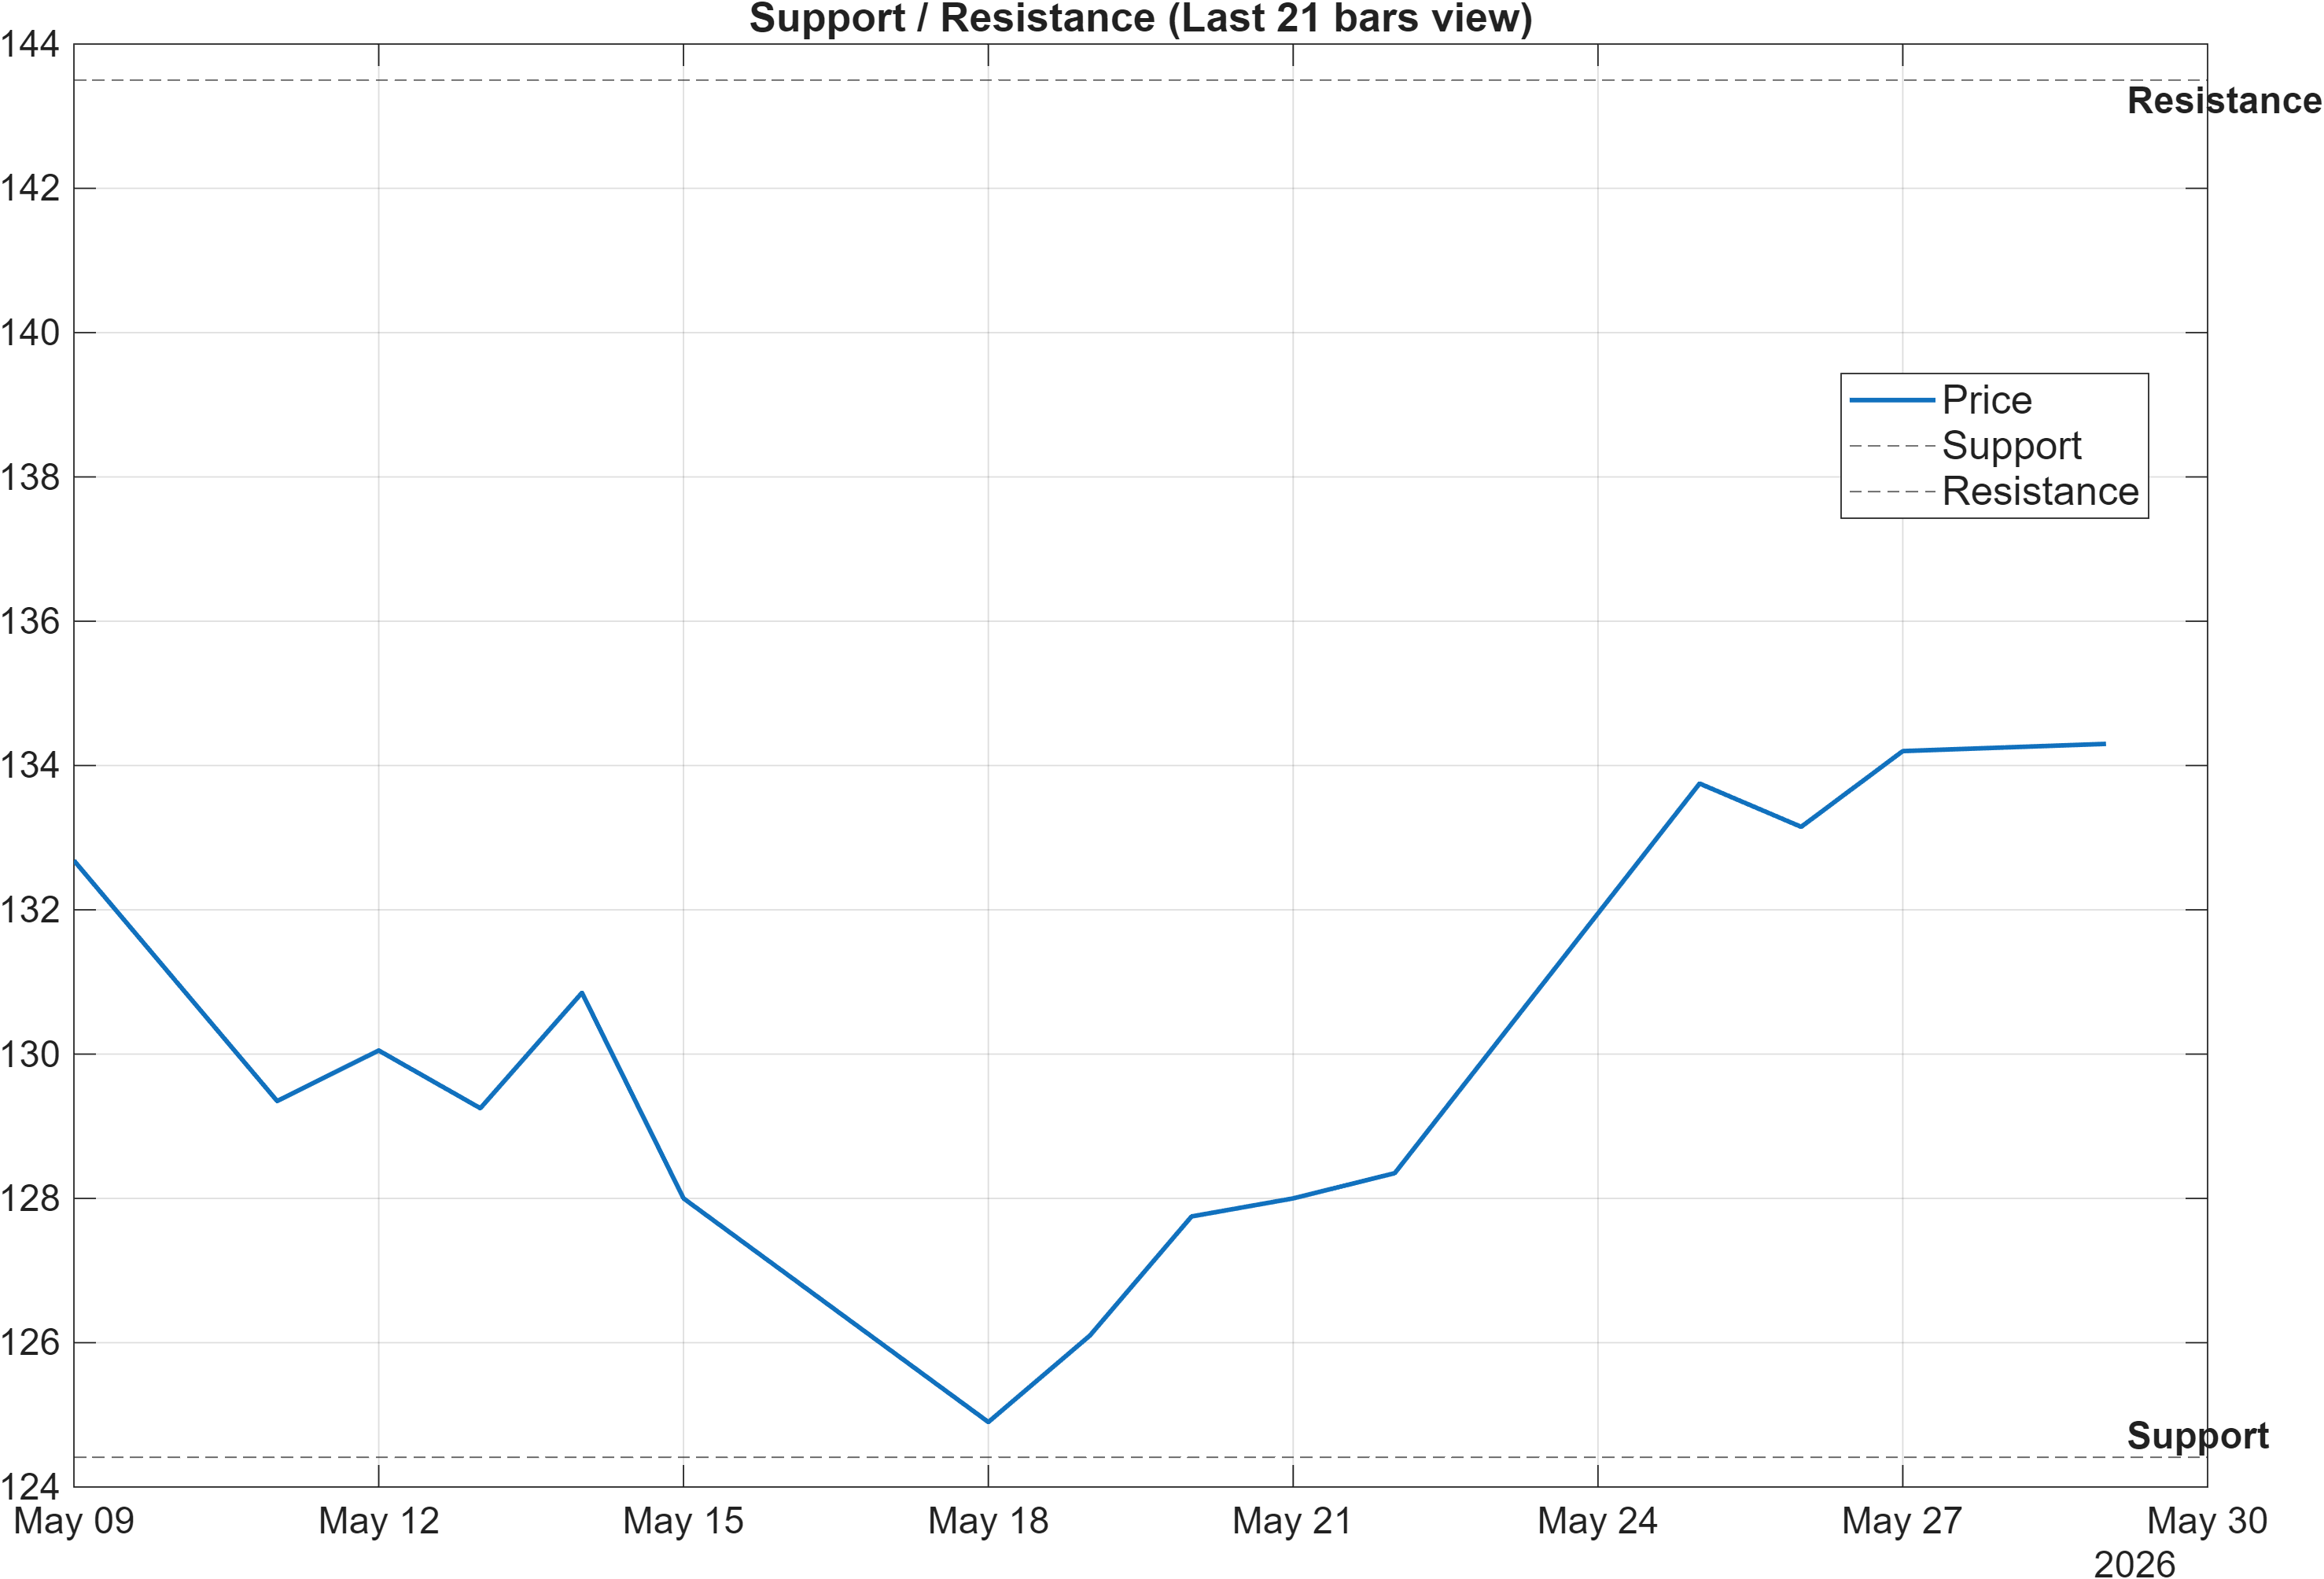
Scenario view: Break above resistance with volume → continuation. Close below support → signal deterioration risk.
Decision zones: where the bullish confluence can be validated or challenged
The structural framework is clean: support at 124.4125 and resistance at 143.5000. With the short-term ranks in the upper cohort (daily #194, weekly #230) and the technical confluence Bullish (overall technical score 0.585), these levels become less about forecasting and more about structuring conditional outcomes.
The resistance area at 143.5000 is the logical test for whether momentum (MACD histogram 1.0430; RSI 72.99) can translate into continuation without reverting. If price can break and hold above that region—especially if accompanied by volume—it improves the probability that the mixed moving-average stack (close>MA50 bullish; MA50<MA200 bearish) begins to resolve toward a more consistent uptrend. Conversely, repeated failure at resistance can turn bullish momentum into exhaustion behavior, particularly when RSI is already elevated.
On the downside, 124.4125 is framed as an invalidation line: a close below support raises deterioration risk. That matters because the longer horizons are still neutral (e.g., #818 3-month; #741 yearly), so the market does not have to “break” much long-term trend to weaken; it simply has to lose the near-term structural floor. Within this setup, the clearest informational content comes from how price behaves at these boundaries rather than in the middle of the range.
5) Quant Technical Dashboard (18 Signals)
KGNAI AI Technical Analysis Score (Deep Reinforcement Learning): Rank #290 out of 1221 (Rank 1 represents the strongest technical positioning and a higher probability of favorable price behavior. As ranks increase toward the maximum, the probability of favorable outcomes weakens and bearish positioning becomes more dominant.) | Label: Neutral | Score: 0.525
18-Signal Technical Confluence Score: 0.611 (Bullish)
Overall Technical Score (18-signal confluence + DRL rank blend): 0.585 (Bullish)
Note: The blended score reflects signal strength weighted against broader AI technical ranking, which may temporarily diverge.
Blended technical score breakdown: 0.585 (Bullish | Bull 13 / Bear 2 / Neutral 3)
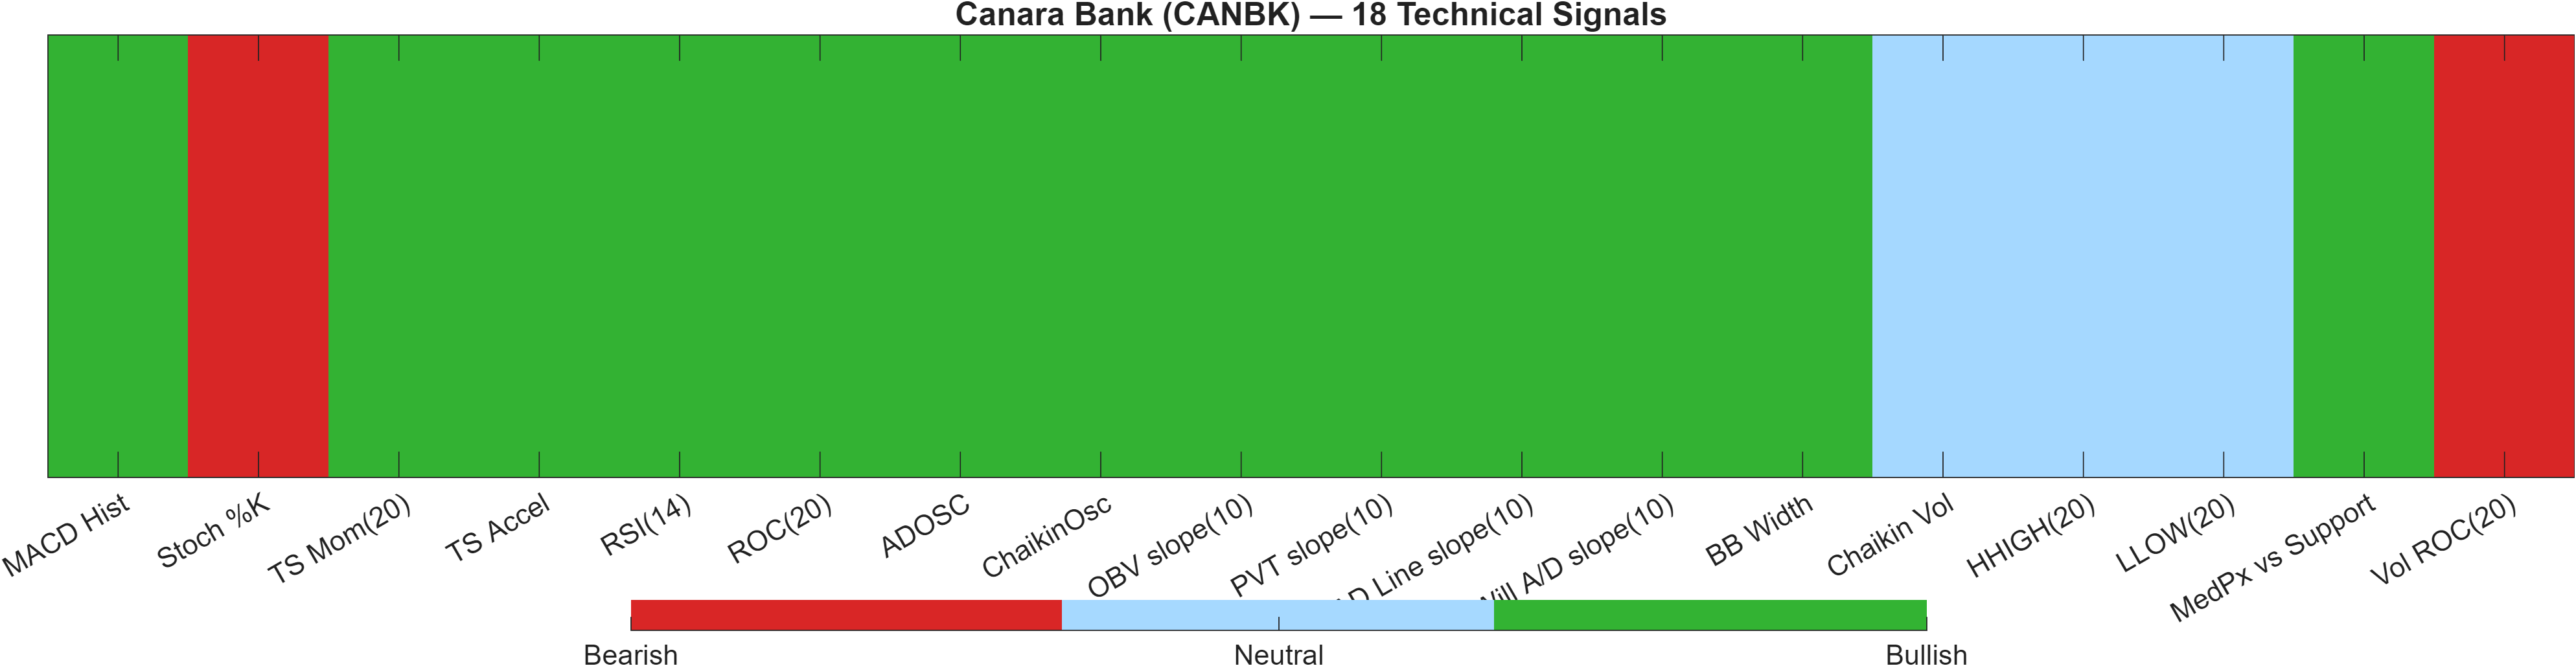
Signal agreement vs model caution: interpreting confluence alongside DRL rank
The technical stack has an internally interesting tension. On one side, the 18-signal confluence is 0.611 and labeled Bullish, and the blended overall technical score remains Bullish at 0.585 with a breadth profile of Bull 13 / Bear 2 / Neutral 3. That breadth is consistent with broad-based participation across momentum and accumulation-style measures, rather than a single-indicator spike.
On the other side, the Deep Reinforcement Learning technical rank is #290 out of 1221, labeled Neutral with a score of 0.525. This is not a contradiction so much as a calibration signal: the DRL model may be detecting that, despite the breadth of bullish signals, the pattern does not yet match the strongest historical technical templates in the cross-section.
A few individual readings illustrate why both can be true: MACD Hist 1.043 and RSI(14) 72.99 reinforce upside momentum, yet at least one oscillator is stretched (Stoch %K 88.98 flagged bearish), and a volume-rate component is weak (Vol ROC(20) -66.4 bearish). Net: confluence supports the current move, but the blend and DRL neutrality argue for confirmation at structure (notably near 143.5000) rather than assuming persistence.
Signal table (Bull/Bear/Neutral)
| Indicator | Value | Signal |
|---|---|---|
| MACD Hist | 1.043 | Bullish |
| Stoch %K | 88.98 | Bearish |
| TS Mom(20) | 3.183 | Bullish |
| TS Accel | 16.52 | Bullish |
| RSI(14) | 72.99 | Bullish |
| ROC(20) | 2.506 | Bullish |
| ADOSC | 70.93 | Bullish |
| ChaikinOsc | 4.708e+05 | Bullish |
| OBV slope(10) | 6.283e+06 | Bullish |
| PVT slope(10) | 7.981e+04 | Bullish |
| AD Line slope(10) | 3.206e+06 | Bullish |
| Will A/D slope(10) | 12.68 | Bullish |
| BB Width | 0.09138 | Bullish |
| Chaikin Vol | -28.3 | Neutral |
| HHIGH(20) | 139.3 | Neutral |
| LLOW(20) | 123.7 | Neutral |
| MedPx vs Support | 9.763 | Bullish |
| Vol ROC(20) | -66.4 | Bearish |
Interpretation: Indicator-level signals form the base confluence, which is then adjusted using a separate AI-driven technical ranking model. The final technical score summarizes this combined view.
6) News sentiment + extractive gist
Note: Instrument-specific news matches were not found, so the digest includes broader market/sector headlines. Links are provided for verification.
Sentiment score (avg): 0.071 | Positive: 19% | Neutral: 81% | Negative: 0%
KGNAI AI News Sentiment Score (normalized -1 to +1): 0.95 (as of 2025-11-07) | Label: Bullish | Overall news score: 0.96
Positive Developments
Recent coverage across major financial outlets indicates a generally constructive risk tone in global equities, with risk assets supported by improving sentiment and pockets of earnings resilience. Against that backdrop, the news signal set presented here tilts statistically favorable on the normalized framework (0.95, labeled Bullish), even though the instrument-specific match is not available in the provided data. The distribution (Positive 19%, Neutral 81%, Negative 0%) suggests an environment where incremental positives are present but are not being expressed as persistent negative risk framing. For CANBK, this matters mainly as contextual bias: constructive macro tape conditions can make it easier for near-term technical strength—already reflected by bullish short-term ranks and a bullish confluence score—to persist long enough to test the key resistance zone.
Neutral / Mixed Developments
The average sentiment reading (0.071) is close to flat, which fits a market narrative that is not decisively one-sided. Several themes in the broader digest combine supportive risk appetite with counterweights such as policy and geopolitical headlines, producing a “risk-on but selective” backdrop. For CANBK specifically, the neutral-heavy split (81%) suggests that the news layer may not be a dominant driver relative to the technical stack. In mixed regimes, price typically pays more attention to levels and positioning—for example, whether a bullish momentum setup (MACD histogram 1.0430) can clear 143.5000, or whether neutrality reasserts via a range that keeps longer-horizon ranks subdued (e.g., #818 over 3 months).
Negative / Risk Signals
While the provided distribution shows 0% negative items, risk should still be framed through how quickly conditions can shift when the news set is largely non-specific to the instrument. In this context, the more actionable “risk signal” is the potential for sentiment/price mismatch: a bullish normalized score (0.95) can coexist with technical vulnerability if the chart fails at resistance and momentum becomes stretched (RSI 72.99 already sits in an elevated zone). Additionally, when broader market headlines dominate the digest, idiosyncratic risks may be underrepresented—meaning price action around 124.4125 support should be treated as the primary deterioration trigger regardless of the news label. The report’s own scenario rule remains the correct discipline: confirmation on breakout; caution on a support break.
- What to monitor next: Whether price can sustain trade above 143.5000 with volume confirmation.
- What to monitor next: Any pullback response approaching 124.4125 (hold vs close below).
- What to monitor next: Whether momentum cools (e.g., RSI easing from 72.99) without breaking structure.
Sources referenced: Reuters, Bloomberg, Yahoo Finance, MarketWatch, Investing.com
7) Sources
Not available in the provided data.
You may also like: How KGNAI AI ranks instruments across global markets
Disclaimer: KGNAI provides AI-generated analytics and educational market commentary only. This is not financial advice. Markets involve risk. Always do your own research.