
CUPID (CUPID LTD.-$) Technical & Sentiment Report — 19-Apr-2026 | Bullish multi-horizon alignment
CUPID LTD.-$ (CUPID) enters 19-Apr-2026 with a broadly constructive cross-signal profile: KGNAI’s multi-horizon ranks sit in the upper tier of a 1222-instrument India universe, while the technical stack shows trend structure and momentum both leaning positive. The moving-average read is supportive (Close vs MA50 = Bullish; MA50 vs MA200 = Bullish), and momentum gauges reinforce continuation risk-on conditions, including an RSI(14) of 83.67 and a MACD histogram near 6.0789. Volatility is not signaling a fresh compression breakout, with Bollinger bandwidth at 0.2364, implying a more “trend management” regime than an early expansion phase. Structurally, the analysis anchors to the published decision zones—support near 77.7167 and resistance near 424.5000—and uses them to frame confirmation vs deterioration, rather than targets.
- Rank stance: Short / Mid / Long all Bullish, with multiple horizons in the top decile (e.g., Monthly #16; 3-Monthly #7; 6-Monthly #13 out of 1222).
- Technical confluence: Bullish blend (Overall Technical Score 0.667; DRL Technical Rank #44).
- Key levels: Support ~ 77.7167 | Resistance ~ 424.5000.
- News sentiment bias: Mildly positive tilt (avg 0.220; Positive 56%, Negative 6%), but instrument-specific matches were not found.
- Confirmation / invalidation: A break above resistance with volume supports continuation; a close below support elevates deterioration risk.
KGNAI evaluates assets using large cross-sectional datasets built from millions of structured data points. Inputs incorporate fundamental metrics, technical structures, and systematically processed news sentiment. Statistical models, machine learning, and AI frameworks are used to assess relative positioning, signal alignment, and probabilistic behavior across broad universes.
- Ranks are comparative across the tracked universe, not absolute price targets.
- Confluence reflects alignment among independent signal groups.
- Support/resistance levels are probabilistic decision zones, not guarantees.
- Sentiment provides contextual bias within the broader analytical framework.
1) KGNAI AI Analysis
Region: INDIA
Total universe size: 1222 ranked instruments
- Daily rank: #39 out of 1222 — Bullish
- Weekly rank: #97 out of 1222 — Bullish
- Monthly rank: #16 out of 1222 — Bullish
- 3-Monthly rank: #7 out of 1222 — Bullish
- 6-Monthly rank: #13 out of 1222 — Bullish
- Yearly rank: #26 out of 1222 — Bullish
The rank stack is internally consistent across timeframes: the daily print at #39 and the weekly at #97 keep CUPID in the upper tranche, while the medium horizons move further into the leadership cohort (Monthly #16, 3-Monthly #7, 6-Monthly #13). This pattern typically indicates persistence rather than a single-period anomaly, especially when longer windows (Yearly #26) remain supportive instead of lagging.
That cross-horizon clustering matters because the framework is designed to downweight isolated extremes: a strong daily rank without medium-term confirmation can be consistent with short-lived momentum. Here, the “term view” is uniformly Bullish for short, mid, and long horizons, reducing the probability that the current setup is purely reflexive or news-driven noise.
From a regime perspective, the rankings suggest a stable relative-positioning bid within the 1222-instrument universe. The daily rank remaining inside the top group while the 3-month ranking sits even stronger implies that near-term consolidation (if it occurs) could be a normalization within a broader constructive relative trend, rather than an automatic reversal signal. Confirmation still comes from price/volume behavior and the technical dashboard, but the rank structure is consistent with “trend-following conditions with manageable pullback risk,” not a weakly supported rally.
Term view: Short-term: Bullish. Mid-term: Bullish. Long-term: Bullish.
Want the full universe and complete rank tables? Unlock full access on KGNAI: https://www.kgnai.com/pricing
2) Price & trend overview
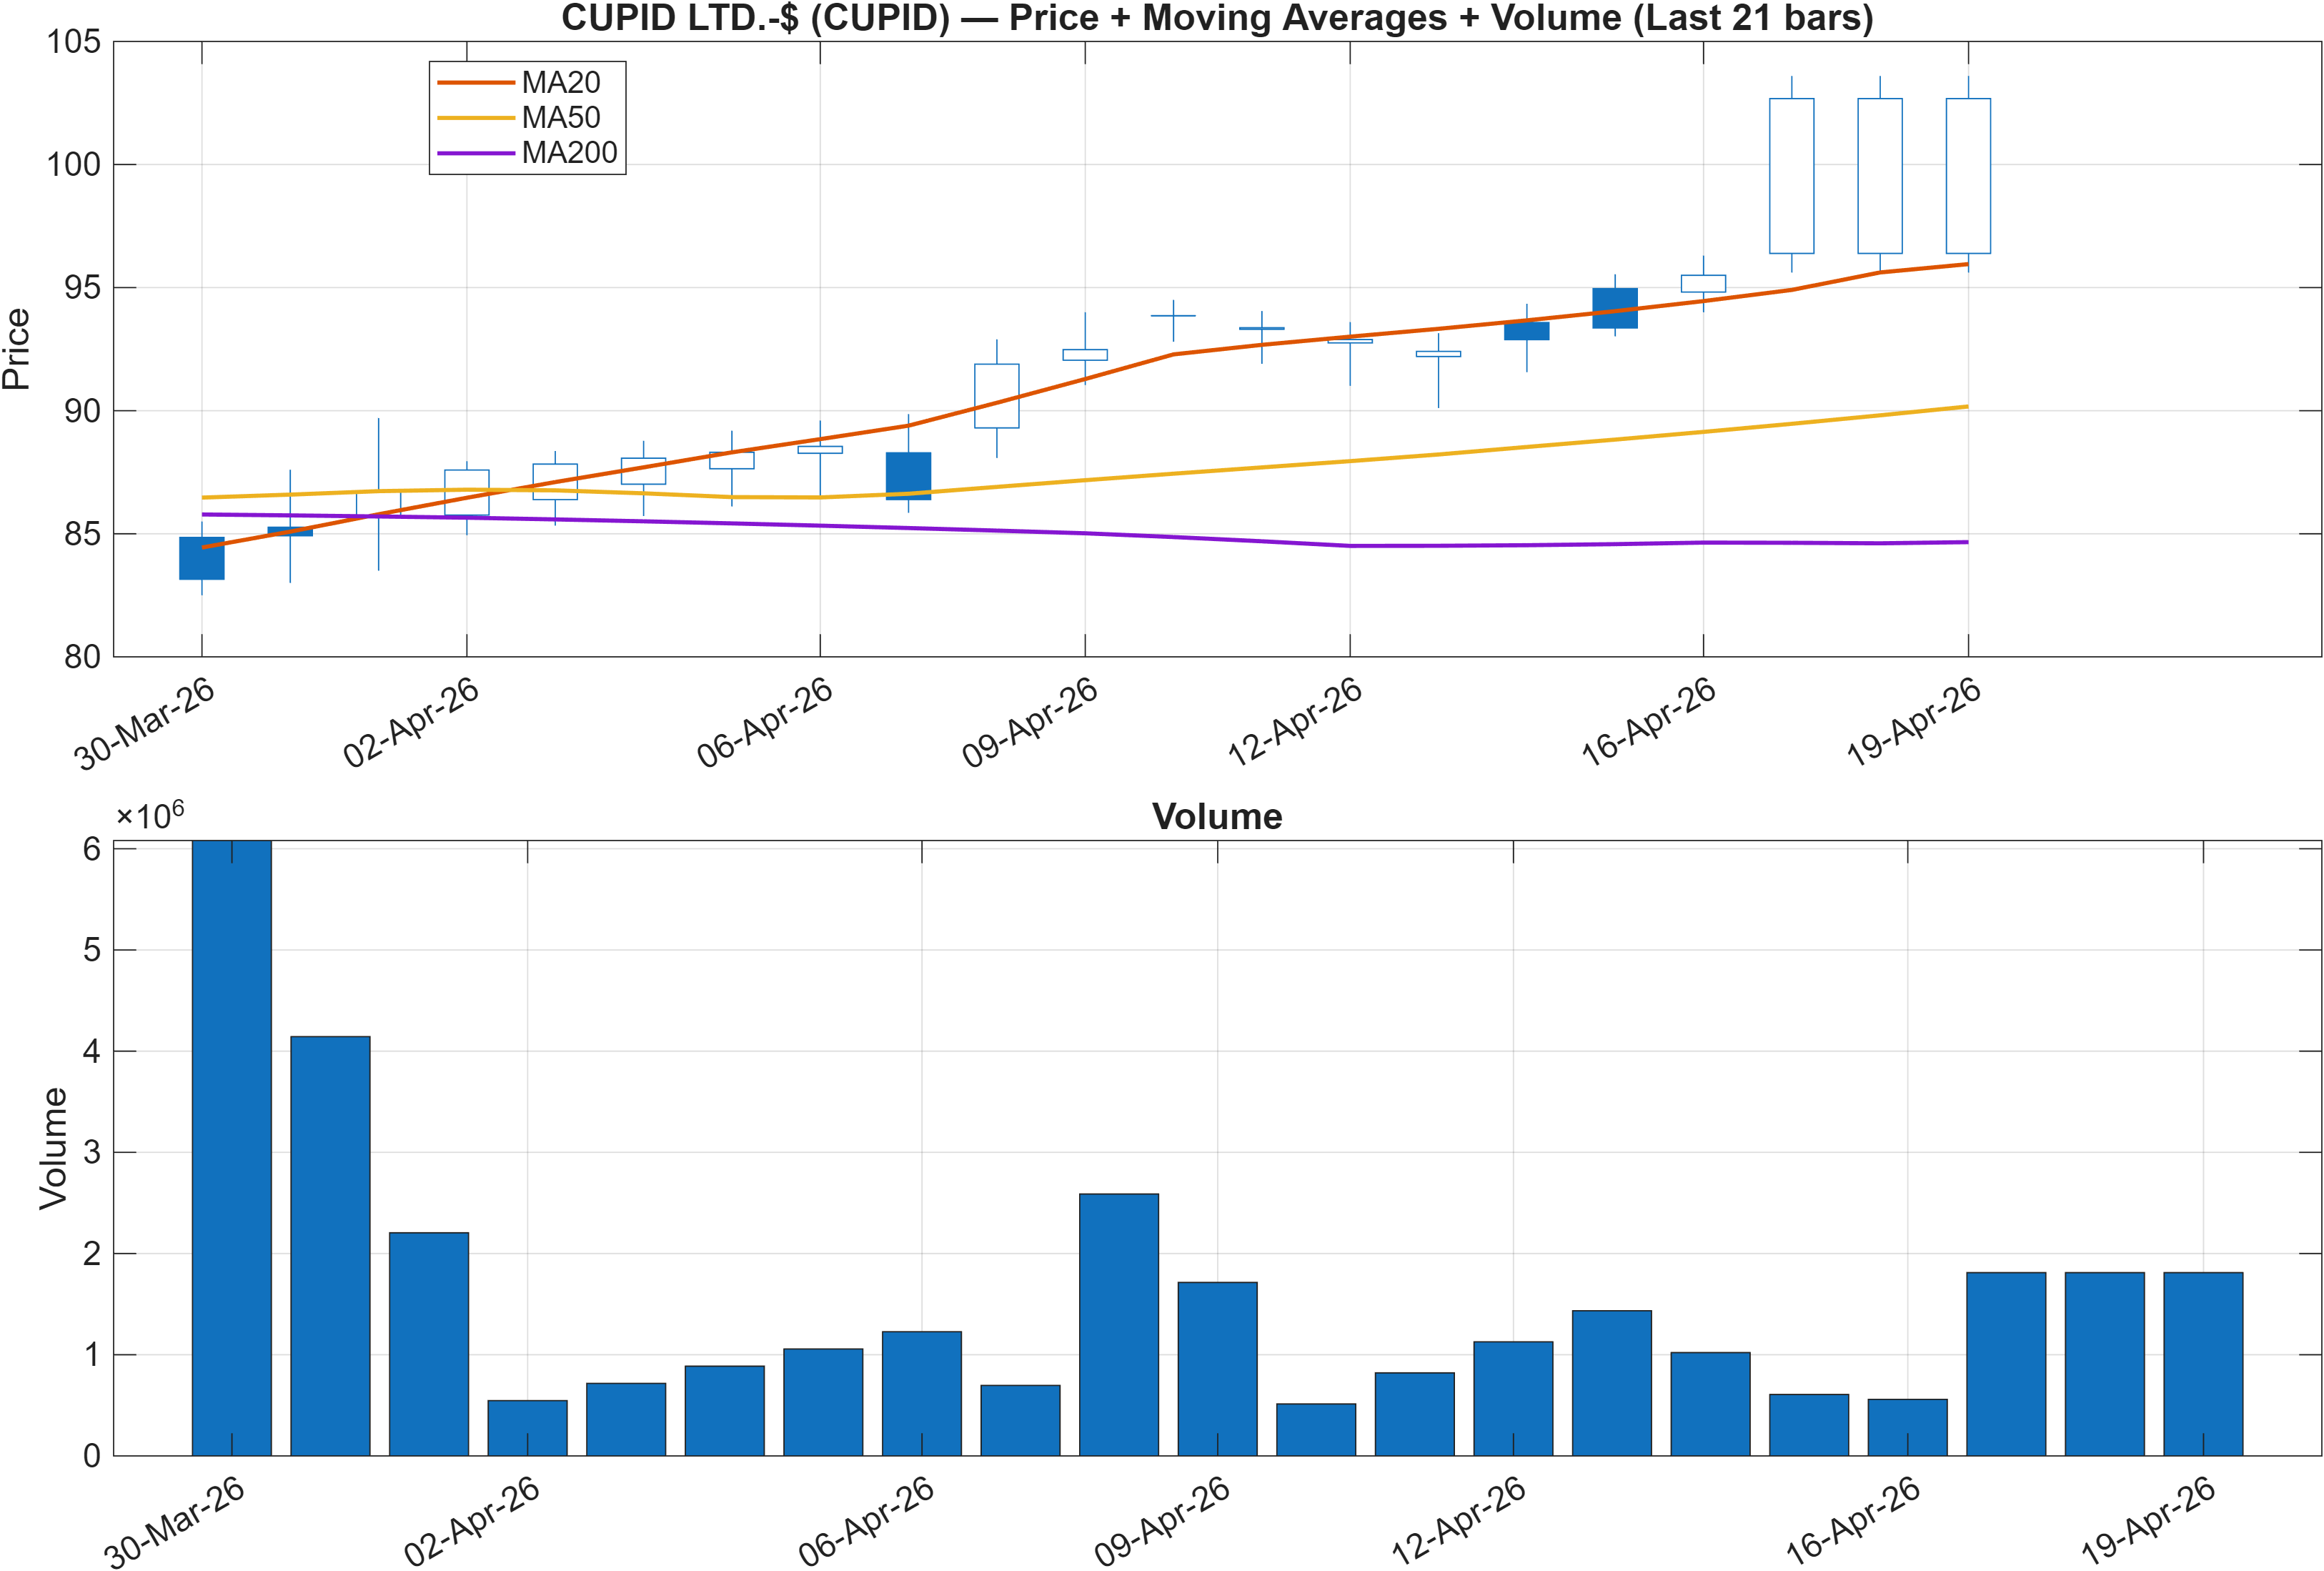
Trend structure is aligned across the primary moving-average checks: Close vs MA50 = Bullish and MA50 vs MA200 = Bullish. In practice, this combination typically reflects a market that is both directionally constructive (price holding above its intermediate trend) and structurally supported (intermediate trend above the longer baseline). When this alignment coincides with strong multi-horizon ranks (e.g., Monthly #16 and 3-Monthly #7), it increases confidence that the trend is not only present, but also persistent in relative terms.
The key analytical question becomes whether the trend is transitioning from “healthy continuation” into “late-stage extension.” Momentum readings elsewhere in the report—such as RSI(14) at 83.67—suggest the tape is elevated, which can coexist with trend strength but also increases sensitivity to pullbacks or range-bound digestion. This is where volume confirmation matters: continuation setups tend to hold above the MA50 during pauses and re-accelerate on improving participation, while exhaustion phases often show weaker follow-through even if moving averages remain bullish.
Structurally, the report’s decision framework uses the published zones (support near 77.7167, resistance near 424.5000) to define where trend integrity is affirmed or questioned. With the moving-average stack constructive, pullbacks that remain well-behaved versus support are more consistent with trend maintenance than breakdown. Conversely, a sustained deterioration through support would matter more in a high-momentum environment because it would represent a shift in both structure and positioning rather than a routine dip.
Interpretation: Close vs MA50 = Bullish, MA50 vs MA200 = Bullish.
3) Momentum & volatility dashboard
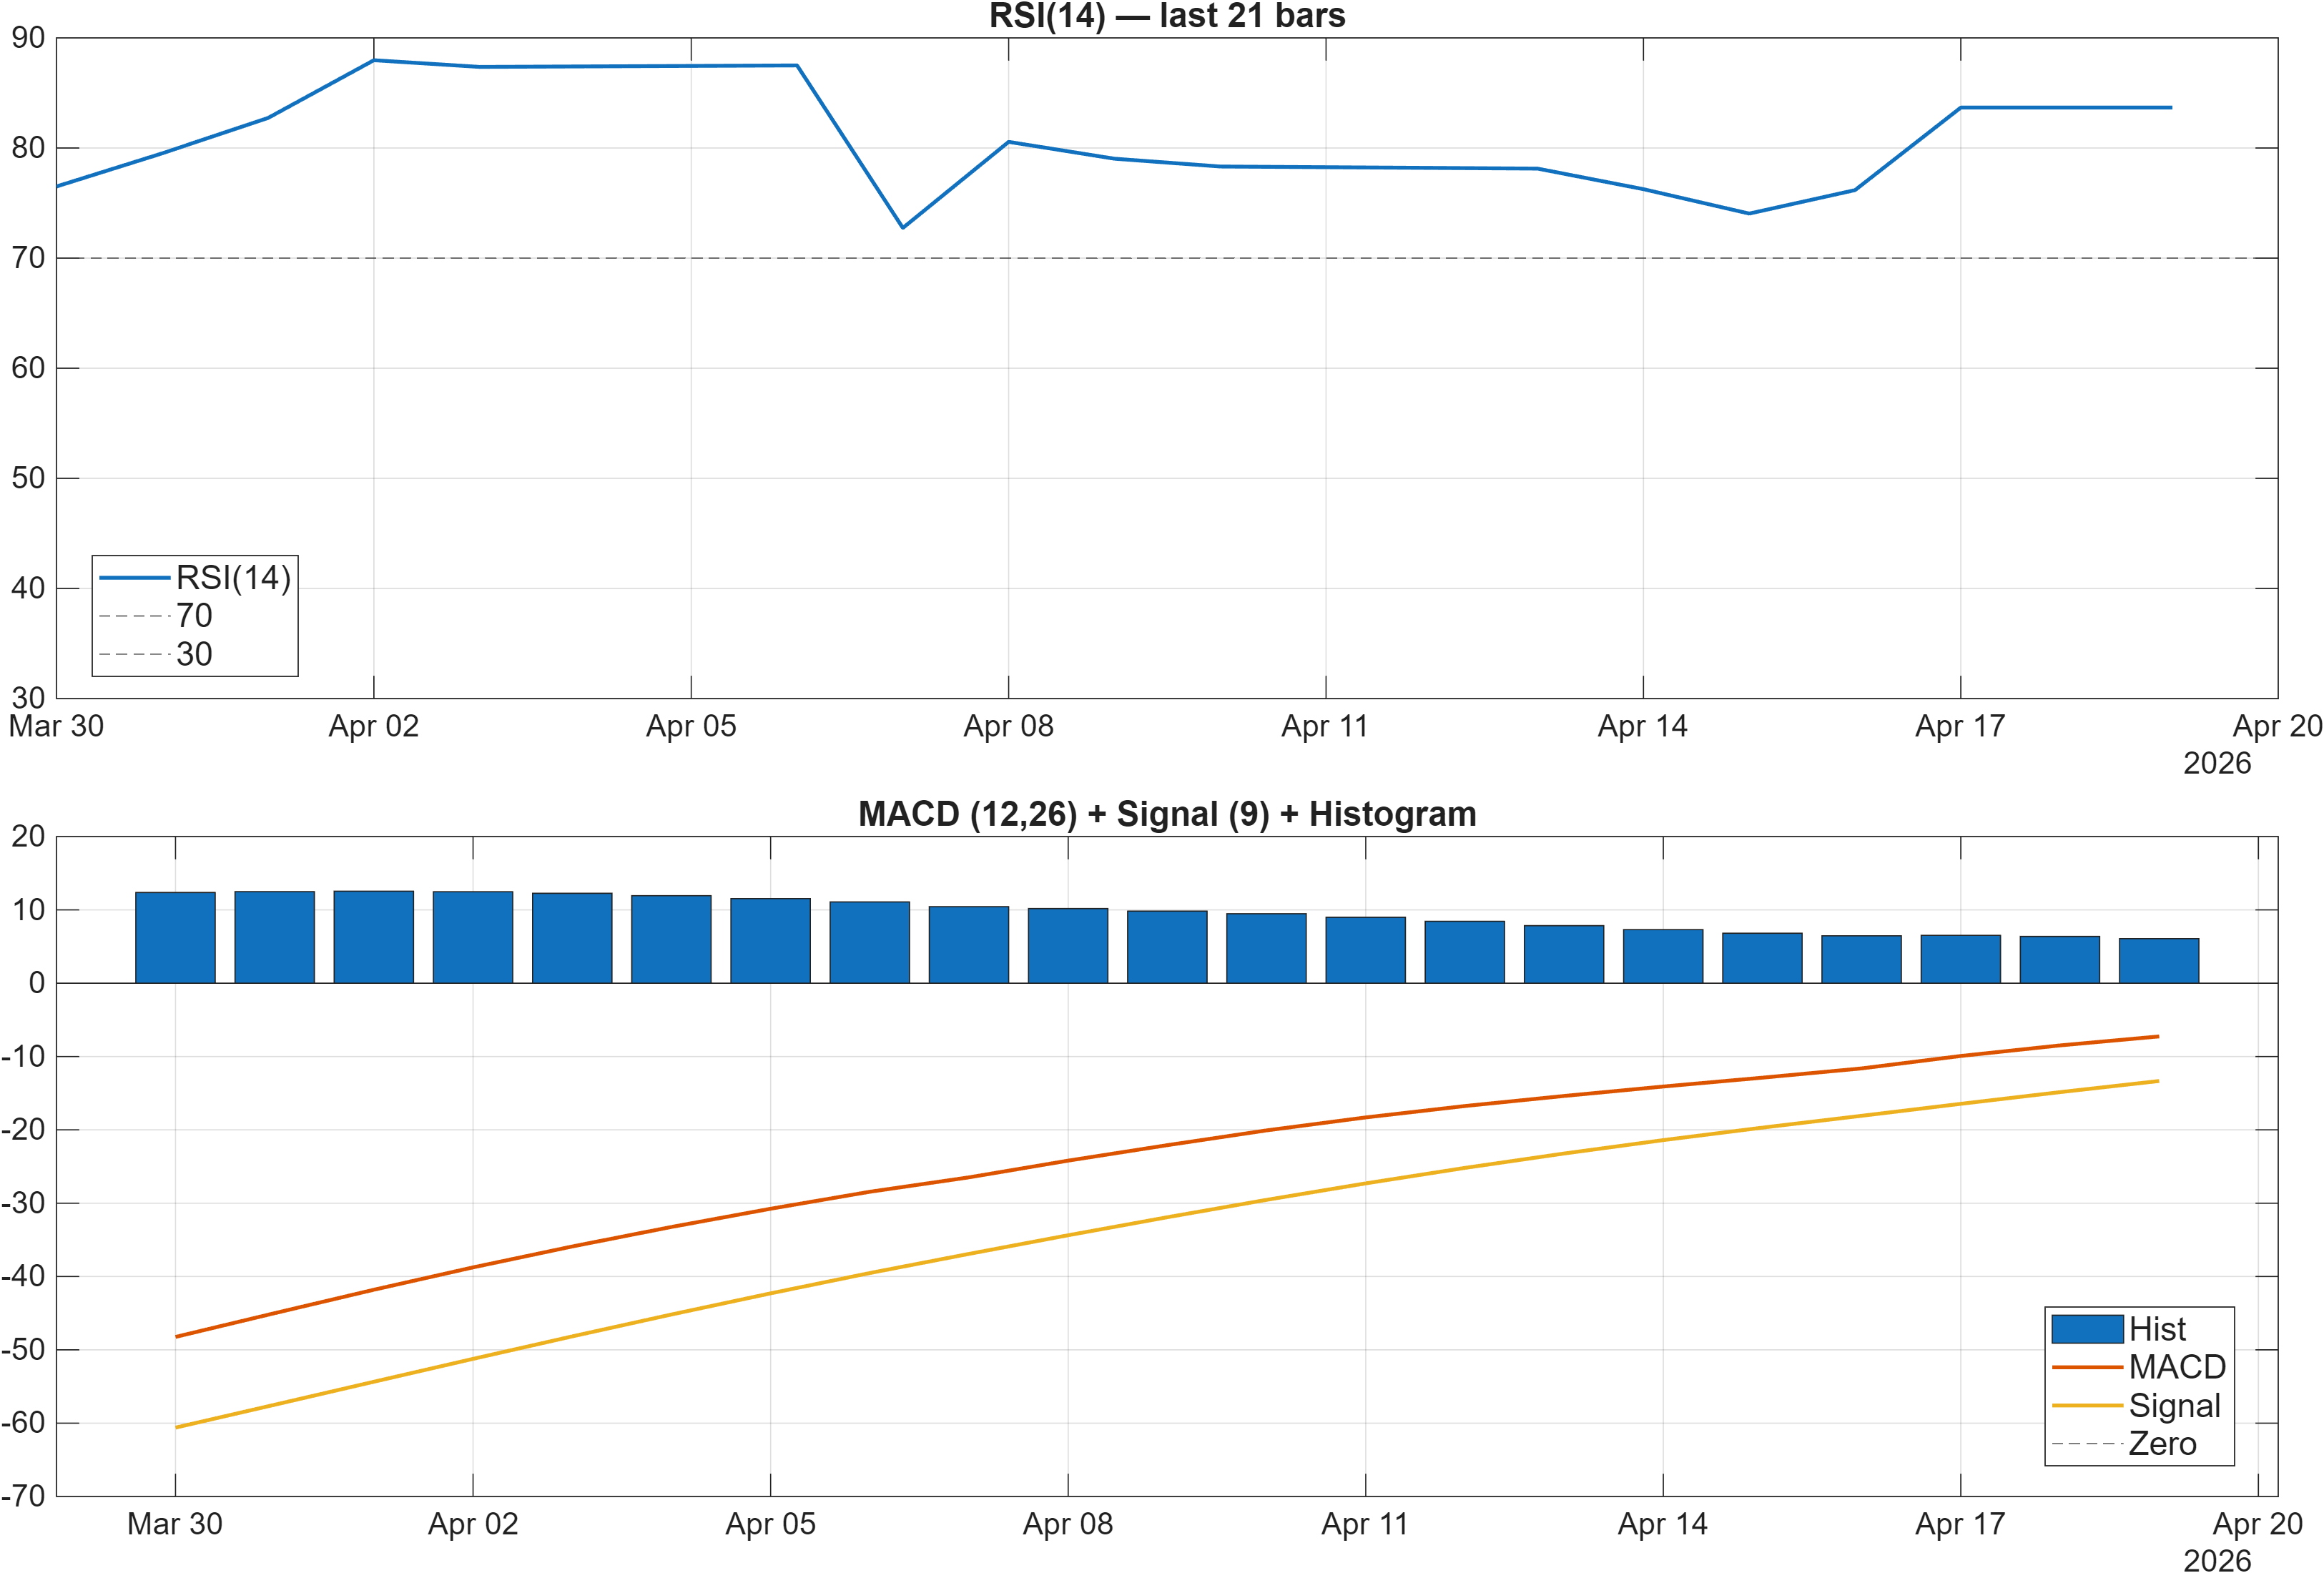
Momentum is decisively constructive, but with signs of “strength-at-speed.” RSI bias is labeled bullish, and the indicator table places RSI(14) at 83.67, a level commonly associated with extended conditions. Extension is not inherently bearish; it often occurs during strong trends. The analytical difference is whether extension is accompanied by deteriorating impulse—here, the MACD histogram remains positive at 6.0789, reinforcing that upside momentum has not obviously rolled over at the time of sampling.
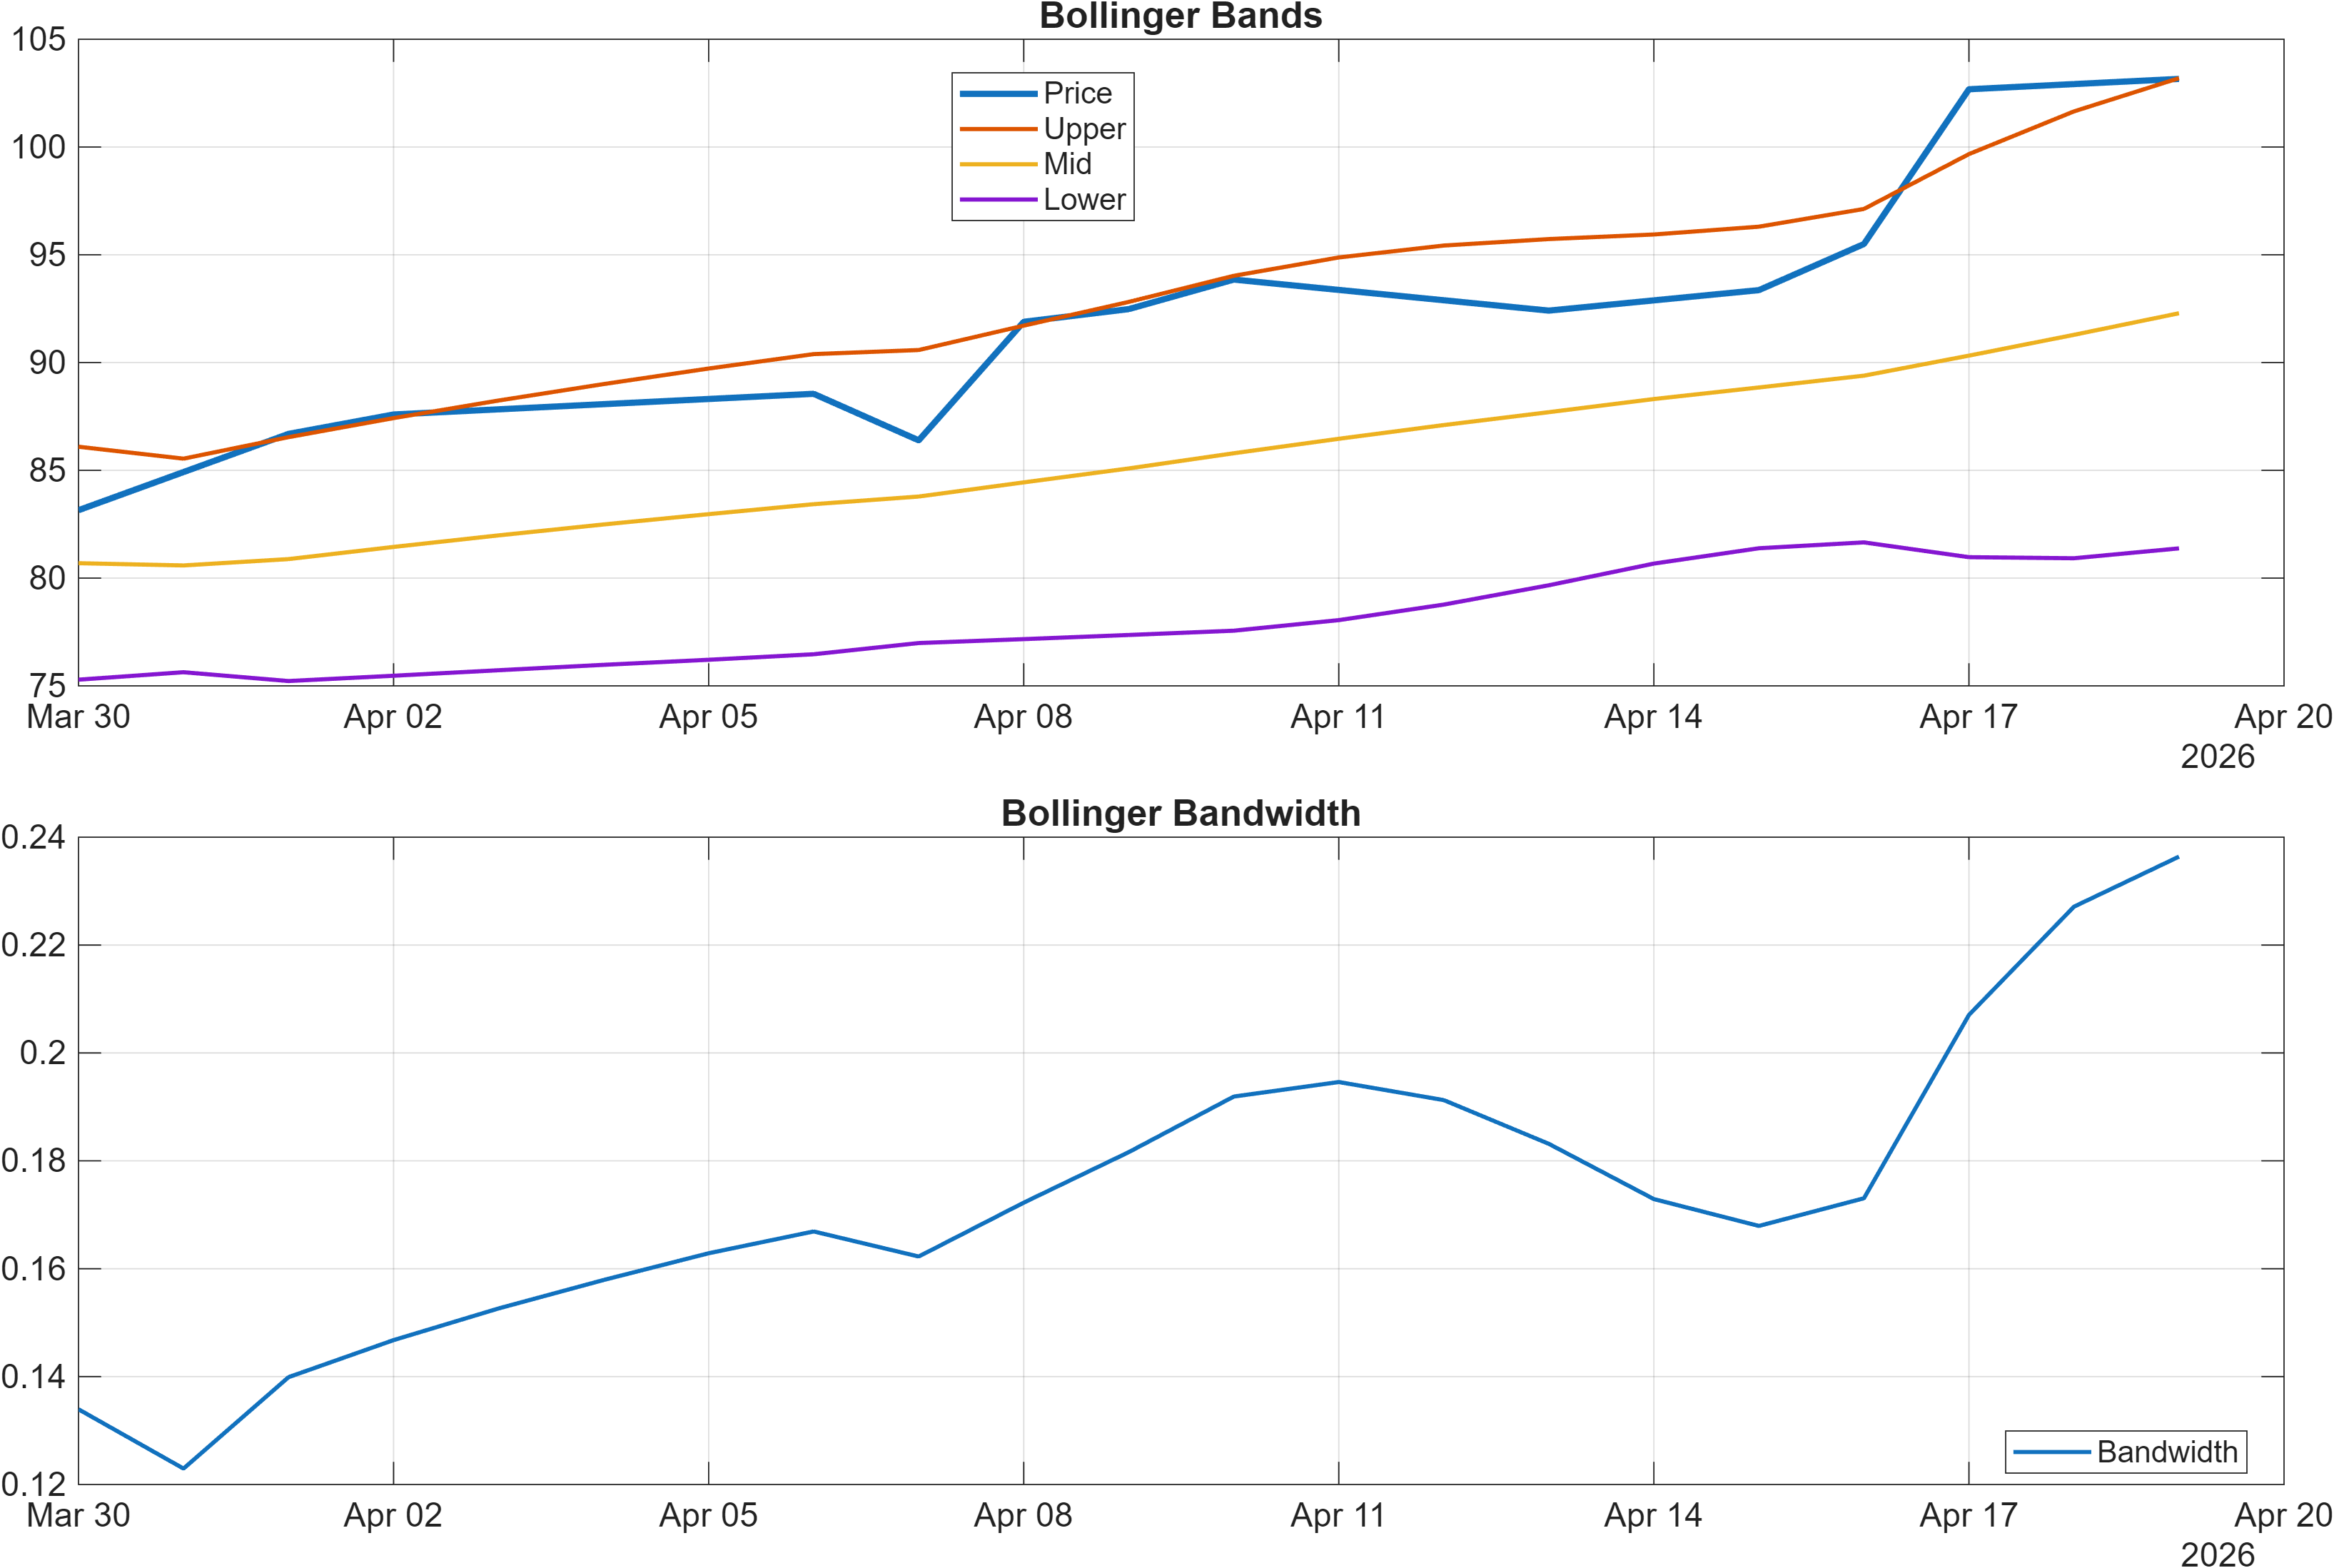
Volatility context is more neutral than momentum. Bollinger bandwidth at 0.2364 is presented as the latest regime read; the signal table also tags BB Width as Neutral. This matters because the highest-conviction acceleration phases often coincide with volatility expansion, whereas trend continuation can persist with stable bandwidth as price “walks the band.” A neutral bandwidth signal suggests the market may be in a managed trend rather than a fresh breakout expansion.
Cross-checking the signal table highlights a nuanced risk: Stoch %K is 93.18 and flagged Bearish, which frequently reflects overbought/mean-reversion pressure even as broader momentum stays positive. The most constructive continuation profile is when overbought oscillators relieve via time (sideways) instead of price (sharp drawdown), while MACD and trend measures stay supportive. In that framing, a stable-to-rising MACD histogram alongside neutral bandwidth can describe a market that digests without breaking structure—unless the support framework is violated.
Interpretation: RSI bias = Bullish, MACD hist = 6.0789.
Interpretation: Bandwidth (volatility regime) latest = 0.2364.
4) Support / Resistance zones
Support ~ 77.7167 | Resistance ~ 424.5000
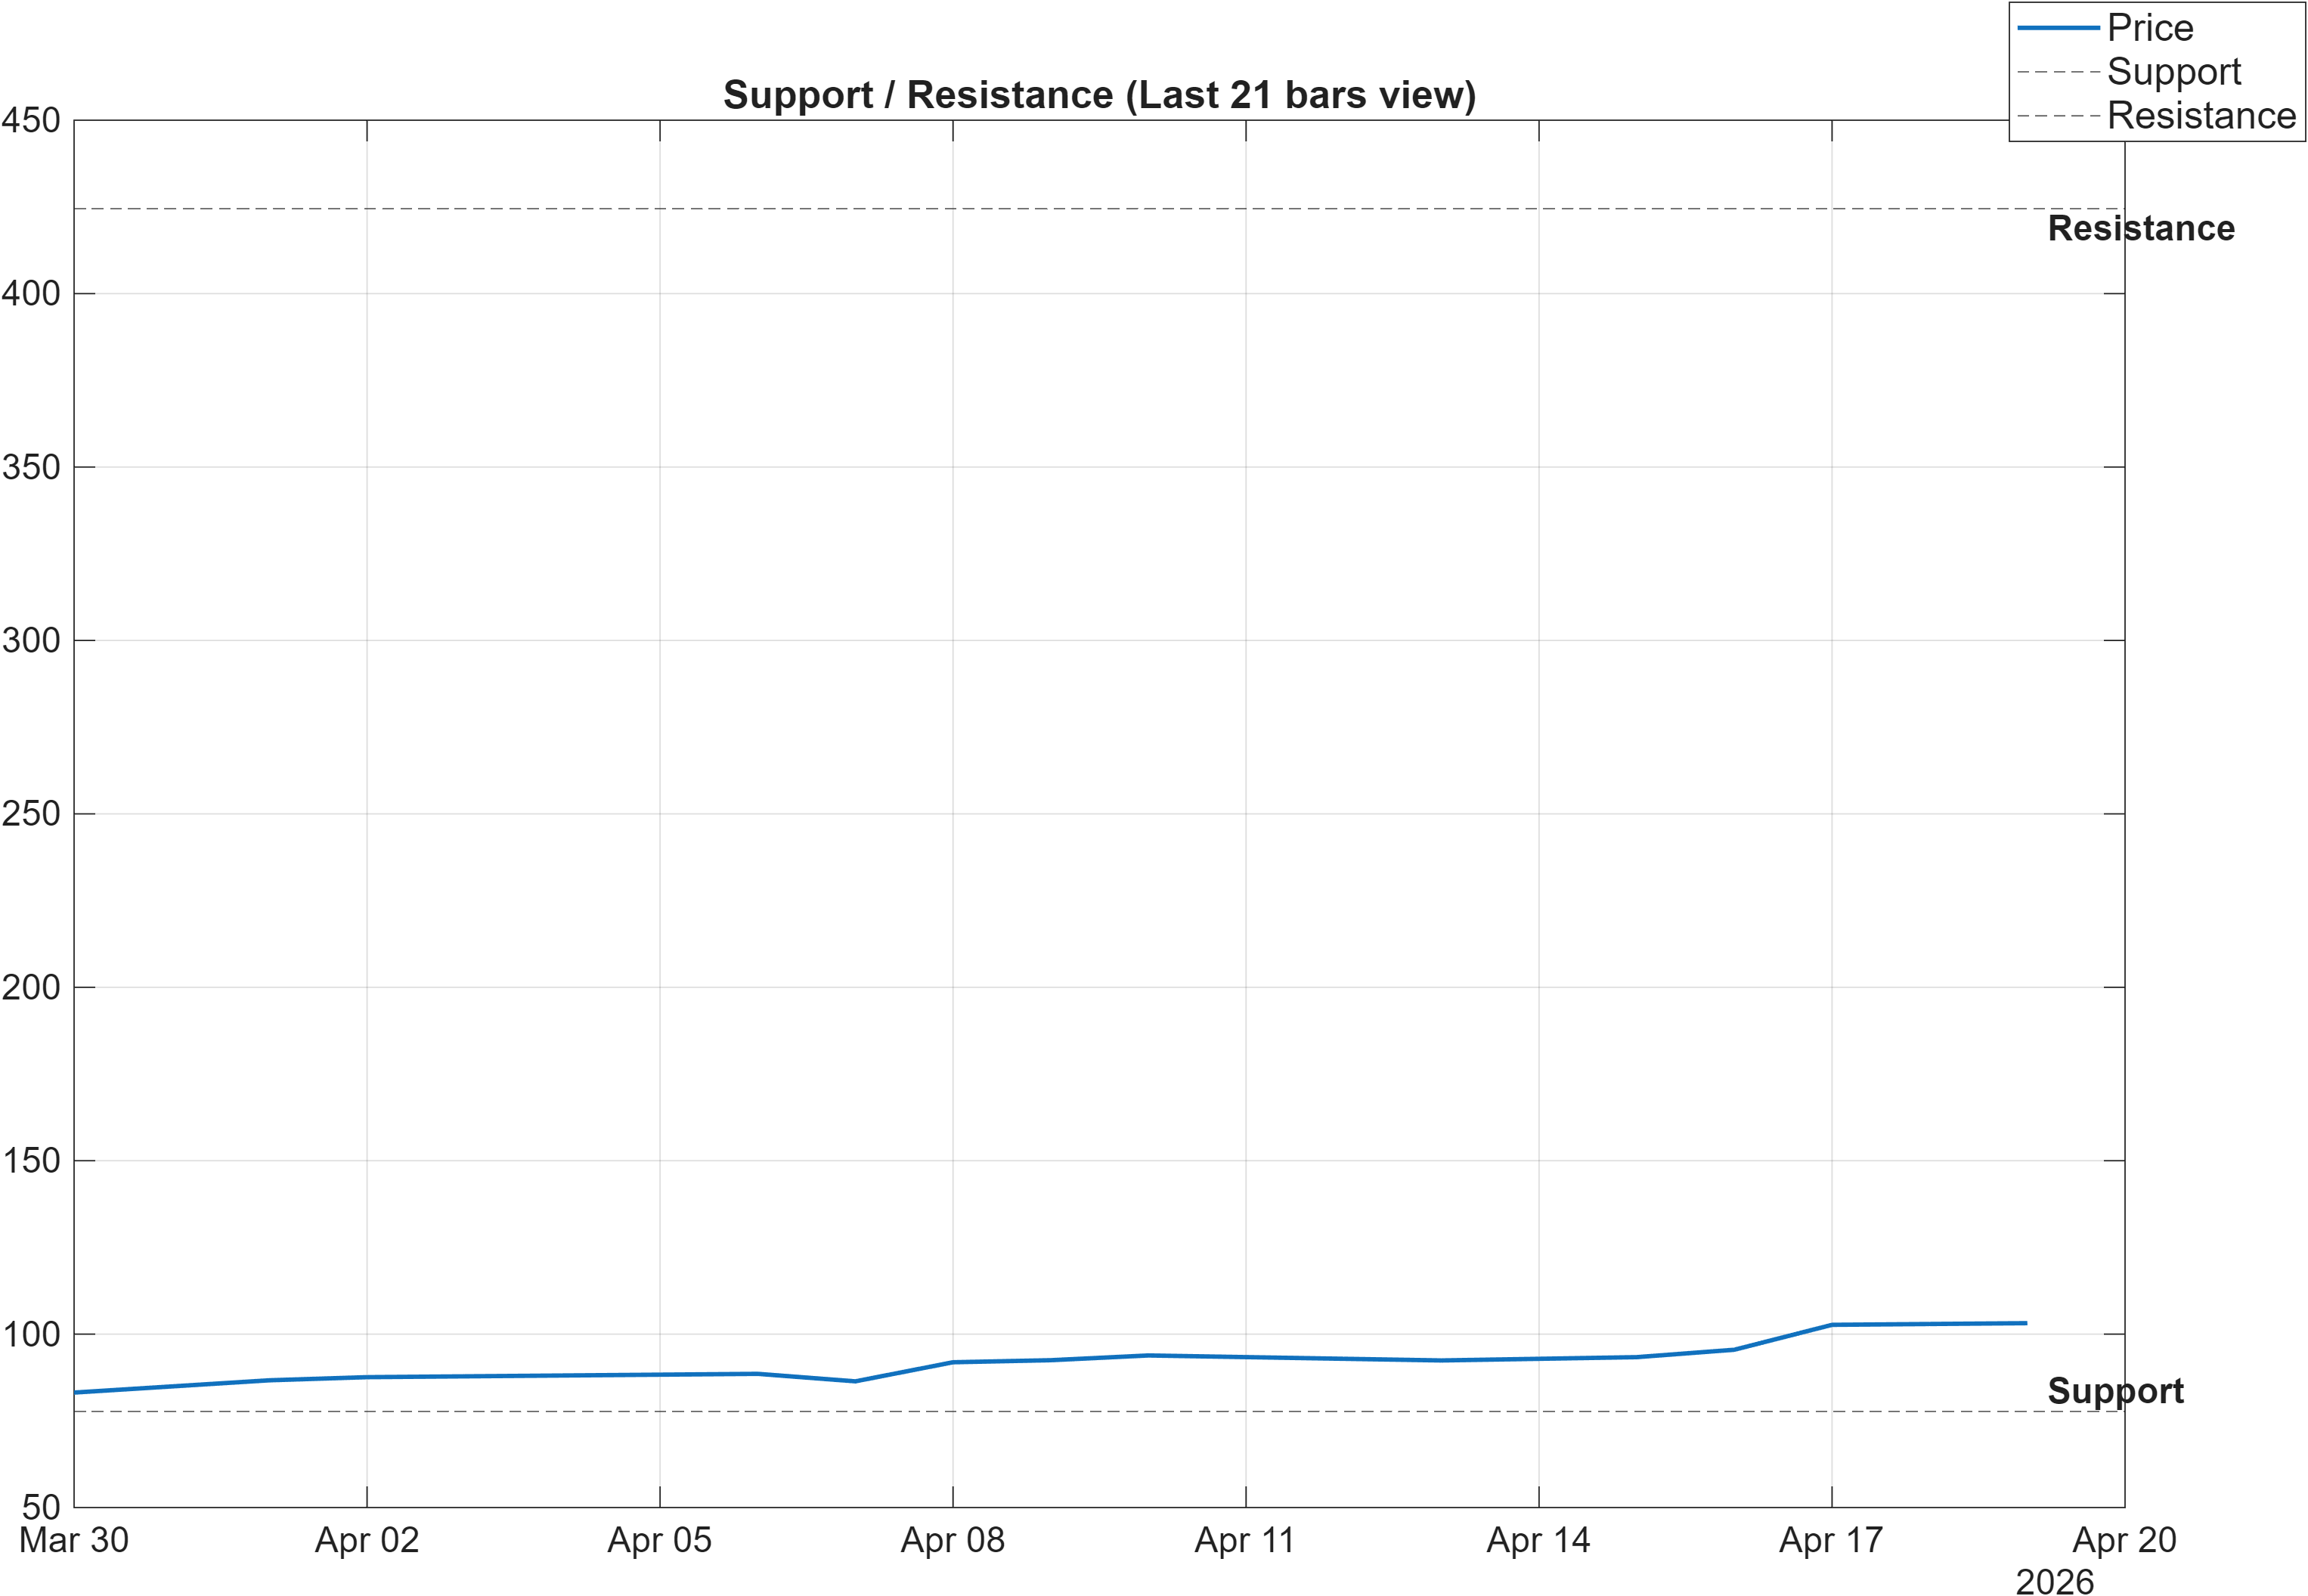
The support/resistance map is the report’s primary “decision geometry.” With support near 77.7167 and resistance near 424.5000, the framework emphasizes conditional interpretation rather than forecasting. In an environment where the moving-average structure is bullish and momentum is elevated (RSI(14) 83.67), these zones become the practical boundary between continuation and deterioration.
The scenario guidance is explicit: break above resistance with volume supports continuation, while a close below support introduces signal deterioration risk. For an extended momentum setup, the “volume” condition is not cosmetic; it is a filter intended to reduce false breakouts, especially when oscillators are already stretched and short-term reversals can occur even in broader uptrends. Conversely, a close below support has outsized informational value when multi-horizon ranks are strong (e.g., 3-Monthly #7), because it would represent a structural deviation against an otherwise favorable cross-sectional profile.
The other key lens is time: neutral volatility (bandwidth 0.2364) suggests the market may not be in an explosive expansion phase, so “confirmation” can take the form of consistent closes that respect structure rather than a single large-range bar. If price action begins to show repeated failure to hold above intermediate trend measures (consistent with the “Close vs MA50” test), that would increase the likelihood that the resistance zone remains binding and the market is transitioning from trend continuation to a mean-reversion regime.
Scenario view: Break above resistance with volume → continuation. Close below support → signal deterioration risk.
5) Quant Technical Dashboard (18 Signals)
KGNAI AI Technical Analysis Score (Deep Reinforcement Learning): Rank #44 out of 1222 (Rank 1 represents the strongest technical positioning and a higher probability of favorable price behavior. As ranks increase toward the maximum, the probability of favorable outcomes weakens and bearish positioning becomes more dominant.) | Label: Bullish | Score: 0.928
18-Signal Technical Confluence Score: 0.556 (Bullish)
Overall Technical Score (18-signal confluence + DRL rank blend): 0.667 (Bullish)
Note: The blended score reflects signal strength weighted against broader AI technical ranking, which may temporarily diverge.
Blended technical score breakdown: 0.667 (Bullish | Bull 13 / Bear 3 / Neutral 2)
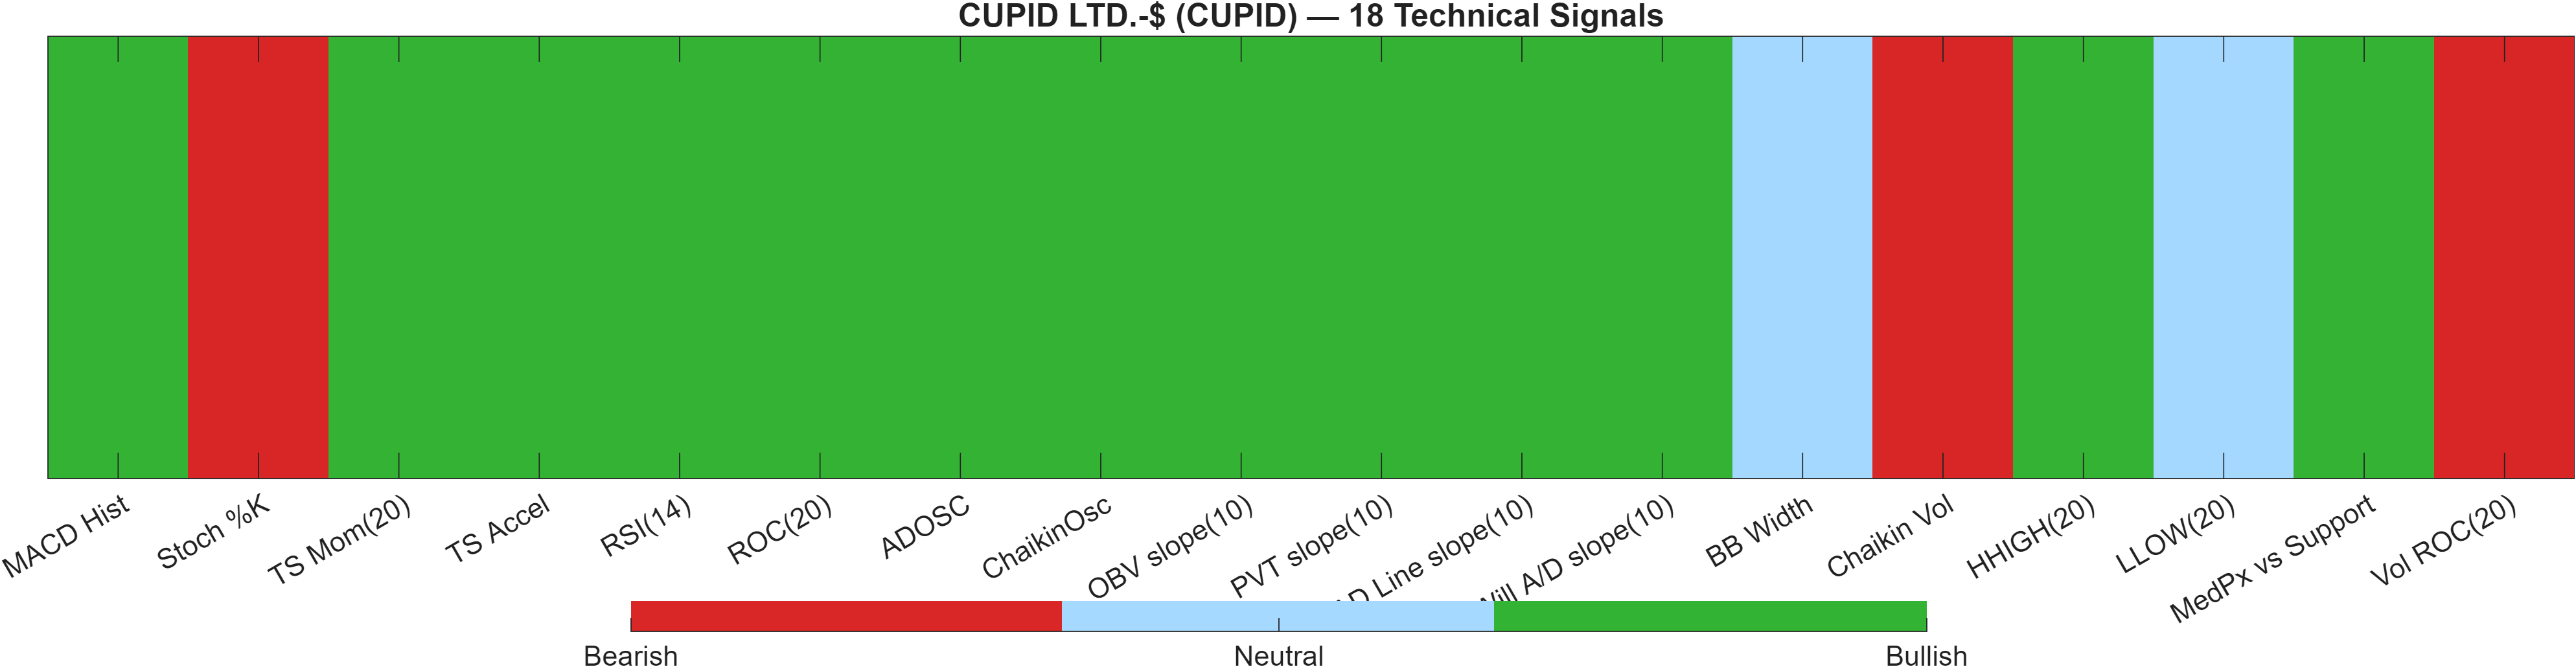
The technical dashboard shows a constructive aggregation with a meaningful robustness check: a bullish confluence score of 0.556 is reinforced by the separate DRL technical rank at #44 (score 0.928), producing an overall blended technical score of 0.667 labeled Bullish. Importantly, the blend composition—Bull 13 / Bear 3 / Neutral 2—suggests the bullish stance is not hinging on a single indicator family.
The distribution of bearish flags is the more informative detail than the bullish majority. Stoch %K at 93.18 is flagged Bearish, consistent with short-term overbought risk. Vol ROC(20) at -56.29 is also Bearish, which can indicate participation is lagging price acceleration in the most recent window. Chaikin Vol at 52.53 is the third bearish marker, adding a note of caution around volatility/flow dynamics even while price momentum remains strong.
Offsetting those risks are multiple “trend + accumulation” confirmations: MACD histogram 6.079 is bullish, TS Mom(20) at 17.76 and TS Accel at 13.64 are bullish, and several volume/flow slopes (including OBV slope(10) and AD Line slope(10)) are flagged bullish in the table. The analytical implication is a market that is trending with supportive internal structure, but potentially vulnerable to short-term cooling if volume fails to re-accelerate. This is consistent with a neutral BB Width reading (0.2364)—trend continuation is plausible, but the “next leg” may require renewed participation rather than purely momentum persistence.
Signal table (Bull/Bear/Neutral)
| Indicator | Value | Signal |
|---|---|---|
| MACD Hist | 6.079 | Bullish |
| Stoch %K | 93.18 | Bearish |
| TS Mom(20) | 17.76 | Bullish |
| TS Accel | 13.64 | Bullish |
| RSI(14) | 83.67 | Bullish |
| ROC(20) | 21.48 | Bullish |
| ADOSC | 89.36 | Bullish |
| ChaikinOsc | 1.992e+06 | Bullish |
| OBV slope(10) | 1.129e+06 | Bullish |
| PVT slope(10) | 1.475e+05 | Bullish |
| AD Line slope(10) | 5.525e+06 | Bullish |
| Will A/D slope(10) | 10.35 | Bullish |
| BB Width | 0.2364 | Neutral |
| Chaikin Vol | 52.53 | Bearish |
| HHIGH(20) | 103.6 | Bullish |
| LLOW(20) | 83 | Neutral |
| MedPx vs Support | 21.89 | Bullish |
| Vol ROC(20) | -56.29 | Bearish |
Interpretation: Indicator-level signals form the base confluence, which is then adjusted using a separate AI-driven technical ranking model. The final technical score summarizes this combined view.
6) News sentiment + extractive gist
Note: Instrument-specific news matches were not found, so the digest includes broader market/sector headlines. Links are provided for verification.
Sentiment score (avg): 0.220 | Positive: 56% | Neutral: 38% | Negative: 6%
KGNAI AI News Sentiment Score (normalized -1 to +1): Not available (as of —) | Label: Not available | Overall news score: 0.22
Positive Developments
Recent coverage across major financial outlets indicates a generally constructive tone in parts of the Indian equity landscape, with sentiment favoring select large-cap and liquid names and emphasizing resilience in corporate results narratives. Within the aggregated digest, the positive skew is visible in the sentiment mix—56% positive versus 6% negative—supporting a mild pro-risk contextual backdrop rather than a defensive one. For CUPID, the key limitation is relevance: the provided dataset explicitly notes that instrument-specific matches were not found, so these positives function as context and not as direct catalysts. Even so, when technical conditions are already strong (e.g., Overall Technical Score 0.667 and DRL rank #44), a supportive ambient news tone can reduce friction around continuation, particularly if it coincides with stable market breadth and participation.
Neutral / Mixed Developments
A meaningful share of the digest reads informational rather than directional, consistent with the reported 38% neutral classification. This category often reflects calendar-driven market attention and thematic pieces that can influence short-term flow between sectors without creating a durable, single-name impulse. Because CUPID lacks instrument-specific news matches in the provided data, neutral items should be treated as background noise unless they map to risk appetite, liquidity, or broad positioning that shows up in price and volume. In that sense, neutral coverage becomes a “secondary confirmatory layer”: it matters most when it either amplifies momentum already visible in the charts (RSI bias bullish; MACD histogram 6.0789) or coincides with a stalling pattern that shifts traders toward mean reversion.
Negative / Risk Signals
The negative slice is small at 6%, but it still defines the tail-risk framing: adverse earnings outcomes, macro headwinds, or volatility in adjacent market narratives can tighten risk budgets quickly, even for technically strong names. With momentum elevated (RSI(14) 83.67) and some participation-sensitive indicators mixed (Vol ROC(20) -56.29 flagged bearish in the technical table), a deteriorating news tape can act as the trigger for a sharper pullback than the underlying trend would otherwise imply. Since the news in the dataset is not instrument-specific, risk management should remain anchored to the structural chart levels—support near 77.7167 as deterioration trigger, and resistance near 424.5000 as continuation validation—rather than to narrative interpretation.
- Whether price action confirms continuation via a break above 424.5000 accompanied by stronger participation.
- Whether any pullback holds above 77.7167, preserving the current bullish technical/rank alignment.
- Whether sentiment stays net-positive (avg 0.220) or shifts materially toward negative in broad market coverage.
Sources referenced: Reuters, Bloomberg, Yahoo Finance, MarketWatch, Investing.com
7) Sources
- Fall in provisions help ICICI Bank's net profit in Q4 FY26 — https://economictimes.indiatimes.com/markets/stocks/earnings/fall-in-provisions-help-icici-banks-net-profit-in-q4-fy26/articleshow/130353695.cms
- Network18 Q4 loss at Rs 29.61 crore, revenue up 9.7% to Rs 615.78 cr — https://economictimes.indiatimes.com/markets/stocks/earnings/network18-q4-loss-at-rs-29-61cr-revenue-up-9-7pc-to-rs-615-78cr/articleshow/130353380.cms
- Akshaya Tritiya 19th April 2026: What the scriptures actually say — https://economictimes.indiatimes.com/markets/commodities/news/akshaya-tritiya-19th-april-2026-what-the-scriptures-actually-say/articleshow/130351441.cms
- ICICI Bank Q4 Results: Net profit up 8.5% to Rs 13,702 crore, announces Rs 12 dividend — https://economictimes.indiatimes.com/markets/stocks/earnings/icici-bank-q4-results-net-profit-up-8-5-to-rs-13702-crore-announces-rs-12-dividend/articleshow/130351056.cms
- Dalal Street Week Ahead: Sector rotation signals a need for disciplined approach — https://economictimes.indiatimes.com/markets/stocks/news/dalal-street-week-ahead-sector-rotation-signals-a-need-for-disciplined-approach/articleshow/130351039.cms
- HDFC Bank Q4 Results: Net profit rises 9% to Rs 19,221 crore; announces Rs 13 dividend for FY26 — https://economictimes.indiatimes.com/markets/stocks/earnings/hdfc-bank-q4-results-net-profit-rises-9-to-rs-19221-crore-announces-rs-13-dividend-for-fy26/articleshow/130350665.cms
- Akshaya Tritiya 2026: Gold vs silver vs gold stocks. Where should investors put their money this year? — https://economictimes.indiatimes.com/markets/stocks/news/akshaya-tritiya-2026-gold-vs-silver-vs-gold-stocks-where-should-investors-put-their-money-this-year/articleshow/130350535.cms
- F&O Talk: Midcaps, smallcaps stage sharp comeback, trade above key moving averages. What's the outlook? — https://economictimes.indiatimes.com/markets/expert-view/fo-talk-midcaps-smallcaps-stage-sharp-comeback-trade-above-key-moving-averages-whats-the-outlook/articleshow/130350496.cms
You may also like: How KGNAI AI ranks instruments across global markets
Disclaimer: KGNAI provides AI-generated analytics and educational market commentary only. This is not financial advice. Markets involve risk. Always do your own research.