
Tata Technologies Limited (TATATECH) — 22-Apr-2026 Technical & Rank Review: Bearish Ranks vs Bullish Confluence at Key Support
Tata Technologies Limited (TATATECH) sits in a high-friction setup where cross-sectional KGNAI ranks remain decisively weak, while the indicator stack shows a locally constructive bias. As of 22-Apr-2026, the instrument is positioned in the lower tail of the universe on both the daily and monthly horizons (within a 1222-instrument set), yet the 18-signal framework prints a Bullish confluence score of 0.444 and a Bullish blended technical score of 0.305. This is the type of regime where signal alignment matters less than validation at decision levels: support is defined near 518.4000, with resistance near 596.7750. Momentum indicators (RSI and MACD histogram) lean positive, but volatility/volume participation is less clean, leaving the near-term move vulnerable to false breaks. News sentiment prints positive in aggregate, though the digest is not instrument-specific.
Key Takeaways
- Rank stance (Short/Mid/Long): Short-term Bearish | Mid-term Bearish | Long-term Not available
- Technical confluence: 18-signal confluence 0.444 Bullish (blended technical score 0.305 Bullish)
- Key levels: Support ~ 518.4000 | Resistance ~ 596.7750
- News sentiment bias: Avg sentiment 0.153 with 44% positive, 56% neutral, 0% negative; normalized news score 0.98 Bullish (as of 2025-10-23)
- Confirmation / invalidation: A sustained hold above 518.4000 keeps the constructive signal stack relevant; a close below support increases deterioration risk per the scenario framing.
What KGNAI Measures
KGNAI evaluates assets using large cross-sectional datasets built from millions of structured data points. Inputs incorporate fundamental metrics, technical structures, and systematically processed news sentiment. Statistical models, machine learning, and AI frameworks are used to assess relative positioning, signal alignment, and probabilistic behavior across broad universes.
How to Read This Report
- Ranks are comparative across the tracked universe, not absolute price targets.
- Confluence reflects alignment among independent signal groups.
- Support/resistance levels are probabilistic decision zones, not guarantees.
- Sentiment provides contextual bias within the broader analytical framework.
1) KGNAI AI Analysis
Region: INDIA
Total universe size: 1222 ranked instruments
- Daily rank: #1132 out of 1222 — Bearish
- Weekly rank: #1049 out of 1222 — Bearish
- Monthly rank: #1142 out of 1222 — Bearish
- 3-Monthly rank: Not available for this horizon — Not available
- 6-Monthly rank: Not available for this horizon — Not available
- Yearly rank: Not available for this horizon — Not available
Cross-sectional ranks place TATATECH in the lowest decile of the tracked universe on key horizons (daily #1132, weekly #1049, monthly #1142 out of 1222). That clustering matters more than any single print: when multiple horizons sit deep in the lower tail simultaneously, the model is typically flagging unfavorable relative behavior versus peers rather than a one-off dislocation.
The missing longer-horizon ranks (3-monthly, 6-monthly, yearly) are explicitly Not available in the provided data, which limits regime classification beyond the short/mid window. In these cases, the most reliable read is to treat the rank signal as a risk filter: it does not invalidate tactical technical improvements, but it raises the bar for confirmation.
This becomes especially relevant when the technical layer shows a bullish tilt (confluence 0.444, blended 0.305) while the rank layer remains bearish. Historically, that divergence tends to resolve through one of two pathways: either price stabilizes and ranks improve over subsequent refreshes, or the technical rebound fails and the rank weakness reasserts itself. For this report, the cleanest arbiter is behavior around support ~518.4000 and whether strength can carry toward 596.7750 without a volatility/volume relapse.
2) Price & trend overview
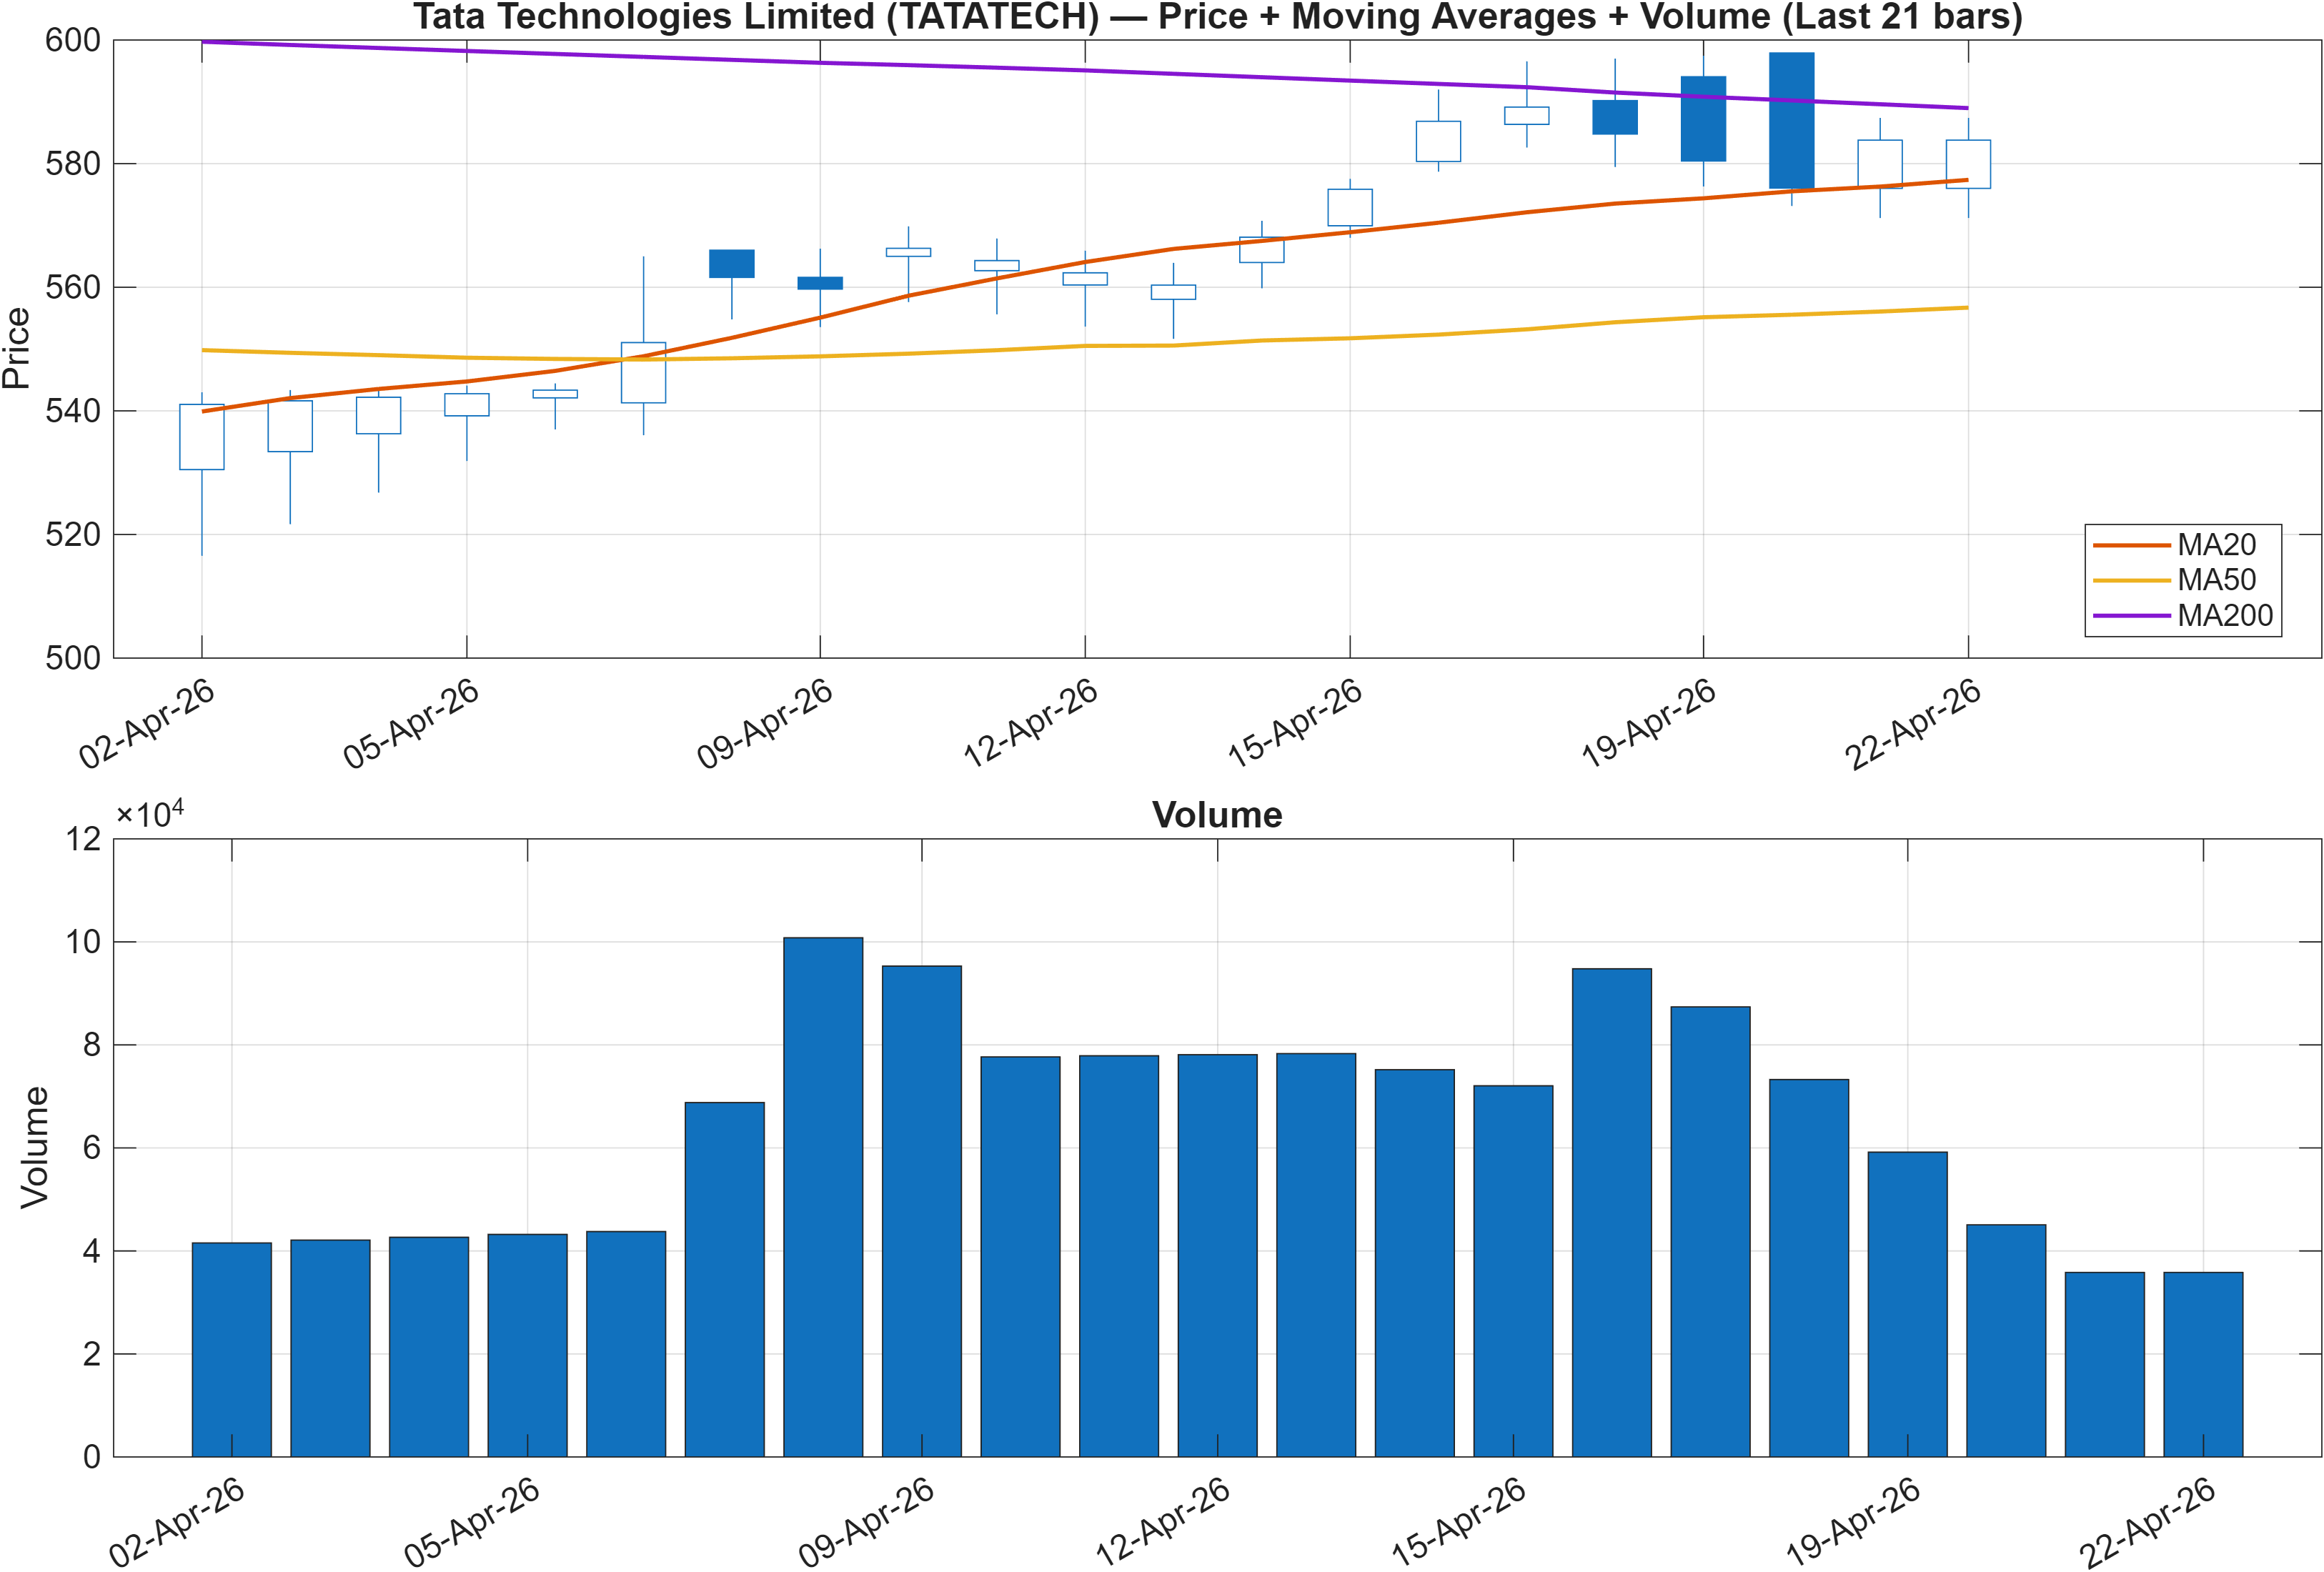
Interpretation: Close vs MA50 = Bullish, MA50 vs MA200 = Bearish.
Trend structure is best described as a mixed regime: the close being above the MA50 is a near-term constructive sign, but the MA50 remaining below the MA200 keeps the broader moving-average stack in a bearish configuration. This combination frequently indicates a rebound attempt occurring inside a longer-duration downtrend, where upside moves must prove persistence rather than simply mean-revert.
The immediate practical implication is asymmetry in how the market typically prices risk. In a MA50>close bullish state, pullbacks often find buyers earlier; however, with MA50<MA200 bearish, rallies may face earlier supply as participants use strength to reduce exposure. That tension aligns with the defined ceiling at 596.7750, which becomes the key level to watch for whether trend is transitioning or merely retracing.
Volume context is included in the chart and becomes critical when ranks are weak (daily #1132) but technicals lean bullish. Without consistent participation, the market can print higher closes while failing to change the instrument’s cross-sectional standing. For this reason, the price/MA setup should be read alongside the dashboard’s volume proxy (Vol ROC(20) -14.9, bearish) rather than in isolation.
Net: the chart backdrop argues for patience—treat strength as conditional until price behavior can challenge resistance while maintaining a stable base above 518.4000.
3) Momentum & volatility dashboard
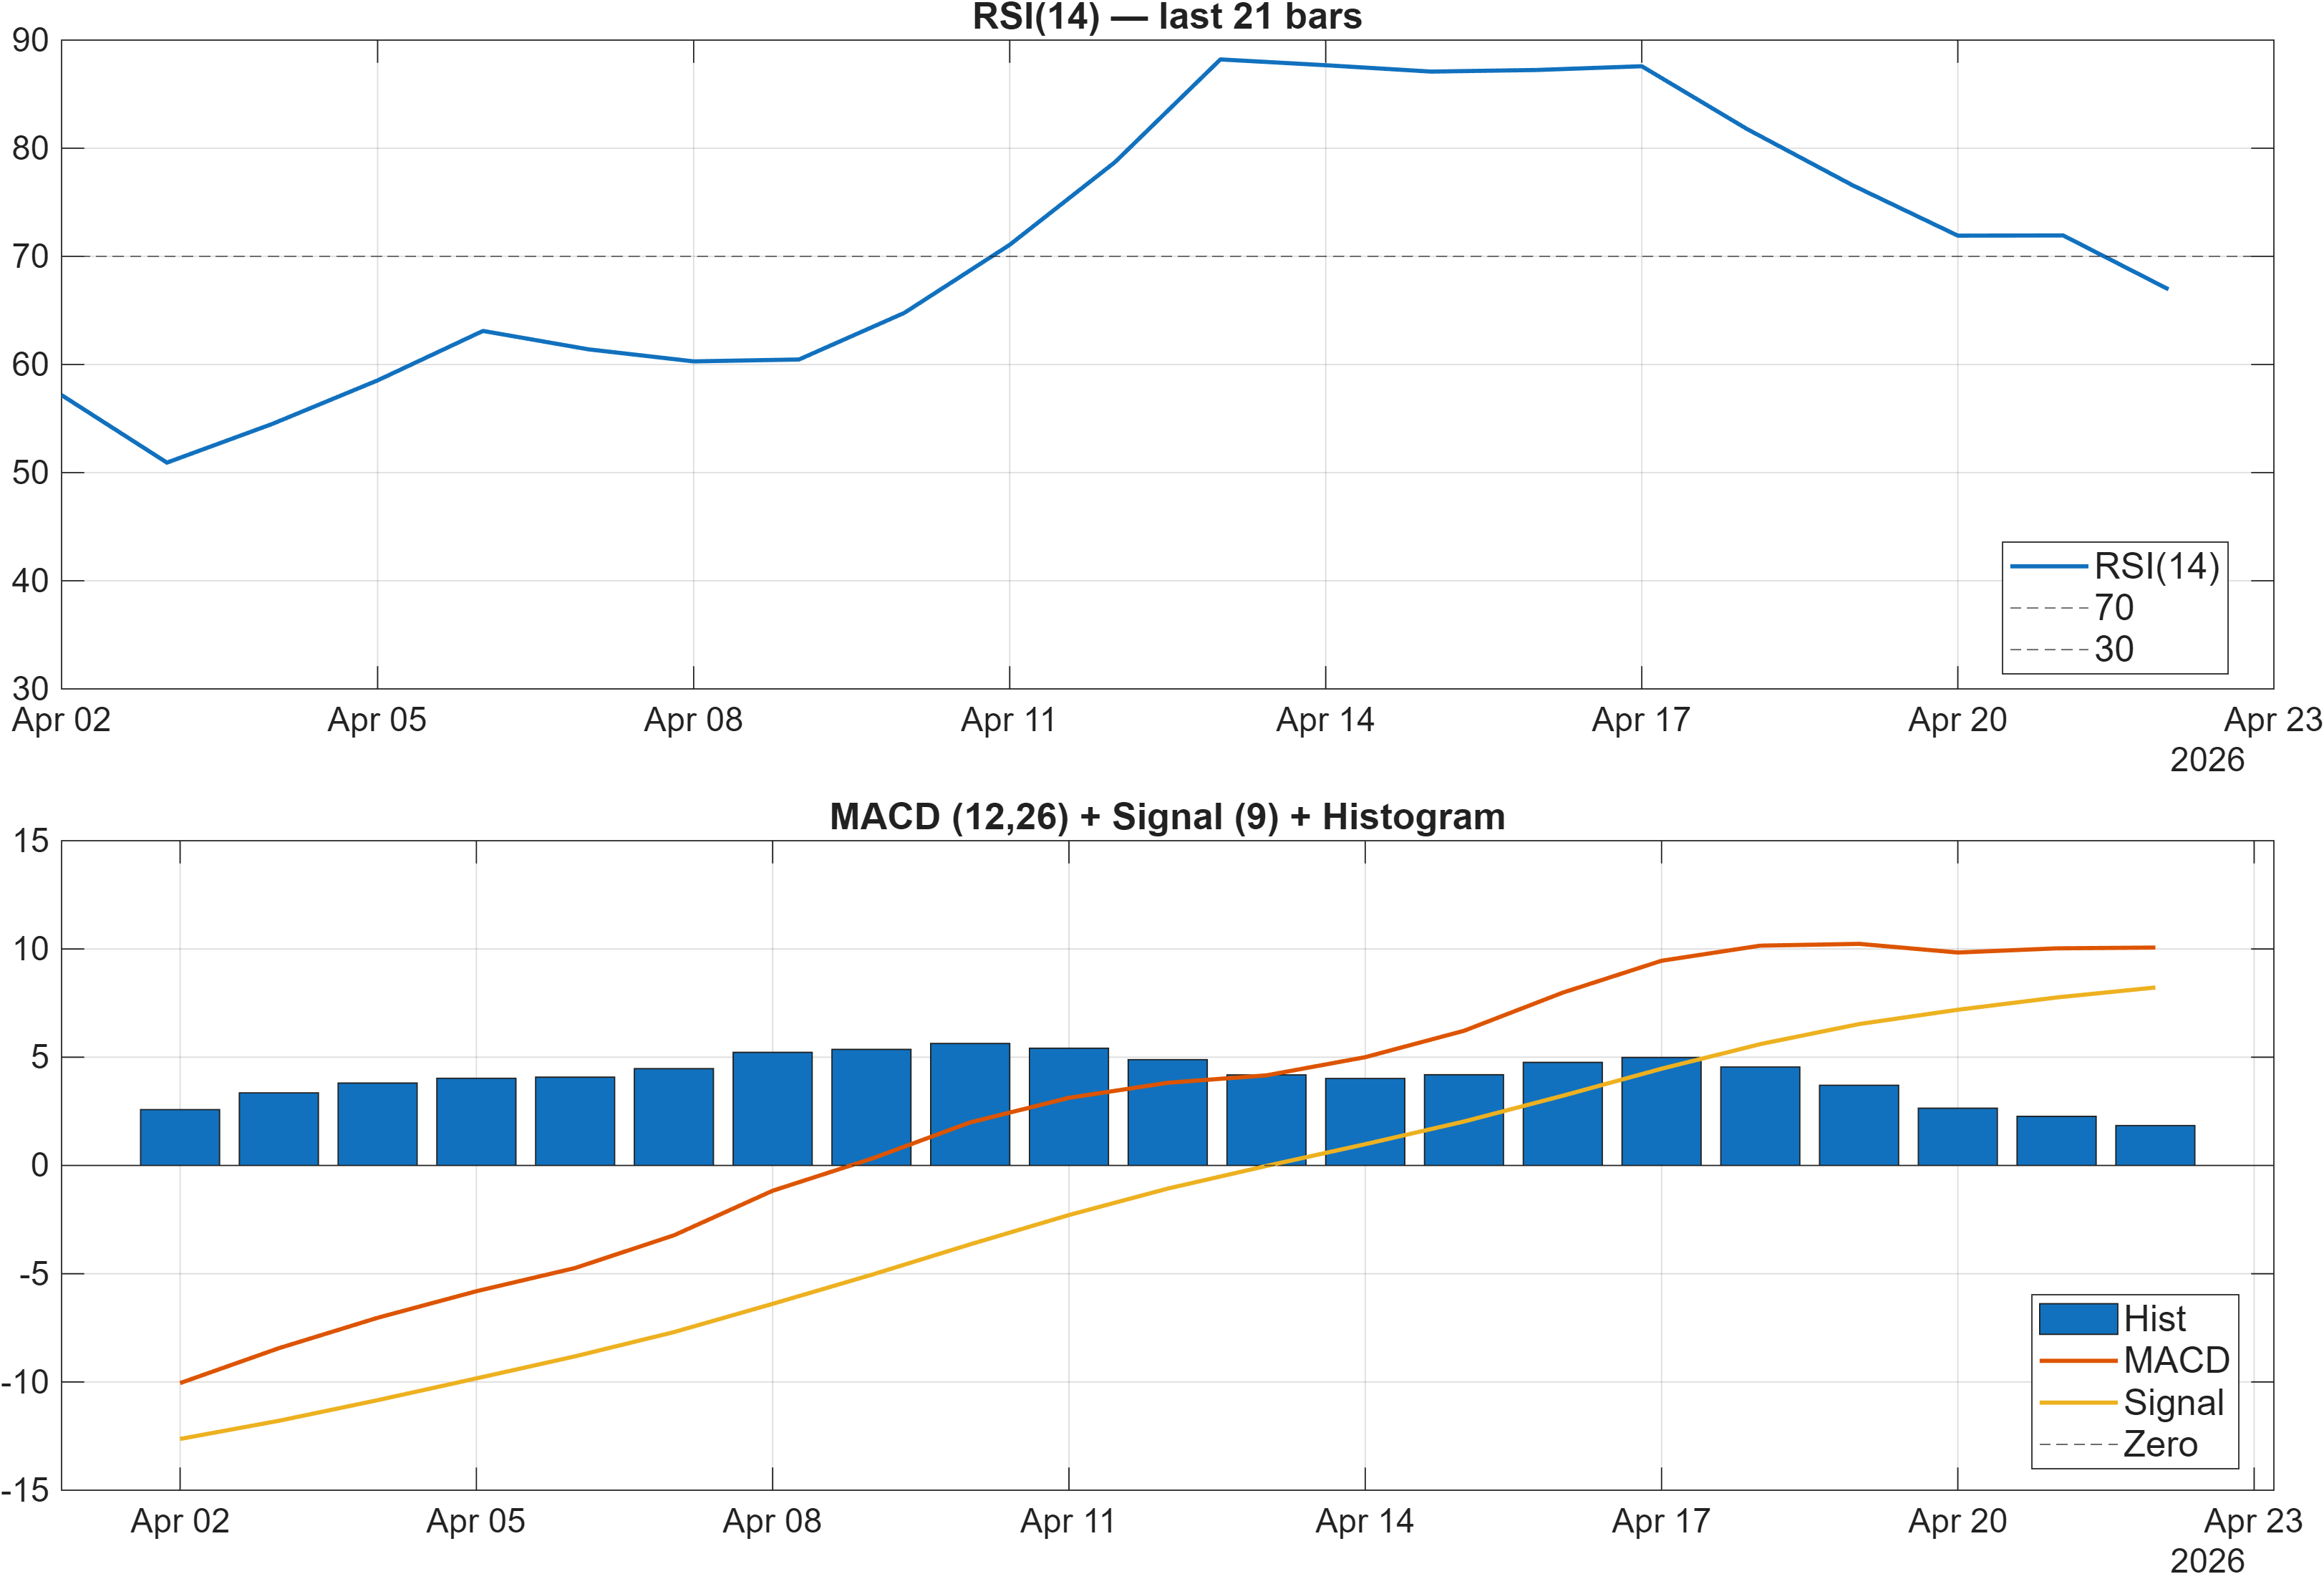
Interpretation: RSI bias = Bullish, MACD hist = 1.8444.
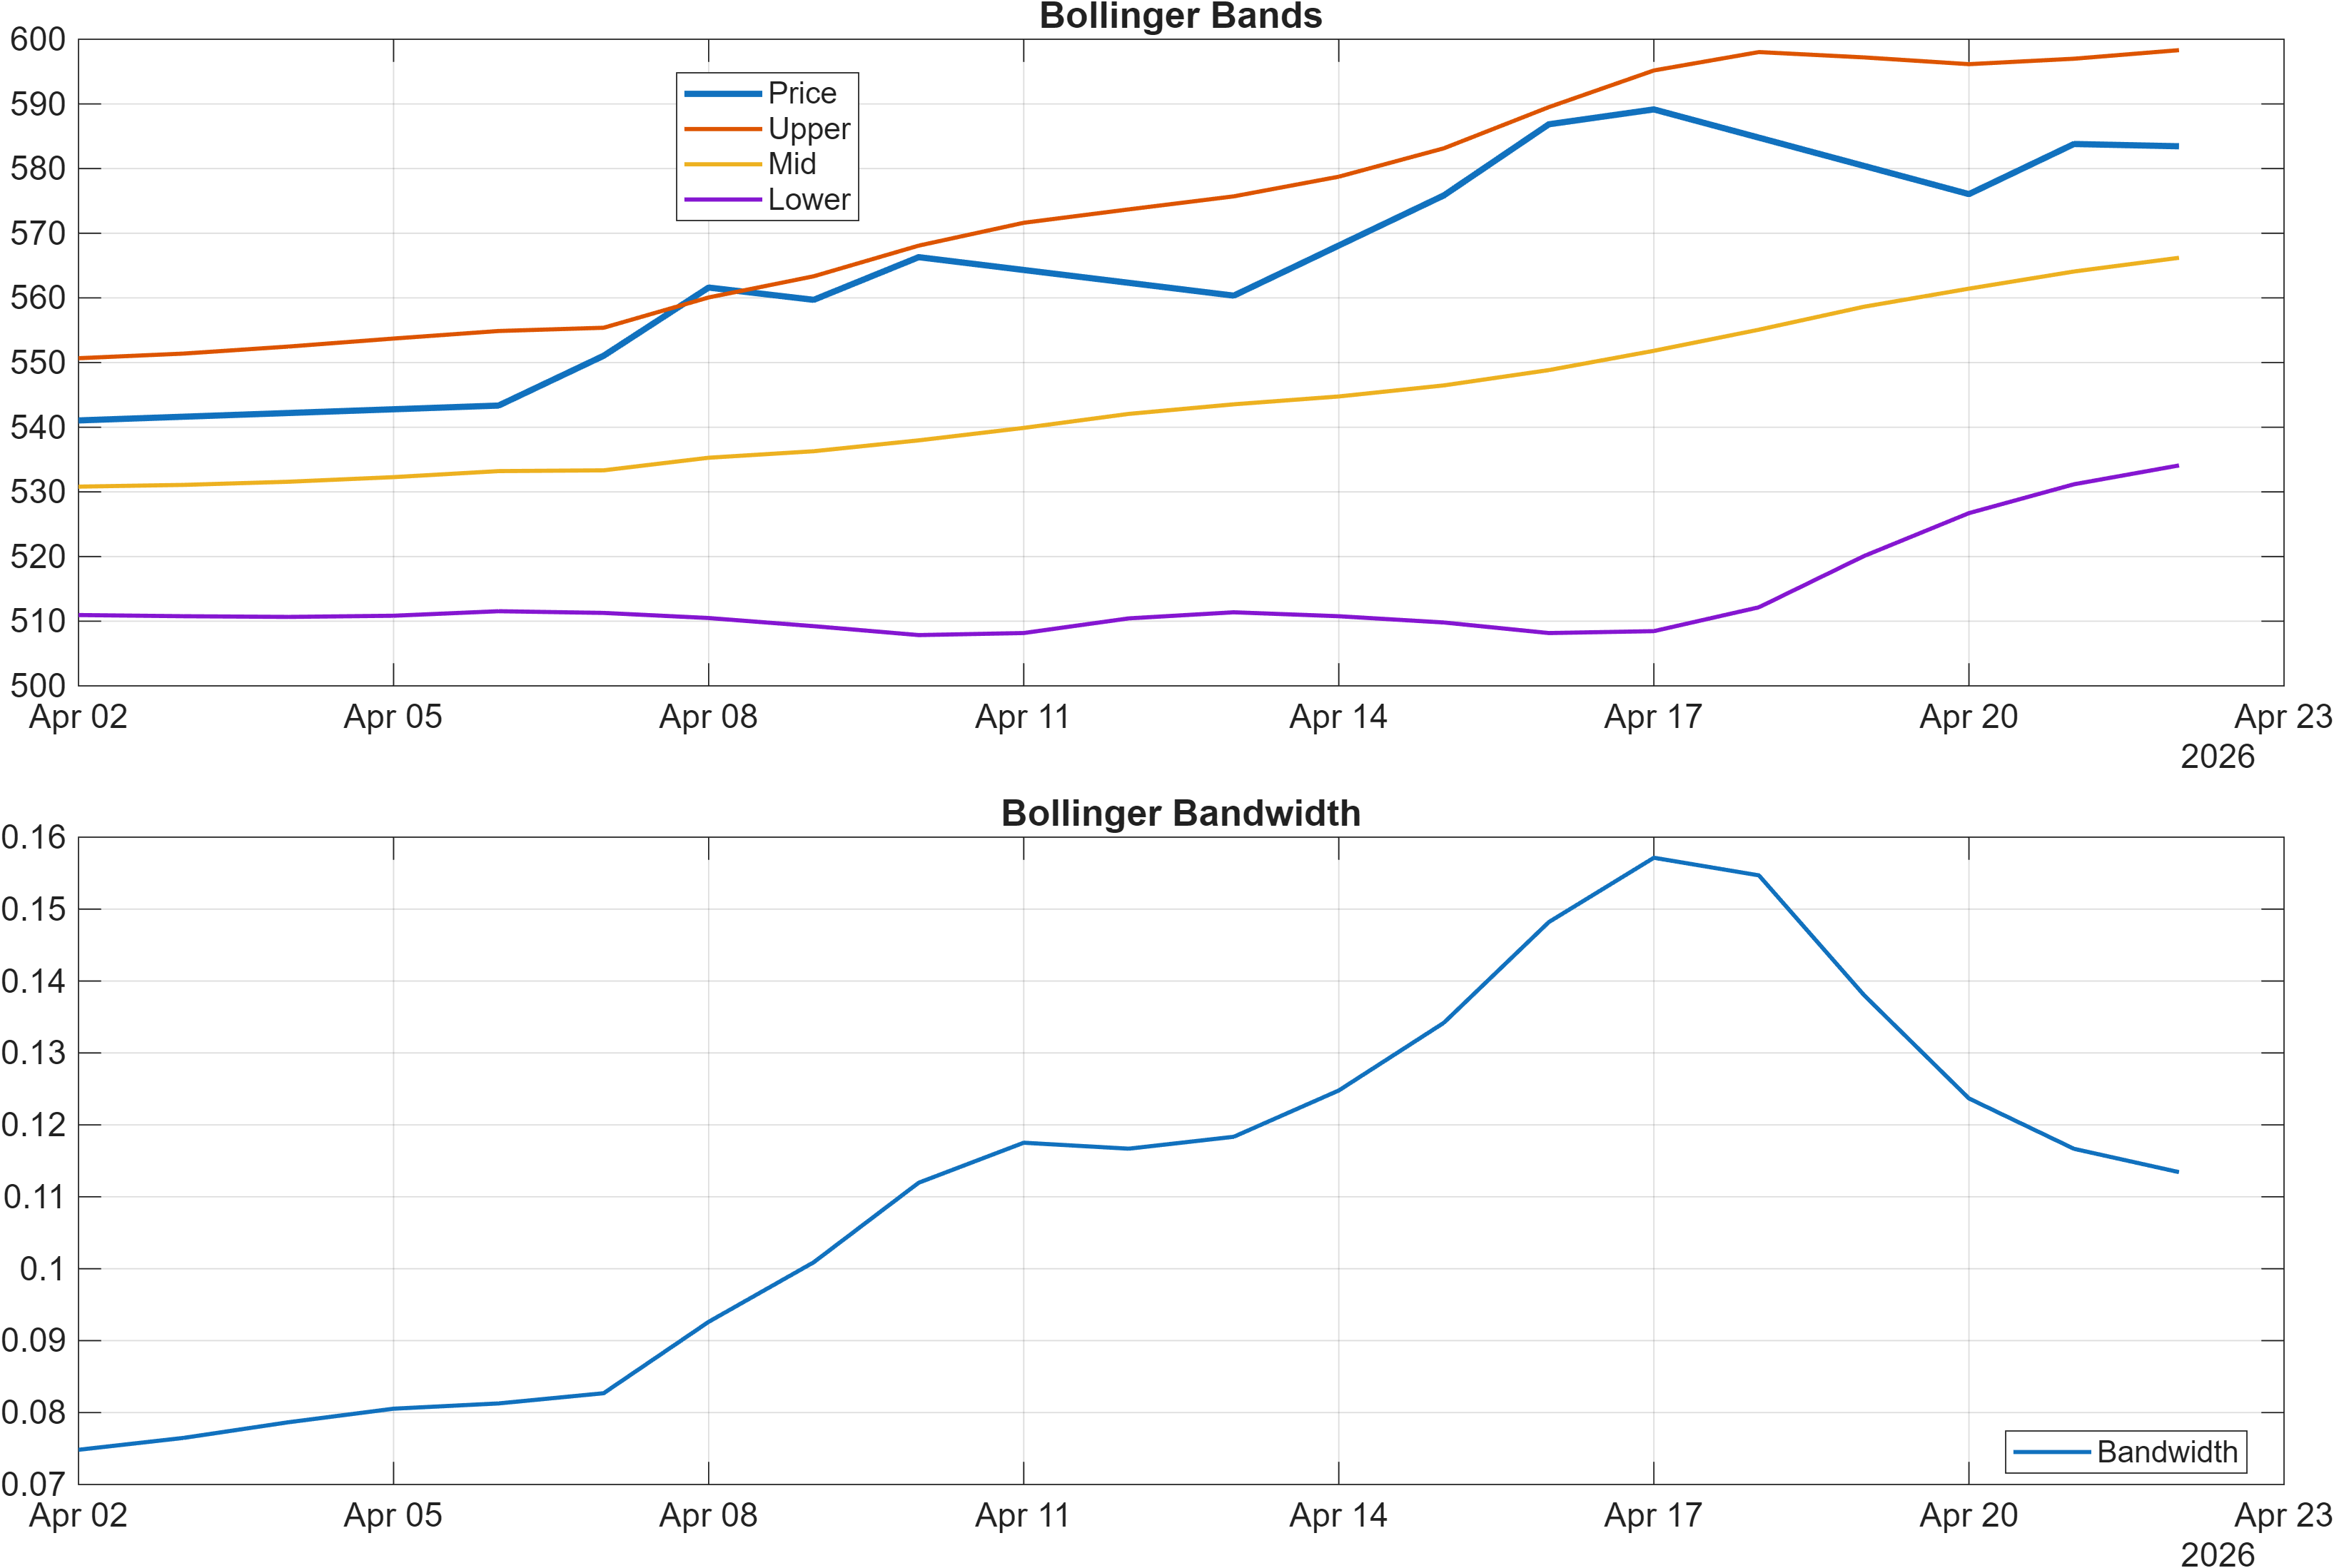
Interpretation: Bandwidth (volatility regime) latest = 0.1134.
Momentum readings lean constructive. RSI(14) prints 66.95 (bullish), and the MACD histogram is positive at 1.8444, which typically signals that upside momentum is present rather than fading. The additional time-series measures reinforce that view: TS Mom(20) at 42.17 and TS Accel at 32.97 both register bullish in the signal stack, suggesting the move has had directional persistence rather than a single-day impulse.
Volatility is less emphatic. Bollinger Bandwidth at 0.1134 is flagged neutral, which is consistent with a market that is moving but not yet in a broad volatility expansion regime. In practice, this often means breakouts can be more sensitive to level-based rejection—price can push, but without volatility expansion it may not sustain a trend leg unless participation improves.
The internal contradiction sits in the volume/flow layer: while accumulation-style measures are broadly bullish in the table (e.g., ADOSC 74.07), the bearish Vol ROC(20) at -14.9 warns that recent volume change is not confirming. When momentum is improving but volume change is negative, the risk is a thin rally that struggles near resistance (596.7750) or slips back toward the decision zone around 518.4000.
Overall, the dashboard reads as momentum-first, volatility-second: constructive signals are present, but they look more like an attempt to build a base than a fully validated trend transition.
4) Support / Resistance zones
Support ~ 518.4000 | Resistance ~ 596.7750
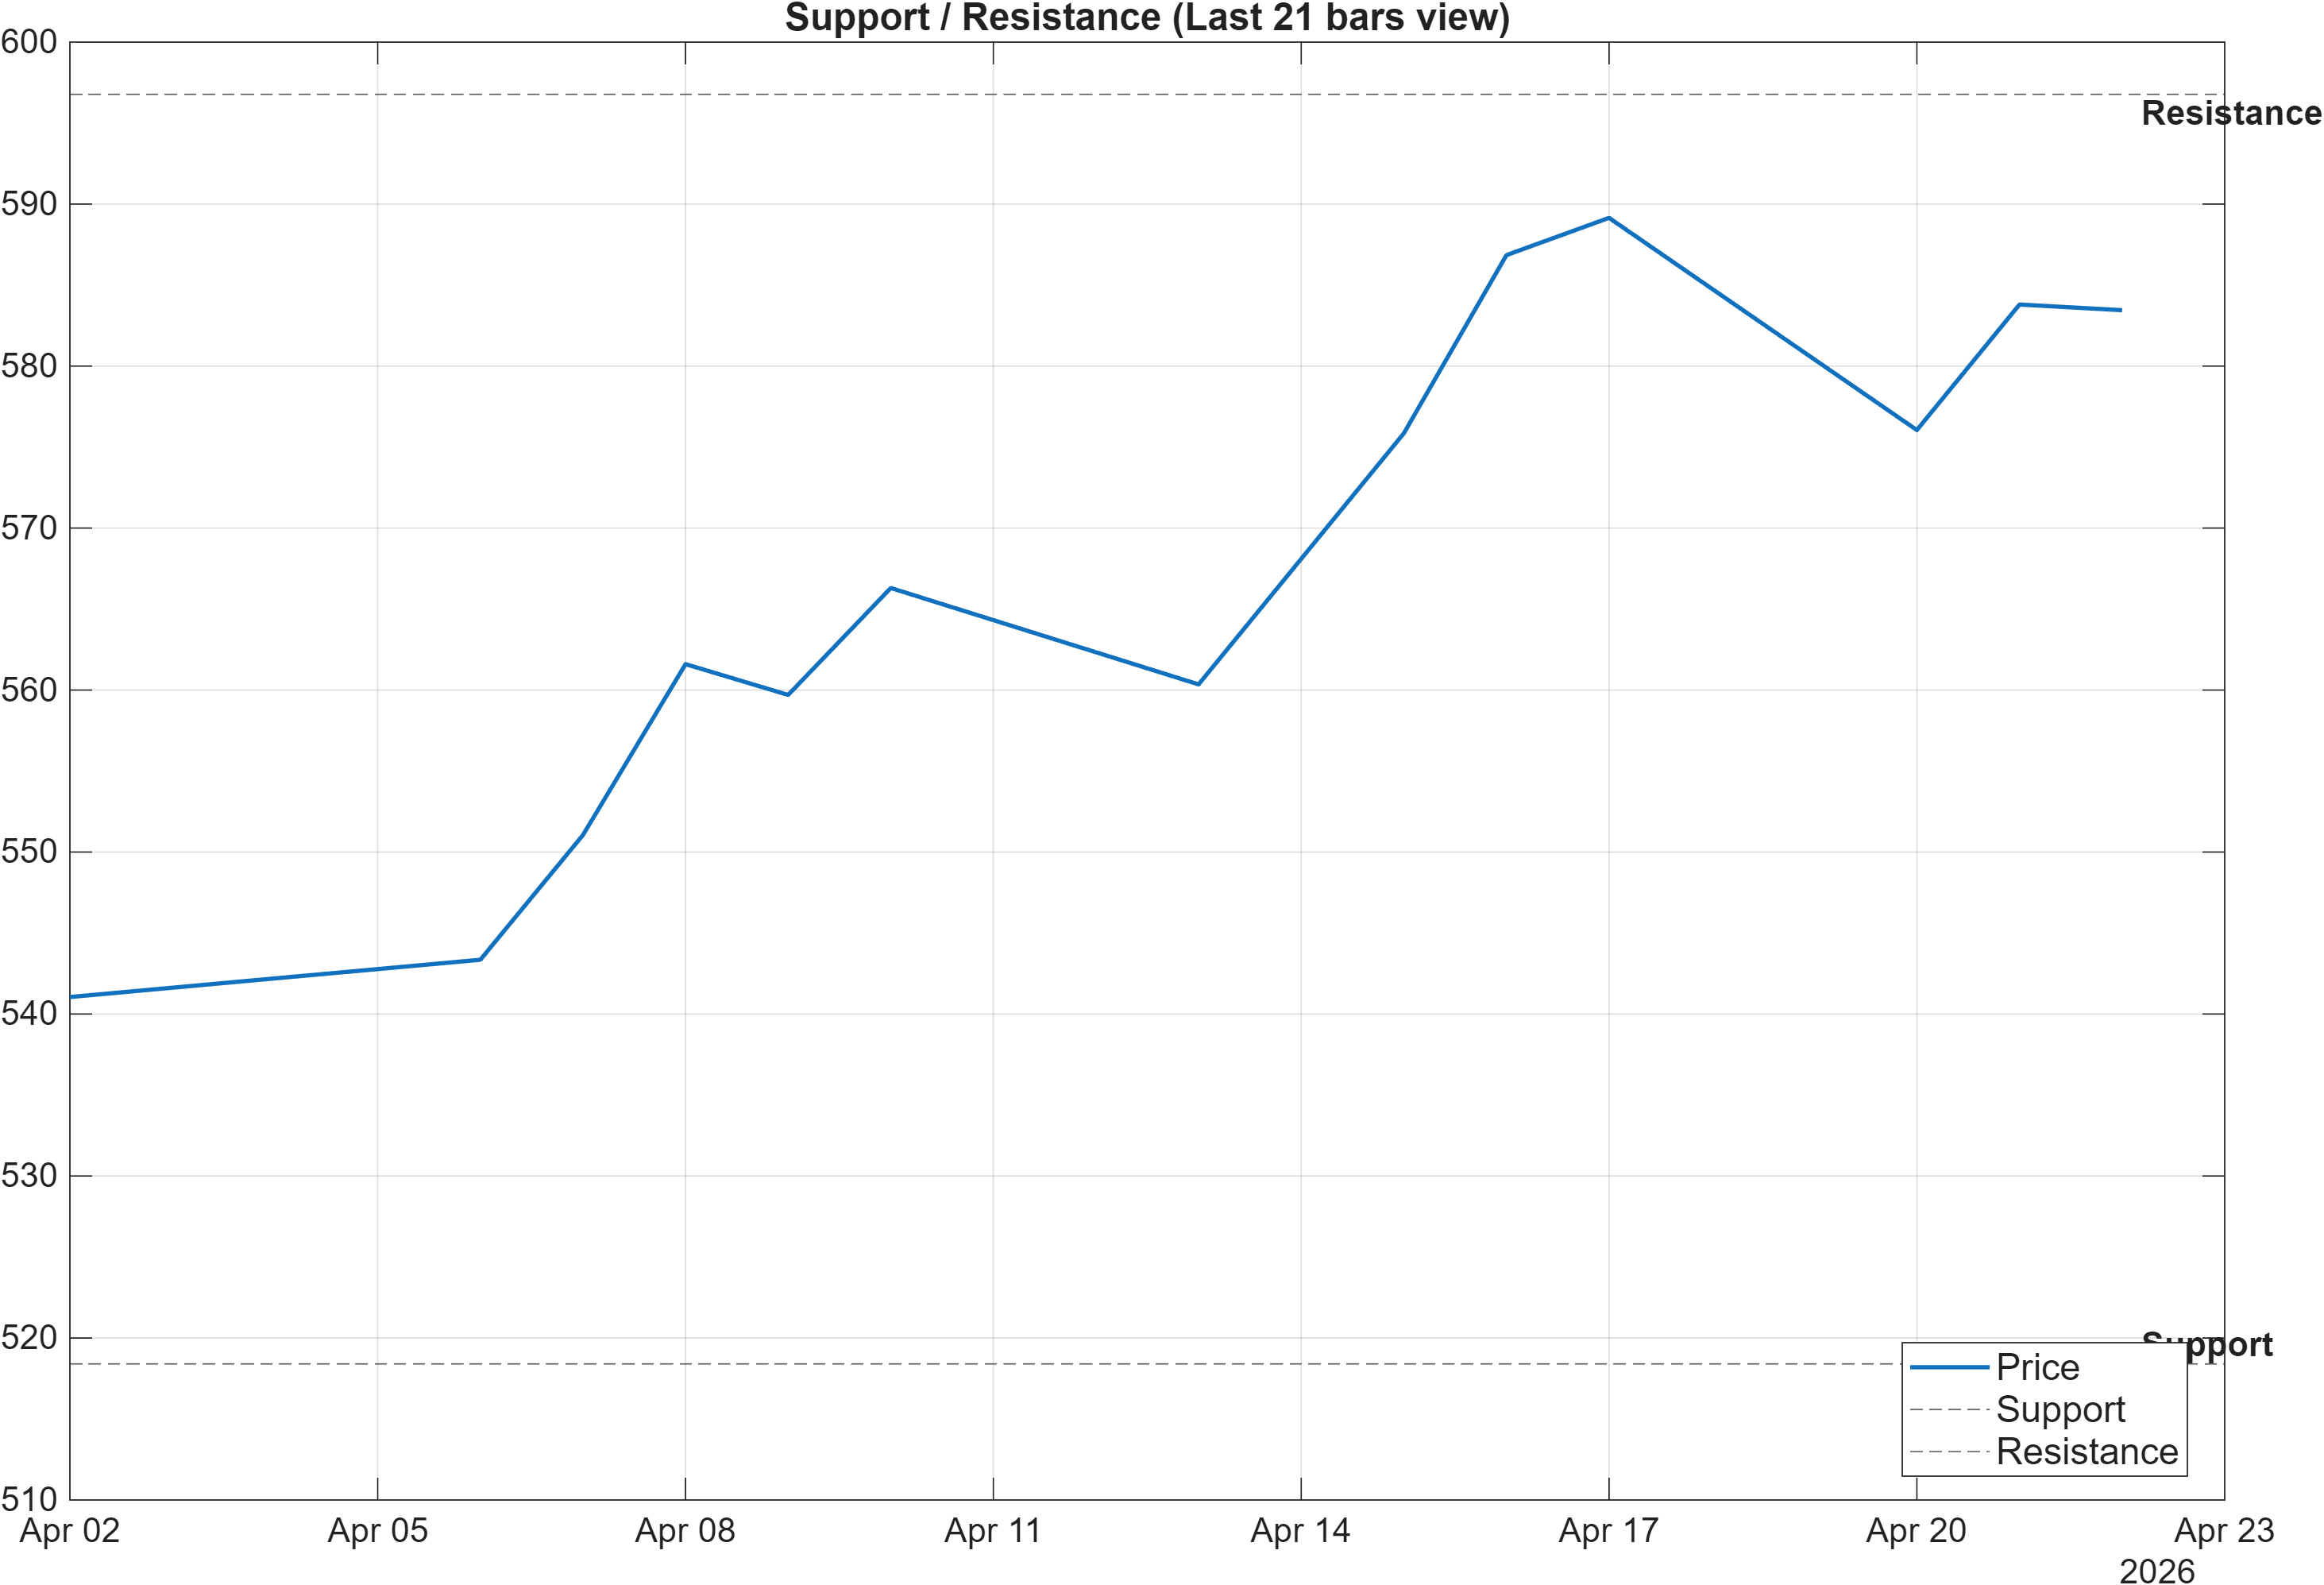
Scenario view: Break above resistance with volume → continuation. Close below support → signal deterioration risk.
The technical map is cleanly defined: 518.4000 is the principal support and 596.7750 is the principal resistance. With ranks deep in the lower tail (daily #1132, monthly #1142), these zones should be treated as decision points rather than passive reference levels—price acceptance or rejection here is likely to dominate the next rank/technical refresh.
Several dashboard elements cluster around these boundaries without needing exact price prints. The 20-day high signal (HHIGH(20) 597.9, neutral) sits close to the stated resistance, reinforcing that the market is already testing a nearby supply region. On the downside, the 20-day low (LLOW(20) 521.7, neutral) is close to support, implying the base is not far beneath current action and that a breakdown would be quickly observable rather than gradual.
The level logic also helps reconcile bullish momentum with bearish ranks. If momentum (RSI(14) 66.95; MACD histogram 1.8444) is truly transitioning into a stronger regime, the market typically needs to prove it at resistance and then maintain the move without a rapid volatility collapse. Conversely, if the recent bounce is only a counter-trend move, closes that gravitate back toward—and especially below—518.4000 would align with the rank warning and increase the probability of renewed weakness.
In short: treat 596.7750 as the validation gate for any trend improvement narrative, and 518.4000 as the key invalidation line for the bullish confluence.
5) Quant Technical Dashboard (18 Signals)
KGNAI AI Technical Analysis Score (Deep Reinforcement Learning): Rank #623 out of 1222 (Rank 1 represents the strongest technical positioning and a higher probability of favorable price behavior. As ranks increase toward the maximum, the probability of favorable outcomes weakens and bearish positioning becomes more dominant.) | Label: Neutral | Score: -0.020
18-Signal Technical Confluence Score: 0.444 (Bullish)
Overall Technical Score (18-signal confluence + DRL rank blend): 0.305 (Bullish)
Note: The blended score reflects signal strength weighted against broader AI technical ranking, which may temporarily diverge.
Blended technical score breakdown: 0.305 (Bullish | Bull 11 / Bear 3 / Neutral 4)
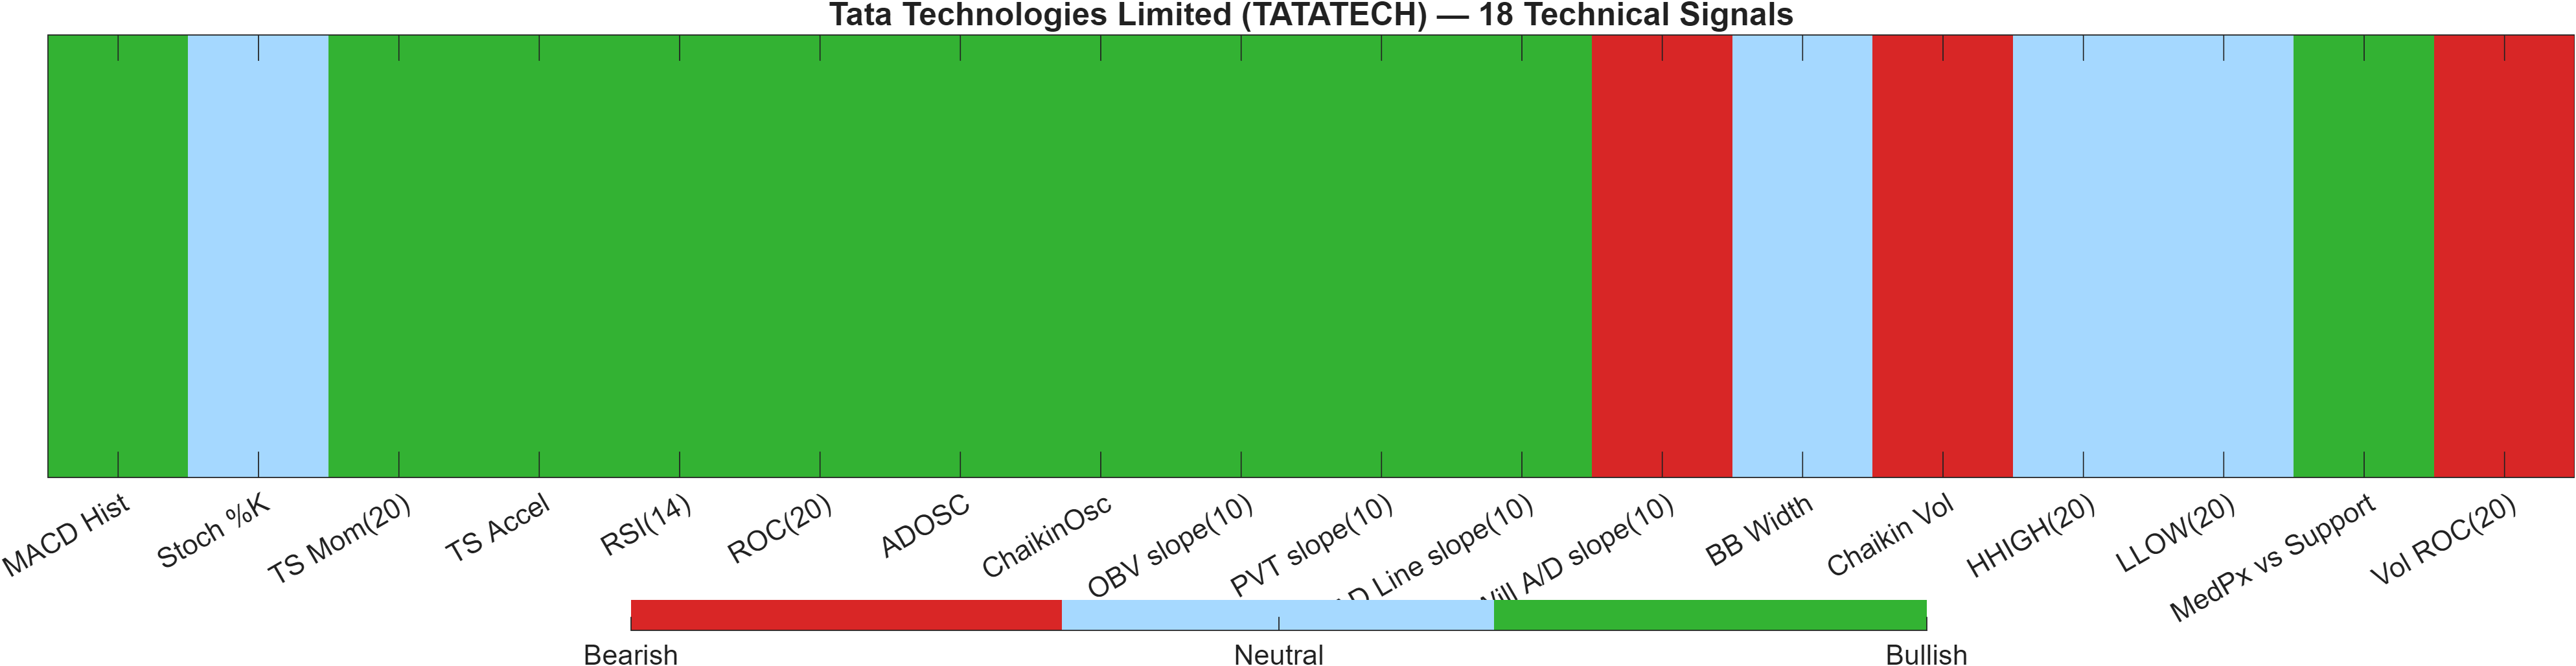
Signal table (Bull/Bear/Neutral)
| Indicator | Value | Signal |
|---|---|---|
| MACD Hist | 1.844 | Bullish |
| Stoch %K | 69.51 | Neutral |
| TS Mom(20) | 42.17 | Bullish |
| TS Accel | 32.97 | Bullish |
| RSI(14) | 66.95 | Bullish |
| ROC(20) | 7.722 | Bullish |
| ADOSC | 74.07 | Bullish |
| ChaikinOsc | 9172 | Bullish |
| OBV slope(10) | 1.094e+05 | Bullish |
| PVT slope(10) | 3058 | Bullish |
| AD Line slope(10) | 7.406e+04 | Bullish |
| Will A/D slope(10) | -8.425 | Bearish |
| BB Width | 0.1134 | Neutral |
| Chaikin Vol | 14.84 | Bearish |
| HHIGH(20) | 597.9 | Neutral |
| LLOW(20) | 521.7 | Neutral |
| MedPx vs Support | 60.9 | Bullish |
| Vol ROC(20) | -14.9 | Bearish |
Interpretation: Indicator-level signals form the base confluence, which is then adjusted using a separate AI-driven technical ranking model. The final technical score summarizes this combined view.
The quant dashboard shows a notable alignment within classic momentum/flow indicators alongside a more guarded AI technical rank. On the one hand, the confluence score of 0.444 and the bull/bear count (Bull 11 vs Bear 3) point to broad agreement across signals such as RSI(14) 66.95, ROC(20) 7.722, and MACD histogram 1.844. Several participation measures also skew constructive (e.g., OBV slope(10) 1.094e+05), suggesting the recent price behavior has not been purely mechanical.
On the other hand, the Deep Reinforcement Learning technical rank is only mid-pack at #623 of 1222 with a Neutral label and score -0.020. This is a common configuration when indicators improve faster than the broader pattern library used by the AI ranker. In effect, the model is acknowledging short-term signal improvement while not yet classifying the structure as robust relative to the universe.
The bear signals are also informative because they cluster in “quality of move” rather than “direction of move.” Chaikin Vol at 14.84 and Vol ROC(20) at -14.9 lean bearish, implying that volatility/volume dynamics may not be reinforcing the rally attempt. This makes the resistance test near 596.7750 more consequential: without better participation, the instrument can remain stuck in a rank-weak regime even if momentum stays positive.
6) News sentiment + extractive gist
Note: Instrument-specific news matches were not found, so the digest includes broader market/sector headlines. Links are provided for verification.
Sentiment score (avg): 0.153 | Positive: 44% | Neutral: 56% | Negative: 0%
KGNAI AI News Sentiment Score (normalized -1 to +1): 0.98 (as of 2025-10-23) | Label: Bullish | Overall news score: 0.98
Positive Developments
Recent coverage across major financial outlets indicates a net-positive tone, driven primarily by corporate results narratives, balance-sheet actions, and episodic risk-on behavior in individual equities. In the provided digest, “positive/constructive” items are dominated by earnings and profit-growth framing and by post-IPO debt reduction language, which tends to support broader risk appetite even when it is not specific to TATATECH. This aligns directionally with the report’s indicator layer (RSI bias bullish; MACD histogram 1.8444)—a setting where supportive headlines can reduce near-term selling pressure and help price stabilize above key levels. The sentiment mix also shows 0% negative items and a normalized score of 0.98, which, taken at face value, implies that the news environment is not currently the dominant headwind in this workflow. The caveat remains that the dataset is sector/market-level rather than instrument-specific.
Neutral / Mixed Developments
The neutral portion of the digest centers on macro and market-structure themes that can shift intraday risk pricing without changing the underlying technical map. Items related to broader equity weakness tied to geopolitical concern, alongside market plumbing/regulatory settlement discussion, are typical “context setters” rather than directional catalysts. For a technically mixed instrument—bullish confluence (0.444) but bearish cross-sectional ranks (daily #1132 out of 1222)—this type of background often determines follow-through quality more than the initial move. In that regime, price may still oscillate within the stated boundaries (518.4000 to 596.7750) while participants wait for clearer market-wide risk conditions.
Negative / Risk Signals
The risk framing in the digest is less about company-specific deterioration and more about the potential for external shock to overwhelm fragile technical rebounds. Broader-market drawdowns tied to geopolitical headlines can compress liquidity and increase gap risk—conditions that matter when the report already flags vulnerabilities in participation (Vol ROC(20) -14.9, bearish) and a longer-term moving-average regime that remains bearish (MA50 vs MA200). In such environments, support levels can be tested more quickly than expected, and a close below 518.4000 would mechanically shift the technical interpretation toward deterioration risk as stated in the scenario view. Treat the bullish news score (0.98) as contextual, not protective, given the non-instrument-specific match.
- Whether price holds above 518.4000 on any renewed volatility, versus a deterioration close below support.
- Whether upside attempts can re-test and sustain above 596.7750 with improved participation (watch the bearish volume-change signal).
- Whether rank pressure (daily #1132, monthly #1142) begins to ease as technical strength persists.
Sources referenced: Reuters, Bloomberg, Yahoo Finance, MarketWatch, Investing.com
7) Sources
- Sebi-appointed panel recommends NSE pay $193 million to settle cases, sources say — https://economictimes.indiatimes.com/markets/stocks/news/sebi-appointed-panel-recommends-nse-pay-193-million-to-settle-cases-sources-say/articleshow/130427262.cms
- US stocks today: US markets plunge as Middle East concerns offset earnings optimism — https://economictimes.indiatimes.com/markets/us-stocks/news/u-s-markets-falls-as-middle-east-concerns-offset-earnings-optimism/articleshow/130427205.cms
- Trump's Fed nominee Kevin Warsh calls for 'regime change' at Fed, new inflation approach — https://economictimes.indiatimes.com/markets/us-stocks/news/trumps-fed-nominee-kevin-warsh-calls-for-regime-change-at-fed-new-inflation-approach/articleshow/130423749.cms
- Avis Budget shares touch record high as short squeeze hammers bearish bets — https://economictimes.indiatimes.com/markets/us-stocks/news/avis-budget-shares-touch-record-high-as-short-squeeze-hammers-bearish-bets/articleshow/130422611.cms
- April-listed Powerica posts 226% YoY Q3 PAT growth; repays Rs 525 crore debt post IPO — https://economictimes.indiatimes.com/markets/stocks/news/april-listed-powerica-posts-226-yoy-q3-pat-growth-repays-rs-525-crore-debt-post-ipo/articleshow/130422225.cms
- Market Trading Guide: Buy Nestle, NLC India and 2 more stocks on Wednesday for near term gains up to 14% — https://economictimes.indiatimes.com/markets/stocks/news/market-trading-guide-buy-nestle-nlc-india-and-2-more-stocks-on-wednesday-for-near-term-gains-up-to-14/slideshow/130422005.cms
- Ahead of Market: 10 things that will decide stock market action on Wednesday — https://economictimes.indiatimes.com/markets/stocks/news/ahead-of-market-10-things-that-will-decide-stock-market-action-on-wednesday/articleshow/130421908.cms
- Tata Investment Q4 Results: Profit jumps 69% YoY to Rs 64 crore; co declares Rs 3.4 dividend — https://economictimes.indiatimes.com/markets/stocks/earnings/tata-investment-q4-results-profit-jumps-69-yoy-to-rs-64-crore-co-declares-rs-3-4-dividend/articleshow/130421829.cms
You may also like: How KGNAI AI ranks instruments across global markets
Disclaimer: KGNAI provides AI-generated analytics and educational market commentary only. This is not financial advice. Markets involve risk. Always do your own research.