
LICI (Life Insurance Corporation of India) — 08 May 2026 Technical Note: Indecisive Price Action with Bearish Short-Horizon Ranks
Life Insurance Corporation of India (LICI) is currently presenting a mixed, uncertainty-heavy setup: KGNAI’s cross-sectional ranks are bearish on daily and weekly horizons, while the monthly view is neutral. Technically, the picture is also split—price vs the 50-day moving average is flagged bearish, yet the 50-day vs 200-day moving average relationship remains bullish, a common configuration during regime transitions or extended ranges. Momentum is not confirming upside follow-through: RSI is assessed as neutral and MACD histogram is negative (-1.4646), keeping the burden of proof on buyers. Volatility is modest but present, with Bollinger bandwidth at 0.0503, suggesting room for expansion if a directional break develops. Key decision zones are clearly defined by support near 728.8250 and resistance near 837.5750, which should frame risk management until a cleaner signal emerges.
Key Takeaways
- Rank stance: Short-term Bearish (daily/weekly); Mid-term Neutral (monthly); Long-term: Not available in the provided data.
- Technical confluence: Neutral (18-signal confluence 0.167; overall technical score 0.217)
- Key levels: Support 728.8250 | Resistance 837.5750
- News sentiment bias: Bullish normalized score 0.95 (while the average sentiment score is 0.118, with 50% positive / 31% neutral / 19% negative)
- Confirmation / invalidation: A sustained push above 837.5750 with volume improves continuation odds; a close below 728.8250 increases deterioration risk.
What KGNAI Measures
KGNAI evaluates assets using large cross-sectional datasets built from millions of structured data points. Inputs incorporate fundamental metrics, technical structures, and systematically processed news sentiment. Statistical models, machine learning, and AI frameworks are used to assess relative positioning, signal alignment, and probabilistic behavior across broad universes.
How to Read This Report
- Ranks are comparative across the tracked universe, not absolute price targets.
- Confluence reflects alignment among independent signal groups.
- Support/resistance levels are probabilistic decision zones, not guarantees.
- Sentiment provides contextual bias within the broader analytical framework.
1) KGNAI AI Analysis
Region: INDIA
Total universe size: 1222 ranked instruments
- Daily rank: #1039 out of 1222 — Bearish
- Weekly rank: #1074 out of 1222 — Bearish
- Monthly rank: #829 out of 1222 — Neutral
- 3-Monthly rank: Not available for this horizon — Not available
- 6-Monthly rank: Not available for this horizon — Not available
- Yearly rank: Not available for this horizon — Not available
The KGNAI rank profile places LICI in the lower portion of the universe on shorter horizons: a daily rank of #1039 and weekly rank of #1074 out of 1222 both map to bearish positioning. The monthly rank improves to #829, shifting the classification to neutral, which is consistent with a market that may be stabilizing without establishing a persistent trend.
This short-term weakness vs mid-term neutrality typically indicates that recent price behavior has not been strong enough to move the instrument into more favorable cross-sectional buckets, even if longer lookbacks are less negative. In such cases, traders often see choppy tape: rebounds can occur, but the probability of sustained follow-through is lower until multiple horizons begin to compress toward stronger ranks.
Longer-horizon ranks (3-month, 6-month, yearly) are Not available in the provided data. That limitation matters because it reduces visibility on whether the current short-term bearish ranks are part of a larger downtrend or simply a temporary drawdown inside a broader range.
Term view in the dataset summarizes this directly: Short-term bearish, mid-term neutral, and long-term not available. With this configuration, the most robust use of the rank signal is as a risk filter: treat upside attempts as requiring clearer confirmation from price/volume and momentum before assuming trend persistence.
2) Price & trend overview
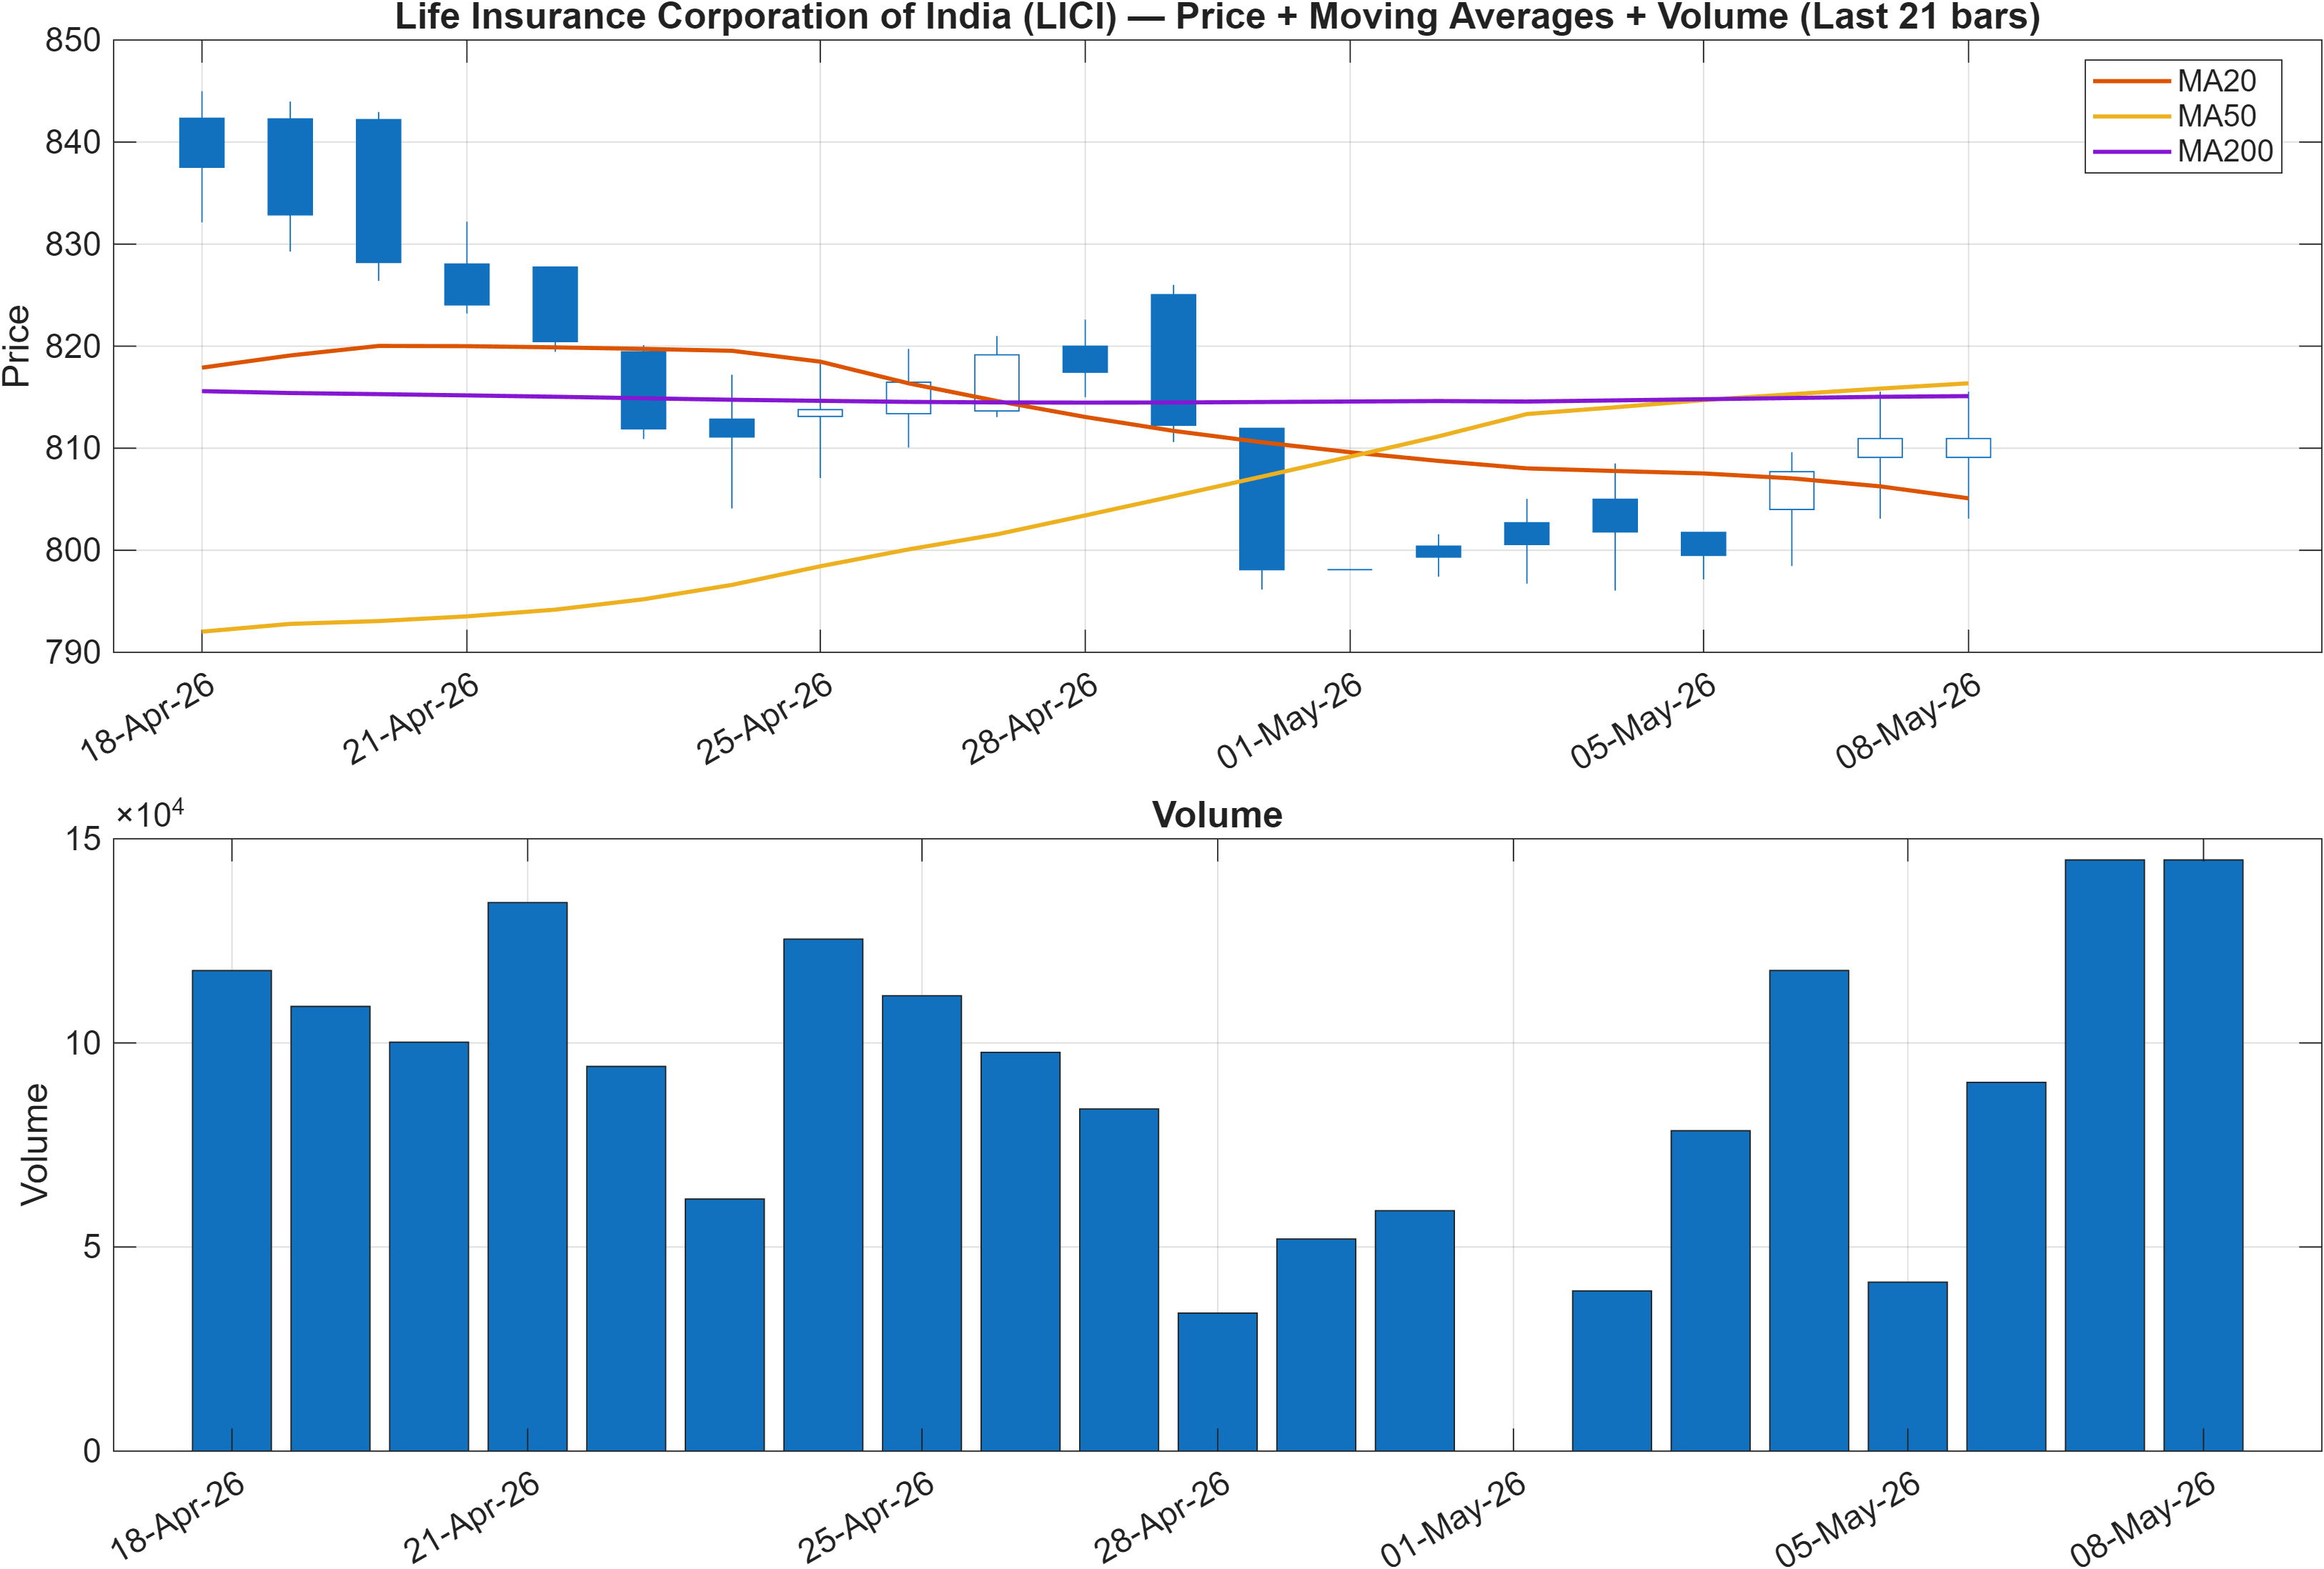
Trend structure is currently defined by a moving-average split: close vs MA50 is bearish, while MA50 vs MA200 is bullish. This combination often appears when an instrument is digesting prior strength (longer-term trend support remains intact), but near-term price has slipped below an intermediate reference point. The practical implication is that trend participants may still view the longer-term base as constructive, yet shorter-horizon participants will tend to sell rallies until price regains the MA50 decisively.
For regime classification, this is closer to a transition state than a clean trend. A bullish MA50/MA200 relationship can provide a “floor” effect over time, but it does not prevent drawdowns—particularly when short-term ranks (daily #1039, weekly #1074) sit deep in the weaker part of the universe. In other words, the market’s longer memory remains supportive, but the more recent tape is not rewarding risk-taking.
The price framework should be interpreted alongside the clearly defined horizontal decision zones in this report—728.8250 support and 837.5750 resistance—because mixed moving-average states tend to resolve via range expansion rather than a smooth glide back to trend. Until price behavior re-aligns with MA50, the default expectation from a market-structure perspective is mean reversion with intermittent momentum bursts rather than persistent directional continuation.
Volume confirmation becomes particularly important in these mixed states: directional breaks that occur without participation frequently fail back into the range. The next section’s momentum indicators help judge whether participation is translating into durable impulse.
3) Momentum & volatility dashboard
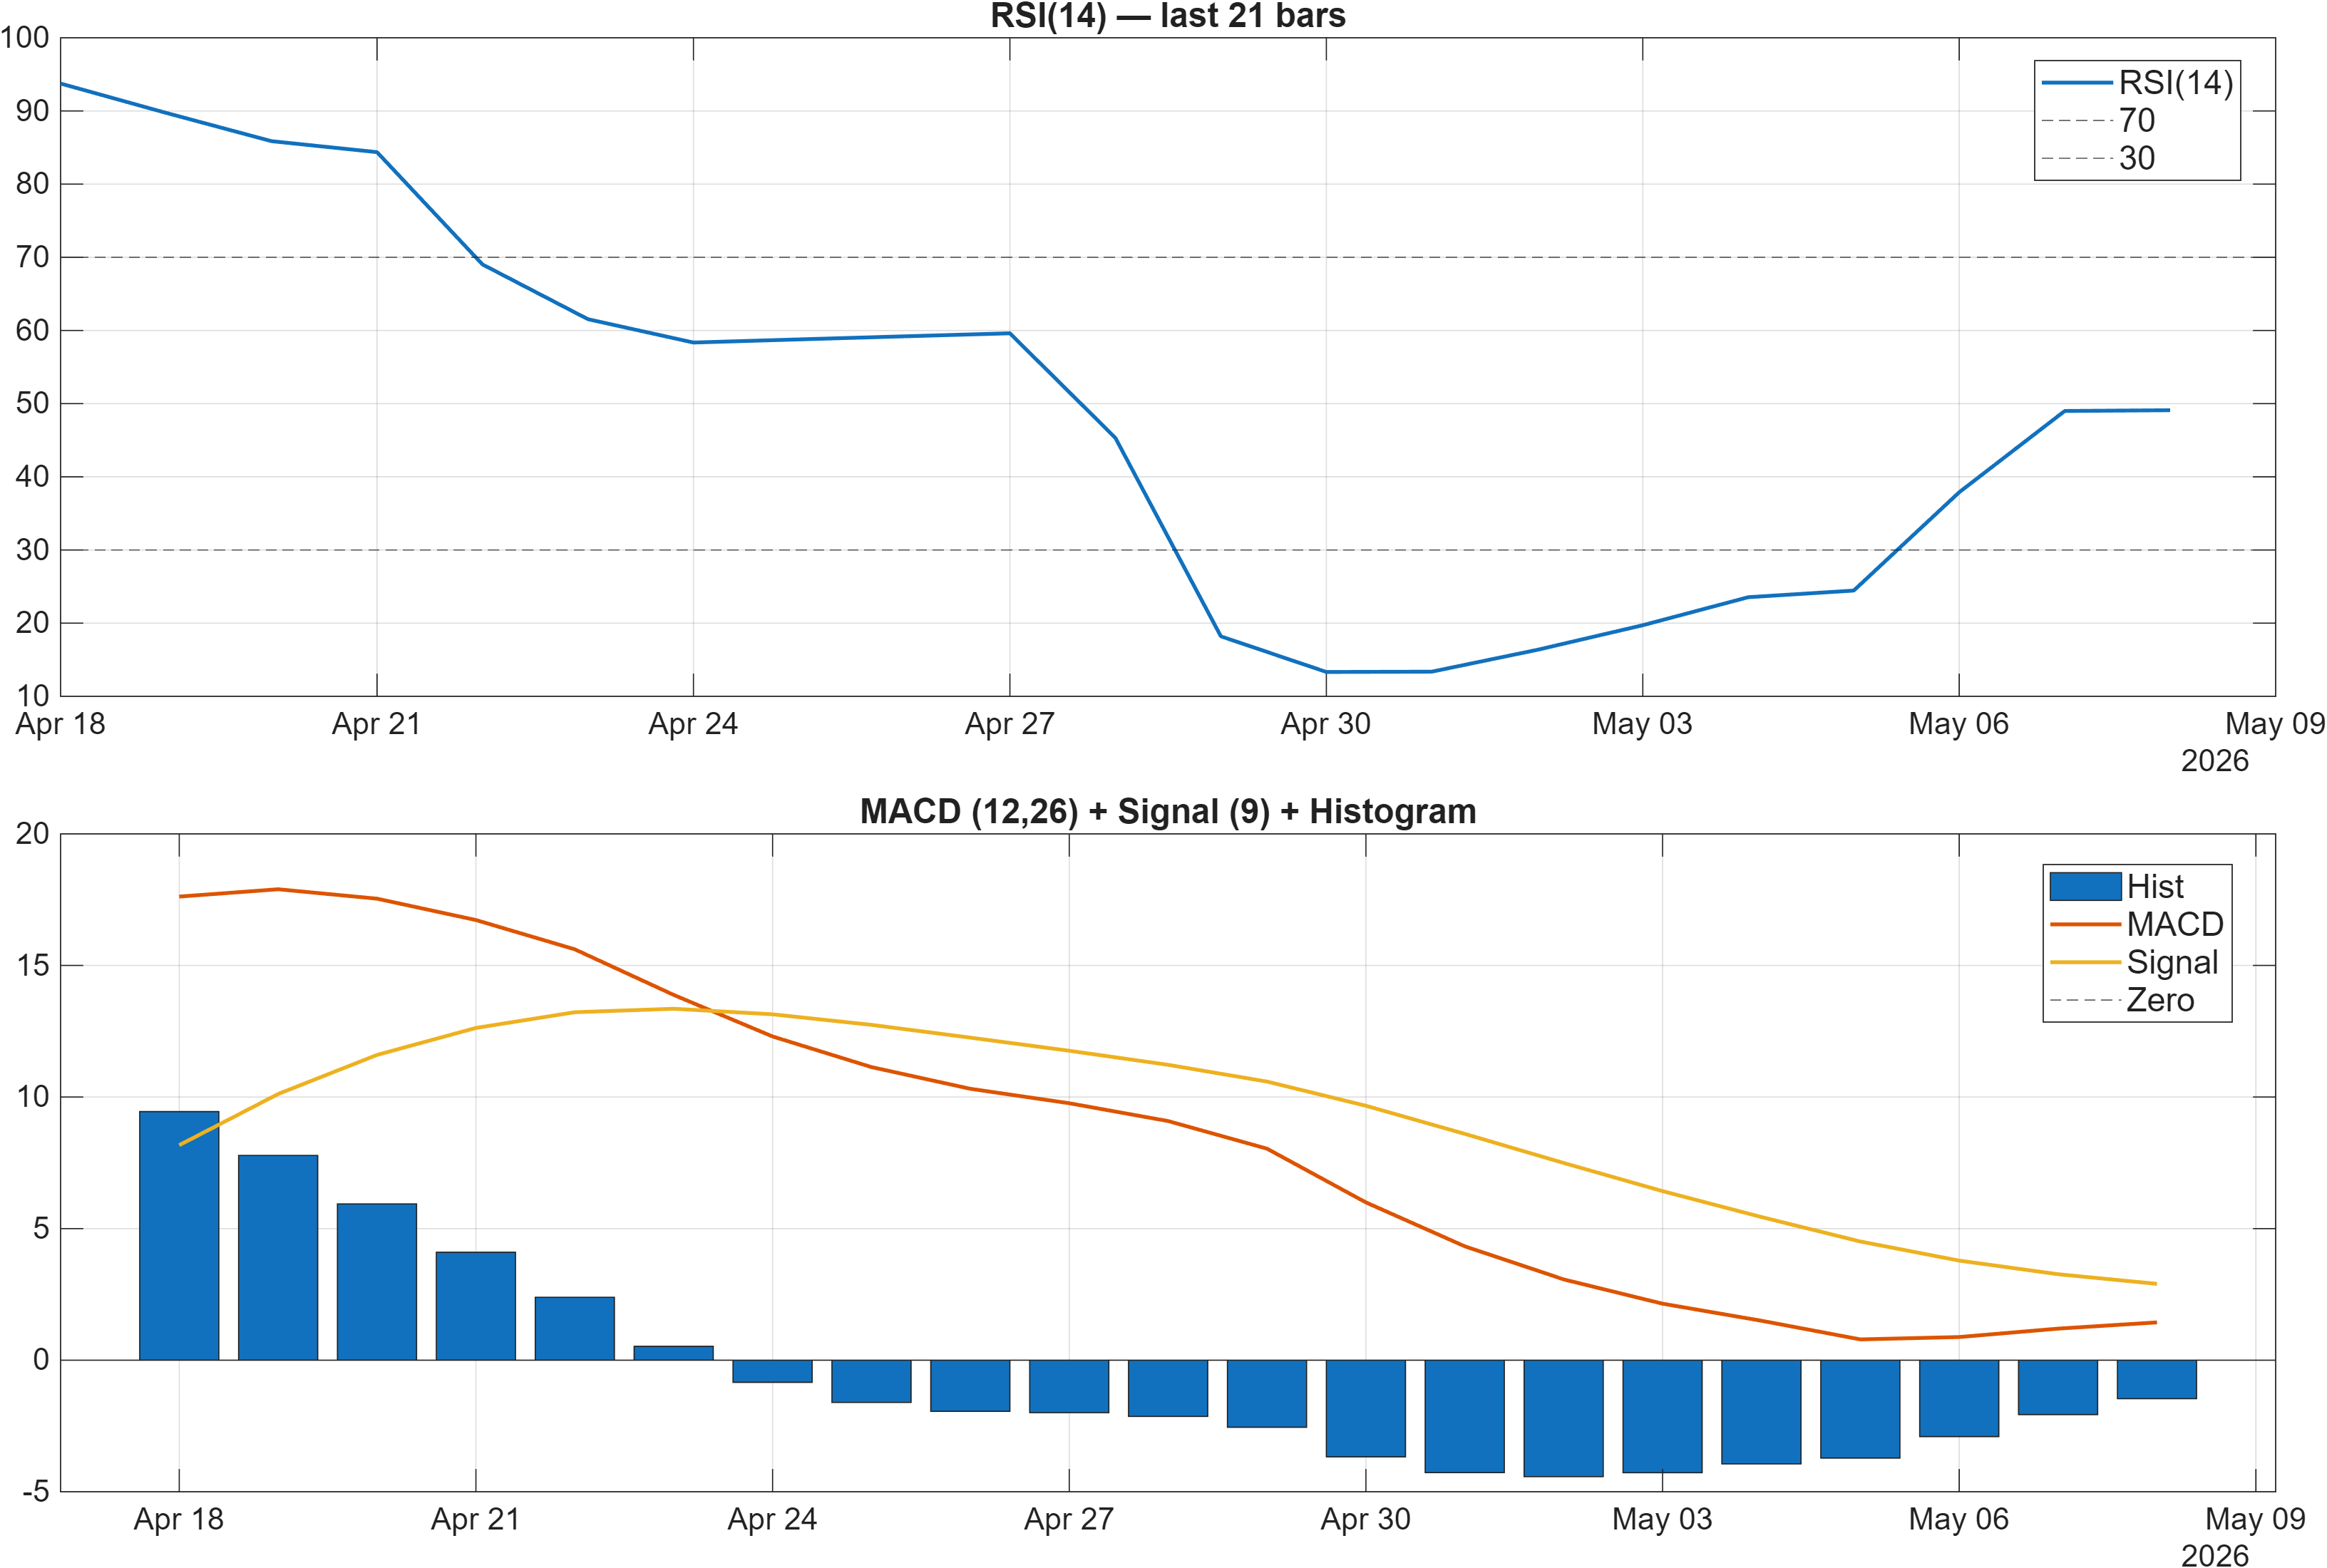
Momentum signals are not providing a unified directional push. The dashboard reads RSI bias as neutral, consistent with a market that is oscillating rather than trending. The signal table specifies RSI(14) at 49.1, a level that typically aligns with balance between buying and selling pressure rather than sustained accumulation or distribution.
MACD, however, leans negative: the MACD histogram is reported at -1.4646 (and -1.465 in the signal table), which keeps near-term impulse on the defensive side. In mixed-regime structures, a neutral RSI paired with a negative MACD histogram commonly shows up when rebounds are occurring, but they are not yet strong enough to reverse the intermediate momentum profile. That aligns with the bearish short-horizon ranks, reinforcing that upside attempts may face friction until momentum improves.
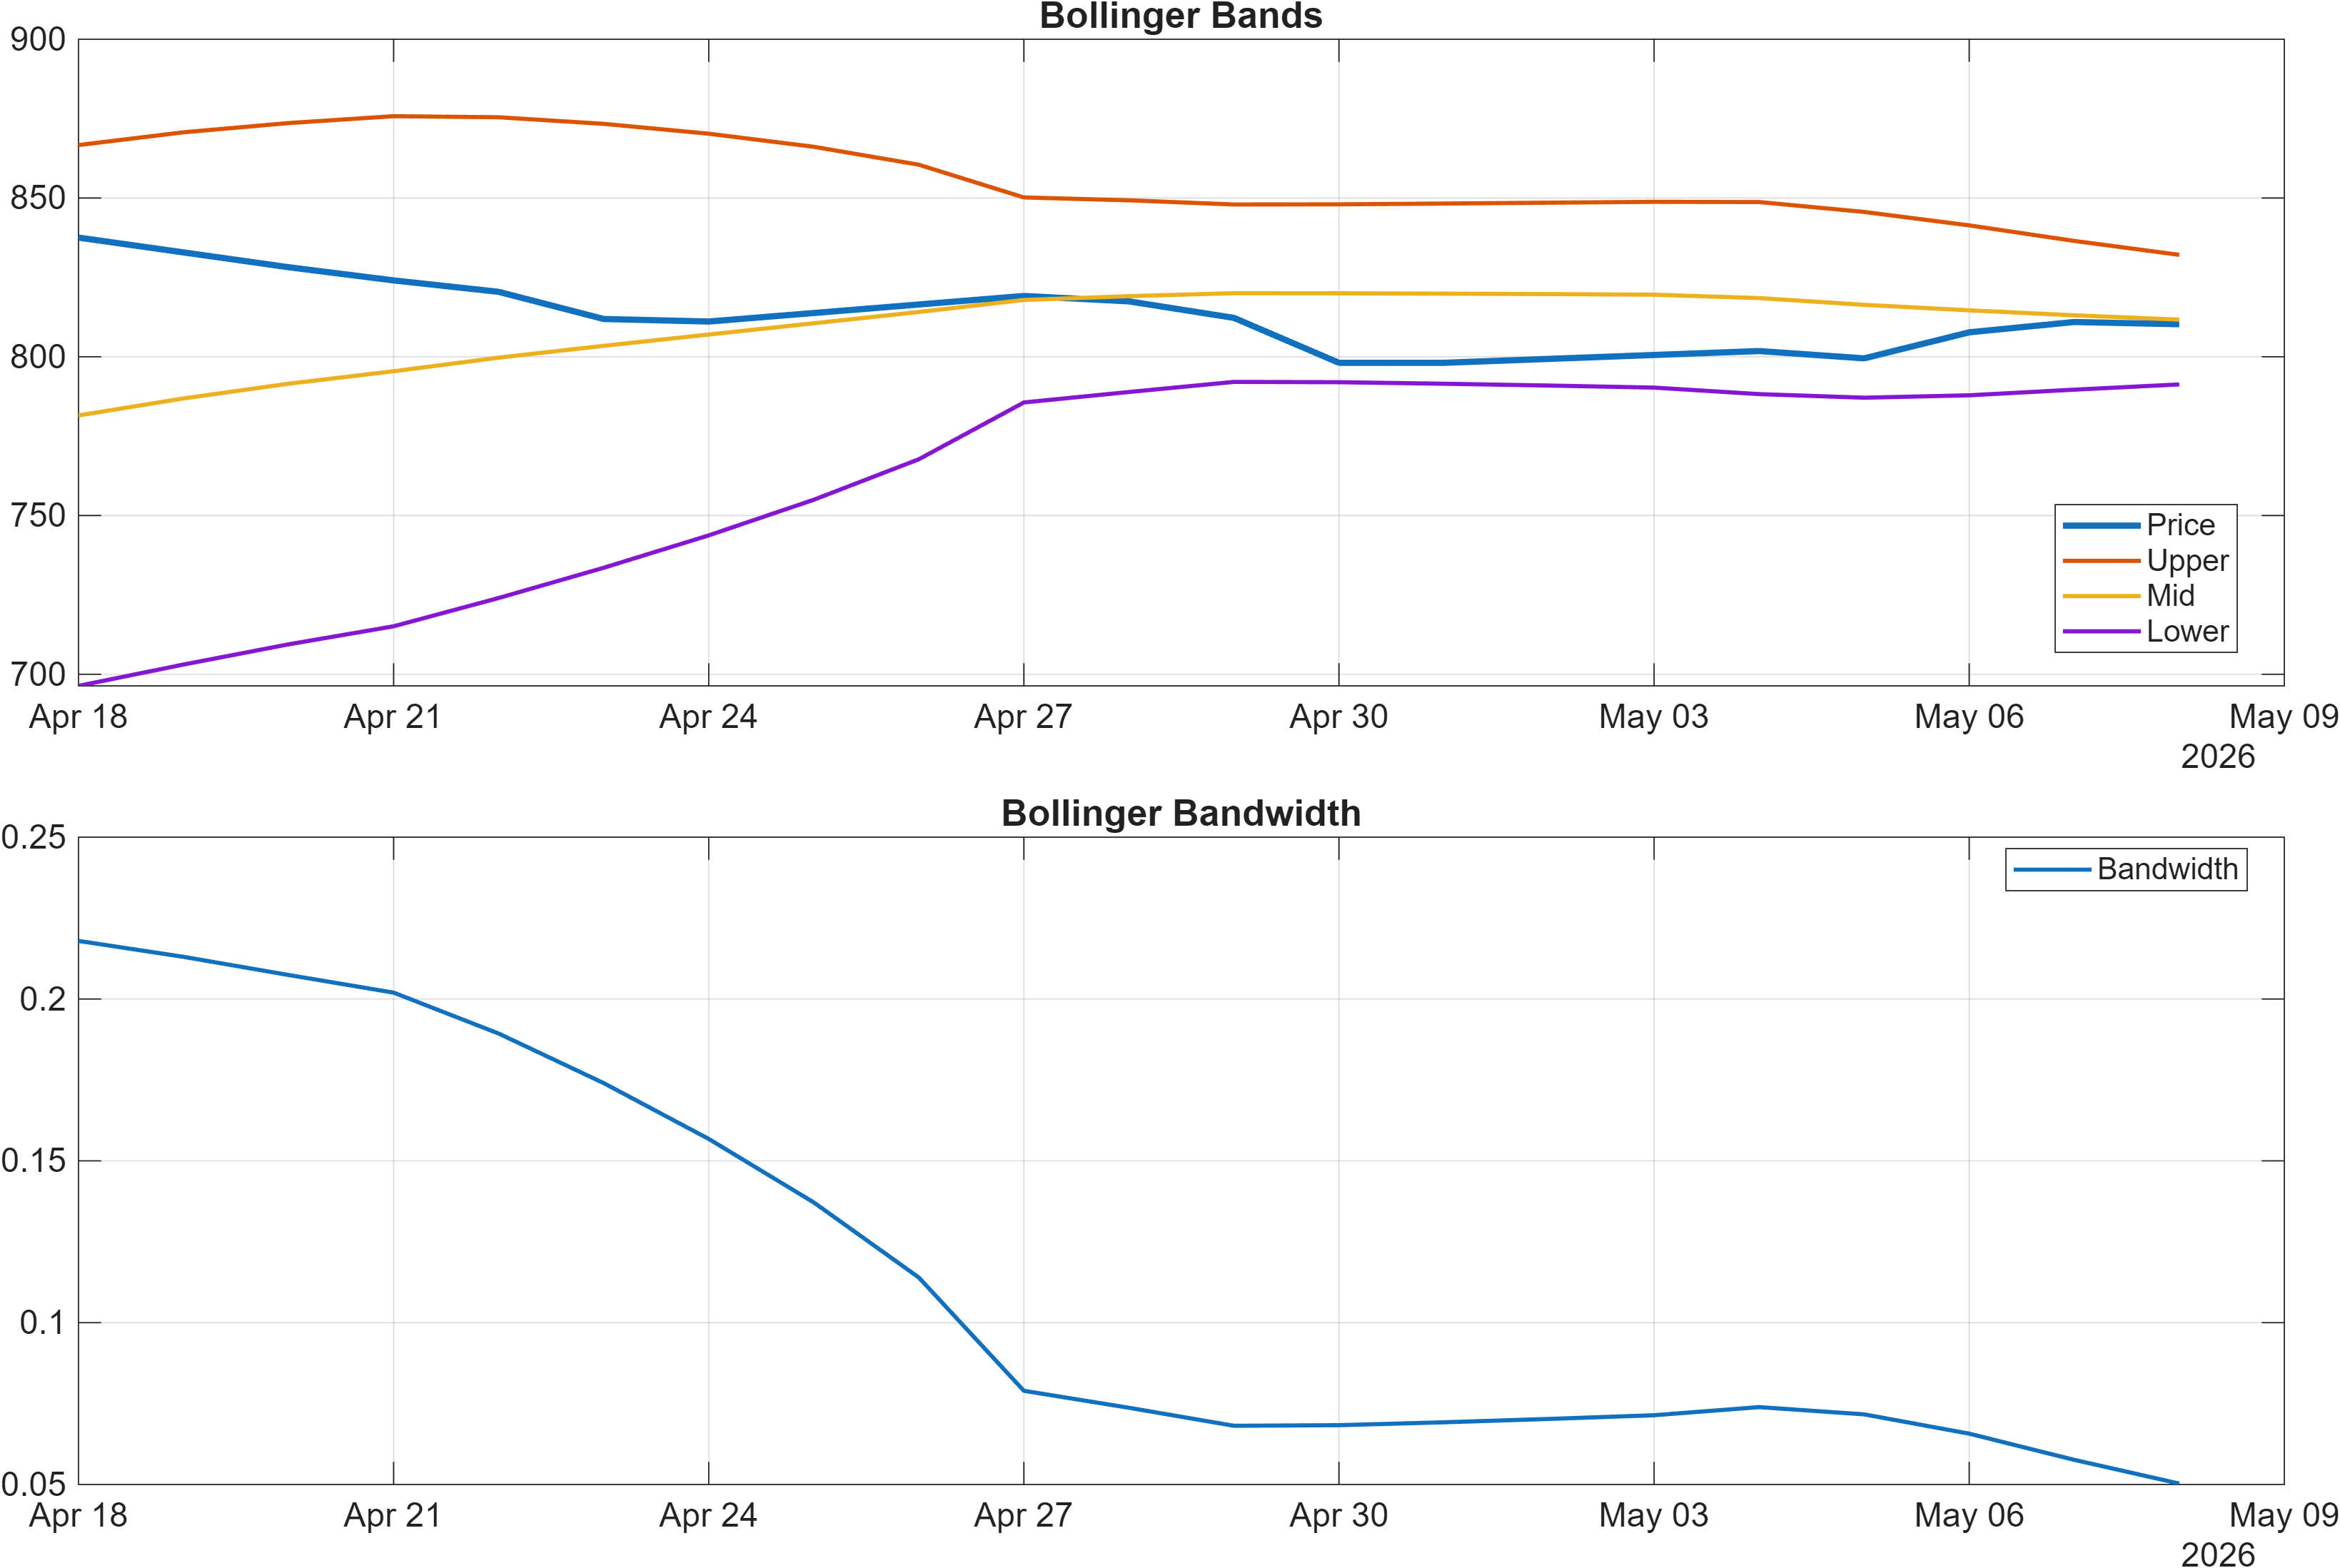
Volatility is measurable but not extreme. Bollinger bandwidth is 0.0503 (signal table: BB Width 0.05028), implying a relatively contained regime with the potential for expansion if price exits its current equilibrium. When volatility is moderate and momentum is mixed, the market often becomes sensitive to level breaks—moves can accelerate once key zones are cleared, but false breaks are also common.
Taken together, the message is momentum divergence: RSI is not oversold/overbought, while MACD remains negative. This combination typically warrants confirmation via price acceptance above resistance or stabilization above intermediate averages before treating any rally as persistent.
4) Support / Resistance zones
Support ~ 728.8250 | Resistance ~ 837.5750
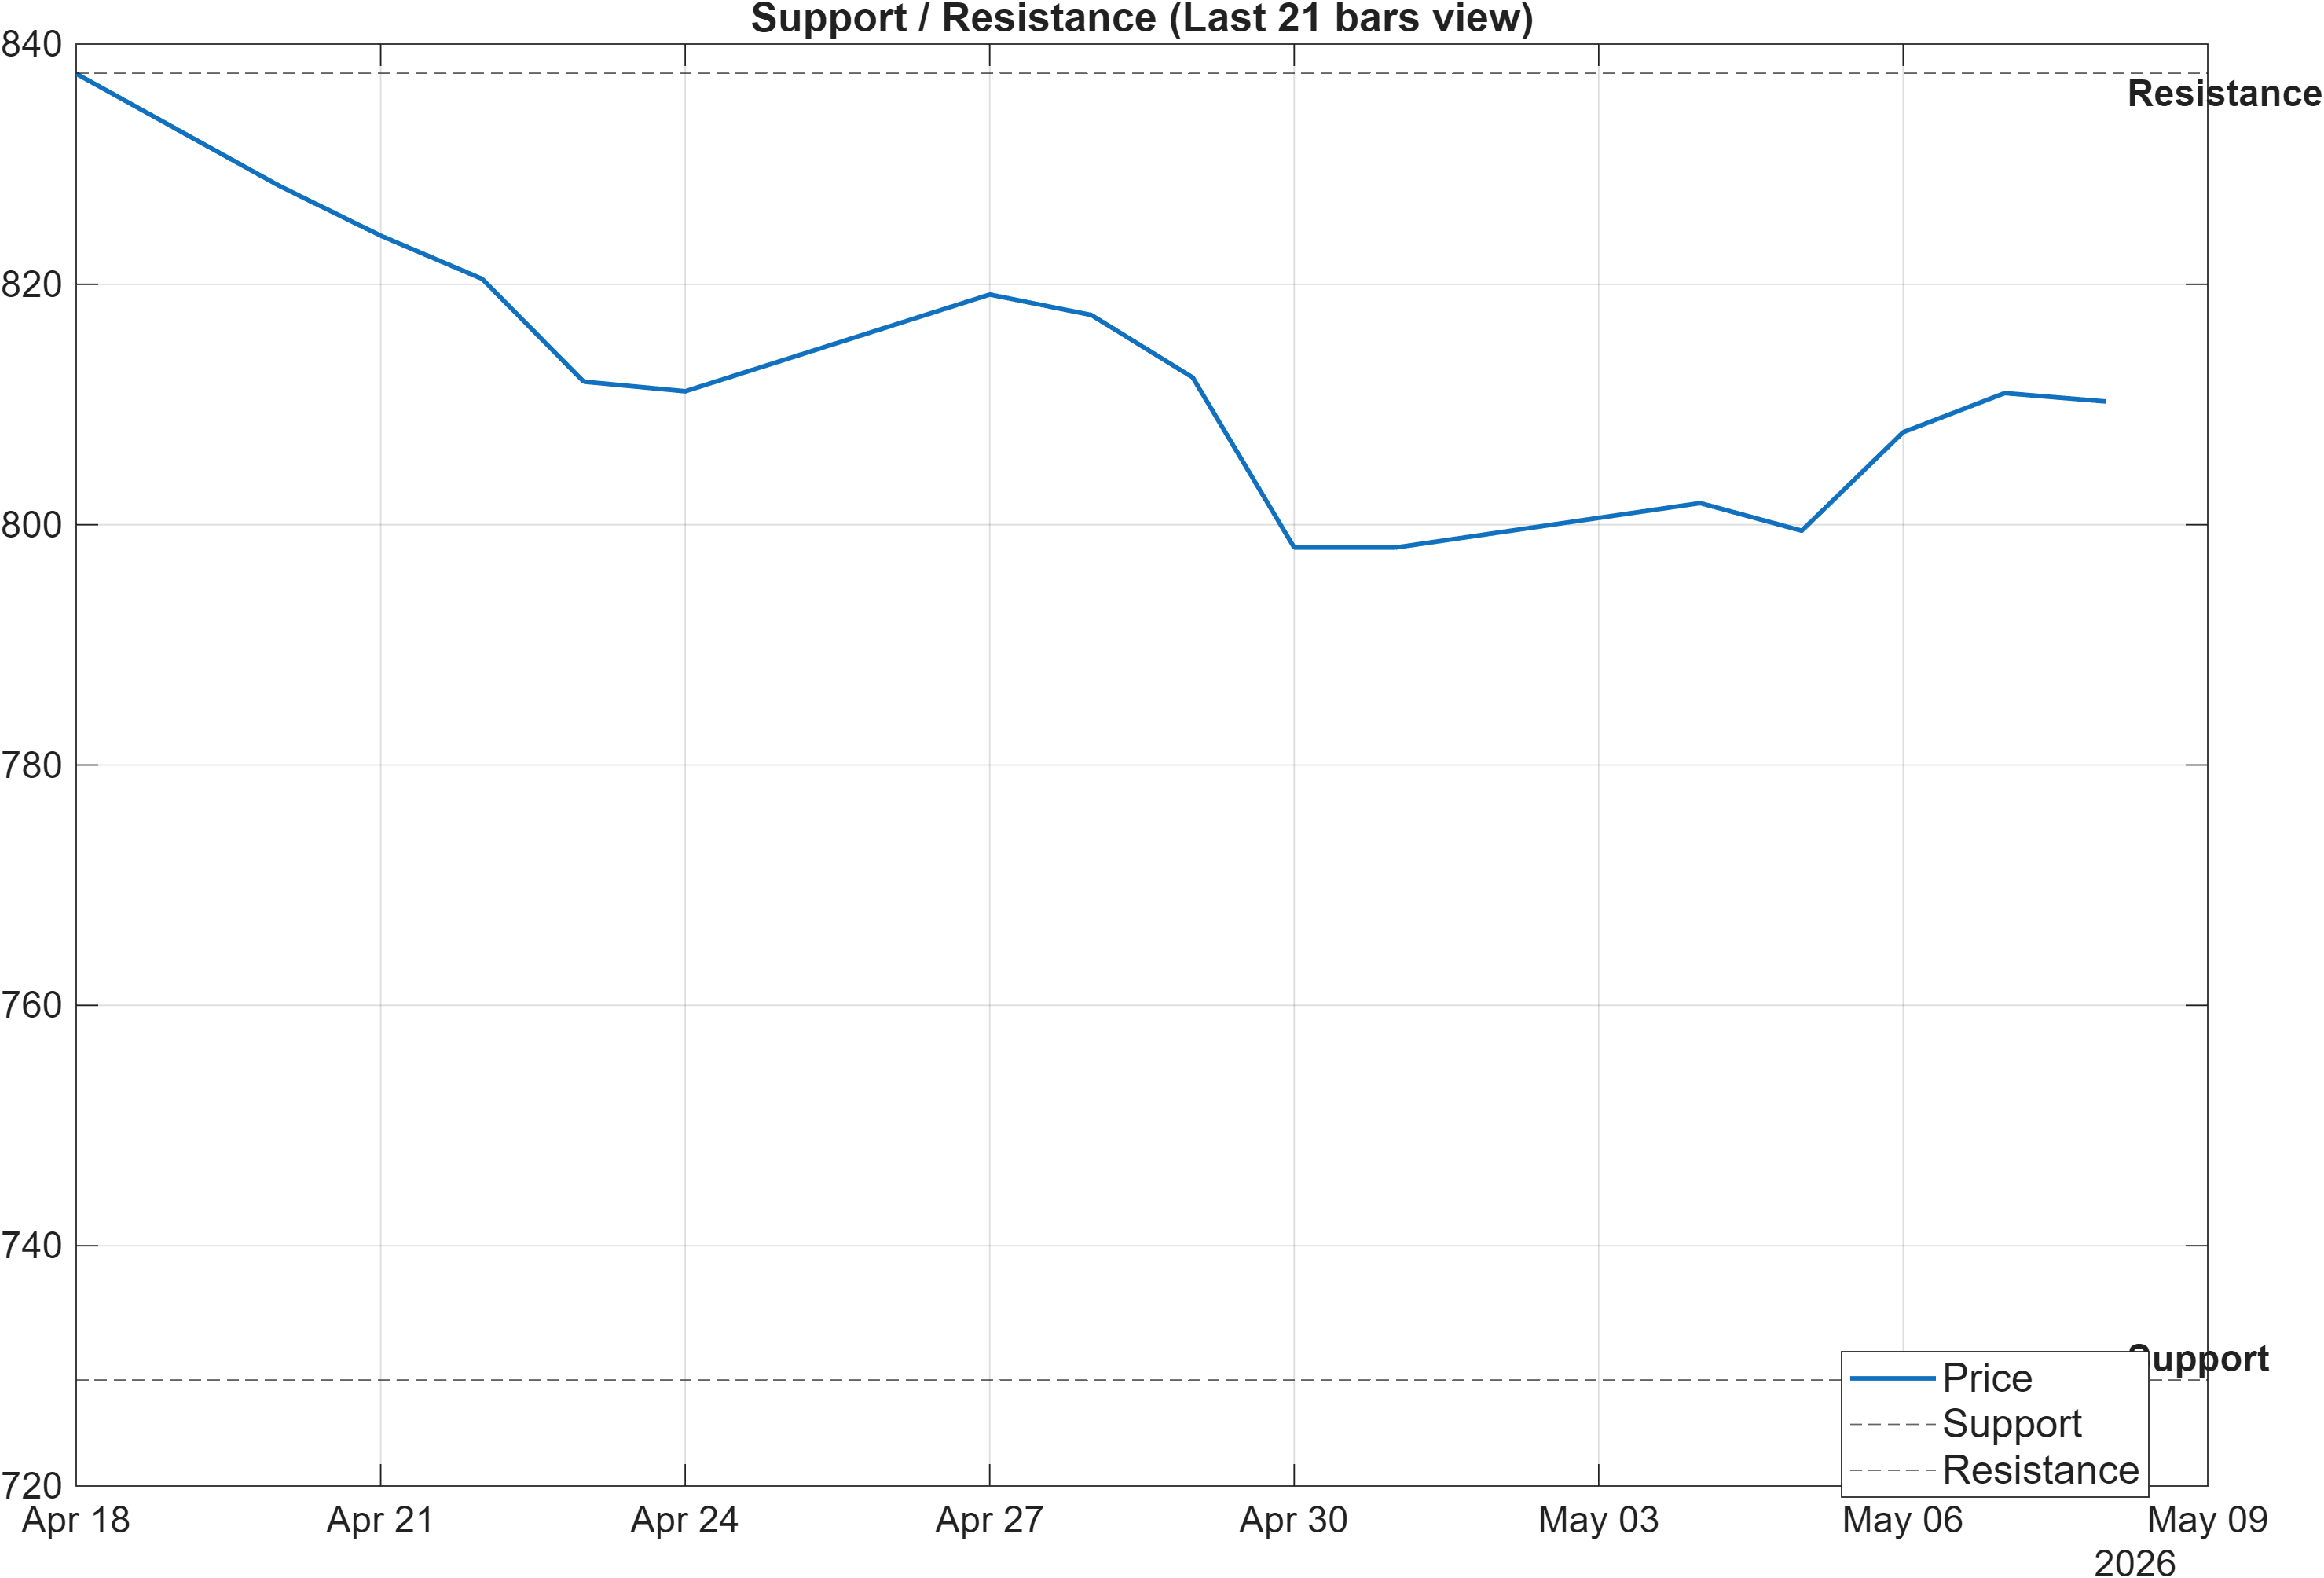
With trend signals split (close vs MA50 bearish; MA50 vs MA200 bullish), horizontal levels take on higher decision value. The zone near 728.8250 represents the market’s nearest reference for downside acceptance: repeated holds above support can stabilize short-term ranks over time, while clean closes below it often coincide with a shift toward deterioration in momentum and breadth measures.
On the upside, 837.5750 functions as the primary barrier to a directional transition. In the scenario language provided, a break above resistance with volume is the key condition for continuation. In a moderate-volatility regime (bandwidth 0.0503), breaks that hold above resistance can trigger follow-through as volatility expands; conversely, breaks that fail quickly tend to revert toward the middle of the prior range.
The signal table also gives a useful structural hint: HHIGH(20) is 844 and LLOW(20) is 796, suggesting the market has recently been operating within a relatively tight 20-period band near the resistance region. That makes 837.5750 especially important as a “line in the sand” for upside acceptance.
Risk framing is straightforward: as long as price remains between 728.8250 and 837.5750, the base case is range behavior with momentum-sensitive swings. A decisive move outside this bracket is the most information-rich event on the chart, particularly given bearish daily/weekly rank positioning.
5) Quant Technical Dashboard (18 Signals)
KGNAI AI Technical Analysis Score (Deep Reinforcement Learning): Rank #406 out of 1222 (Rank 1 represents the strongest technical positioning and a higher probability of favorable price behavior. As ranks increase toward the maximum, the probability of favorable outcomes weakens and bearish positioning becomes more dominant.) | Label: Neutral | Score: 0.336
18-Signal Technical Confluence Score: 0.167 (Neutral)
Overall Technical Score (18-signal confluence + DRL rank blend): 0.217 (Neutral)
Note: The blended score reflects signal strength weighted against broader AI technical ranking, which may temporarily diverge.
Blended technical score breakdown: 0.217 (Neutral | Bull 8 / Bear 5 / Neutral 5)
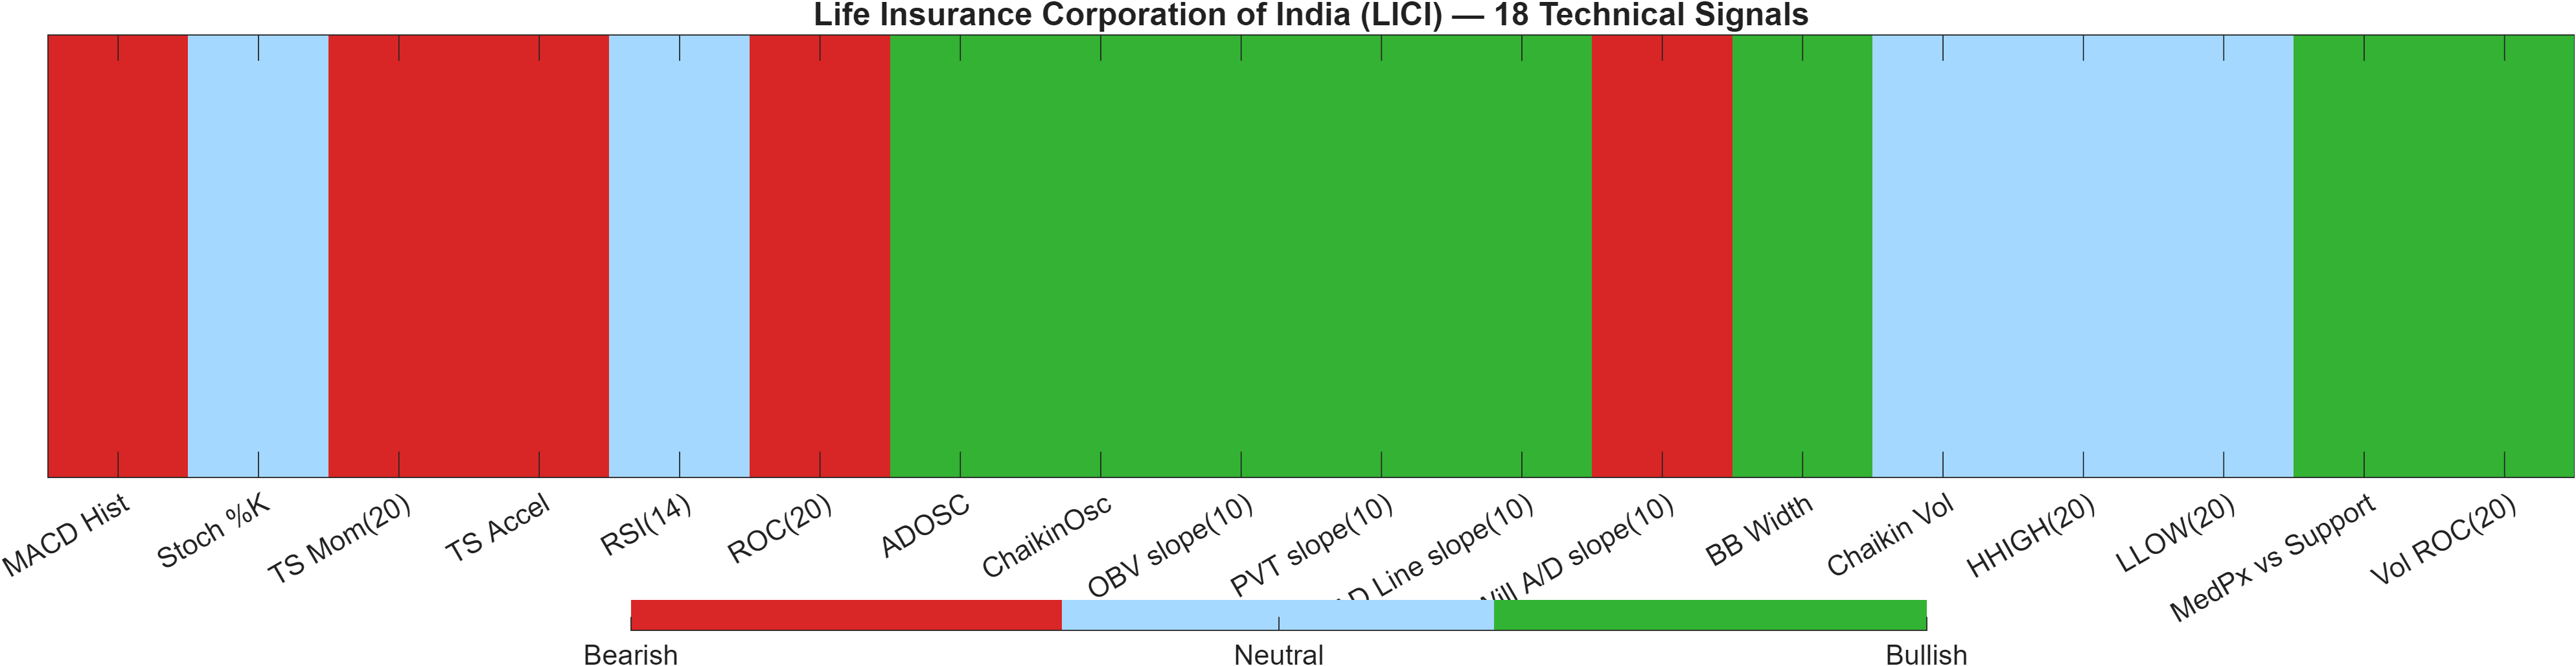
The quant dashboard resolves the mixed tape into a neutral composite, but the neutrality is not “quiet”—it is built from offsetting components. The 18-signal confluence is 0.167 (Neutral) and the blended overall technical score is 0.217 (Neutral). Meanwhile, the DRL technical rank is #406 out of 1222 with a score of 0.336, which is materially stronger than the short-horizon KGNAI ranks and helps explain why the overall label does not skew outright bearish.
The internal mix—Bull 8 / Bear 5 / Neutral 5—indicates signal dispersion rather than broad agreement. Momentum/price-change components skew weaker: MACD histogram is bearish and the time-series momentum/acceleration components are bearish, consistent with the negative histogram reading (-1.465) and the short-term bearish rank stance. By contrast, several volume/accumulation measures are bullish (e.g., ADOSC 57.43), which can occur when dips attract participation even as price remains range-bound.
Signal table (Bull/Bear/Neutral)
| Indicator | Value | Signal |
|---|---|---|
| MACD Hist | -1.465 | Bearish |
| Stoch %K | 49.75 | Neutral |
| TS Mom(20) | -21.92 | Bearish |
| TS Accel | -119.3 | Bearish |
| RSI(14) | 49.1 | Neutral |
| ROC(20) | -2.716 | Bearish |
| ADOSC | 57.43 | Bullish |
| ChaikinOsc | 3.286e+04 | Bullish |
| OBV slope(10) | 3.184e+05 | Bullish |
| PVT slope(10) | 397.2 | Bullish |
| AD Line slope(10) | 3.291e+04 | Bullish |
| Will A/D slope(10) | -1.6 | Bearish |
| BB Width | 0.05028 | Bullish |
| Chaikin Vol | -12.75 | Neutral |
| HHIGH(20) | 844 | Neutral |
| LLOW(20) | 796 | Neutral |
| MedPx vs Support | 80.5 | Bullish |
| Vol ROC(20) | 32.92 | Bullish |
Net assessment: the technical model is not flagging broad bearish agreement, but it is also not providing a high-conviction bullish cluster. In this state, decision-quality tends to improve when the market forces alignment—either by reclaiming resistance (837.5750) or by breaking support (728.8250)—rather than by trading the middle of the range.
6) News sentiment + extractive gist
Note: Instrument-specific news matches were not found, so the digest includes broader market/sector headlines. Links are provided for verification.
Sentiment score (avg): 0.118 | Positive: 50% | Neutral: 31% | Negative: 19%
KGNAI AI News Sentiment Score (normalized -1 to +1): 0.95 (as of 2026-03-16) | Label: Bullish | Overall news score: 0.95
Positive Developments
Recent coverage across major financial outlets indicates a generally constructive tone around risk appetite in select pockets of global markets, particularly where corporate actions and public listings signal improving capital formation. Narratives around management-led restructuring, stated profitability objectives, and large-scale shareholder return programs have contributed to a more supportive backdrop for equity sentiment. Separately, demand for new listings and episodic strength in IPO debuts reinforces the idea that selective growth and thematic exposure can still attract marginal capital, even amid rate uncertainty. For LICI’s context, this matters less as a direct fundamental driver (instrument-specific items were not available) and more as a sentiment overlay: a higher normalized news score (0.95) alongside an average score of 0.118 suggests the model is capturing a broadly constructive bias despite mixed market internals.
Neutral / Mixed Developments
Macro and cross-asset headlines appear balanced: messaging around policy rates being held steady “for quite some time” can reduce immediate policy volatility, yet it also keeps the opportunity set dependent on growth and inflation path clarity. Broader market wrap-ups describing uneven equity performance and choppy commodity conditions reinforce a mixed environment where sector rotation can dominate index-level direction. This aligns with LICI’s technical profile of neutrality in confluence (0.167) and a neutral RSI reading (49.1): a backdrop where incremental information tends to matter most at key technical levels rather than through persistent directional drift.
Negative / Risk Signals
Risk-oriented coverage has emphasized valuation markdowns in parts of private credit, selective disappointment in consumer IPO performance, and sensitivity to cross-asset moves in metals and energy. These themes can matter indirectly by tightening overall risk budgets and increasing dispersion: weaker segments can pull liquidity away from marginal setups, raising the bar for technical confirmation. For LICI, this is relevant because the short-horizon rank posture is already bearish (daily #1039, weekly #1074), meaning the tape may be more vulnerable to broader risk-off impulses until price reclaims stronger structure. In practical monitoring terms, negative macro impulses can show up first as failed retests near resistance (837.5750) or loss of support (728.8250) before they become visible in slower indicators.
What to monitor next
- Price acceptance above 837.5750 versus repeated rejection near the upper band of the range.
- Momentum repair: MACD histogram improving from -1.4646 alongside RSI holding above the neutral zone.
- Volatility expansion: Bollinger bandwidth (0.0503) rising during directional movement rather than during whipsaw.
Sources referenced: Reuters, Bloomberg, Yahoo Finance, MarketWatch, Investing.com
7) Sources
- US stocks today: US market ends lower as semiconductor stocks reverse earlier gains — https://economictimes.indiatimes.com/markets/us-stocks/news/us-stocks-today-us-market-ends-lower-as-semiconductor-stocks-reverse-earlier-gains/articleshow/130922309.cms
- US Fed's Hammack says rates likely on hold 'for quite some time' amid elevated inflation — https://economictimes.indiatimes.com/markets/us-stocks/news/us-feds-hammack-says-rates-likely-on-hold-for-quite-some-time-amid-elevated-inflation/articleshow/130920836.cms
- US market today: Citigroup targets stronger profitability as CEO Fraser drives overhaul — https://economictimes.indiatimes.com/markets/us-stocks/news/us-market-today-citigroup-targets-stronger-profitability-as-ceo-fraser-drives-overhaul/articleshow/130916458.cms
- US market today: Blackstone, BlackRock cut value of their private credit funds — https://economictimes.indiatimes.com/markets/us-stocks/news/update-2-blackstone-blackrock-cut-value-of-their-private-credit-funds/articleshow/130916143.cms
- US stocks today: Paine Schwartz-backed Suja Life's shares fall 14% in Nasdaq debut — https://economictimes.indiatimes.com/markets/us-stocks/news/us-stocks-today-paine-schwartz-backed-suja-lifes-shares-fall-14-in-nasdaq-debut/articleshow/130912254.cms
- US stocks today: Space analytics firm HawkEye 360 valued at $3.15 billion after NYSE debut — https://economictimes.indiatimes.com/markets/us-stocks/news/us-stocks-today-space-analytics-firm-hawkeye-360-valued-at-3-15-billion-after-nyse-debut/articleshow/130910976.cms
- Zerodha’s Rs 7,400 crore MTF book highlights retail shift from cash trading to leveraged bets: Nithin Kamath — https://economictimes.indiatimes.com/markets/stocks/news/zerodhas-rs-7400-crore-mtf-book-highlights-retail-shift-from-cash-trading-to-leveraged-bets-nithin-kamath/articleshow/130909808.cms
- Bharat Forge Q4 results: Cons PAT falls 17% YoY to Rs 233 crore, revenue up 18% — https://economictimes.indiatimes.com/markets/stocks/earnings/bharat-forge-q4-results-cons-pat-falls-17-yoy-to-rs-233-crore-revenue-up-18/articleshow/130909242.cms
You may also like: How KGNAI AI ranks instruments across global markets
Disclaimer: KGNAI provides AI-generated analytics and educational market commentary only. This is not financial advice. Markets involve risk. Always do your own research.