
SBC Exports Limited (SBC) — 15-Mar-2026 Quant Signal Review with Bullish Ranks and Neutral Technical Confluence
As of 15-Mar-2026, SBC Exports Limited (SBC) screens with consistently strong KGNAI cross-sectional ranks across time horizons, placing it in the upper tier of the tracked INDIA universe (1222 instruments) from daily through yearly windows. That rank strength contrasts with a Neutral blended technical posture, where the 18-signal confluence and the DRL technical rank blend lean mildly negative (overall technical score -0.215) despite trend structure reading constructive versus key moving averages. Momentum indicators show mixed evidence: RSI is supportive at 57.28 while MACD histogram remains negative (-0.0856), implying upside persistence may require renewed impulse rather than continuation by inertia. Volatility is relatively compressed, with Bollinger bandwidth at 0.0215, which can coincide with tighter ranges around key decision levels. Structurally, the report focuses on how ranks, trend, momentum, and sentiment interact around Support ~28.4900 and Resistance ~32.5250.
- Short / Mid / Long stance: Bullish (daily #21, weekly #35, yearly #3 out of 1222; strongest concentration in longer windows).
- Technical confluence: Neutral (overall technical score -0.215; DRL rank #733).
- Key levels: Support ~28.4900 | Resistance ~32.5250.
- News sentiment bias: Mildly positive (avg 0.154; 50% positive / 50% neutral / 0% negative).
- Confirmation / invalidation: Continuation risk improves on a break above 32.5250 with volume; deterioration risk increases on a close below 28.4900.
KGNAI evaluates assets using large cross-sectional datasets built from millions of structured data points. Inputs incorporate fundamental metrics, technical structures, and systematically processed news sentiment. Statistical models, machine learning, and AI frameworks are used to assess relative positioning, signal alignment, and probabilistic behavior across broad universes.
- Ranks are comparative across the tracked universe, not absolute price targets.
- Confluence reflects alignment among independent signal groups.
- Support/resistance levels are probabilistic decision zones, not guarantees.
- Sentiment provides contextual bias within the broader analytical framework.
1) KGNAI AI Analysis
Region: INDIA
Total universe size: 1222 ranked instruments
- Daily rank: #21 out of 1222 — Bullish
- Weekly rank: #35 out of 1222 — Bullish
- Monthly rank: #33 out of 1222 — Bullish
- 3-Monthly rank: #4 out of 1222 — Bullish
- 6-Monthly rank: #3 out of 1222 — Bullish
- Yearly rank: #3 out of 1222 — Bullish
The cross-horizon rank stack is unusually concentrated near the very top of the universe, with the 3-month (#4), 6-month (#3), and yearly (#3) windows indicating persistent relative strength rather than a single-period anomaly. Even the shorter windows remain in the upper tier (daily #21; weekly #35), suggesting the model sees supportive behavior across multiple sampling lengths.
That said, KGNAI ranks are not a substitute for signal agreement inside the chart itself. In this report, ranks skew decisively Bullish across terms, while the later technical aggregation reads Neutral. This is a meaningful alignment test: when ranks remain strong but confluence is mixed, the typical interpretation is that broader positioning may be favorable, yet near-term path dependency becomes more sensitive to breakouts, failed rallies, or level-based reactions.
The framework definition remains consistent: lower rank values are treated as stronger positioning within the universe of 1222 instruments. Within that context, SBC’s long-horizon placement implies structural sponsorship, while the daily/weekly placement indicates that sponsorship has not fully degraded in recent observations. The report’s decision points therefore anchor on whether price action can translate that relative strength into cleaner momentum confirmation around the stated support and resistance bands.
Term view: Short-term: Bullish. Mid-term: Bullish. Long-term: Bullish.
Want the full universe and complete rank tables? Unlock full access on KGNAI: https://www.kgnai.com/pricing
2) Price & trend overview
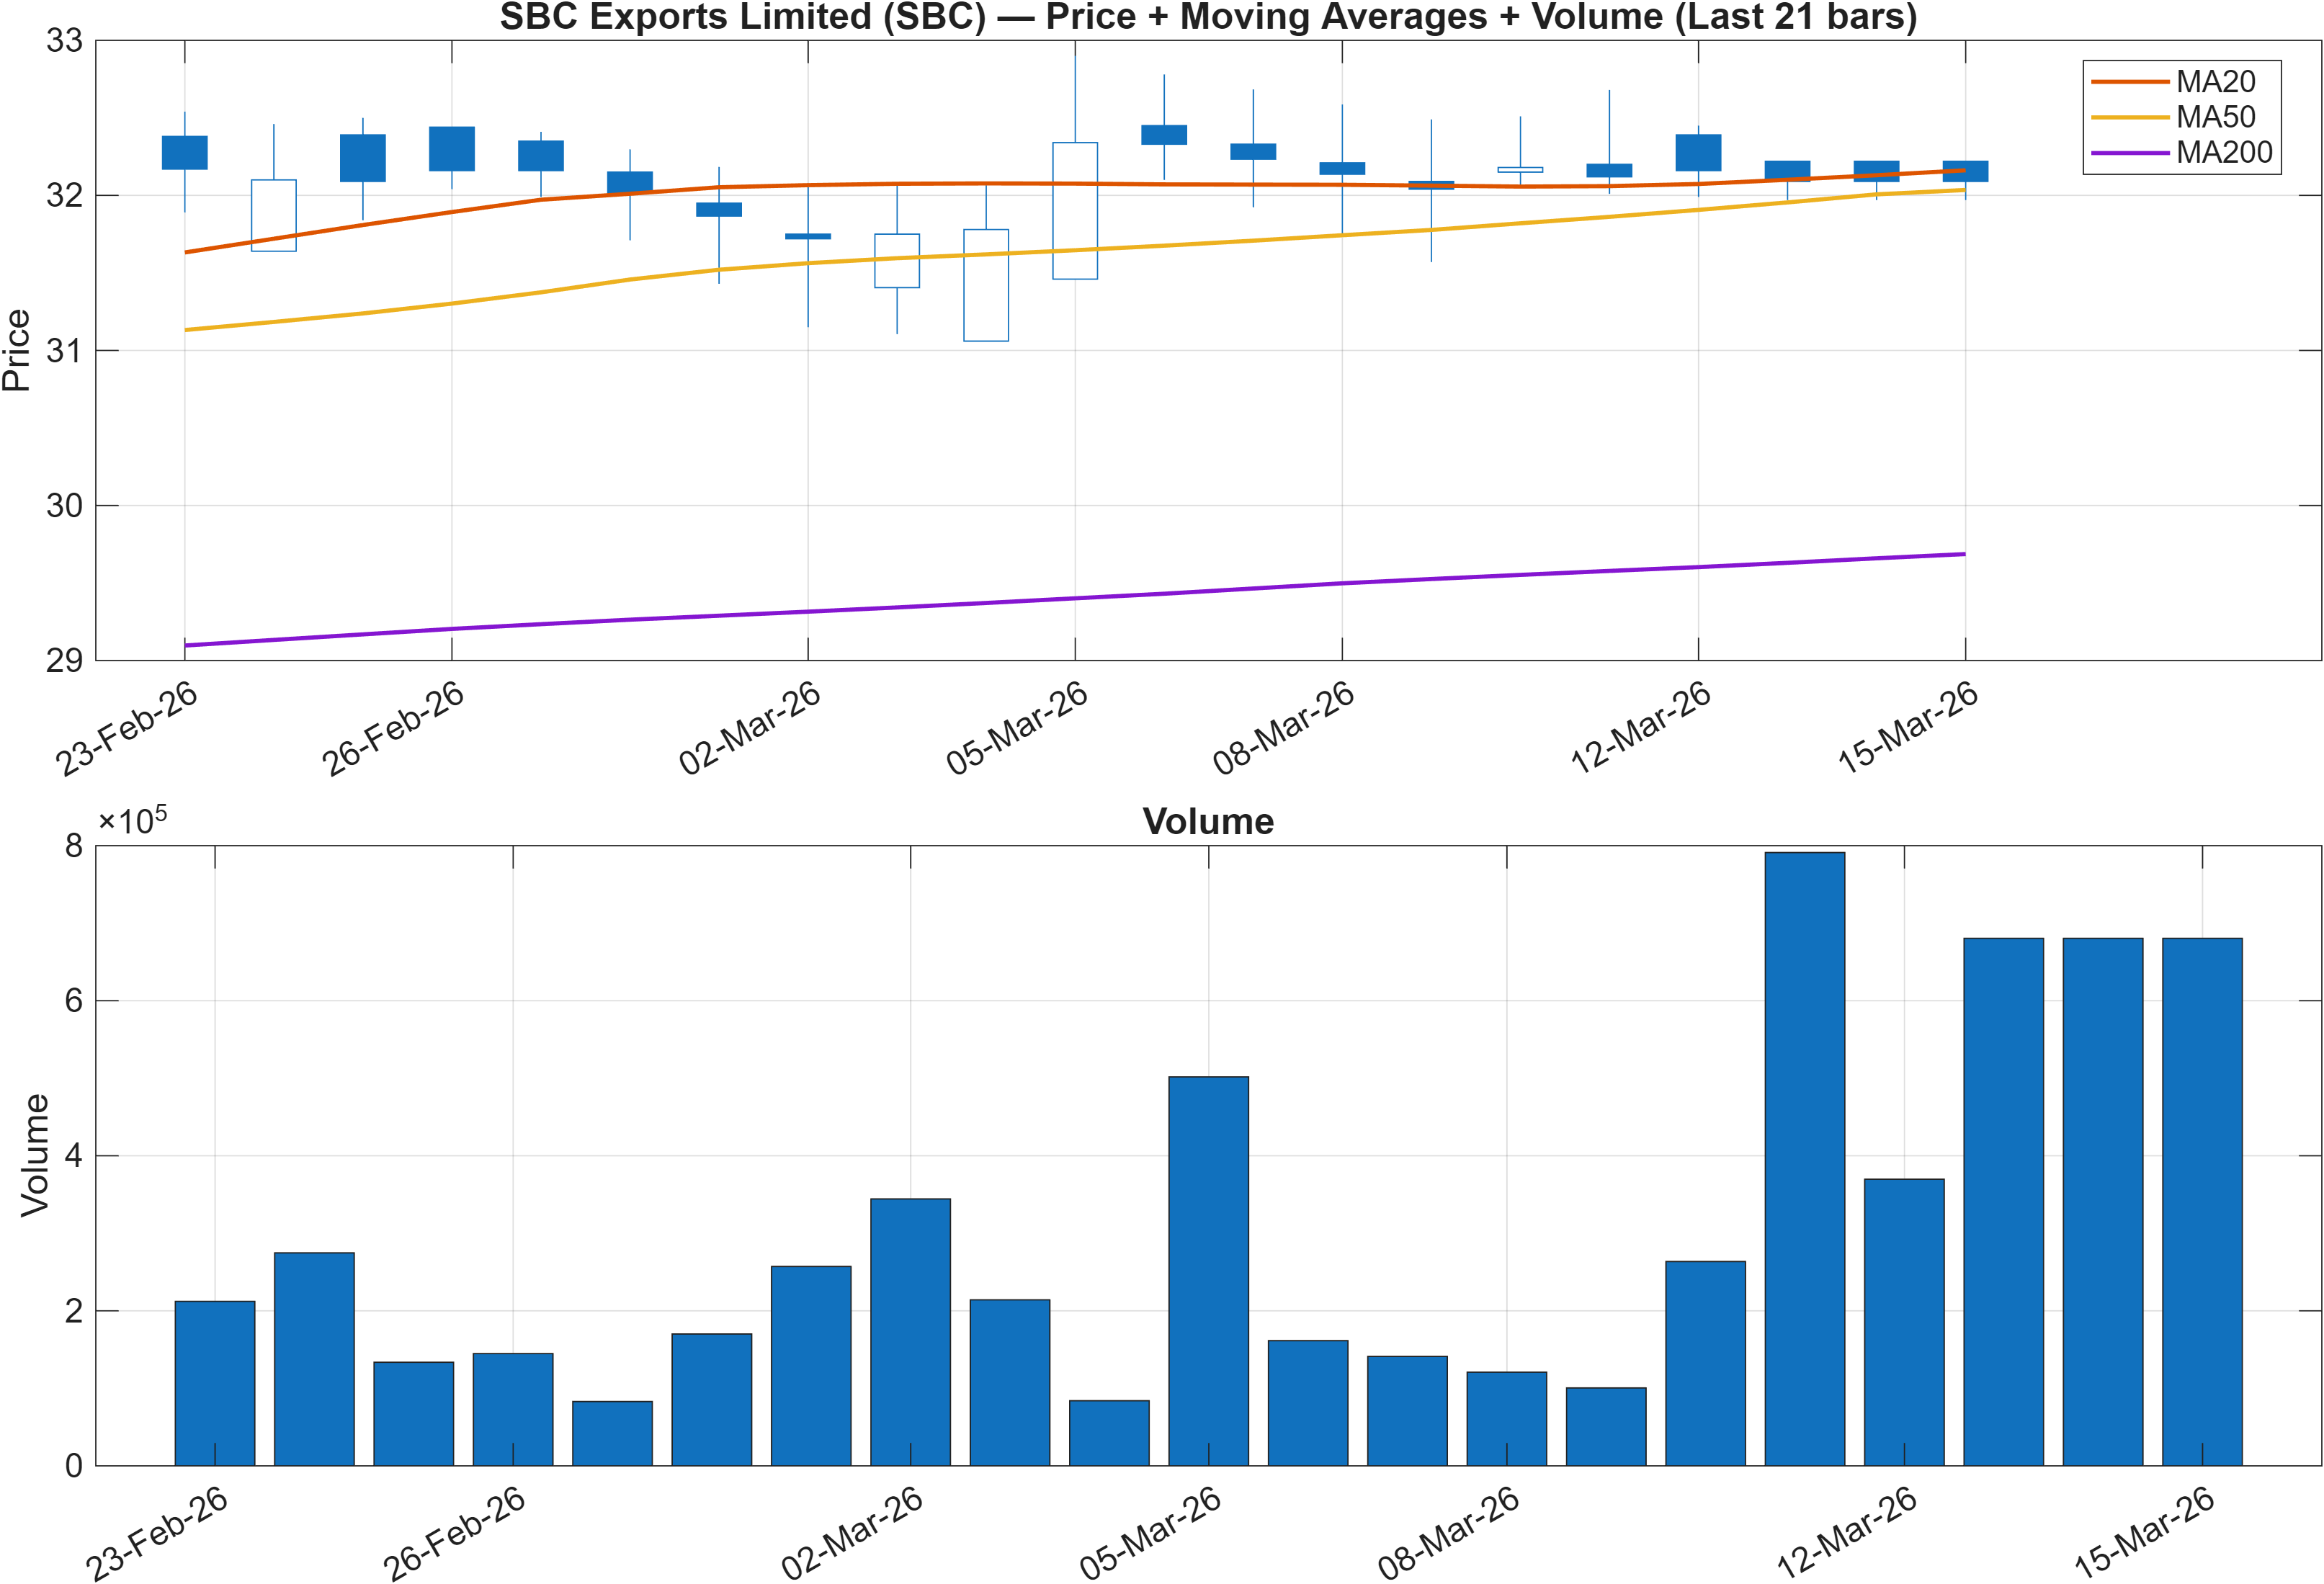
The trend read is constructive on two independent checks: close vs MA50 is Bullish and MA50 vs MA200 is Bullish. In classical trend taxonomy, that combination typically characterizes a market that is still organized to the upside, where pullbacks are more likely to be evaluated as retracements rather than immediate regime shifts—unless confirmed by level failure.
The key analytical tension is that trend structure can remain positive even as shorter-horizon momentum and flow indicators soften. That matters because the KGNAI rank stack is strongest in the longer windows (for example, yearly #3), while several 18-signal components later flag distribution or fading participation. When trend is positive but participation is ambiguous, price often becomes more reactive to discrete zones rather than trending smoothly.
From a structure-first perspective, the most decision-relevant levels in this report are the quantified zones: Support ~28.4900 and Resistance ~32.5250. With a bullish moving-average configuration, reactions into support tend to be monitored for stabilization and demand re-entry; conversely, repeated failure near resistance can convert an otherwise bullish trend into a range-bound condition.
Volume is presented visually in Figure 1, and the dashboard later provides a volume rate-of-change input (Vol ROC(20) 147.7) that suggests a recent expansion in activity. The interpretive priority is whether that participation coincides with upside attempts (supporting continuation) or with rejection near resistance (supporting mean reversion).
Interpretation: Close vs MA50 = Bullish, MA50 vs MA200 = Bullish.
3) Momentum & volatility dashboard
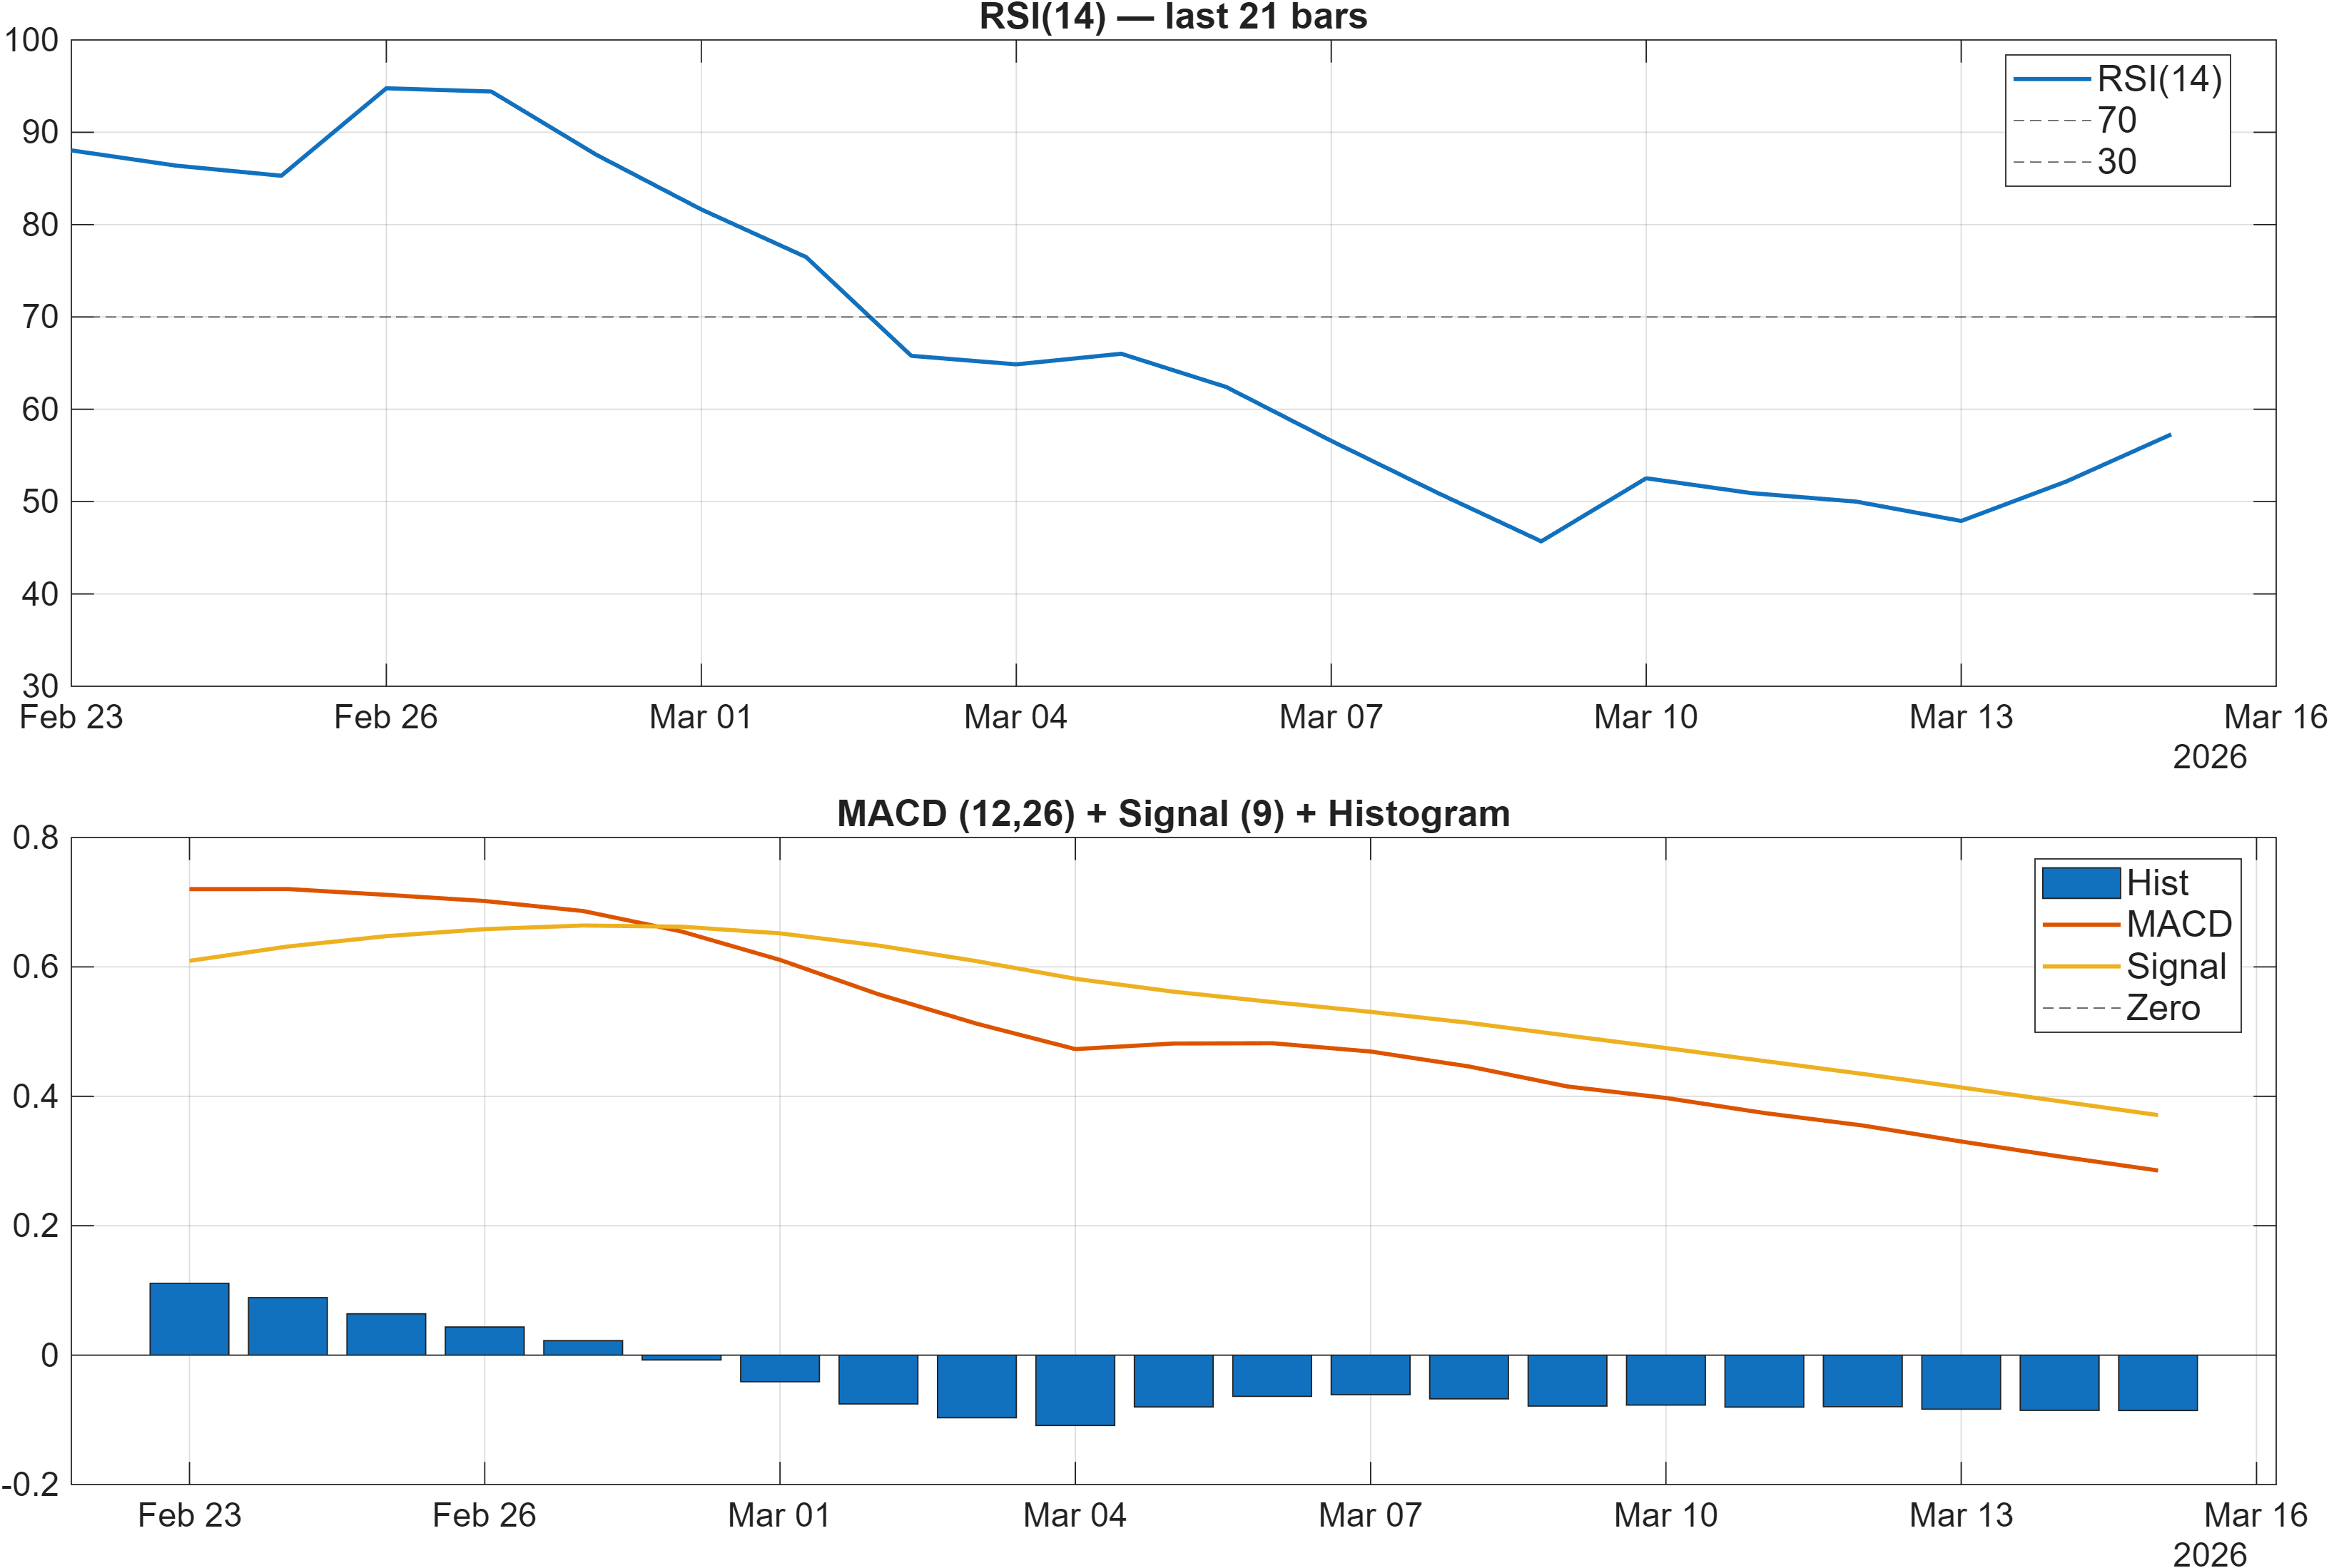
Momentum is mixed rather than one-directional. RSI(14) at 57.28 supports a constructive bias—typically consistent with price holding above midline conditions—yet the MACD histogram remains negative at -0.0856, which often indicates the recent impulse has not fully re-accelerated. The combination is best read as “trend intact, thrust not fully confirmed.”
That mix becomes more important when paired with volatility conditions. Bollinger bandwidth is 0.0215, a relatively tight reading that points to compression. Compression regimes tend to be less forgiving of false starts: small shifts in momentum can create outsized moves as the range resolves, but direction is usually established through level interaction (breaks/holds) rather than indicator drift.
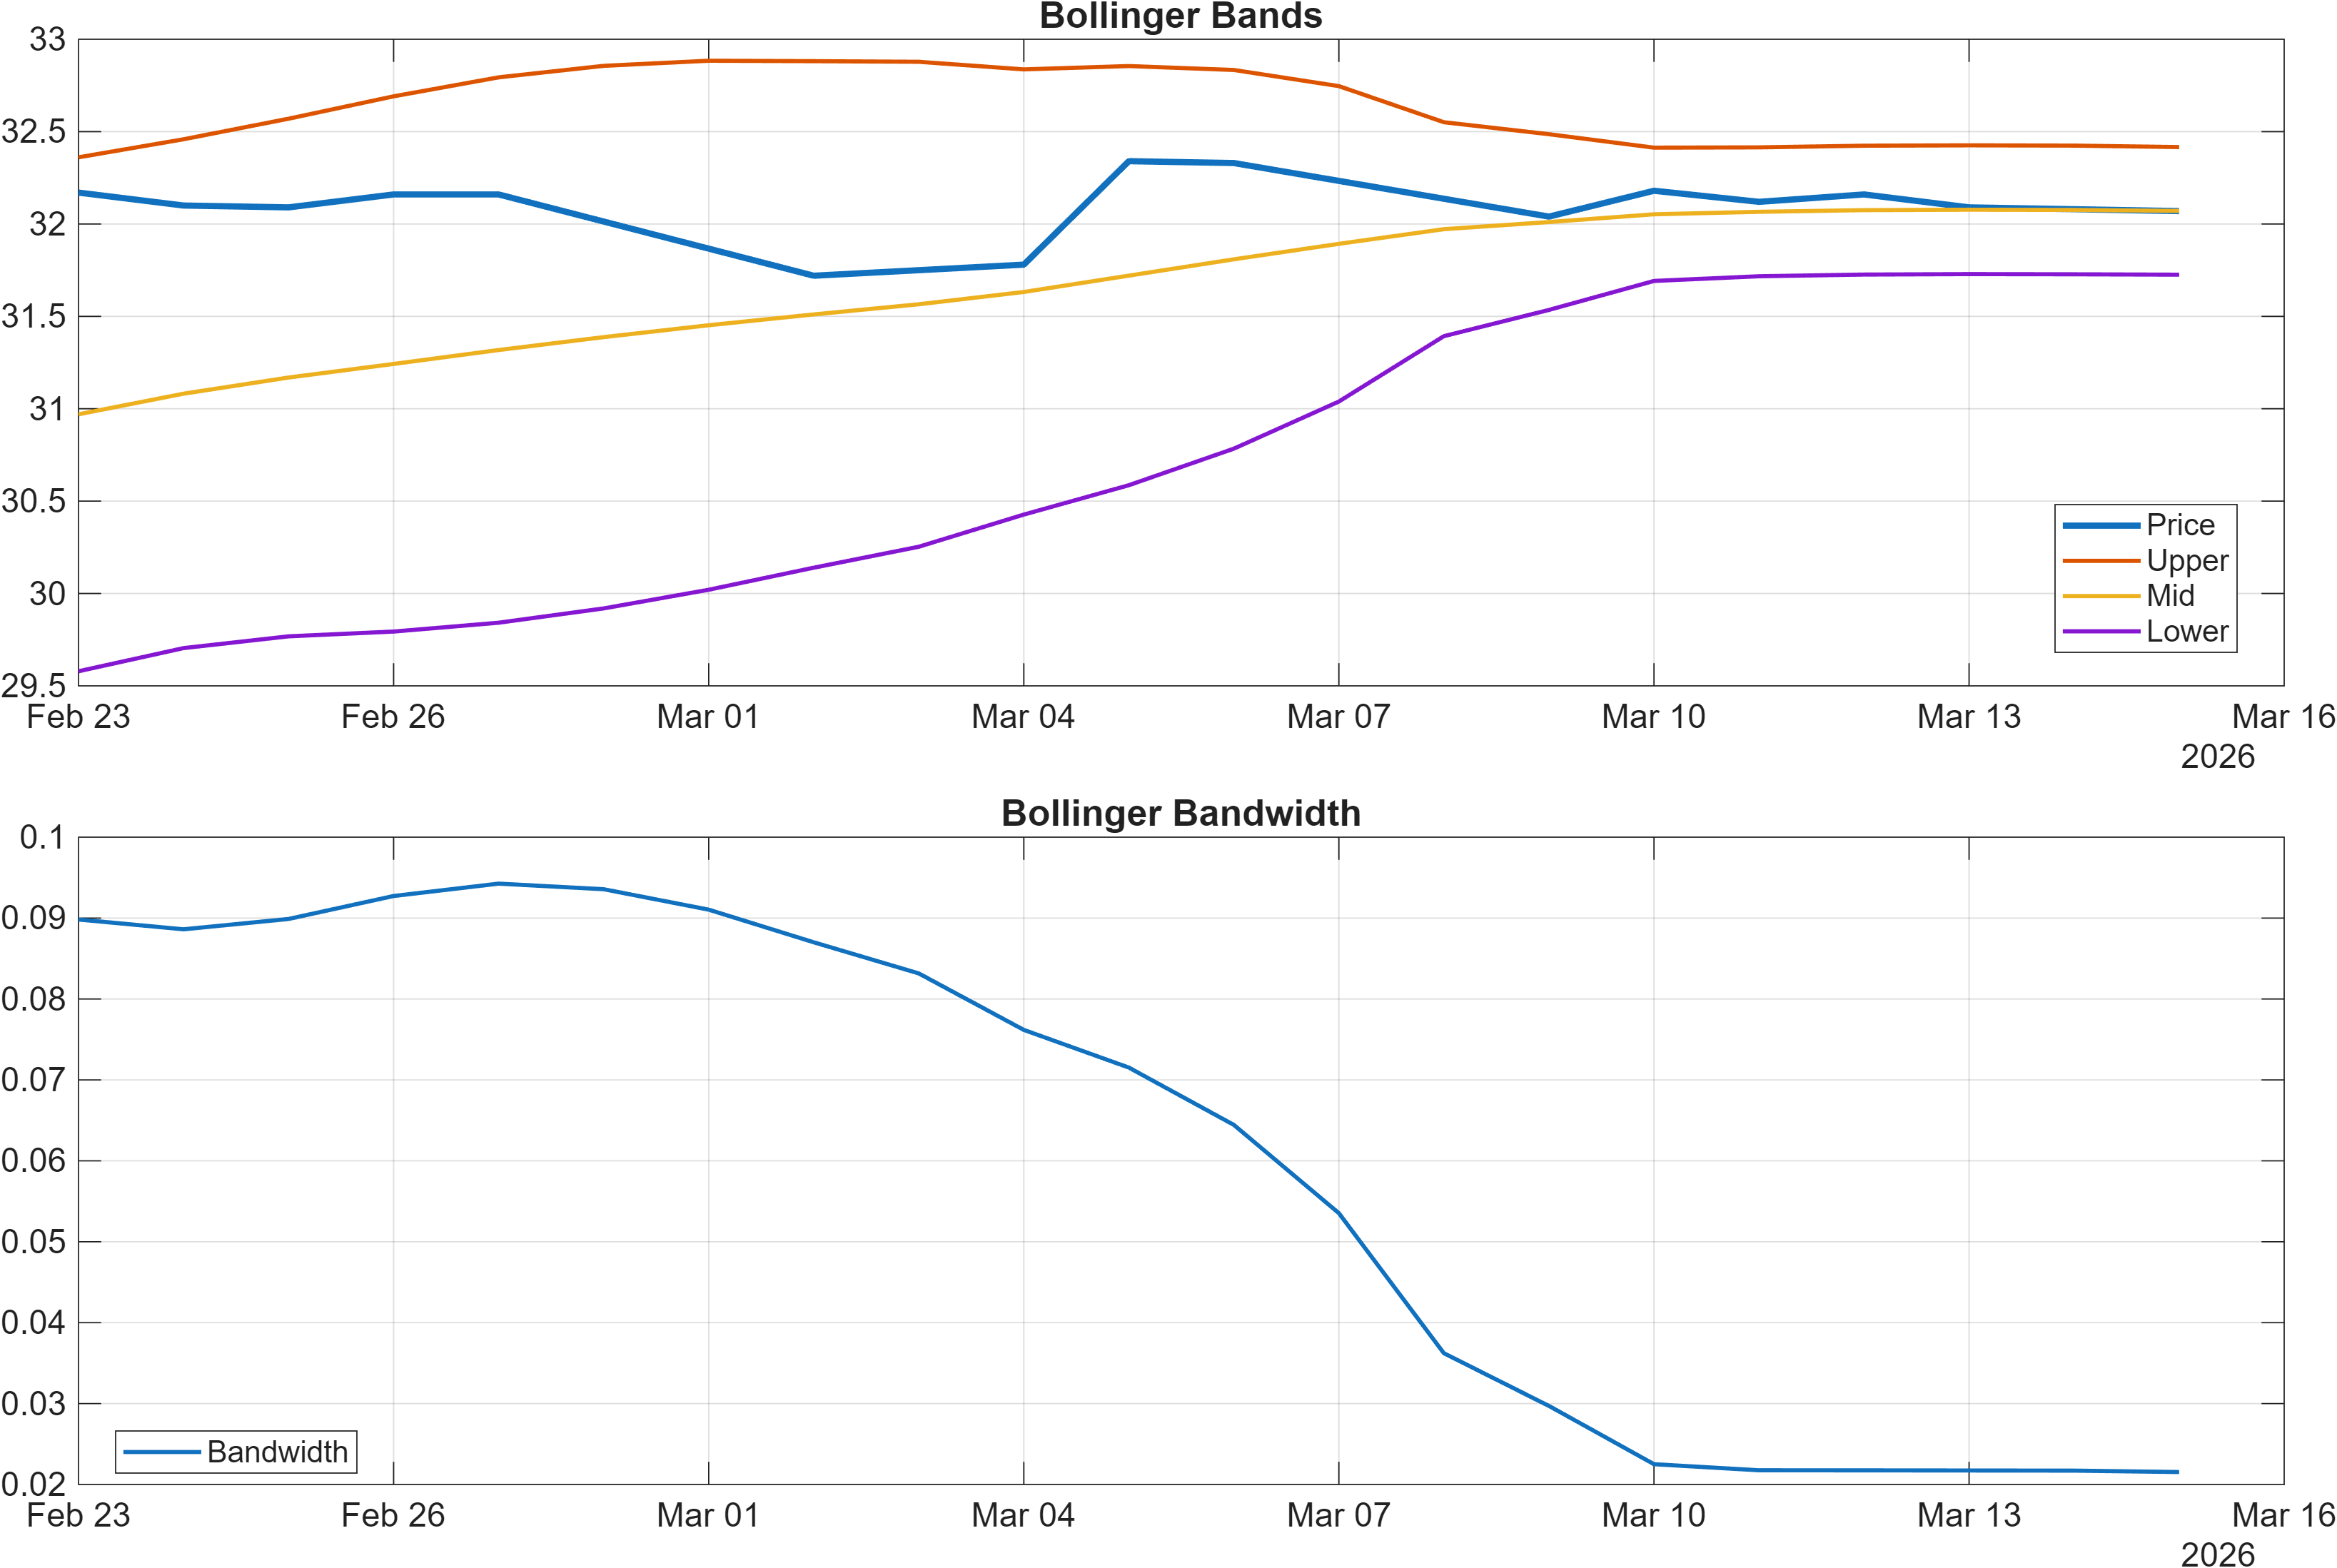
The signal table later shows additional nuance: Stoch %K at 42.98 is Neutral (not stretched), while rate-of-change over 20 periods is negative (ROC(20) -0.09346), echoing the MACD caution. At the same time, the volatility-related BB Width signal is flagged Bullish with 0.02154, consistent with the idea that a low-volatility regime can precede expansion—though it does not specify direction.
In practice, this dashboard is describing a market where upside structure exists, but confirmation is conditional: RSI supports resilience, while MACD/ROC suggest the market may still be digesting prior movement. The highest-quality read typically comes from whether momentum improves as price tests (or clears) 32.5250, versus deteriorates as price rotates down toward 28.4900.
Interpretation: RSI bias = Neutral, MACD hist = -0.0856.
Interpretation: Bandwidth (volatility regime) latest = 0.0215.
4) Support / Resistance zones
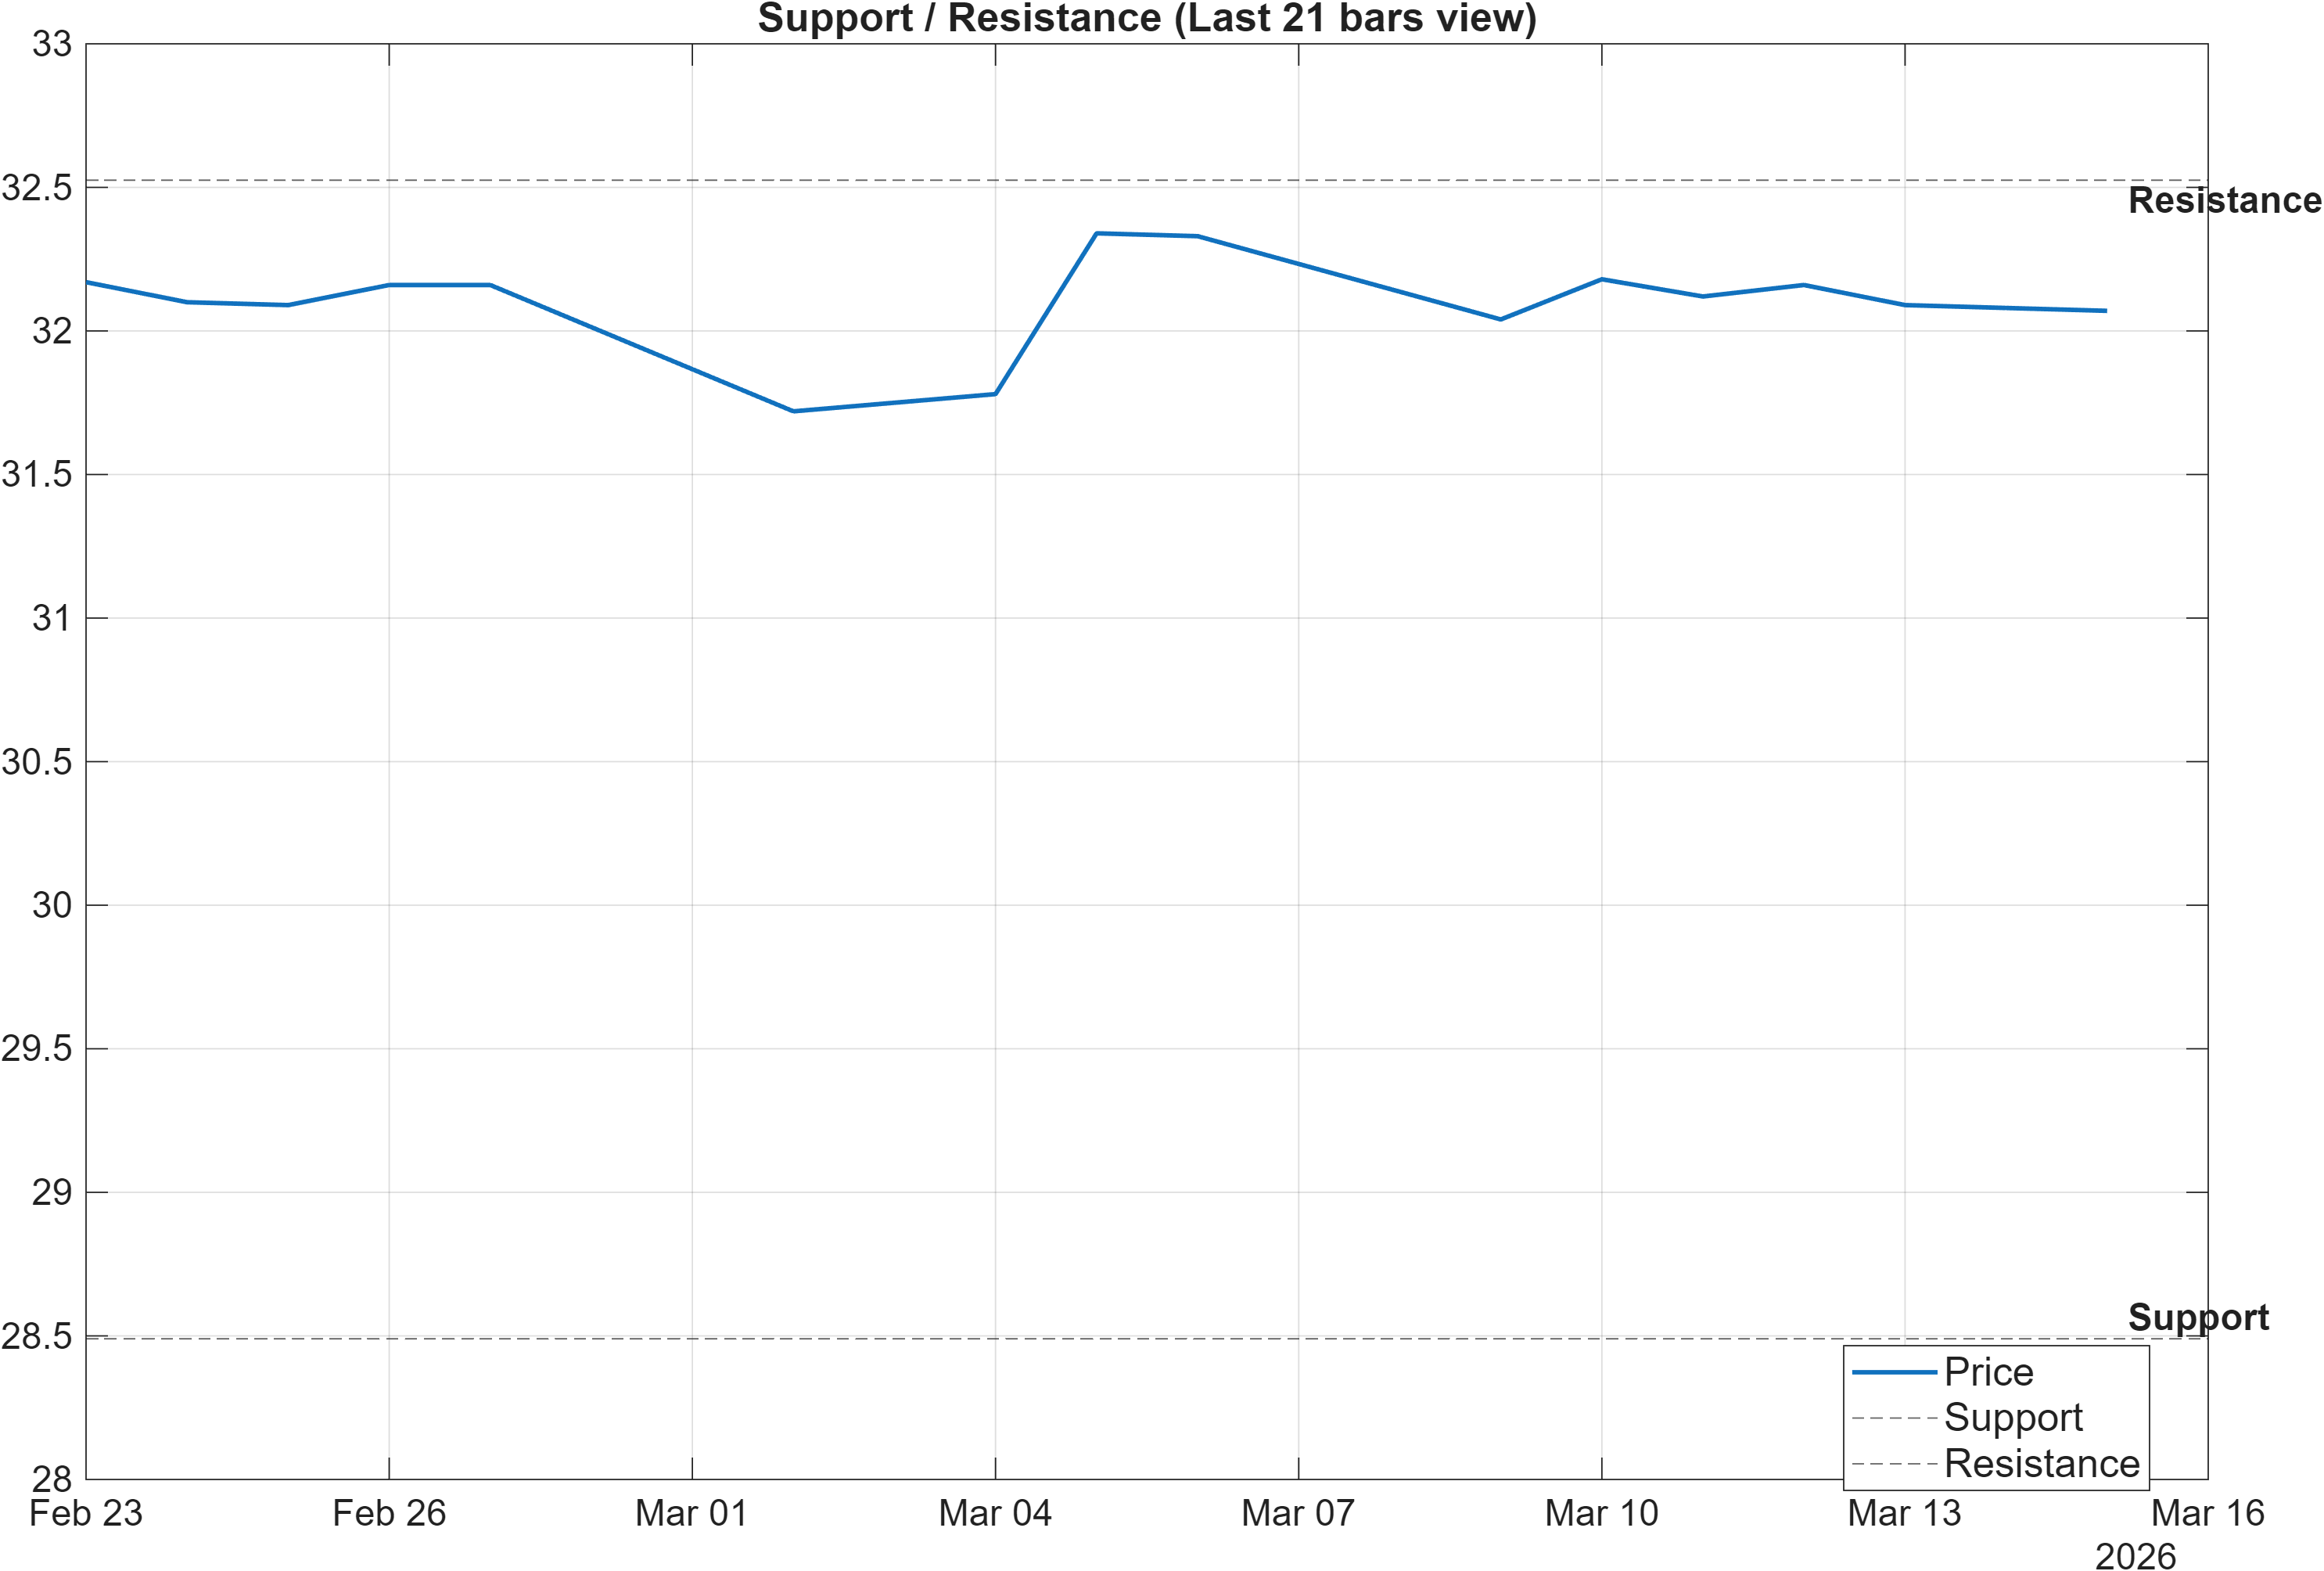
Support and resistance in this report are explicit and narrow: Support ~28.4900 and Resistance ~32.5250. With trend signals bullish versus MA50/MA200, these zones operate less as static “targets” and more as probabilistic decision points for regime confirmation.
Level behavior: continuation vs deterioration
The scenario logic provided is strict: a break above resistance with volume is treated as continuation evidence, while a close below support is deterioration risk. The reason this matters here is the technical stack is not uniformly bullish. The blended technical score is -0.215 (Neutral), so the most reliable confirmation is typically price/volume behavior at structural boundaries rather than incremental improvement in a single oscillator.
How the dashboard supports the zones
Several indicators suggest the market may be sensitive around these levels. “MedPx vs Support” is Bullish at 3.605, implying price is positioned meaningfully above the identified support buffer in the current configuration. Meanwhile, participation measures are mixed: ADOSC is Bullish at 24, yet OBV slope(10) is Bearish (-1.362e+06) and the AD Line slope(10) is also Bearish (-9.26e+05). That divergence can manifest as choppy reactions into resistance (sellers defending), or as sharp continuation if volume expansion aligns with upside.
Compression context
With Bollinger bandwidth at 0.0215, the range between 28.4900 and 32.5250 becomes more than a map—it becomes the likely arbitration area for near-term direction. In compressed regimes, level breaks often matter more than incremental indicator changes.
Scenario view: Break above resistance with volume → continuation. Close below support → signal deterioration risk.
5) Quant Technical Dashboard (18 Signals)
KGNAI AI Technical Analysis Score (Deep Reinforcement Learning): Rank #733 out of 1222 (Rank 1 represents the strongest technical positioning and a higher probability of favorable price behavior. As ranks increase toward the maximum, the probability of favorable outcomes weakens and bearish positioning becomes more dominant.) | Label: Neutral | Score: -0.200
18-Signal Technical Confluence Score: -0.222 (Neutral)
Overall Technical Score (18-signal confluence + DRL rank blend): -0.215 (Neutral)
Note: The blended score reflects signal strength weighted against broader AI technical ranking, which may temporarily diverge.
Blended technical score breakdown: -0.215 (Neutral | Bull 5 / Bear 9 / Neutral 4)
This section is best understood as an internal consistency check: while KGNAI ranks are Bullish across time horizons, the technical layer is Neutral and slightly negative on score (-0.215). The DRL technical rank at #733 sits in the weaker half of the 1222-instrument universe, implying that—on purely technical behavior—SBC’s setup is not currently screening as leadership even if the broader multi-horizon rank model remains constructive.
The signal mix clarifies why. Momentum is not uniformly supportive: MACD histogram is Bearish (-0.08559) and TS Accel is Bearish (-1.77), while RSI(14) is Bullish at 57.28. That’s a classic “positive bias but fading impulse” configuration—consistent with markets that can drift upward but struggle to accelerate without a catalyst or a clear breakout.
Flow and participation indicators tilt more cautious: ChaikinOsc is Bearish (-2.654e+05), OBV slope(10) is Bearish (-1.362e+06), and PVT slope(10) is Bearish (-2481). Against that, there are pockets of constructive evidence—ADOSC is Bullish (24) and Vol ROC(20) is Bullish (147.7)—which can indicate intermittent bursts of activity rather than steady accumulation.
Finally, volatility-related signals are notable: BB Width is Bullish at 0.02154, aligning with the compression view. When compression coincides with mixed flow, the tactical priority often becomes confirmation: does any move beyond 32.5250 occur alongside improving participation measures, or does rejection lead to a faster rotation back toward 28.4900?
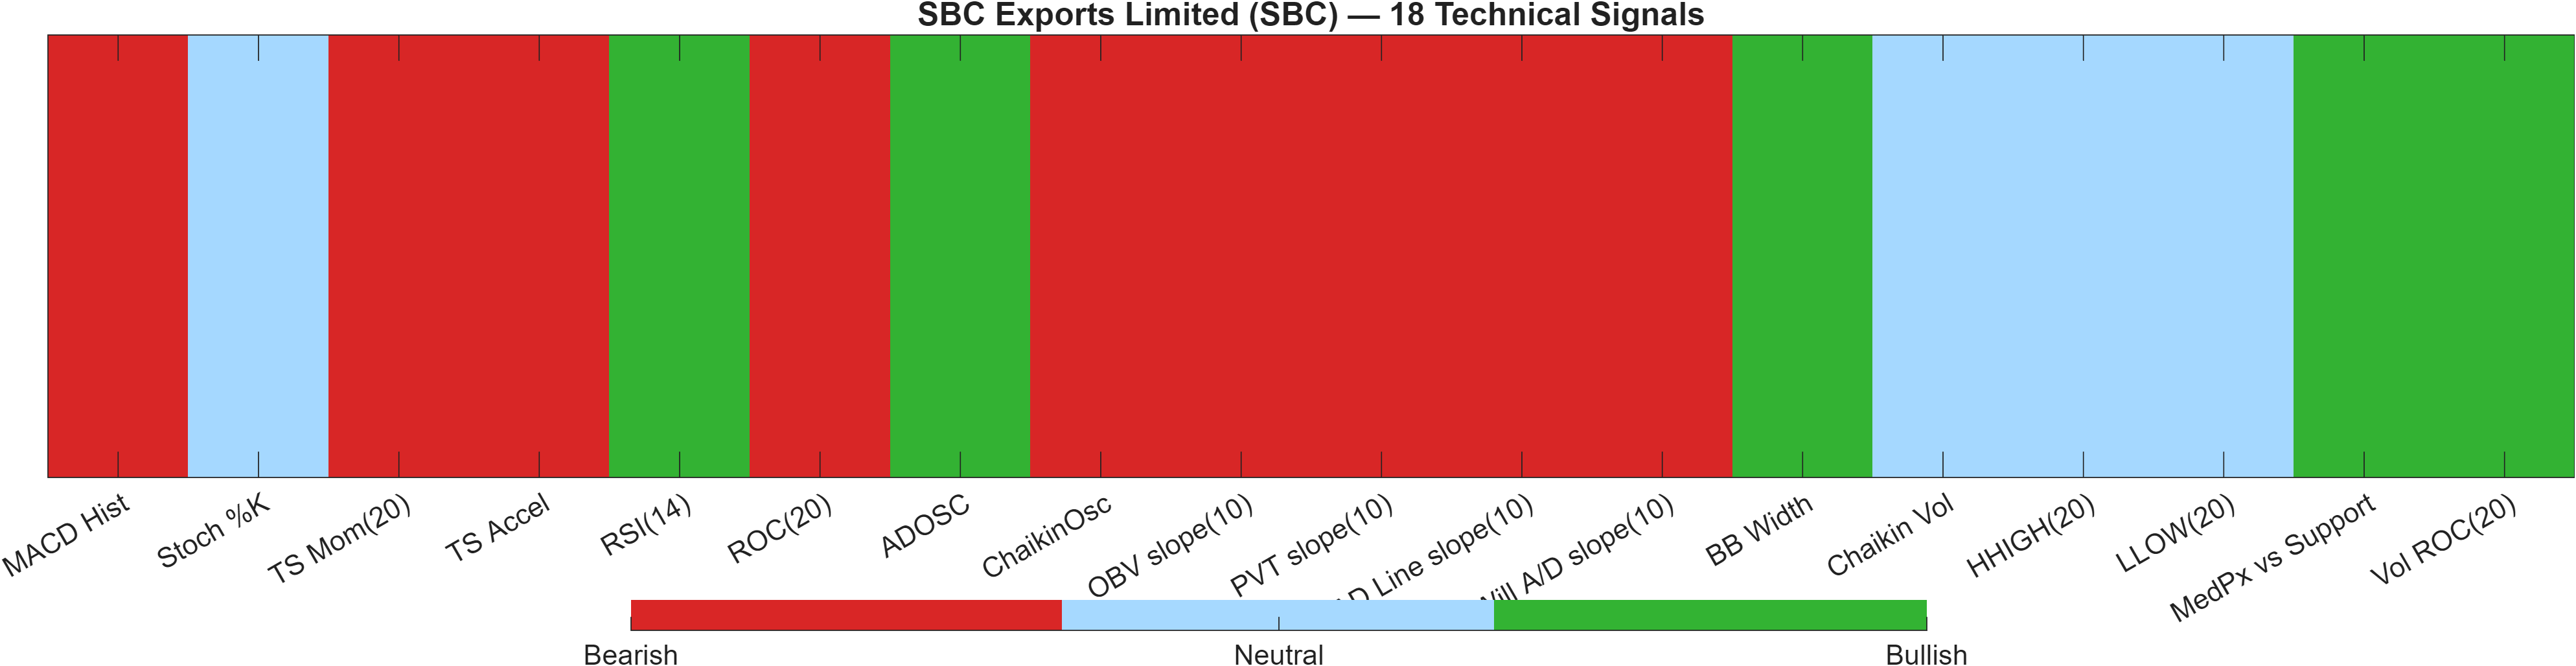
Signal table (Bull/Bear/Neutral)
| Indicator | Value | Signal |
|---|---|---|
| MACD Hist | -0.08559 | Bearish |
| Stoch %K | 42.98 | Neutral |
| TS Mom(20) | -0.01 | Bearish |
| TS Accel | -1.77 | Bearish |
| RSI(14) | 57.28 | Bullish |
| ROC(20) | -0.09346 | Bearish |
| ADOSC | 24 | Bullish |
| ChaikinOsc | -2.654e+05 | Bearish |
| OBV slope(10) | -1.362e+06 | Bearish |
| PVT slope(10) | -2481 | Bearish |
| AD Line slope(10) | -9.26e+05 | Bearish |
| Will A/D slope(10) | -2.18 | Bearish |
| BB Width | 0.02154 | Bullish |
| Chaikin Vol | -42.25 | Neutral |
| HHIGH(20) | 32.9 | Neutral |
| LLOW(20) | 31.06 | Neutral |
| MedPx vs Support | 3.605 | Bullish |
| Vol ROC(20) | 147.7 | Bullish |
Interpretation: Indicator-level signals form the base confluence, which is then adjusted using a separate AI-driven technical ranking model. The final technical score summarizes this combined view.
6) News sentiment + extractive gist
Sentiment score (avg): 0.154 | Positive: 50% | Neutral: 50% | Negative: 0%
KGNAI AI News Sentiment Score (normalized -1 to +1): Not available (as of —) | Label: Not available | Overall news score: 0.15
Positive Developments
Recent coverage across major financial outlets indicates a constructive narrative tilt, reflected in a positive/neutral split (50% / 50%) and no negative items in the provided sample. The positive tone largely clusters around strategic activity and expansion-oriented framing, which can support investor attention even when short-horizon technical signals are mixed. In a setup where the overall technical score is -0.215 (Neutral) and momentum is not fully synchronized (RSI 57.28 vs MACD histogram -0.0856), incremental positive context can matter most when it coincides with level tests—particularly near 32.5250. The key analytical point is not the narrative itself, but whether constructive coverage aligns with observable participation (for example, the Bullish Vol ROC(20) 147.7) during attempts to extend the trend structure that remains Bullish versus MA50/MA200.
Neutral / Mixed Developments
Neutral items in the provided data are primarily informational and timing-related, which tends to be supportive of orderly price discovery but not necessarily directional. In practice, these updates often act as “calendar anchors” that can concentrate attention around a specific window without changing the underlying signal stack. That matters here because the market is also in a tighter volatility regime (bandwidth 0.0215), where price can remain contained until a catalyst or positioning shift forces expansion. With ranks still very strong across longer horizons (yearly #3; 6-month #3), neutral news flow may function as background stability while the chart resolves whether resistance is absorbed or defended.
Negative / Risk Signals
The sentiment breakdown shows 0% negative items, but “risk” can still emerge through uncertainty and execution sensitivity—particularly when technical participation measures are skewed Bearish (for example, OBV slope(10) -1.362e+06 and AD Line slope(10) -9.26e+05). In that context, the main downside risk signal is structural rather than headline-driven: failure to hold 28.4900 would represent a measurable deterioration condition per the scenario framework. A second risk vector is signal divergence: strong cross-sectional ranks alongside a weaker DRL technical rank (#733) can persist, but it increases the probability that price action becomes more range-bound and reactive until momentum and flow re-align.
- Any sustained acceptance above 32.5250 accompanied by stronger participation signals.
- Whether compression (bandwidth 0.0215) resolves with improving MACD/ROC rather than further drift.
- Downside protection: repeated closes holding above 28.4900 versus a break below that level.
Sources referenced: Reuters, Bloomberg, Yahoo Finance, MarketWatch, Investing.com
Snapshot: AI Rank (Short–Mid–Long): Bullish (Bullish–Bullish–Bullish) · Technical Confluence: Neutral · Key Levels: Support ~28.49 | Resistance ~32.52 · News Sentiment: Positive
7) Sources
Source URLs are not included in this publication view.
You may also like: How KGNAI AI ranks instruments across global markets
Disclaimer: KGNAI provides AI-generated analytics and educational market commentary only. This is not financial advice. Markets involve risk. Always do your own research.