
GRSE (Garden Reach Shipbuilders & Engineers Ltd) — Multi-Horizon Ranks vs Bearish Technical Confluence (01-Mar-2026)
Garden Reach Shipbuilders & Engineers Ltd (GRSE) presents a cross-horizon divergence as of 01-Mar-2026. KGNAI’s longer-horizon ranks remain firmly constructive (notably 3-Month #7, 6-Month #17, Yearly #14 out of 1222), while the shorter windows are less decisive (Daily #843, Monthly #767). This split is reinforced by the technical stack: the moving-average structure is flagged bearish (Close vs MA50 = Bearish; MA50 vs MA200 = Bearish), and the blended technical read is also bearish with an Overall Technical Score of -0.553 and a DRL technical rank at #1183/1222. Momentum is not deeply oversold (RSI(14) 50.58) but MACD histogram remains negative (-2.9478), suggesting pressure without capitulation. Key decision zones are defined by support ~2251.5250 and resistance ~2597.1250, while news sentiment appears broadly neutral (avg 0.024 with 81% neutral).
- Short / Mid / Long rank stance: Short-term Neutral (Daily #843); Mid-term Neutral (Monthly #767) despite Weekly Bullish (#166); Long-term Bullish (3-Month #7; Yearly #14).
- Technical confluence: Bearish (18-signal confluence -0.389; overall -0.553; DRL rank #1183/1222).
- Key levels: Support ~2251.5250 | Resistance ~2597.1250.
- News sentiment bias: Neutral (avg 0.024; 12% positive / 81% neutral / 6% negative).
- Confirmation / invalidation condition: A break above 2597.1250 with volume supports continuation; a close below 2251.5250 increases deterioration risk.
KGNAI evaluates assets using large cross-sectional datasets built from millions of structured data points. Inputs incorporate fundamental metrics, technical structures, and systematically processed news sentiment. Statistical models, machine learning, and AI frameworks are used to assess relative positioning, signal alignment, and probabilistic behavior across broad universes.
- Ranks are comparative across the tracked universe, not absolute price targets.
- Confluence reflects alignment among independent signal groups.
- Support/resistance levels are probabilistic decision zones, not guarantees.
- Sentiment provides contextual bias within the broader analytical framework.
1) KGNAI AI Analysis
Region: INDIA | Total universe size: 1222 ranked instruments
- Daily rank: #843 out of 1222 — Neutral
- Weekly rank: #166 out of 1222 — Bullish
- Monthly rank: #767 out of 1222 — Neutral
- 3-Monthly rank: #7 out of 1222 — Bullish
- 6-Monthly rank: #17 out of 1222 — Bullish
- Yearly rank: #14 out of 1222 — Bullish
Cross-horizon positioning: strong long-term, muted short-term
The ranking stack is dominated by a long-horizon tailwind alongside short-horizon hesitation. On the constructive side, GRSE’s 3-Month rank (#7) places it in the top decile of the 1222-instrument universe, with 6-Month (#17) and Yearly (#14) reinforcing persistent relative strength. That persistence matters because it suggests the instrument has recently behaved more favorably than most peers across extended windows.
In contrast, the Daily rank (#843) sits in the lower portion of the universe, and the Monthly rank (#767) is similarly soft. This pattern is typical of a market transitioning from momentum-led advance to a phase where nearer-term flows are less supportive—without necessarily invalidating the longer-run profile. The Weekly rank (#166) adds nuance: it remains in a stronger relative band than daily/monthly, implying near-term weakness may be episodic rather than structural.
KGNAI’s term view reflects this split: Short-term Neutral, Mid-term Neutral, and Long-term Bullish. The key analytical implication is regime tension: longer-horizon behavior signals resilience, while shorter-horizon ranks warn that timing risk is elevated and that confirmation from price/technical structure becomes more important than rank alone.
Want the full universe and complete rank tables? Unlock full access on KGNAI: https://www.kgnai.com/pricing
2) Price & trend overview
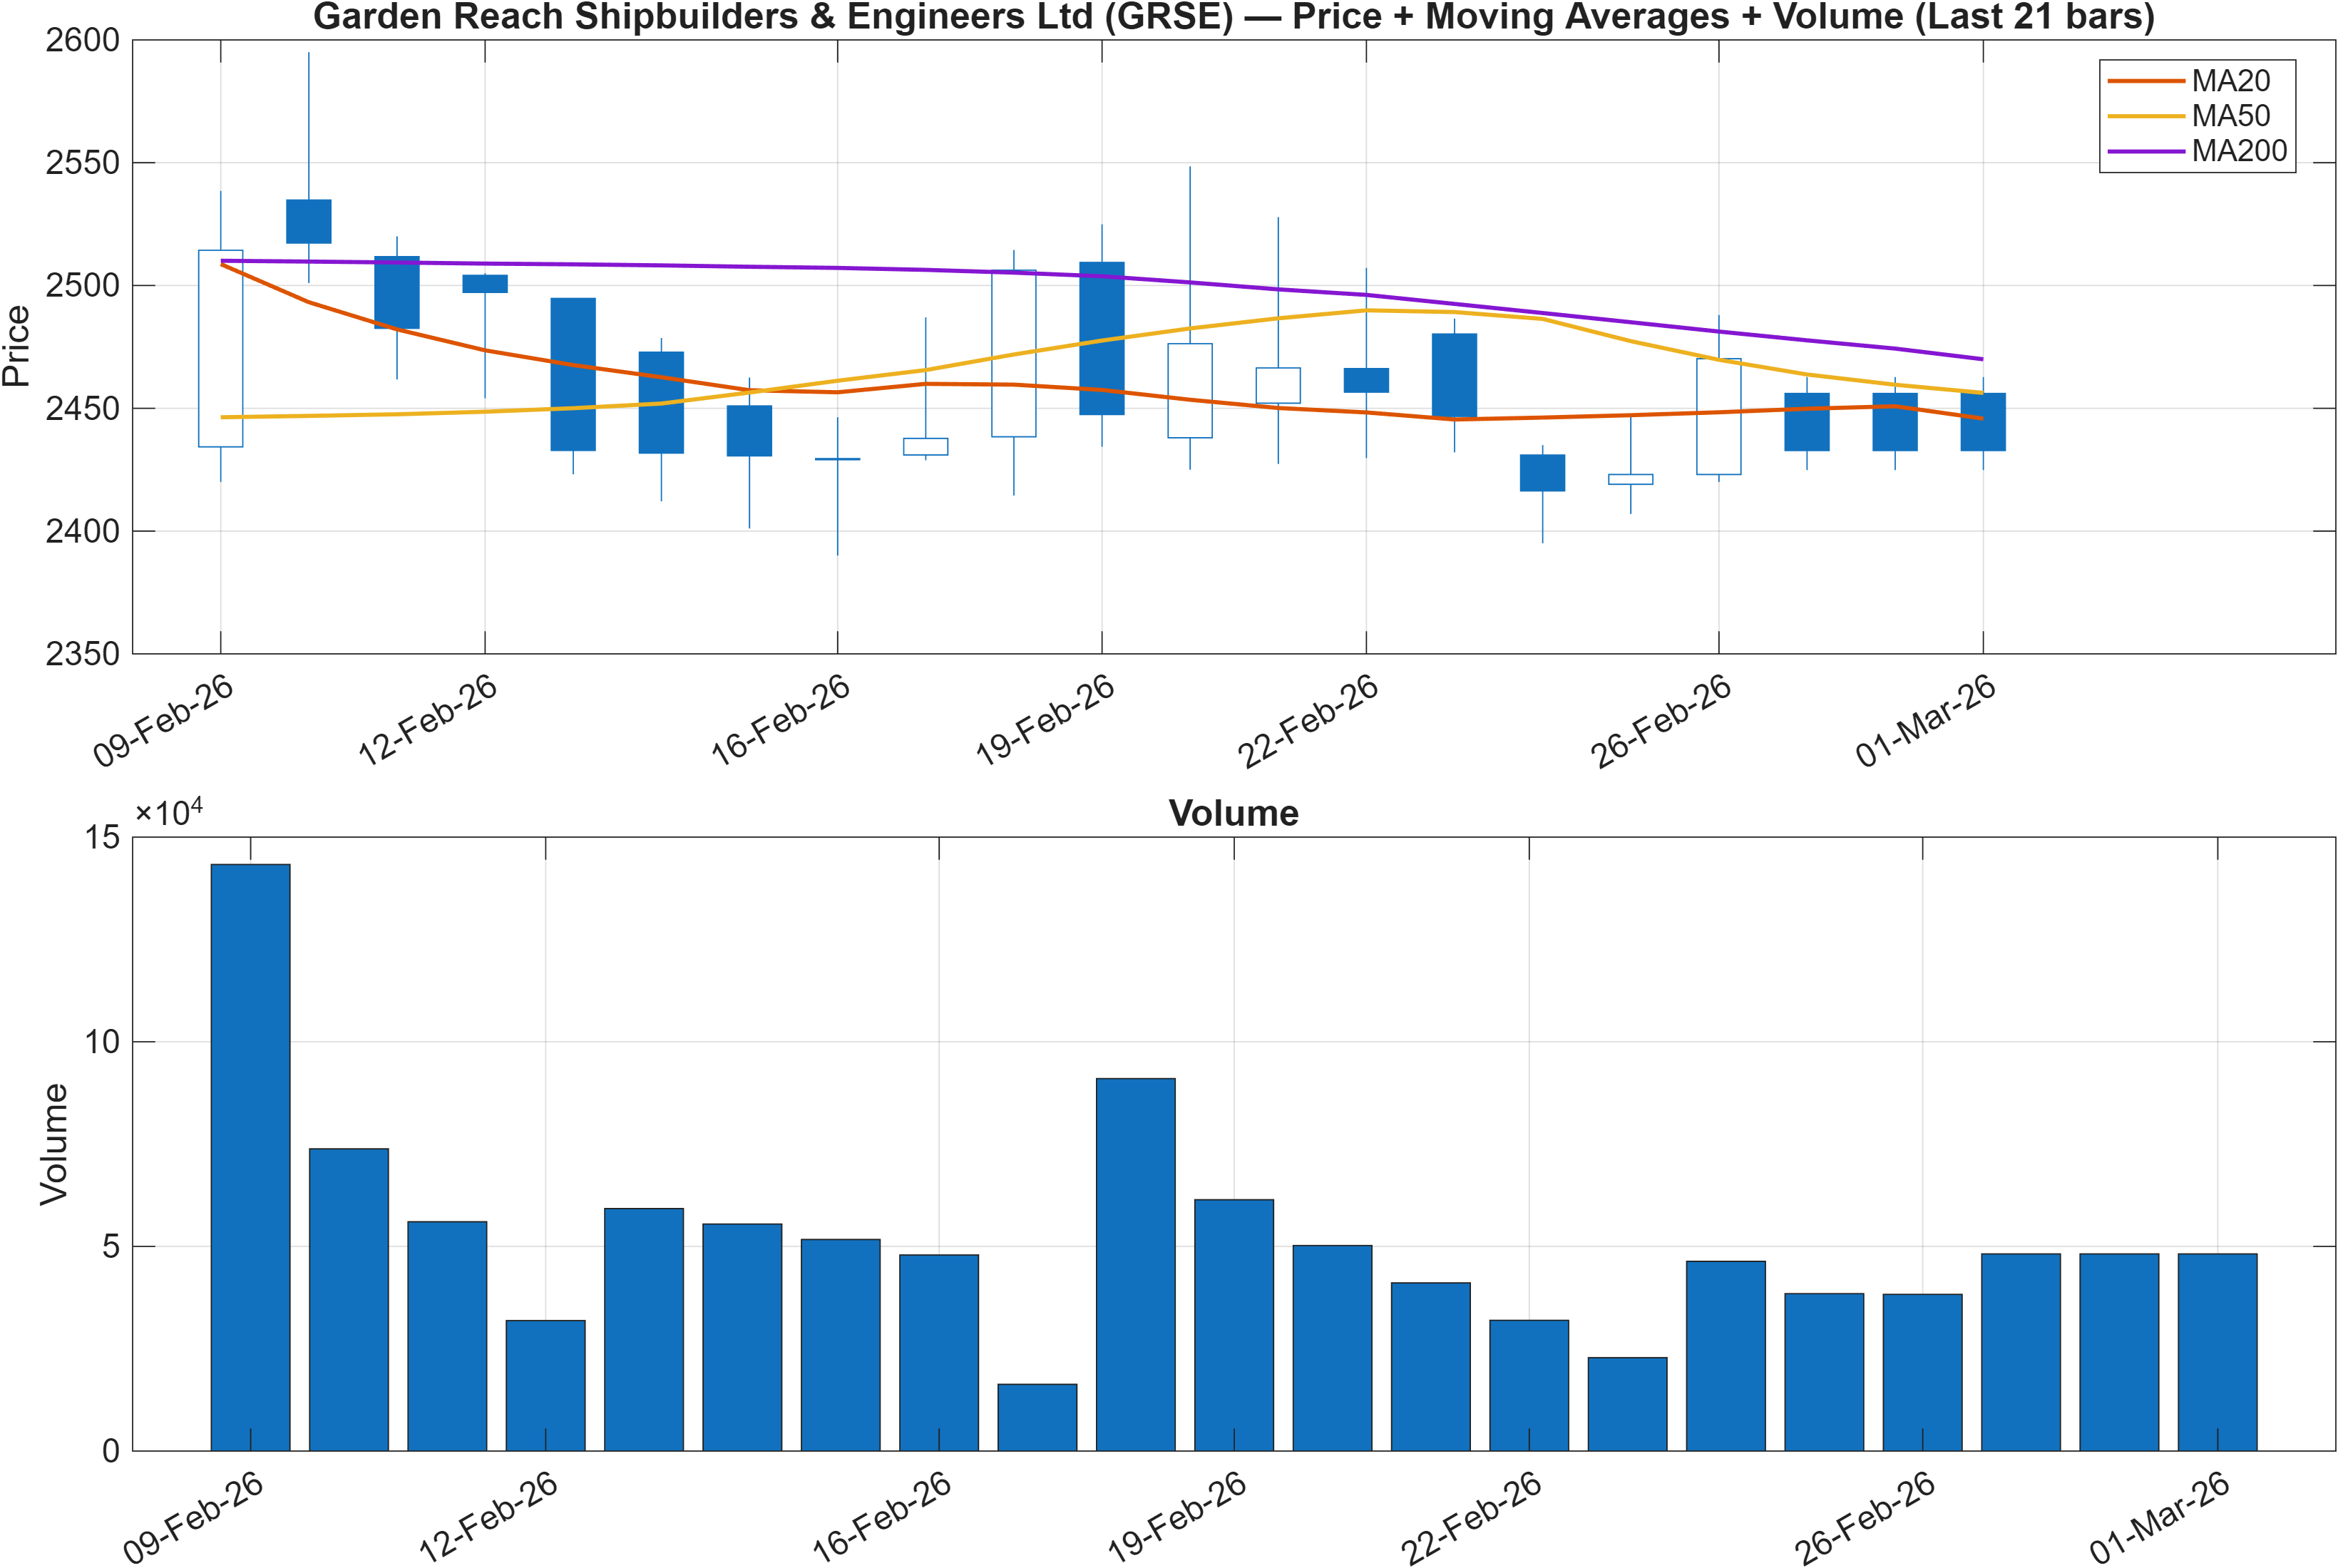
Interpretation: Close vs MA50 = Bearish, MA50 vs MA200 = Bearish.
Trend structure: bearish moving-average stack vs bullish long-horizon rank
The trend read is currently defined by a bearish moving-average configuration: price is below the MA50 (Close vs MA50 = Bearish) and the MA50 is below the MA200 (MA50 vs MA200 = Bearish). In practical market-structure terms, this is a trend filter that often coincides with either (a) a mature pullback inside a longer up-cycle or (b) an early-stage deterioration where dips begin to persist.
The tension is that KGNAI’s longer-horizon ranks remain strong (3-Month #7, Yearly #14), so the moving-average bearishness is best treated as a timing headwind rather than a standalone long-term verdict. This is especially relevant because the rank system is cross-sectional, while moving averages are purely time-series; divergence between them frequently appears around turning points or consolidation phases.
The nearby range context is consistent with this framing. The 20-day extreme references embedded in the signal set (HHIGH(20) 2595 and LLOW(20) 2390) indicate that the market has identifiable recent boundaries. When an MA stack is bearish but range boundaries remain visible, the more informative question becomes whether price can reclaim trend filters (MA50) while respecting the lower band. Until then, trend persistence favors caution on aggressive upside assumptions, even if longer-run relative strength remains a supportive backdrop.
3) Momentum & volatility dashboard
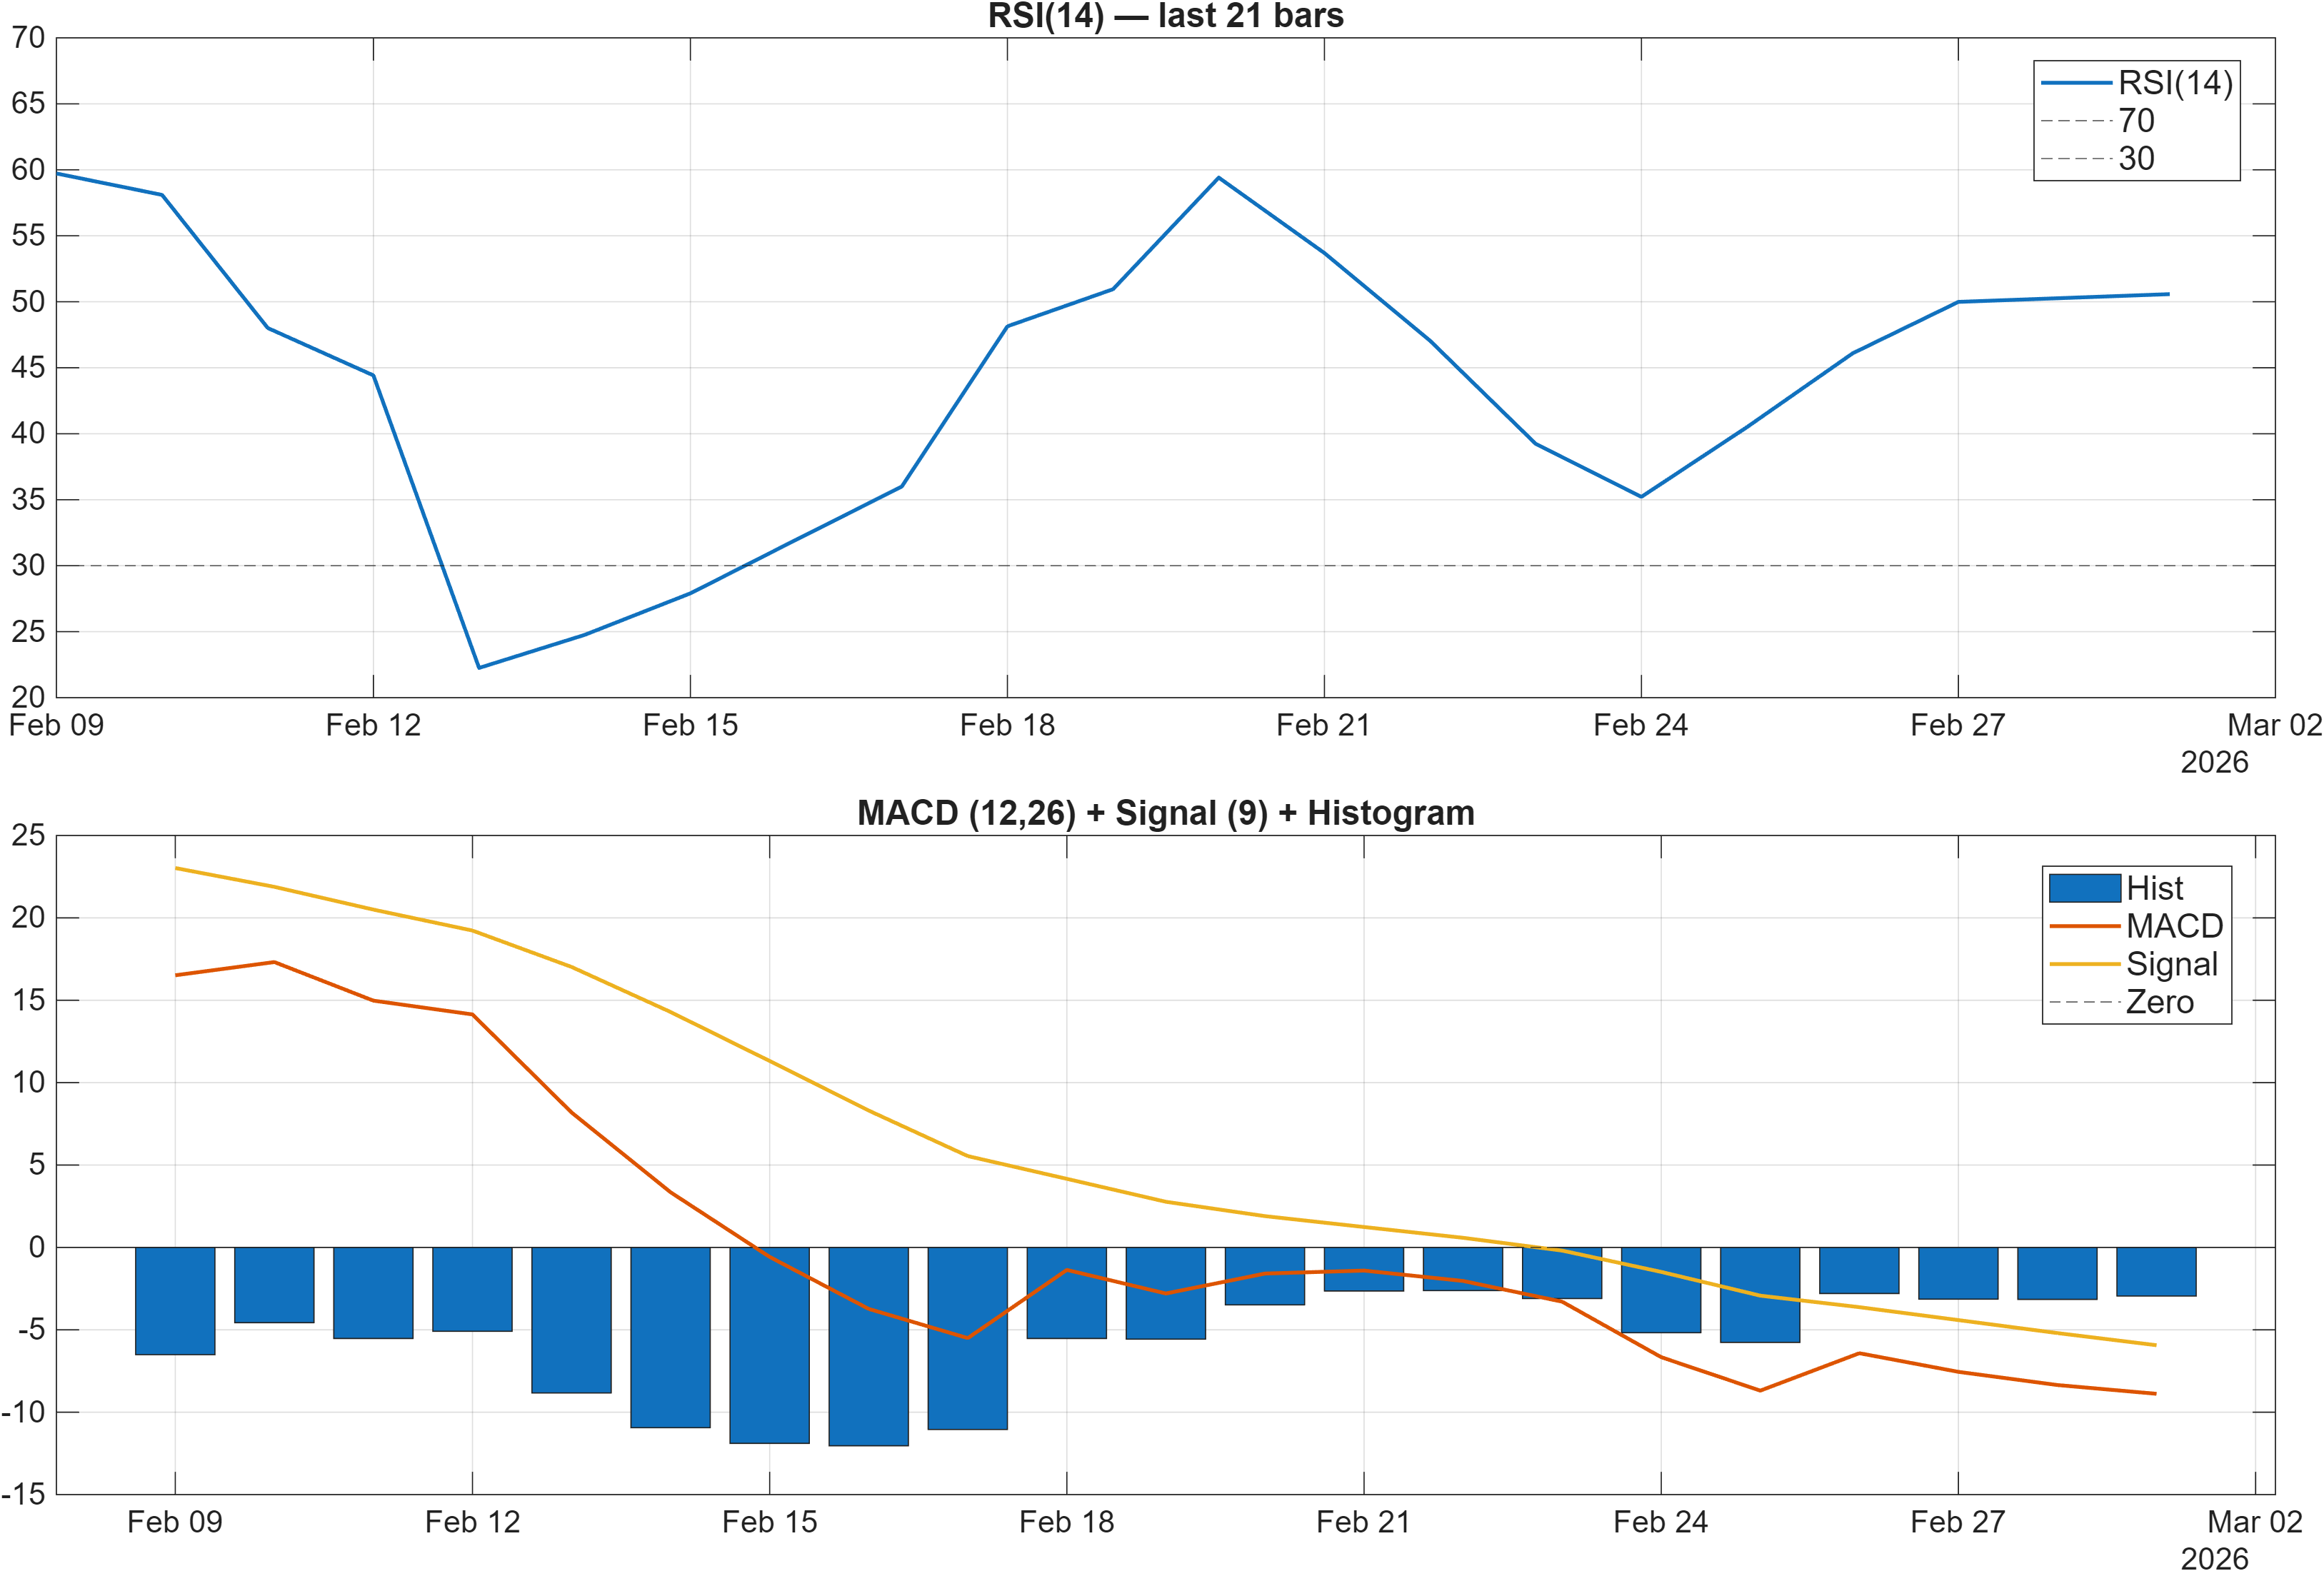
Interpretation: RSI bias = Neutral, MACD hist = -2.9478.
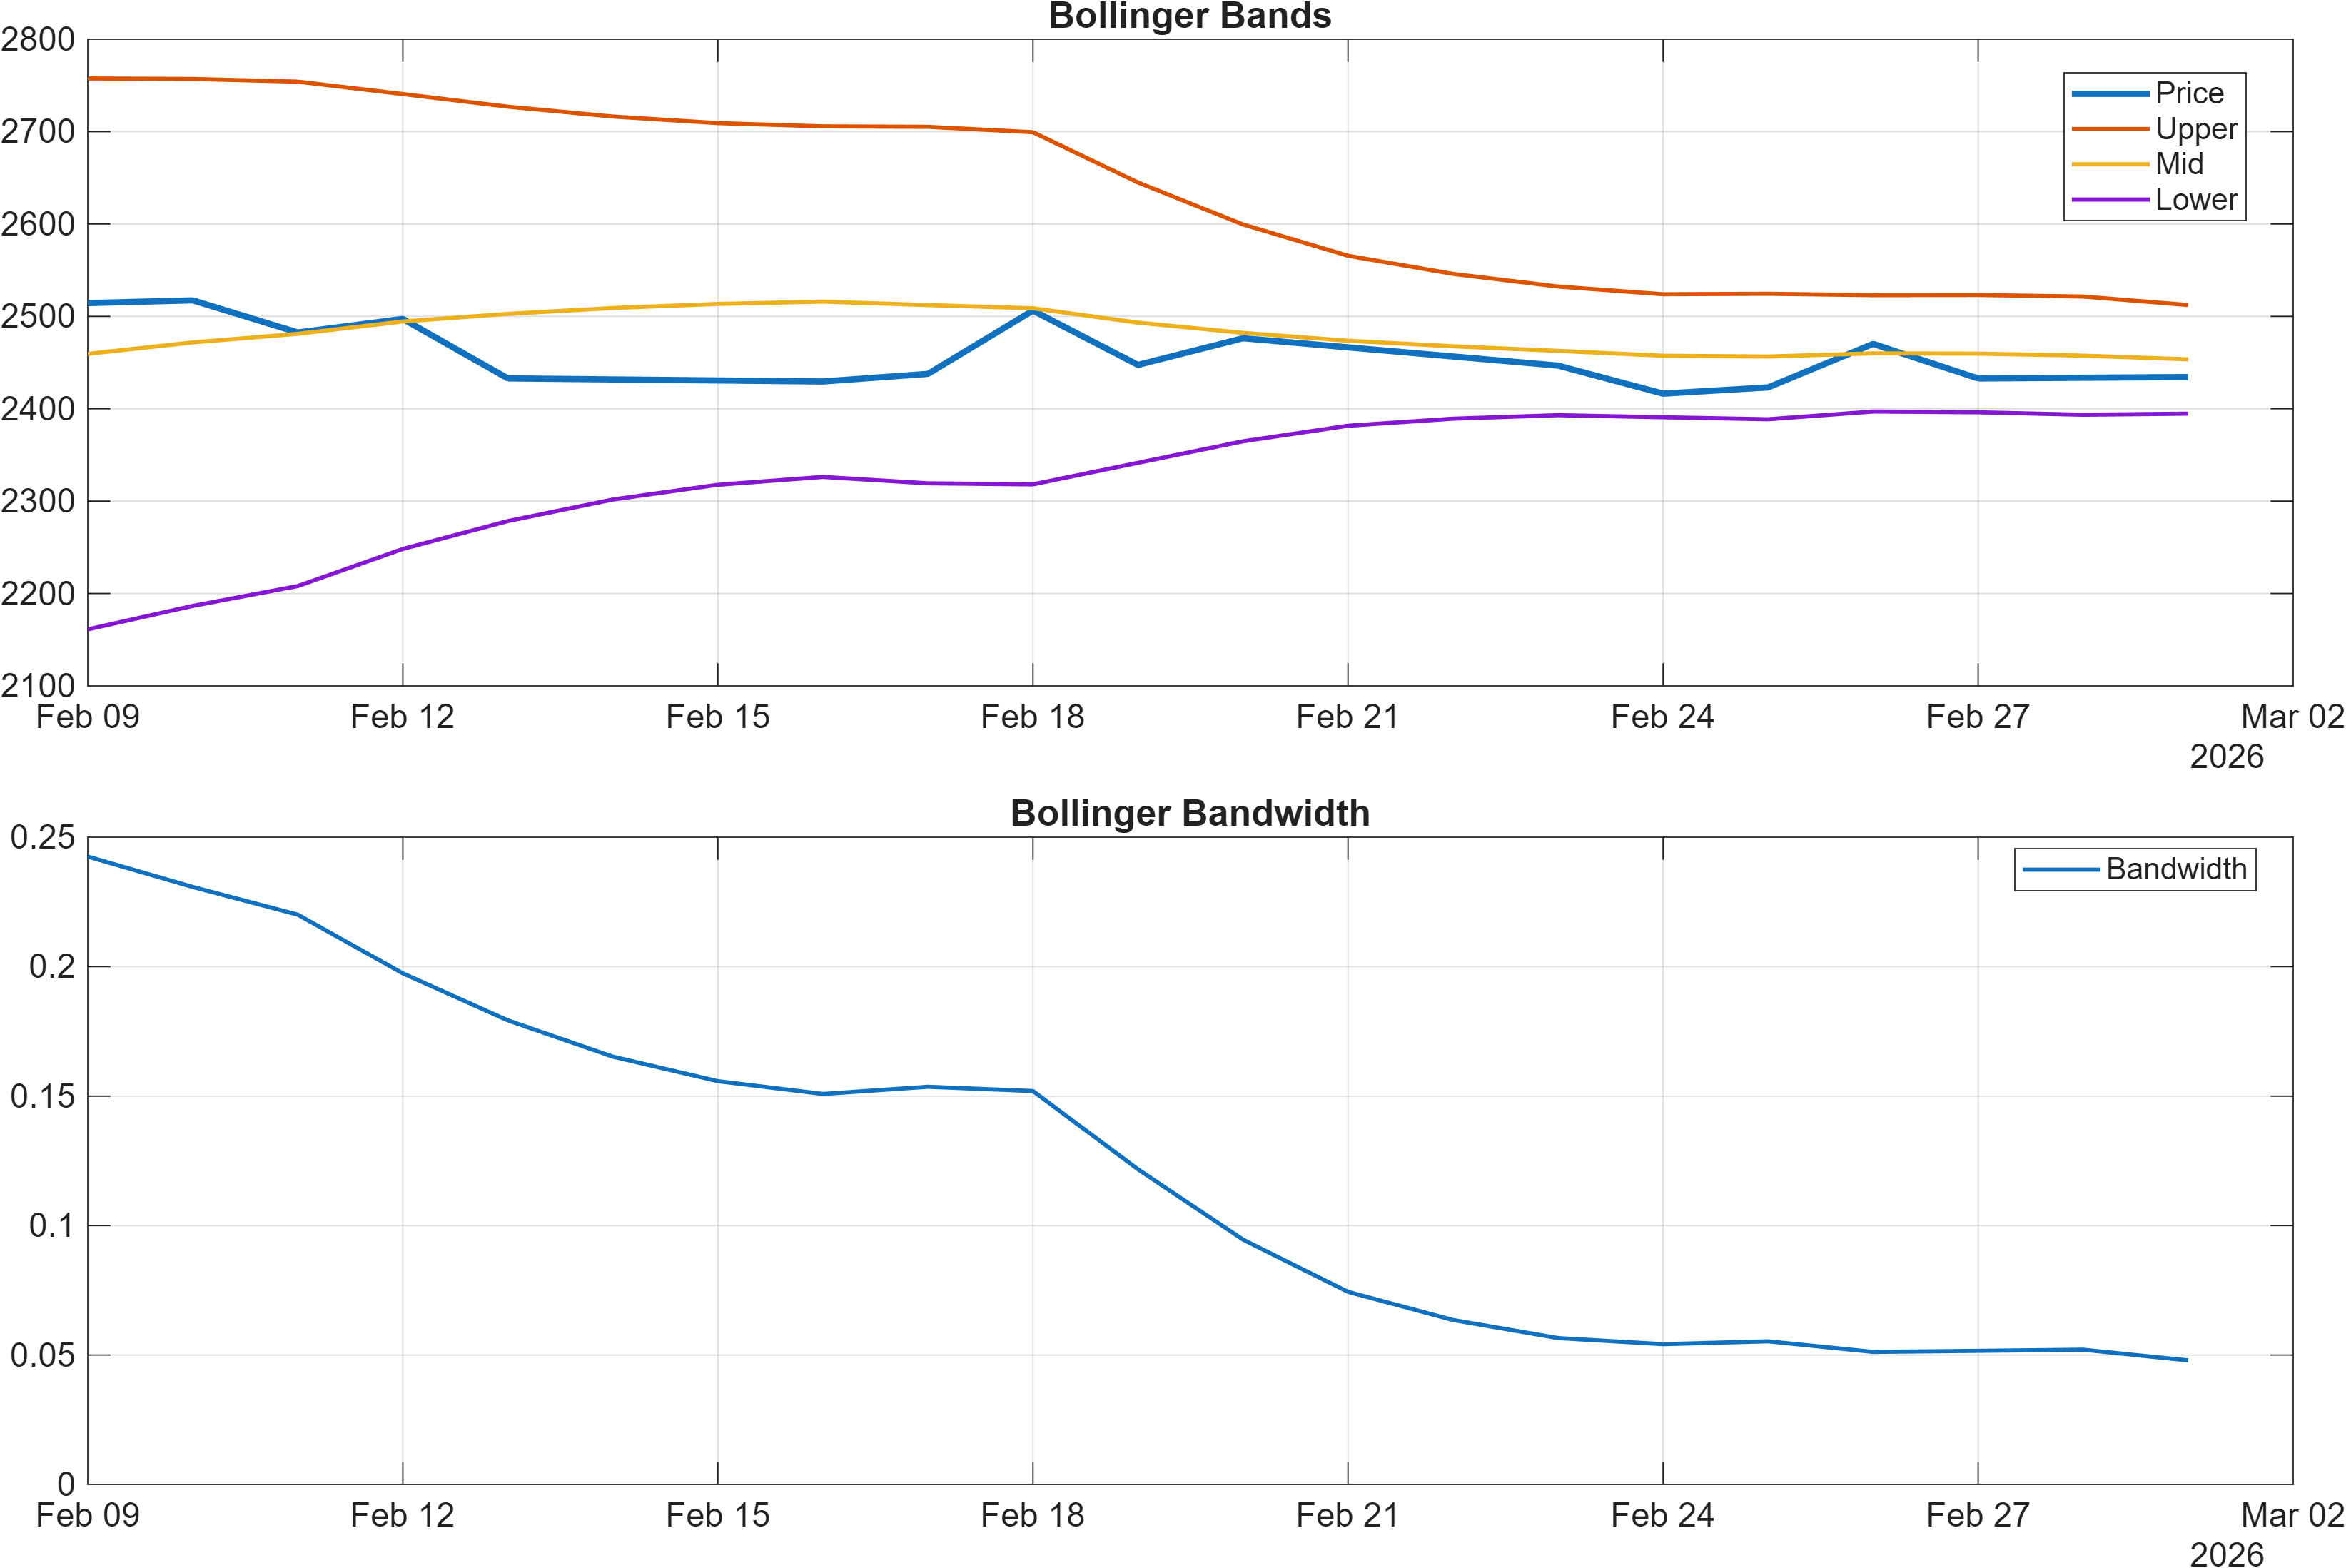
Interpretation: Bandwidth (volatility regime) latest = 0.0479.
Momentum: pressure without capitulation
Momentum signals point to ongoing downside pressure but not a classic oversold washout. RSI(14) at 50.58 is neutral and consistent with a market that is not stretched in either direction, while MACD histogram at -2.9478 keeps the intermediate momentum impulse negative. This combination often appears when rebounds struggle to persist because the underlying trend impulse remains soft, even though oscillator readings are not extreme.
Volatility regime: relatively contained, with scope for expansion
Volatility conditions look relatively contained with Bollinger Bandwidth at 0.0479 (BB Width 0.04792 in the signal table). A compressed bandwidth regime can precede directional expansion; however, the direction is typically resolved by accompanying trend/momentum confirmation. In GRSE’s case, the negative MACD histogram and bearish MA stack suggest that volatility expansion—if it arrives—has a non-trivial probability of initially expressing to the downside unless price reclaims trend structure.
Confirmations to watch within the indicator set
Within the broader signal mix, the rate-of-change measure ROC(20) at -3.297 aligns with the negative impulse, while Stoch %K at 24.6 sits near the lower band but is classified neutral—consistent with stabilization attempts rather than a definitive reversal. Taken together, the dashboard reads as momentum stabilization under bearish trend filters, a configuration that frequently demands patience: a sustainable shift typically shows up as improving MACD dynamics alongside price reclaiming key levels, rather than via oscillator drift alone.
4) Support / Resistance zones
Support ~ 2251.5250 | Resistance ~ 2597.1250
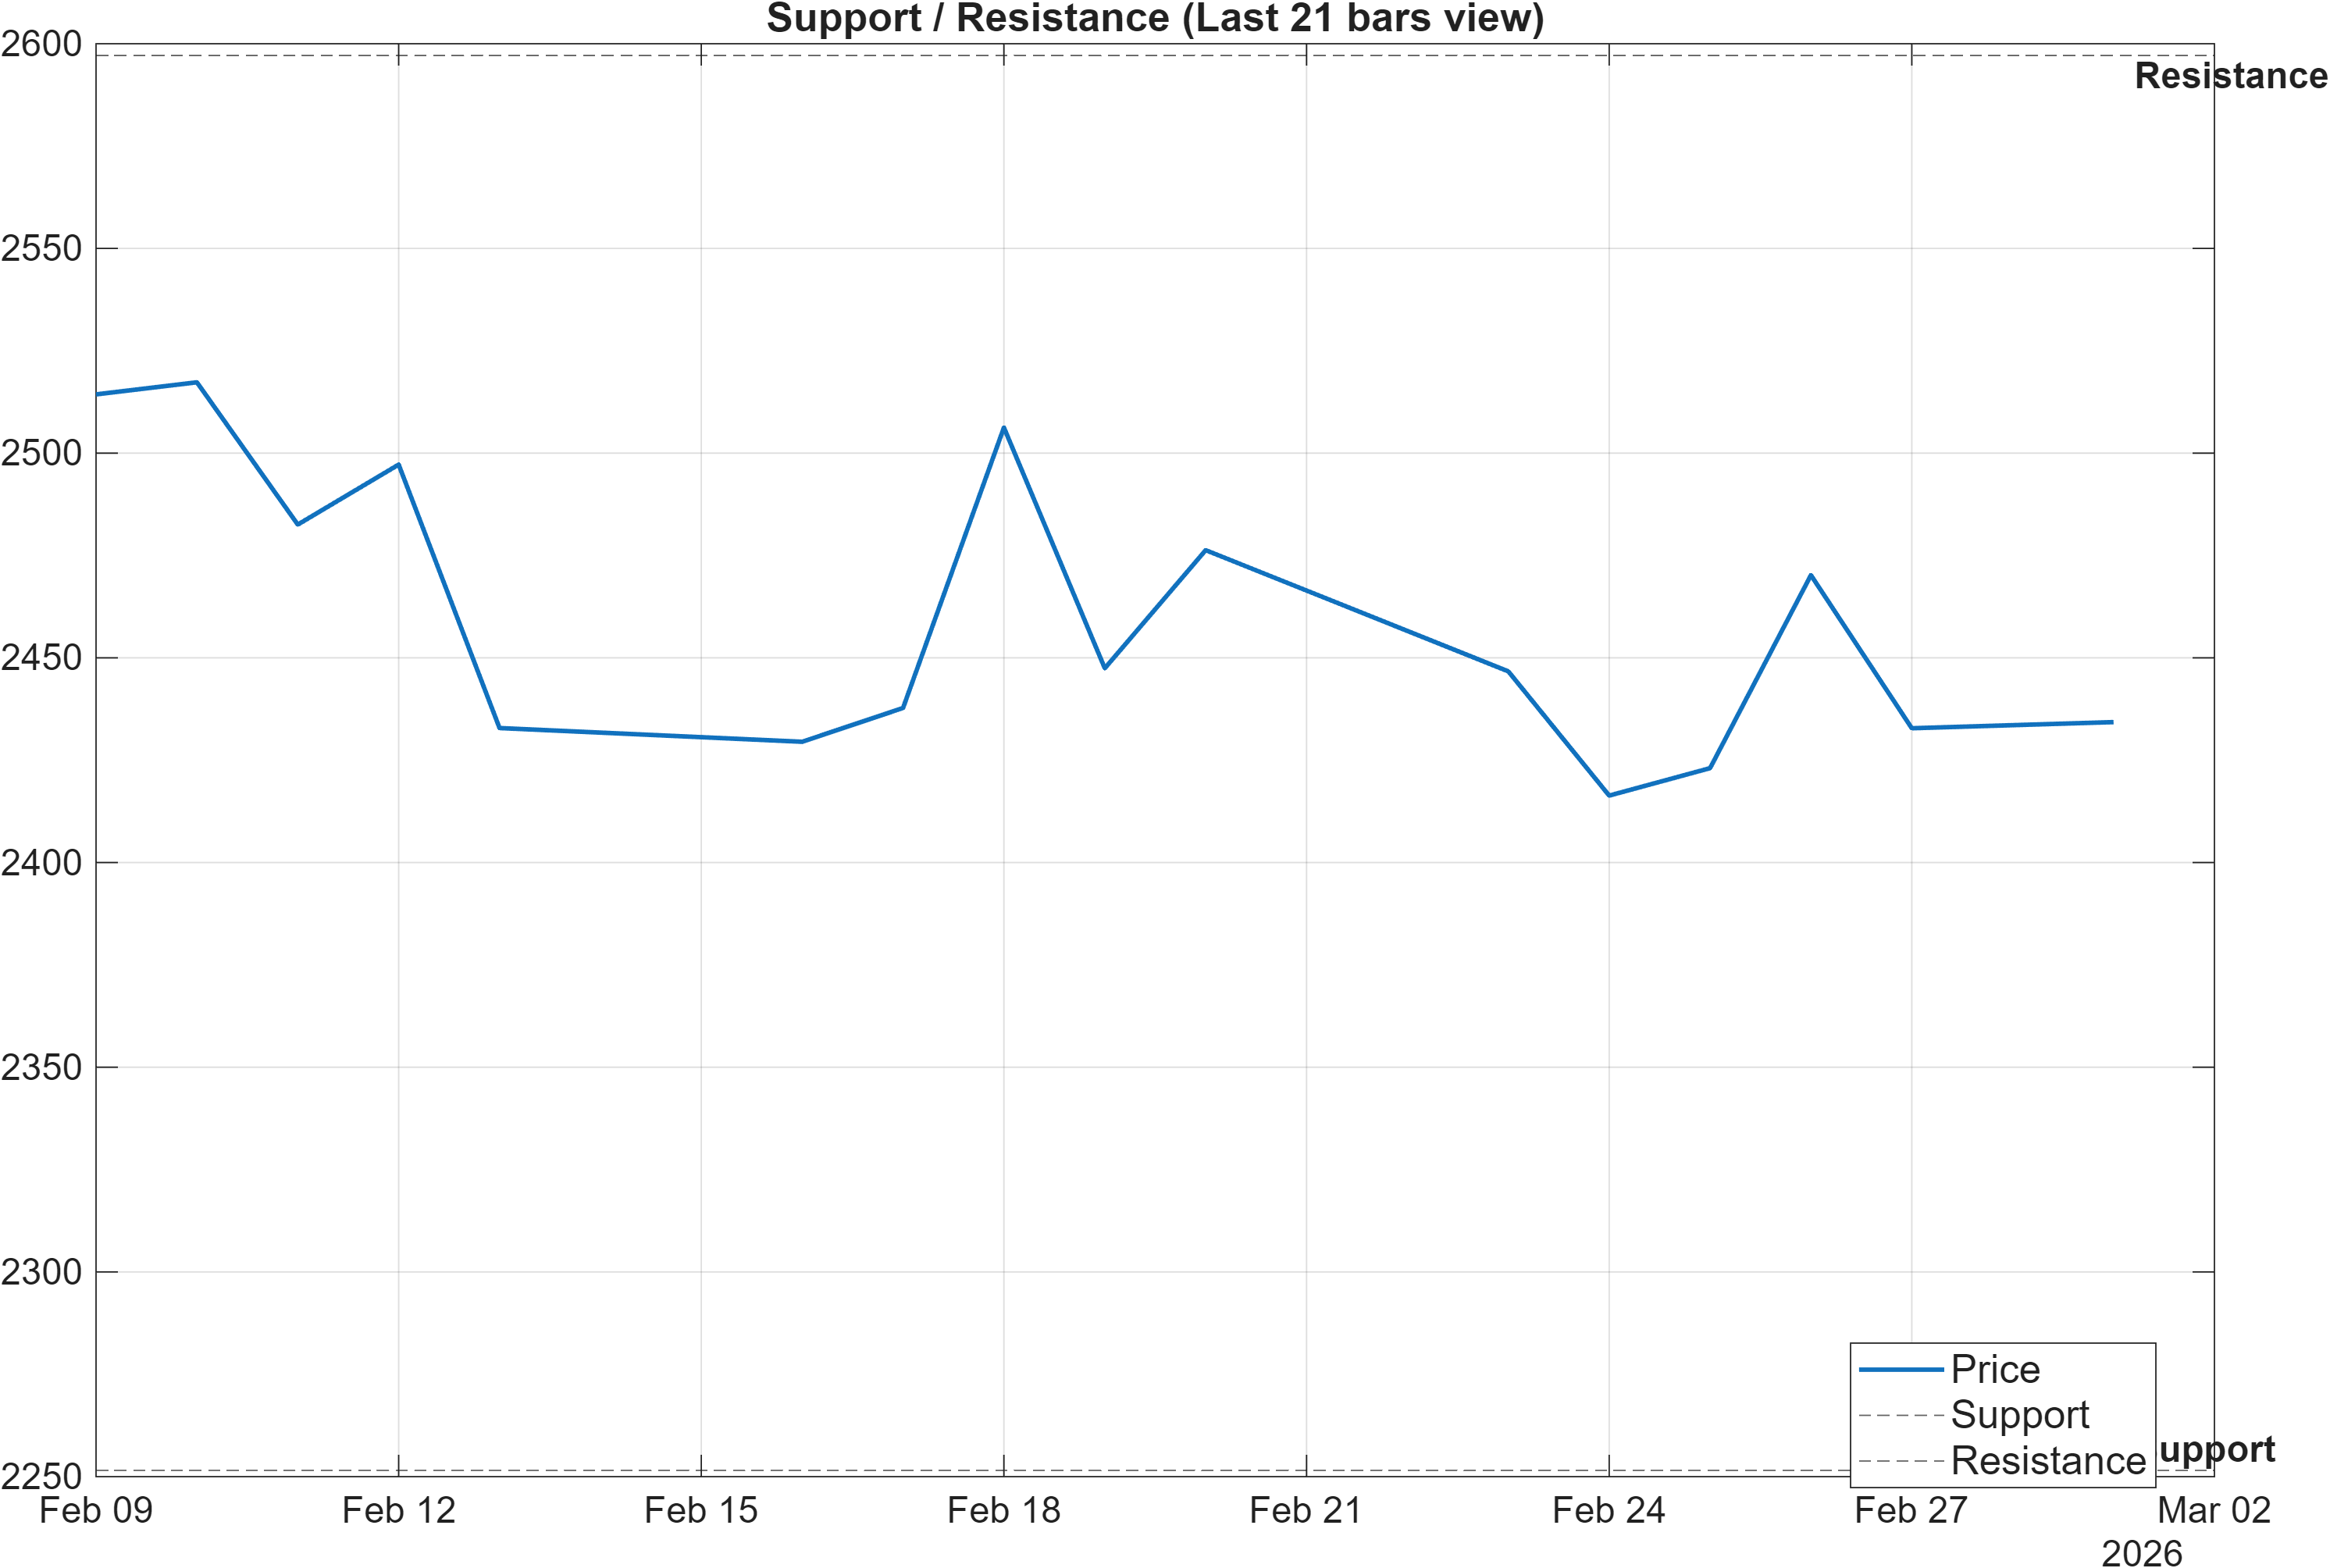
Scenario view: Break above resistance with volume → continuation. Close below support → signal deterioration risk.
Decision zones: probabilistic levels with asymmetric information value
The analysis framework concentrates risk into two probabilistic decision zones: support ~2251.5250 and resistance ~2597.1250. With the moving-average structure bearish, the support level carries heightened informational value: a close below this zone would align trend filters, momentum pressure, and level failure into a more unified bearish regime. Conversely, holding this area can preserve the longer-horizon constructive rank narrative despite short-run weakness.
Resistance at 2597.1250 sits close to the recent 20-day high reference (HHIGH(20) 2595), which implies that the overhead level is not arbitrary—it maps to a recent supply boundary. A break above resistance with volume would therefore represent more than a marginal bounce; it would indicate a reclaiming of a prior range ceiling, which can be the earliest observable step toward re-building trend structure.
The lower bound context is also supported by the 20-day low reference (LLOW(20) 2390), which sits above the stated support zone. That gap matters: it suggests the market has room to move before the more critical support is tested, meaning interim weakness may still be “within range” even if uncomfortable. In a bearish MA regime, rallies that fail below resistance often become opportunities for sellers to reassert control; therefore, level interaction—rather than single prints—should guide interpretation.
5) Quant Technical Dashboard (18 Signals)
KGNAI AI Technical Analysis Score (Deep Reinforcement Learning): Rank #1183 out of 1222 (Rank 1 represents the strongest technical positioning and a higher probability of favorable price behavior. As ranks increase toward the maximum, the probability of favorable outcomes weakens and bearish positioning becomes more dominant.) | Label: Bearish | Score: -0.936
18-Signal Technical Confluence Score: -0.389 (Bearish)
Overall Technical Score (18-signal confluence + DRL rank blend): -0.553 (Bearish)
Note: The blended score reflects signal strength weighted against broader AI technical ranking, which may temporarily diverge.
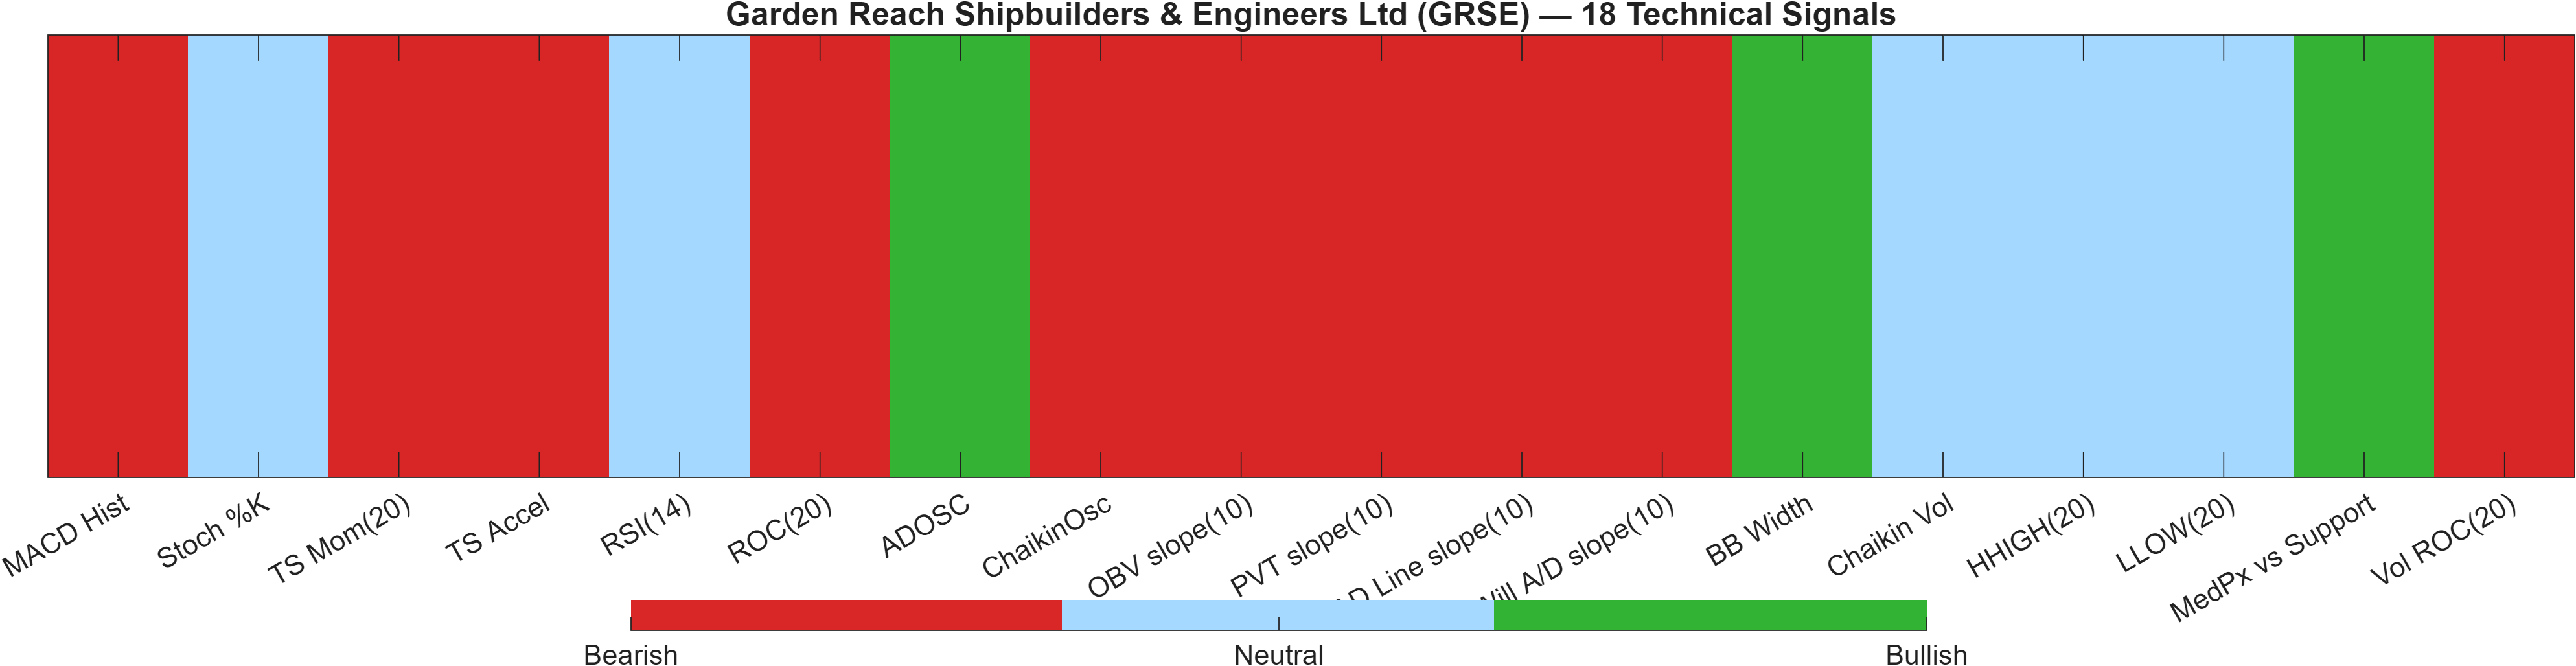
Blended technical score breakdown: -0.553 (Bearish | Bull 3 / Bear 10 / Neutral 5)
Confluence vs model rank: bearish alignment with limited bullish pockets
The technical layer is decisively bearish in aggregate. The 18-signal confluence score is -0.389 and the blended overall technical score is -0.553, while the DRL technical model places GRSE at #1183 out of 1222 with a score of -0.936. Importantly, these measures are derived from separate processes (indicator confluence vs AI rank model), and here they agree directionally, reducing the likelihood that the bearish read is a single-indicator artifact.
The internal composition (Bull 3 / Bear 10 / Neutral 5) clarifies the market structure: bearish breadth dominates, but it is not total. Examples of bullish pockets include ADOSC 19.33 (bullish) and BB Width 0.04792 (bullish), which can appear when volatility conditions are subdued and accumulation proxies attempt to stabilize. However, the bearish cohort contains multiple momentum/flow measures that tend to matter during corrective phases, including MACD histogram (-2.948, bearish) and Vol ROC(20) (-34.76, bearish).
The key analytical takeaway is signal compression around neutral oscillators but bearish breadth in trend/flow. RSI(14) at 50.58 is neutral and Stoch %K at 24.6 is neutral, suggesting the market is not in an extreme condition that would mechanically force mean reversion. Instead, the burden of proof typically shifts to price reclaiming structure and improving momentum impulse (MACD dynamics) before the bearish technical regime can be considered meaningfully relaxed.
Signal table (Bull/Bear/Neutral)
| Indicator | Value | Signal |
|---|---|---|
| MACD Hist | -2.948 | Bearish |
| Stoch %K | 24.6 | Neutral |
| TS Mom(20) | -84.5 | Bearish |
| TS Accel | -298.9 | Bearish |
| RSI(14) | 50.58 | Neutral |
| ROC(20) | -3.297 | Bearish |
| ADOSC | 19.33 | Bullish |
| ChaikinOsc | -3.238e+04 | Bearish |
| OBV slope(10) | -6.34e+04 | Bearish |
| PVT slope(10) | -243.9 | Bearish |
| AD Line slope(10) | -1.089e+05 | Bearish |
| Will A/D slope(10) | -102.1 | Bearish |
| BB Width | 0.04792 | Bullish |
| Chaikin Vol | -37.95 | Neutral |
| HHIGH(20) | 2595 | Neutral |
| LLOW(20) | 2390 | Neutral |
| MedPx vs Support | 192.3 | Bullish |
| Vol ROC(20) | -34.76 | Bearish |
Interpretation: Indicator-level signals form the base confluence, which is then adjusted using a separate AI-driven technical ranking model. The final technical score summarizes this combined view.
6) News sentiment + extractive gist
Note: Instrument-specific news matches were not found, so the digest includes broader market/sector headlines. Links are provided for verification.
Sentiment score (avg): 0.024 | Positive: 12% | Neutral: 81% | Negative: 6%
KGNAI AI News Sentiment Score (normalized -1 to +1): Not available (as of —) | Label: Not available | Overall news score: 0.02
Positive Developments
Recent coverage across major financial outlets indicates a broadly constructive tone around capital flows and risk appetite in India, with attention on foreign investor participation and selective equity strength in parts of the market. In sentiment terms, this aligns with the dataset’s skew toward neutrality but with a non-trivial positive slice (12%) and a slightly positive average score (0.024). For GRSE, which shows a strong long-horizon rank profile (including 3-Month #7 and Yearly #14), a constructive macro/flow backdrop can help explain why longer windows remain favorable even while nearer-term technicals have softened. Importantly, the positive context does not override the current bearish technical confluence (-0.553)—instead it frames the idea that weakness may be occurring within a market that still contains pockets of relative strength and sector rotation, rather than within a uniformly risk-off environment.
Neutral / Mixed Developments
The dominant news signal is neutral (81% of items), consistent with a market that is absorbing cross-currents rather than trending cleanly. Coverage highlights a mix of supportive buying interest alongside caution tied to event risk and evolving positioning. This “wait-and-see” stance fits GRSE’s short-term Neutral read (e.g., Daily #843 and RSI(14) 50.58) where price is not presenting extreme conditions but also not confirming upside trend resumption. For tactical investors, a neutral tape tends to elevate the importance of level-based triggers: the market may require clearer confirmation at 2597.1250 resistance or a meaningful defense of 2251.5250 support before sentiment and price action become mutually reinforcing.
Negative / Risk Signals
Risk signals in the coverage cluster around uncertainty shocks and volatility catalysts, which is directionally consistent with the technical dashboard’s bearish breadth (Bear 10 vs Bull 3) and negative impulse markers such as MACD histogram (-2.9478) and Vol ROC(20) (-34.76). Even though the explicit negative share is limited (6%), the market impact of risk narratives can be nonlinear—particularly when trend filters are already bearish (Close vs MA50 = Bearish; MA50 vs MA200 = Bearish). Against a relatively contained volatility regime (Bandwidth 0.0479), adverse catalysts can coincide with volatility expansion from a compressed base. In that setting, the support zone near 2251.5250 becomes the primary risk reference for whether the bearish technical regime intensifies.
- What to monitor next: Reaction quality at 2597.1250—break/acceptance vs rejection.
- What to monitor next: Any sustained closes approaching or below 2251.5250.
- What to monitor next: Whether MACD histogram (-2.9478) improves alongside RSI holding above neutral (50.58).
Sources referenced: Reuters, Bloomberg, Yahoo Finance, MarketWatch, Investing.com
Snapshot: AI Rank (Short–Mid–Long): Mixed (Neutral–Neutral–Bullish) · Technical Confluence: Bearish · Key Levels: Support ~2251.53 | Resistance ~2597.12 · News Sentiment: Neutral
7) Sources
Not available in the provided data.
You may also like: How KGNAI AI ranks instruments across global markets
Disclaimer: KGNAI provides AI-generated analytics and educational market commentary only. This is not financial advice. Markets involve risk. Always do your own research.