
RELIGARE (Religare Enterprises Ltd.) — Rank-Weak Technical Posture as of 04-Mar-2026 (Bearish tilt)
Religare Enterprises Ltd. (RELIGARE) screens as a rank-weak, technically pressured setup in the India universe, with KGNAI’s cross-sectional positioning skewing toward the lower tier on short and intermediate horizons. Daily rank sits at #990 out of 1223, and monthly rank deteriorates further to #1115, while longer-dated ranks remain comparatively less negative (yearly #930)—a profile that often reflects persistent trend damage rather than a clean reversal base. Classic trend framing remains unfavorable with Close vs MA50 = Bearish and MA50 vs MA200 = Bearish. Momentum is also stressed: RSI(14) at 18.69 indicates heavy downside pressure, while MACD histogram at -0.2000 suggests negative impulse remains present. Key decision zones are well-defined around support ~207.1000 and resistance ~262.4750, with news sentiment reading 0.128 and skewing neutral-to-slightly constructive in tone, but not strongly supportive.
Key Takeaways
- Rank stance: Short Bearish | Mid Bearish | Long Neutral
- Technical confluence label: Bearish (18-signal confluence score -0.389; blended overall technical score -0.191 = Neutral)
- Key levels: Support ~207.1000 | Resistance ~262.4750
- News sentiment bias: Neutral (avg 0.128; Positive 37%, Neutral 63%, Negative 0%)
- Confirmation / invalidation condition: A break above 262.4750 with volume would improve continuation odds; a close below 207.1000 increases deterioration risk.
What KGNAI Measures
KGNAI evaluates assets using large cross-sectional datasets built from millions of structured data points. Inputs incorporate fundamental metrics, technical structures, and systematically processed news sentiment. Statistical models, machine learning, and AI frameworks are used to assess relative positioning, signal alignment, and probabilistic behavior across broad universes.
How to Read This Report
- Ranks are comparative across the tracked universe, not absolute price targets.
- Confluence reflects alignment among independent signal groups.
- Support/resistance levels are probabilistic decision zones, not guarantees.
- Sentiment provides contextual bias within the broader analytical framework.
1) KGNAI AI Analysis
Region: INDIA
Total universe size: 1223 ranked instruments
- Daily rank: #990 out of 1223 — Bearish
- Weekly rank: #855 out of 1223 — Neutral
- Monthly rank: #1115 out of 1223 — Bearish
- 3-Monthly rank: #982 out of 1223 — Bearish
- 6-Monthly rank: #899 out of 1223 — Neutral
- Yearly rank: #930 out of 1223 — Neutral
RELIGARE’s rank distribution is asymmetric across horizons: the short cycle is materially weak (daily #990), the intermediate cycle is weaker still (monthly #1115), while the longer window is less extreme (yearly #930). In cross-sectional terms, this places the instrument largely in the lower tier of the tracked universe for near-to-mid horizons, with the long-horizon profile closer to the lower-middle range rather than outright capitulation.
This shape often aligns with markets where downside has been persistent enough to degrade intermediate ranking tests, but where longer-window aggregates have not yet fully re-rated into the most negative bucket. Practically, that combination tends to be consistent with either (a) an extended drawdown that still lacks stabilization evidence, or (b) a market in transition where longer-horizon metrics are slower to reflect recent deterioration.
The declared term view—Short-term: Bearish, Mid-term: Bearish, Long-term: Neutral—captures that tension: weakness dominates near-term selection filters, while the long-term categorization is not yet aligned with a fully bearish regime classification. For portfolio construction, this is more consistent with risk containment and confirmation-seeking than with a momentum-following profile. The next sections test whether price structure and indicator confluence reinforce the rank weakness or flag early stabilization.
2) Price & trend overview
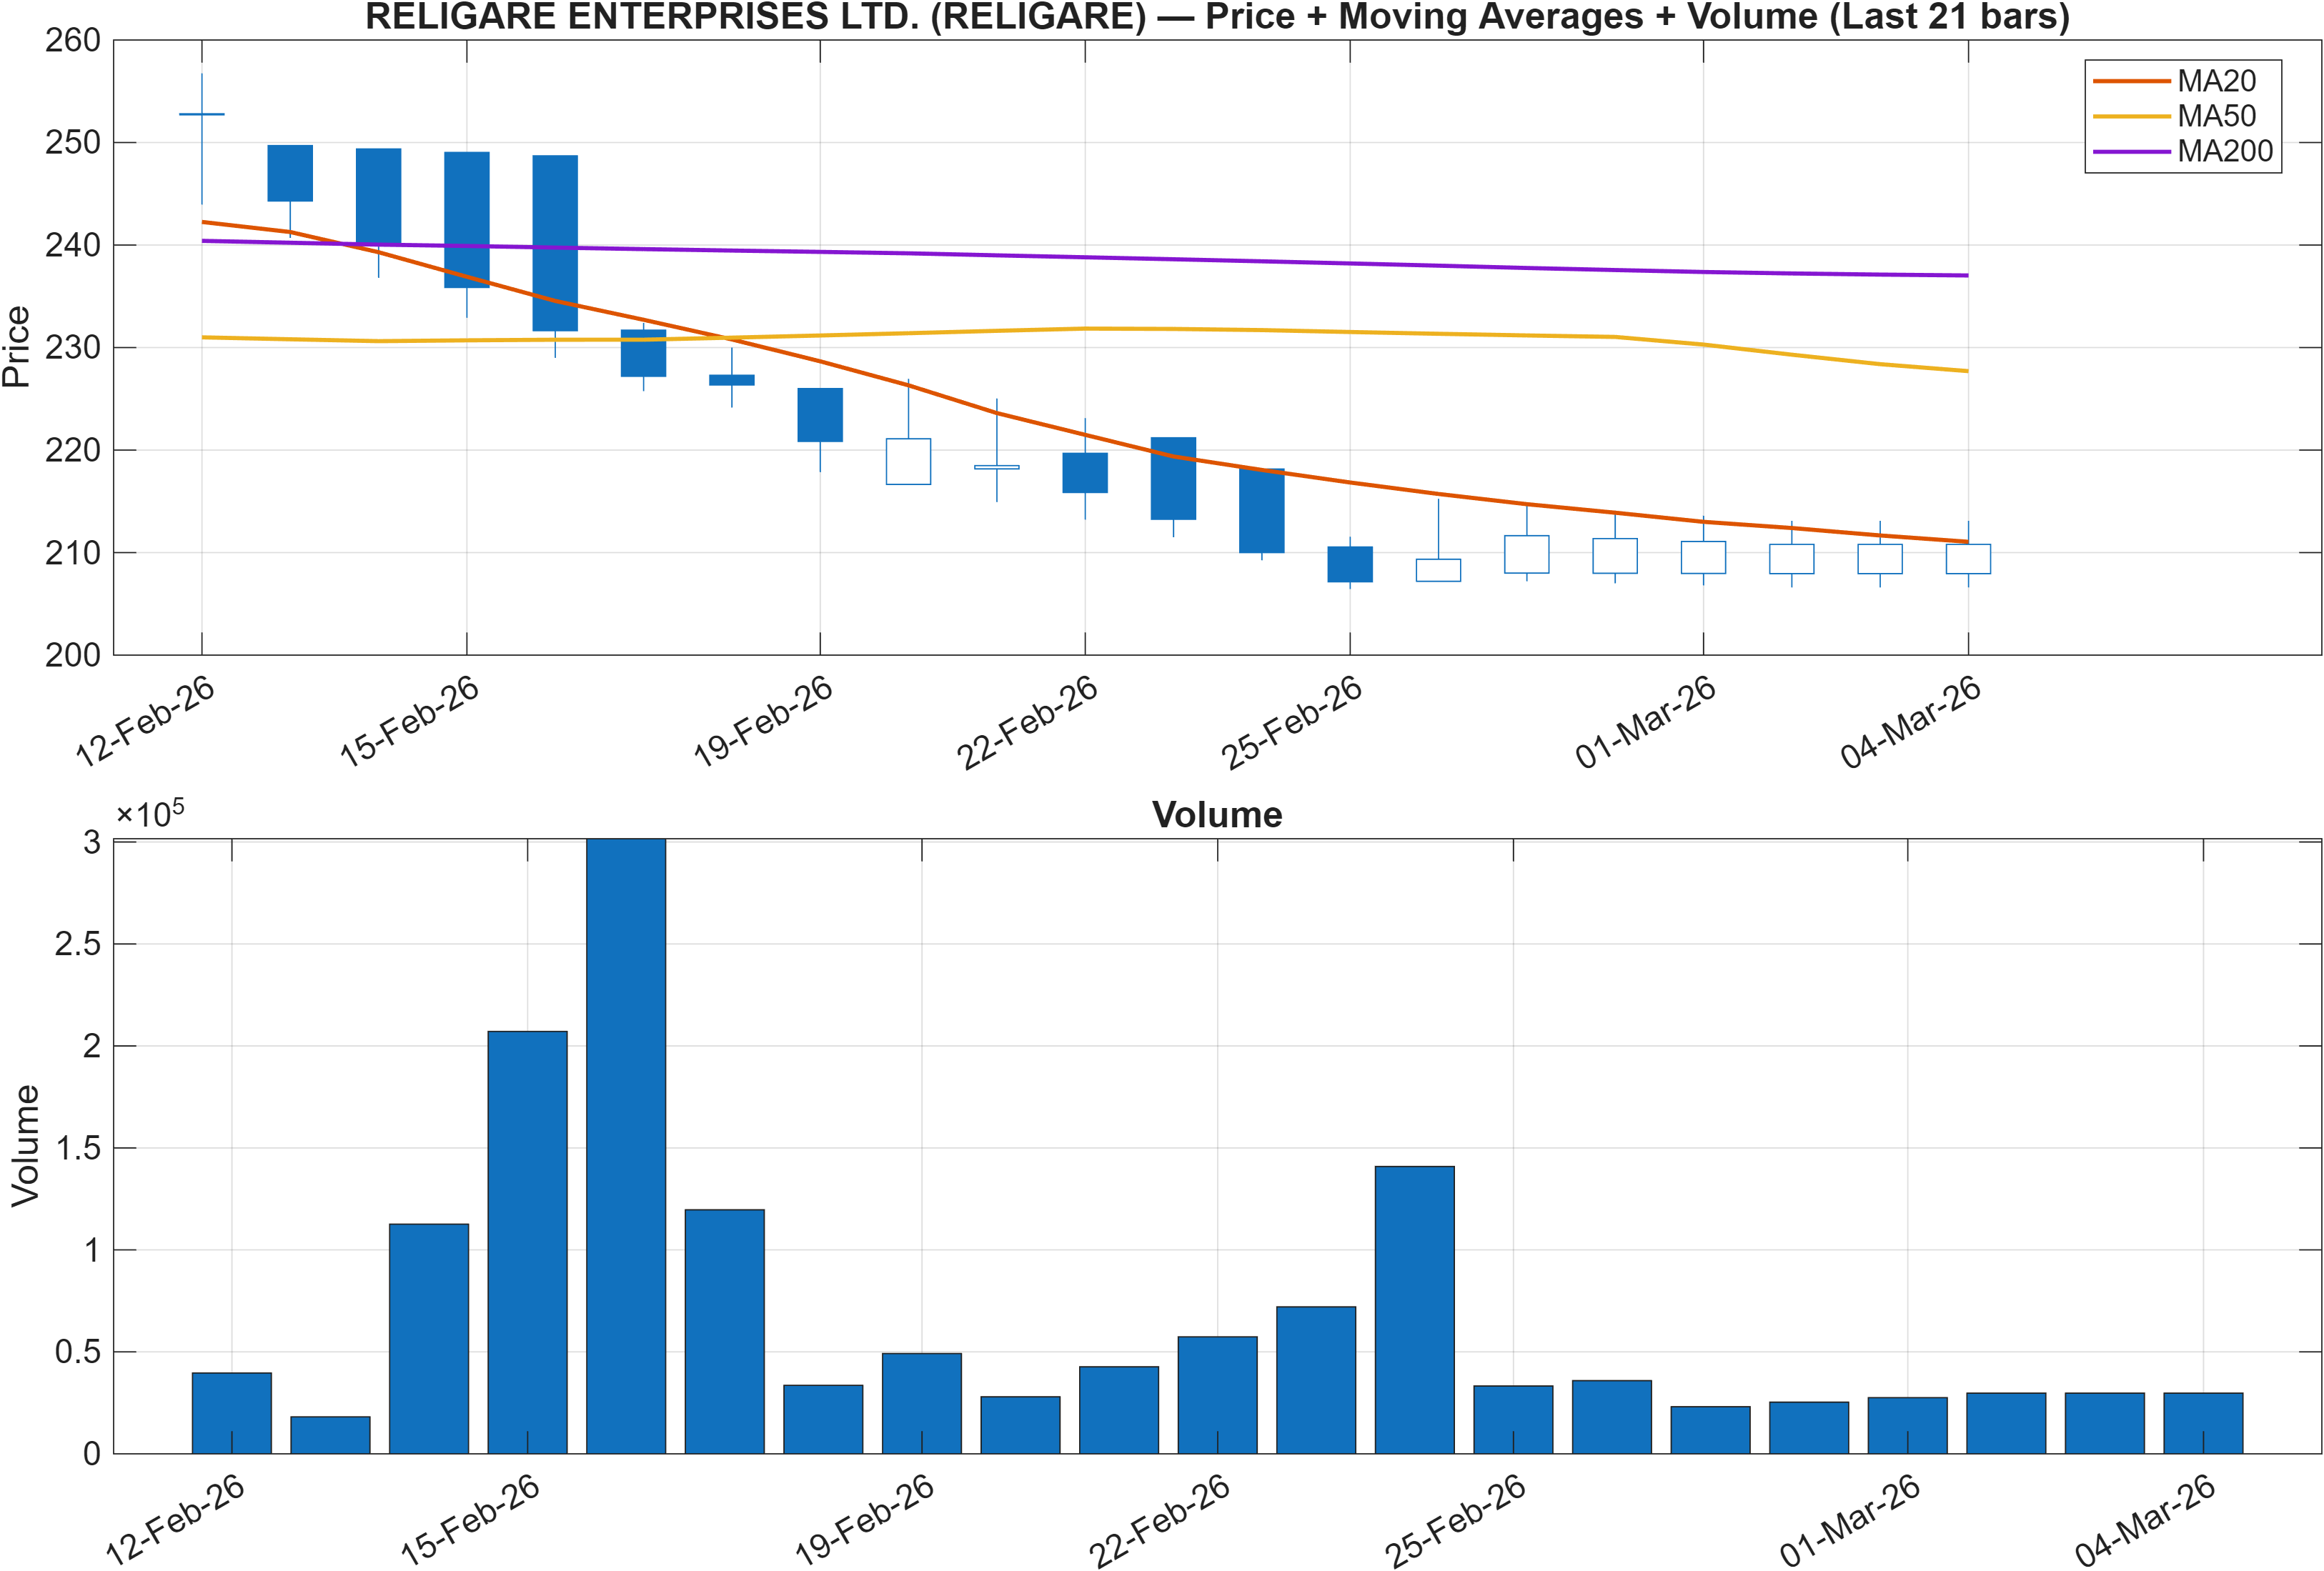
Trend state is currently unambiguously unfavorable on two independent checks: Close vs MA50 = Bearish (price below the intermediate trend proxy), and MA50 vs MA200 = Bearish (the intermediate trend below the long trend). That combination typically implies the market is trading within a downtrend regime rather than a short-lived pullback.
The key analytical point is not merely that moving averages are negative, but that both layers agree—suggesting limited “timeframe disagreement” that would otherwise support mean reversion. This aligns with the rank profile where the monthly rank (#1115) is worse than the weekly rank (#855): the intermediate window appears to be exerting more drag than the very short window.
Within this regime, reaction levels become more important than trend-chasing. The defined zones—support ~207.1000 and resistance ~262.4750—frame the market’s decision space. A market below its MA50 tends to treat resistance as a “supply test,” while support acts as a “stress point” where selling pressure either exhausts or accelerates. Importantly, the presence of a resistance level materially above support implies a wide range where failed rallies are plausible unless confirmed by volume and follow-through.
In short: price structure and cross-sectional ranks are directionally consistent. Until the trend filters stop agreeing on bearish state (Close vs MA50 and MA50 vs MA200), the burden of proof generally remains on stabilization signals rather than on rebound narratives.
3) Momentum & volatility dashboard
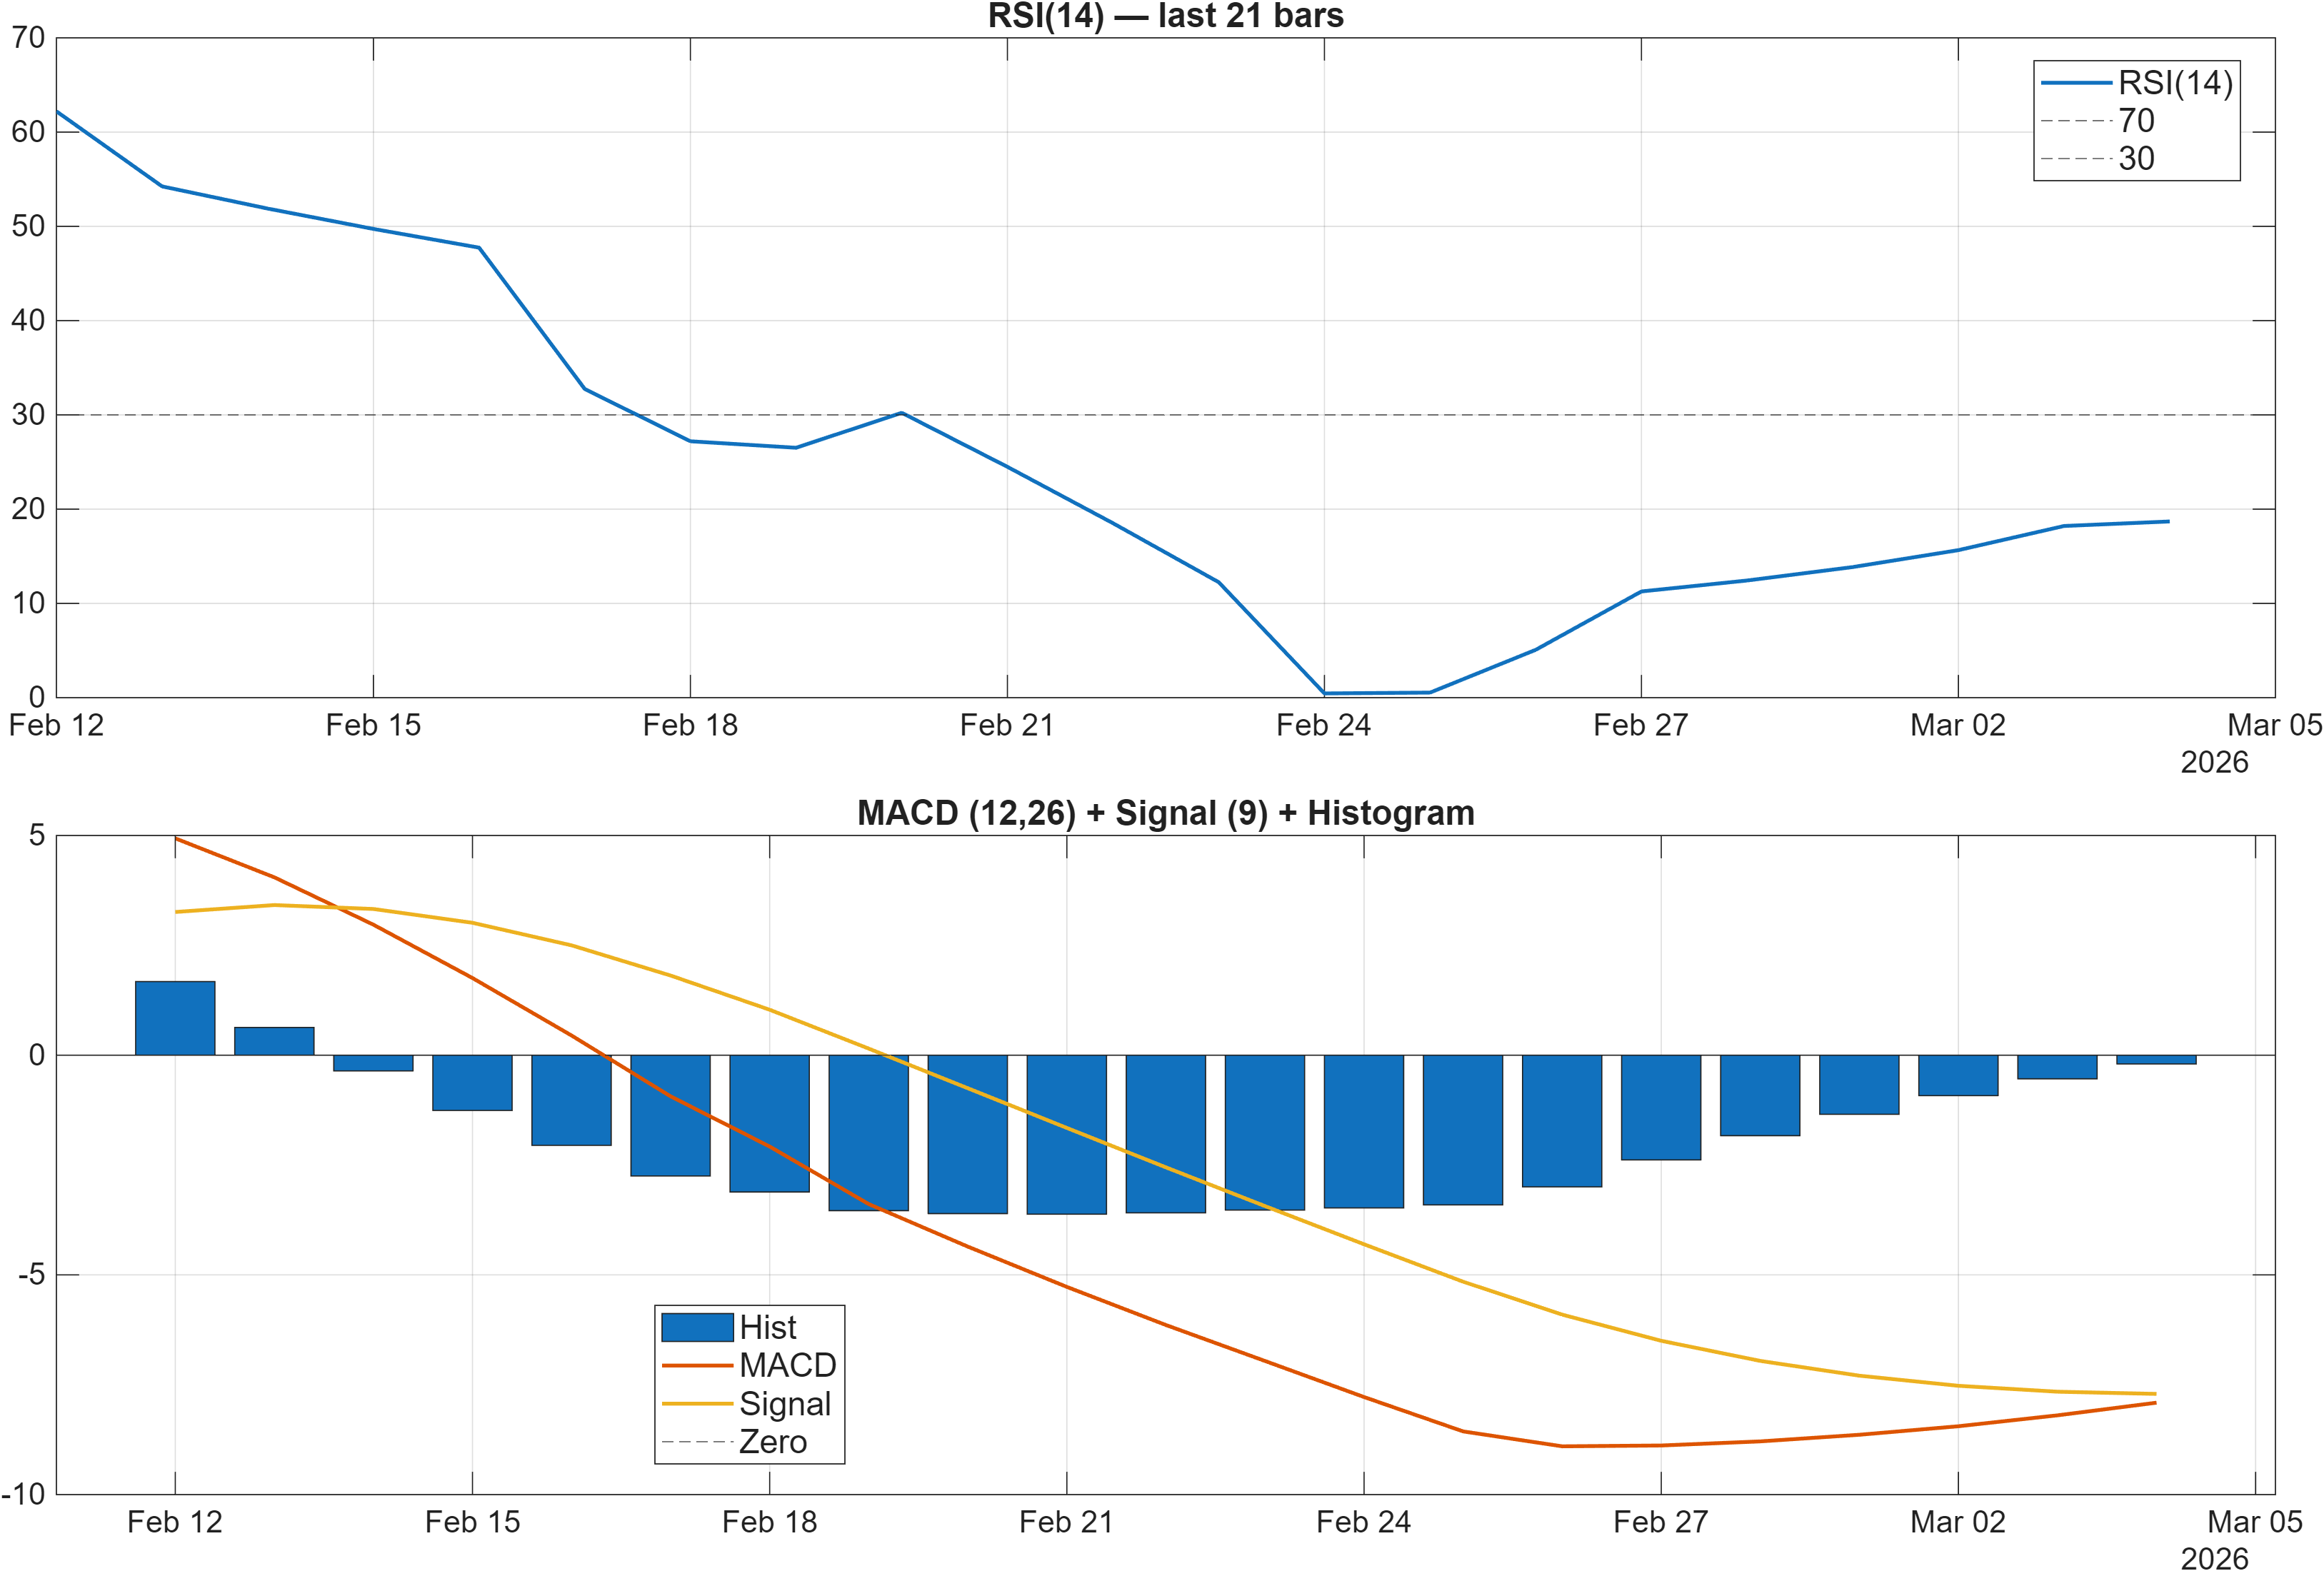
Momentum signals show pressure with only limited evidence of reversal mechanics. The RSI(14) at 18.69 sits deep in oversold territory, consistent with a market that has experienced aggressive downside. Oversold readings can coincide with short reflex rallies, but in established downtrends they can also persist—so RSI here is better interpreted as a stress indicator rather than a stand-alone turning signal.
MACD reinforces that stress characterization: the reported MACD histogram at -0.2000 indicates negative momentum remains in place. When RSI is extremely low while MACD histogram stays negative, it often reflects a market that is oversold yet still not demonstrating positive impulse. That mismatch matters because sustainable reversals typically require some improvement in impulse (even before trend flips).
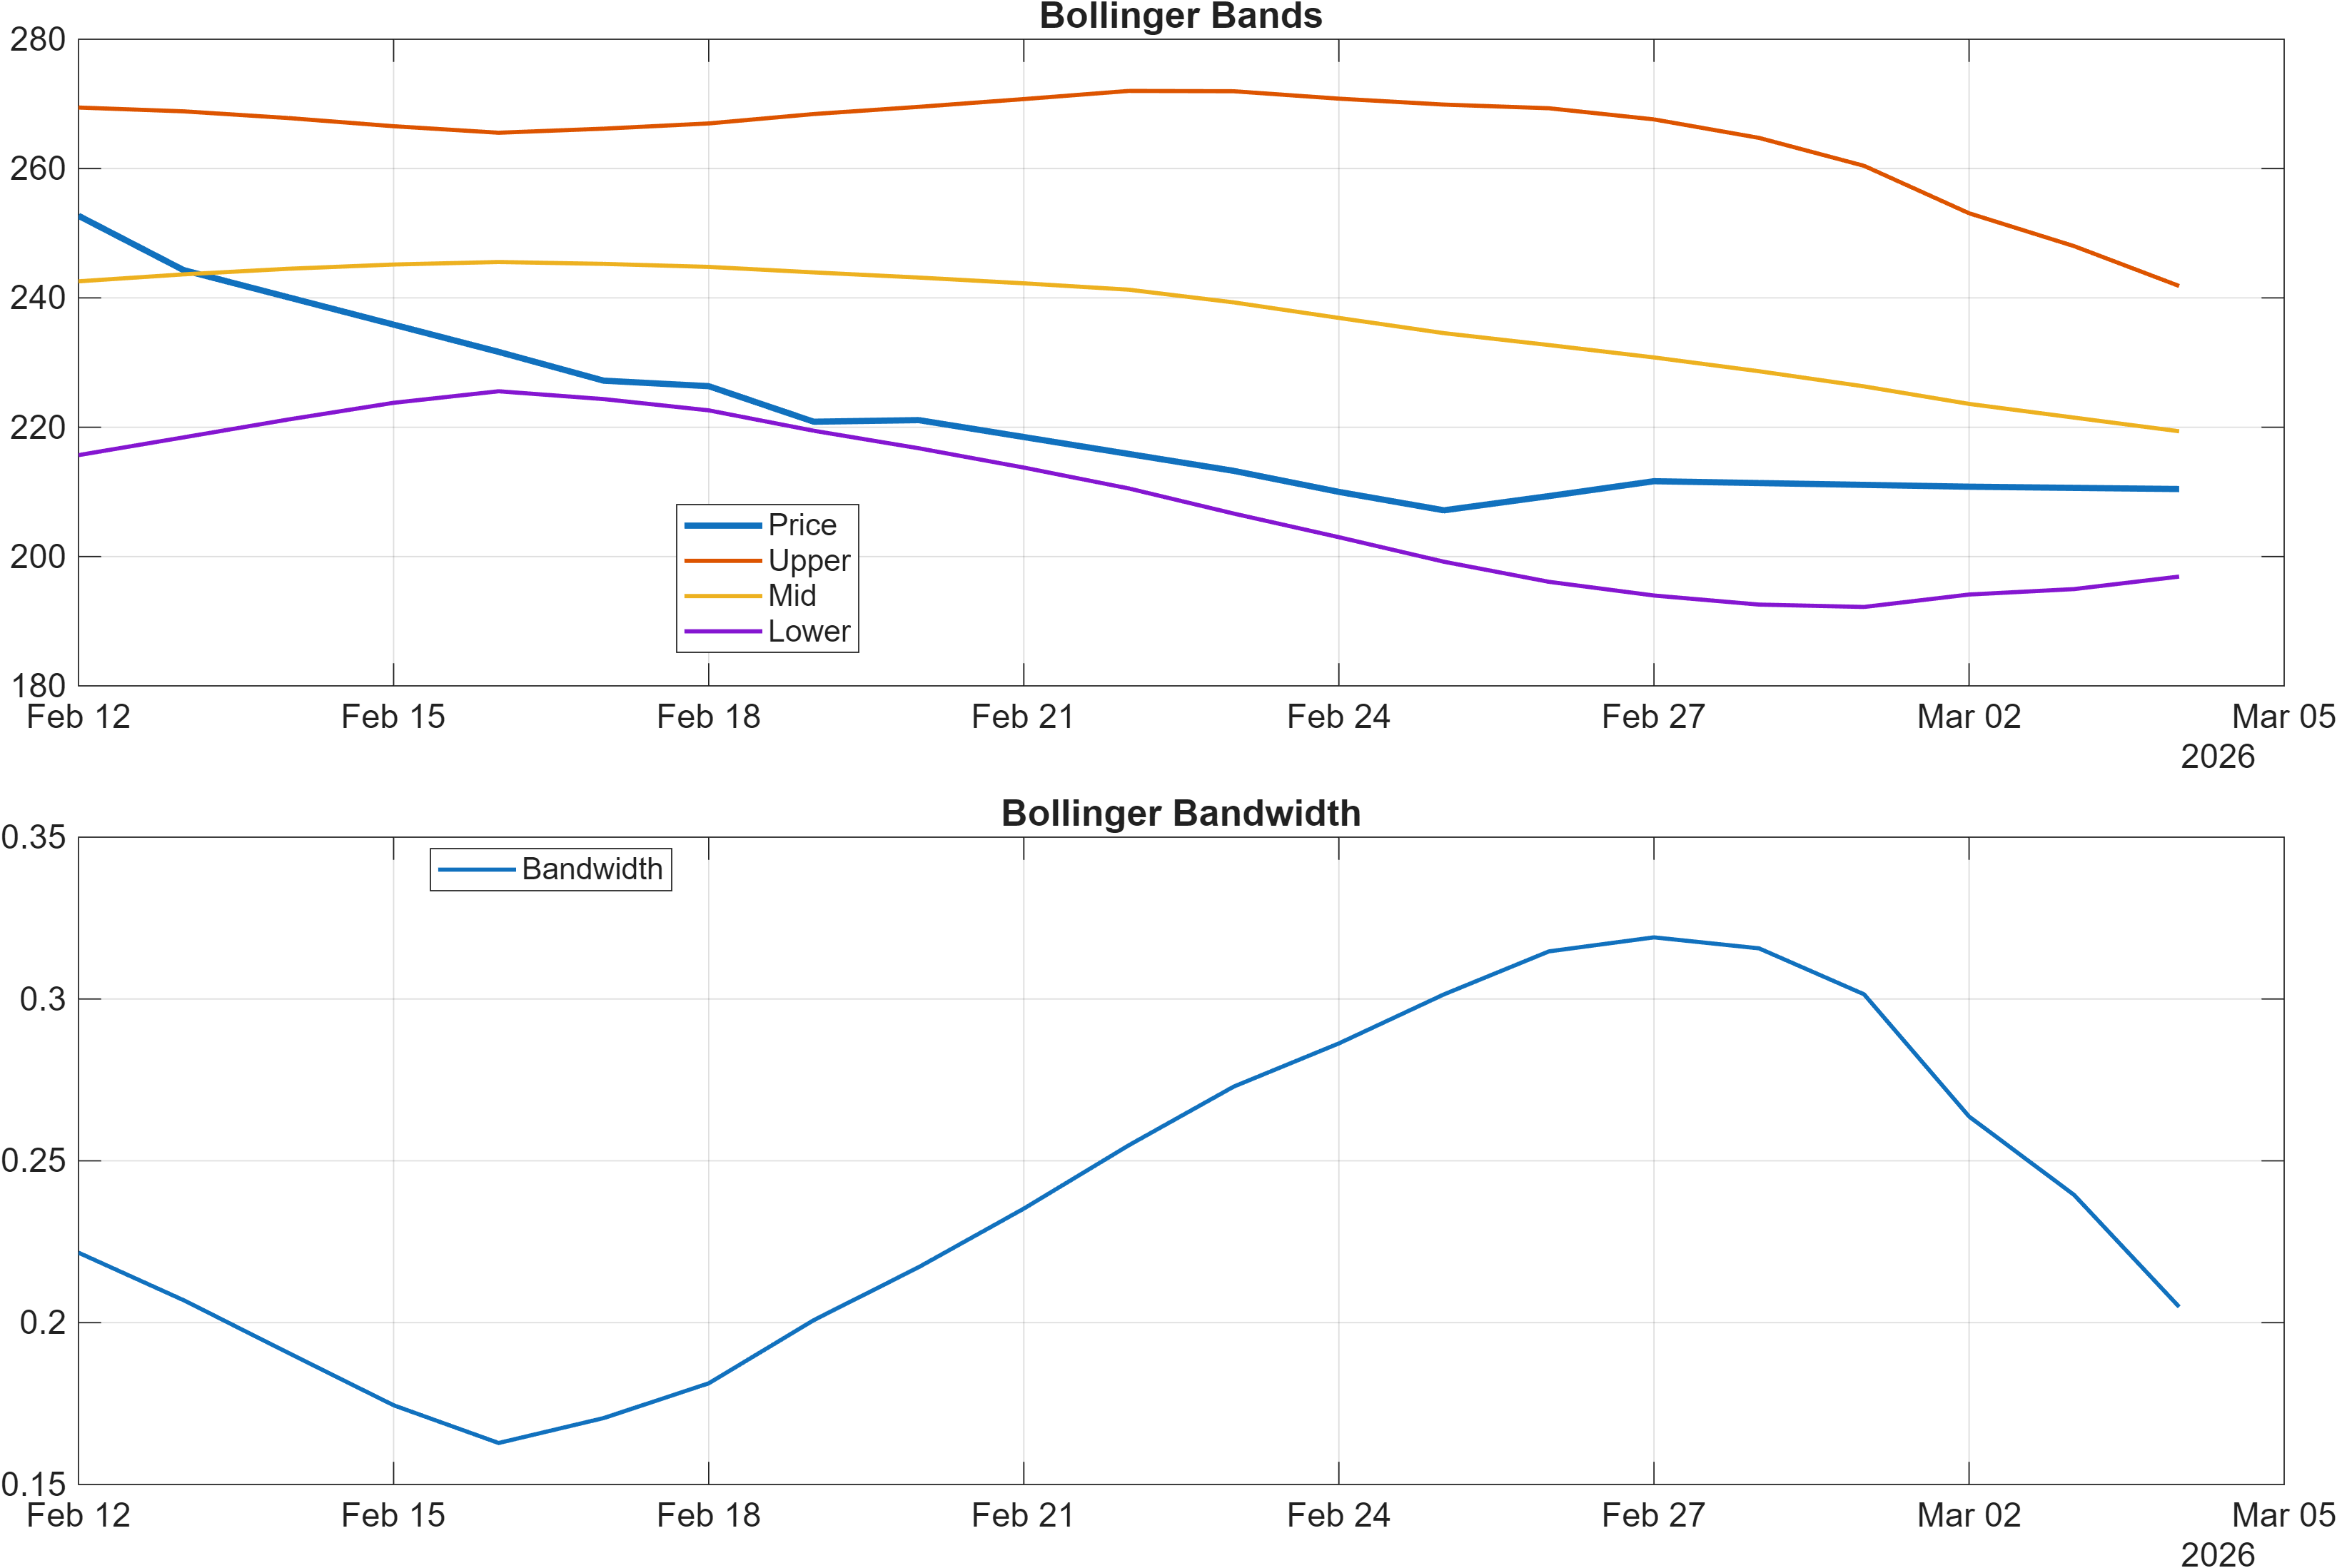
Volatility context is captured by Bollinger bandwidth with a latest reading of 0.2049. On its own, bandwidth does not define direction; instead it helps diagnose whether the market is in signal expansion (wider bands, higher volatility) or compression (narrower bands, lower volatility). Given the simultaneously depressed RSI and negative MACD histogram, the current volatility regime is more consistent with a market where downside has been active enough to keep conditions unstable, even if it is not necessarily accelerating at the same rate every session.
Taken together, the dashboard leans toward trend persistence over exhaustion: oversold conditions exist, but the impulse and regime context do not yet show the “hand-off” that typically characterizes a completed momentum reset.
4) Support / Resistance zones
Support ~ 207.1000 | Resistance ~ 262.4750
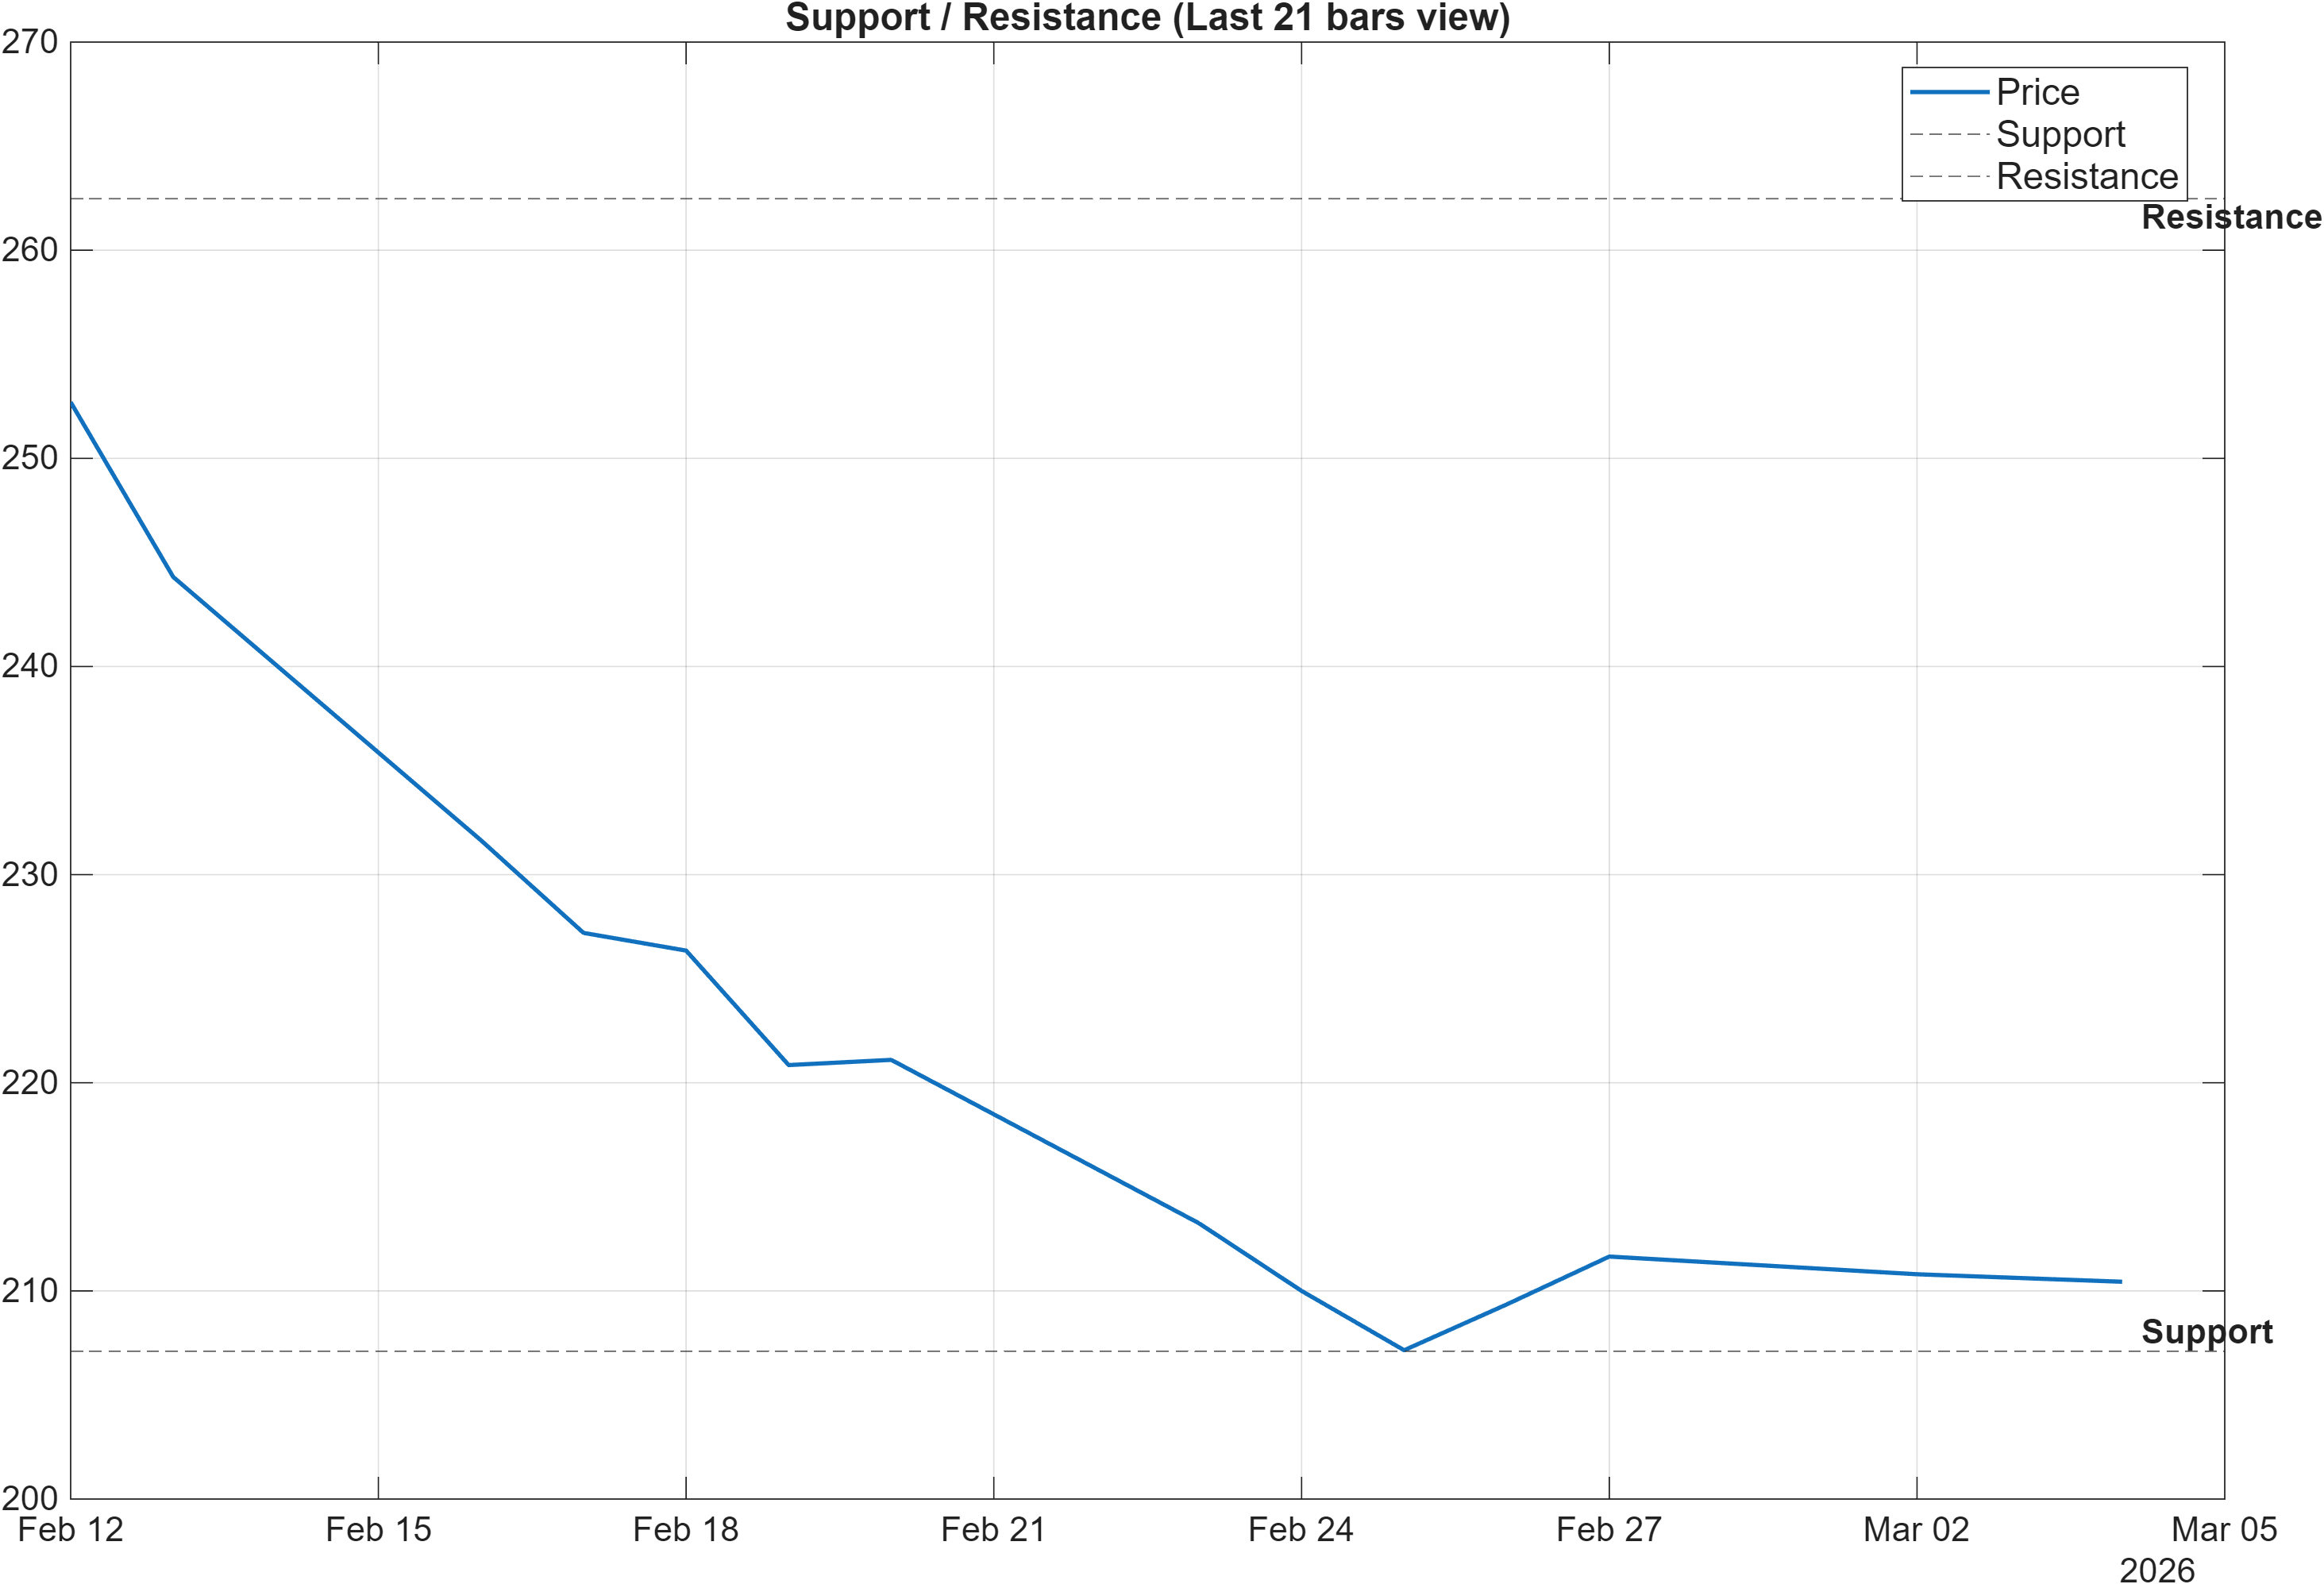
RELIGARE’s defined zones create a clear framework for regime confirmation versus regime deterioration. The market’s near-term “risk boundary” is support ~207.1000. In the context of bearish trend filters (Close vs MA50 and MA50 vs MA200 both bearish), a decisive close below this level is generally interpreted as increasing the probability of downtrend continuation and weaker forward price behavior, consistent with the high (weak) daily rank of #990.
Conversely, resistance ~262.4750 is the level that can separate a bear-market rally from a more durable shift in behavior. The scenario guidance provided—break above resistance with volume → continuation—matters because a “break” without participation frequently fails in downtrends. From a market-structure perspective, volume confirmation is one of the few tools that helps discriminate between short covering and genuine demand.
These zones also help interpret indicator extremes. With RSI(14) at 18.69, a bounce is not unusual; however, without reclaiming resistance, rebounds often remain corrective and can roll over before trend metrics improve. The practical implication is that the levels are more informative as decision points than as targets.
Within the band between 207.1000 and 262.4750, the analytical question is whether price action starts forming higher reaction lows (stabilization) while momentum improves (MACD histogram moving toward zero). Until then, the level map supports a cautious interpretation aligned with the broader bearish confluence.
5) Quant Technical Dashboard (18 Signals)
KGNAI AI Technical Analysis Score (Deep Reinforcement Learning): Rank #445 out of 1223 (Rank 1 represents the strongest technical positioning and a higher probability of favorable price behavior. As ranks increase toward the maximum, the probability of favorable outcomes weakens and bearish positioning becomes more dominant.) | Label: Neutral | Score: 0.272
18-Signal Technical Confluence Score: -0.389 (Bearish)
Overall Technical Score (18-signal confluence + DRL rank blend): -0.191 (Neutral)
Note: The blended score reflects signal strength weighted against broader AI technical ranking, which may temporarily diverge.
Blended technical score breakdown: -0.191 (Neutral | Bull 3 / Bear 10 / Neutral 5)
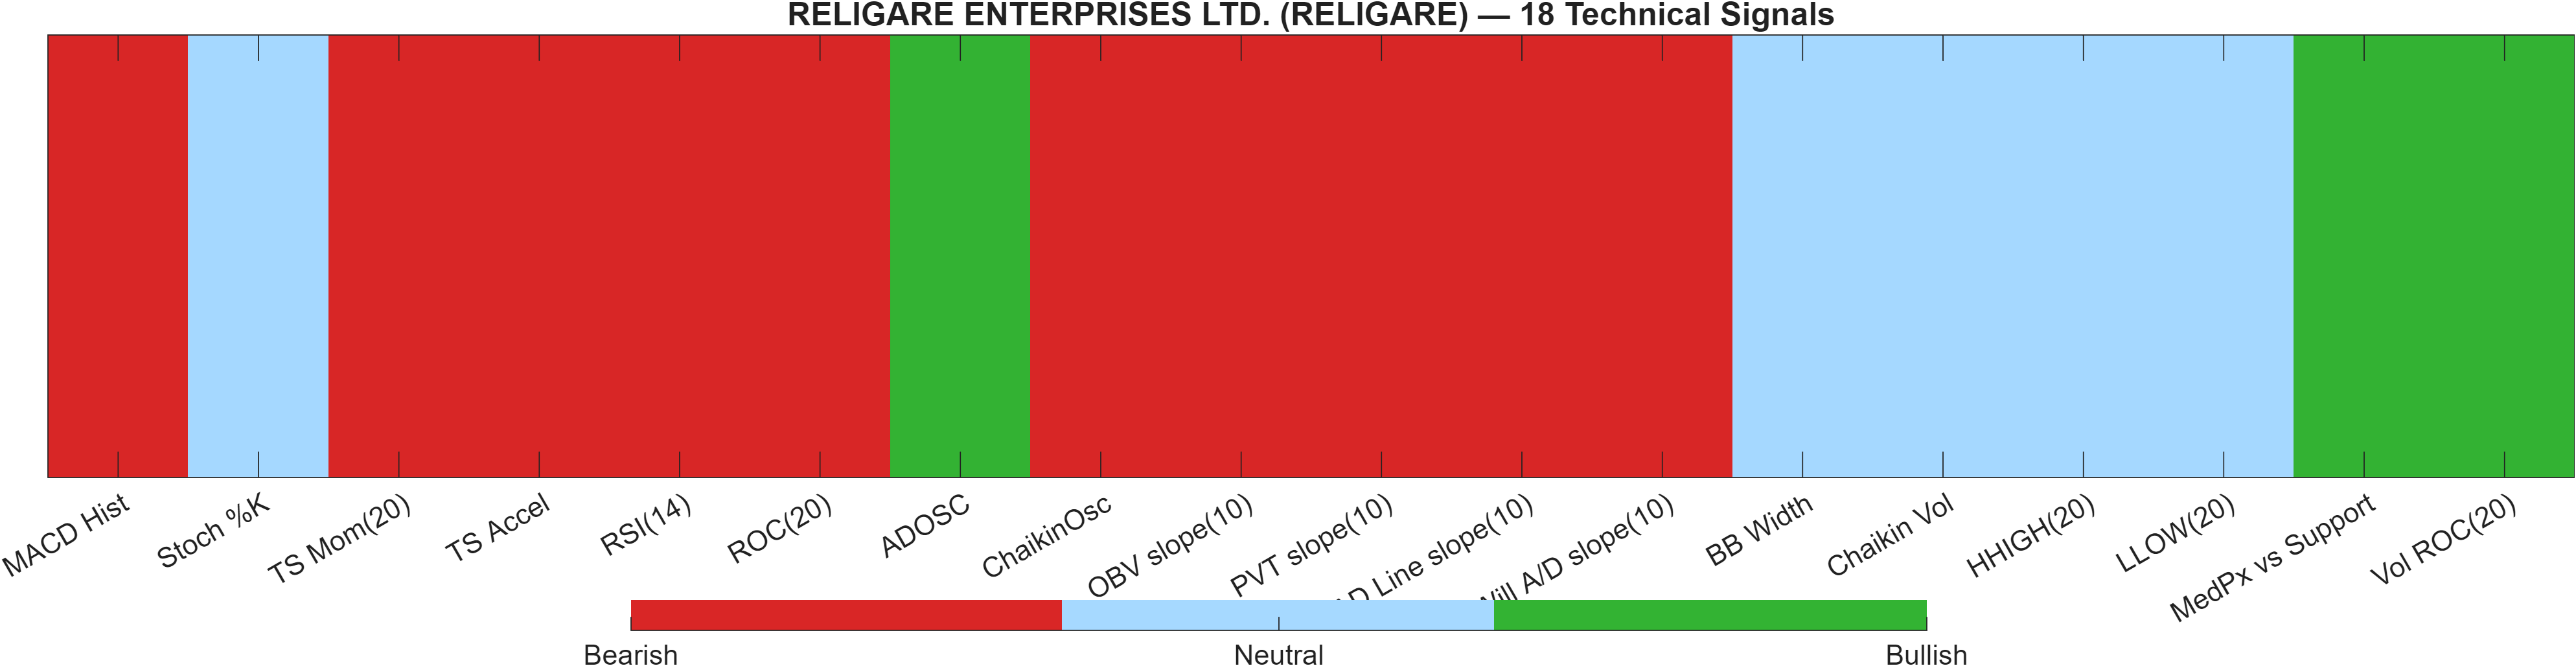
The dashboard highlights a useful divergence between “indicator confluence” and “model-ranked technical positioning”. On one hand, the 18-signal confluence score is -0.389 (Bearish), supported by a heavy skew in the breakdown (Bear 10 vs Bull 3). On the other hand, the DRL technical rank is #445 with a Neutral label and score 0.272, and the blended overall technical score settles at -0.191 (Neutral).
This pattern can occur when the point-in-time indicators (momentum, volume slopes, oscillators) are decisively weak, but the broader technical state model—trained to compare many instruments—detects that RELIGARE is not among the very worst technical structures in the universe. Put differently, confluence says “pressure is dominant,” while the ranked model suggests “pressure is not uniquely extreme relative to peers.”
Signal table (Bull/Bear/Neutral)
| Indicator | Value | Signal |
|---|---|---|
| MACD Hist | -0.2 | Bearish |
| Stoch %K | 29.49 | Neutral |
| TS Mom(20) | -33.5 | Bearish |
| TS Accel | -55.05 | Bearish |
| RSI(14) | 18.69 | Bearish |
| ROC(20) | -13.86 | Bearish |
| ADOSC | 71.92 | Bullish |
| ChaikinOsc | -3.788e+04 | Bearish |
| OBV slope(10) | -2.698e+05 | Bearish |
| PVT slope(10) | -2947 | Bearish |
| AD Line slope(10) | -1.603e+05 | Bearish |
| Will A/D slope(10) | -21.4 | Bearish |
| BB Width | 0.2049 | Neutral |
| Chaikin Vol | -28.9 | Neutral |
| HHIGH(20) | 249.7 | Neutral |
| LLOW(20) | 206.4 | Neutral |
| MedPx vs Support | 2.75 | Bullish |
| Vol ROC(20) | 64.14 | Bullish |
At the indicator level, bearish readings in RSI(14) = 18.69 and MACD Hist = -0.2 align with trend weakness, while the bullish pocket (e.g., Vol ROC(20) = 64.14) is better interpreted as participation volatility rather than trend repair. Net: the blend being Neutral does not contradict the bearish confluence; it suggests the model is less convinced of uniquely adverse positioning versus the universe, despite clear local weakness.
6) News sentiment + extractive gist
Note: Instrument-specific news matches were not found, so the digest includes broader market/sector headlines. Links are provided for verification.
Sentiment score (avg): 0.128 | Positive: 37% | Neutral: 63% | Negative: 0%
KGNAI AI News Sentiment Score (normalized -1 to +1): Not available (as of —) | Label: Not available | Overall news score: 0.13
Positive Developments
Recent coverage across major financial outlets indicates a mildly constructive tone in parts of the broader market narrative, with some attention on tactical opportunities and selective setups despite the risk backdrop. The aggregate sentiment distribution—37% positive and 0% negative—supports a view of commentary that leans toward “watchful optimism” rather than outright risk aversion. In a tape where RELIGARE’s technical posture is stressed (e.g., RSI(14) at 18.69), this matters mainly as a contextual offset: neutral-to-positive ambient coverage can sometimes reduce the probability of forced liquidation behavior across correlated names. However, because the digest is not instrument-specific and the rank picture remains weak (daily #990, monthly #1115), the practical value is limited to monitoring whether broader risk tone improves enough to support a more durable rebound attempt toward 262.4750.
Neutral / Mixed Developments
The neutral share is dominant at 63%, which is consistent with coverage emphasizing positioning, volatility, and near-term market mechanics rather than clear directional conviction. For RELIGARE, this “informational” environment can coincide with choppy price discovery: when the macro tape is indecisive, idiosyncratic technical levels often drive behavior. That places more weight on the support ~207.1000 and resistance framework than on narrative momentum. The reported overall news score of 0.13 is consistent with a modestly positive tilt, but it does not, by itself, resolve the technical divergence where the 18-signal confluence is -0.389 (Bearish) while the blended technical score is -0.191 (Neutral).
Negative / Risk Signals
Even with 0% negative in the sentiment split, the risk channel remains present in the content mix through discussion of elevated uncertainty and volatility conditions. For a security already showing a bearish trend configuration (Close vs MA50 and MA50 vs MA200 both bearish), a risk-off impulse can be consequential because weak structures tend to be less resilient during broad de-risking. In that setting, the first-order concern becomes whether price can hold above 207.1000; a close below that level would be consistent with “risk narrative” converting into measurable deterioration. At the same time, negative context does not automatically invalidate a mean-reversion bounce—oversold momentum (RSI(14) 18.69) can still produce rallies—but without reclaiming 262.4750, such rallies may remain corrective within a larger downtrend.
- Whether price holds above 207.1000 on a closing basis as volatility evolves (bandwidth 0.2049).
- Whether MACD histogram (-0.2000) begins moving toward zero alongside any rebound attempt.
- Whether any upside push can approach or clear 262.4750 with volume confirmation.
Sources referenced: Reuters, Bloomberg, Yahoo Finance, MarketWatch, Investing.com
7) Sources
- Ahead of Market: 10 things that will decide stock market action on Wednesday — https://economictimes.indiatimes.com/markets/stocks/news/ahead-of-market-10-things-that-will-decide-stock-market-action-on-wednesday/articleshow/128980765.cms
- US-Iran war: GIFT Nifty slumps 800 points tracking sharp fall in US stocks. What to expect on Wednesday? — https://economictimes.indiatimes.com/markets/stocks/news/us-iran-war-gift-nifty-slumps-800-points-tracking-sharp-fall-in-us-stocks-what-to-expect-on-wednesday/articleshow/128979332.cms
- Gold retreats on strong dollar, delayed rate-cut expectations — https://economictimes.indiatimes.com/markets/commodities/news/gold-retreats-on-strong-dollar-delayed-rate-cut-expectations/articleshow/128978645.cms
- Market Trading Guide: Buy Sterlite Technologies and BEL on Wednesday for near term gains up to 16%. What’s brewing? — https://economictimes.indiatimes.com/markets/stocks/news/market-trading-guide-buy-sterlite-technologies-and-bel-on-wednesday-for-near-term-gains-up-to-16-whats-brewing/slideshow/128978262.cms
- US Stocks Today | Dow crashes over 1,000 pts, Nasdaq falls 2% as Middle East conflict stokes inflation worries — https://economictimes.indiatimes.com/markets/us-stocks/news/us-stocks-today-us-stocks-open-lower-as-middle-east-conflict-fans-inflation-fears/articleshow/128976863.cms
- Average price for gallon of gas rises 11 cents overnight to about $3.11 in US — https://economictimes.indiatimes.com/markets/commodities/news/average-price-for-gallon-of-gas-rises-11-cents-overnight-to-about-3-11-in-us/articleshow/128976618.cms
- No issue with Futures segment, but concerns around short-dated Options: Sebi chief — https://economictimes.indiatimes.com/markets/stocks/news/no-issue-with-futures-segment-but-concerns-around-short-dated-options-sebi-chief/articleshow/128976136.cms
- Profit booking: Gold falls Rs 4,300, Silver down Rs 17,000 even as US-Iran conflict escalates. What should investors do? — https://economictimes.indiatimes.com/markets/commodities/news/profit-booking-gold-falls-rs-4300-silver-down-rs-17000-even-as-us-iran-conflict-escalates-what-should-investors-do/articleshow/128970702.cms
You may also like: How KGNAI AI ranks instruments across global markets
Disclaimer: KGNAI provides AI-generated analytics and educational market commentary only. This is not financial advice. Markets involve risk. Always do your own research.