
Sun Pharmaceutical Industries Limited (SUNPHARMA) — 27-Feb-2026 Technical Stance: Bullish Confluence with Overbought Momentum
Sun Pharmaceutical Industries Limited (SUNPHARMA) enters 27-Feb-2026 with consistently strong cross-horizon KGNAI ranks and a Bullish blended technical profile, but with momentum readings that look extended. The instrument sits in the upper decile of the 1,223-name INDIA universe on multiple horizons (notably weekly and monthly), while the Deep Reinforcement Learning (DRL) technical model remains constructive at Rank #237 with a 0.612 score. Traditional momentum gauges reinforce the upside bias—MACD histogram 6.7140 and RSI(14) 88.9—yet the same RSI level also elevates mean-reversion risk around nearby decision zones. Volatility conditions remain relatively contained with Bollinger bandwidth 0.0620, suggesting price may be trending without broad-based expansion. From a market-structure perspective, the primary map is anchored by support ~1603.3500 and resistance ~1766.4000, with news sentiment showing a modestly positive bias overall.
Key Takeaways
- Short / Mid / Long rank stance: Bullish (Daily #107, Weekly #62, Yearly #232 within 1,223)
- Technical confluence: Bullish (Overall Technical Score 0.573; 13 Bull / 3 Bear / 2 Neutral)
- Key levels: Support ~1603.3500; Resistance ~1766.4000
- News sentiment bias: Slight positive tilt (sentiment avg 0.140; normalized score 1.00 as of 2026-02-19), but coverage is broader market/sector
- Confirmation / invalidation: Continuation strengthens on a break above 1766.4000 with volume; deterioration risk on a close below 1603.3500
What KGNAI Measures
KGNAI evaluates assets using large cross-sectional datasets built from millions of structured data points. Inputs incorporate fundamental metrics, technical structures, and systematically processed news sentiment. Statistical models, machine learning, and AI frameworks are used to assess relative positioning, signal alignment, and probabilistic behavior across broad universes.
How to Read This Report
- Ranks are comparative across the tracked universe, not absolute price targets.
- Confluence reflects alignment among independent signal groups.
- Support/resistance levels are probabilistic decision zones, not guarantees.
- Sentiment provides contextual bias within the broader analytical framework.
1) KGNAI AI Analysis
Region: INDIA
Total universe size: 1223 ranked instruments
- Daily rank: #107 out of 1223 — Bullish
- Weekly rank: #62 out of 1223 — Bullish
- Monthly rank: #57 out of 1223 — Bullish
- 3-Monthly rank: #38 out of 1223 — Bullish
- 6-Monthly rank: #133 out of 1223 — Bullish
- Yearly rank: #232 out of 1223 — Bullish
The rank stack is notable for its multi-horizon persistence. Weekly and monthly positioning (ranks #62 and #57) sits comfortably in the upper cohort of the 1,223-instrument universe, while the 3-month rank at #38 points to stronger intermediate follow-through than what the daily figure alone might suggest. The daily rank of #107 remains constructive, but it also hints that near-term conditions may be more sensitive to micro pullbacks—consistent with the overbought momentum cues seen elsewhere in the dashboard.
The longer view remains positive without being dominant: the yearly rank at #232 is still Bullish, yet meaningfully weaker than the 3-month reading. That spread can be interpreted as a regime improvement rather than a mature, long-established leadership profile. Meanwhile, the 6-month rank at #133 sits between the short and long horizons, reinforcing a picture of steady upgrading but not uniform strength across all windows.
Taken together, the AI layer communicates alignment rather than conflict: short-term, mid-term, and long-term term views are all Bullish, with the highest conviction concentrated in the 3-month and weekly windows. For portfolio construction, this is typically where the analytical burden shifts from “direction” to “quality of continuation,” which the remaining sections evaluate via trend structure, momentum/volatility behavior, and probabilistic levels.
2) Price & trend overview
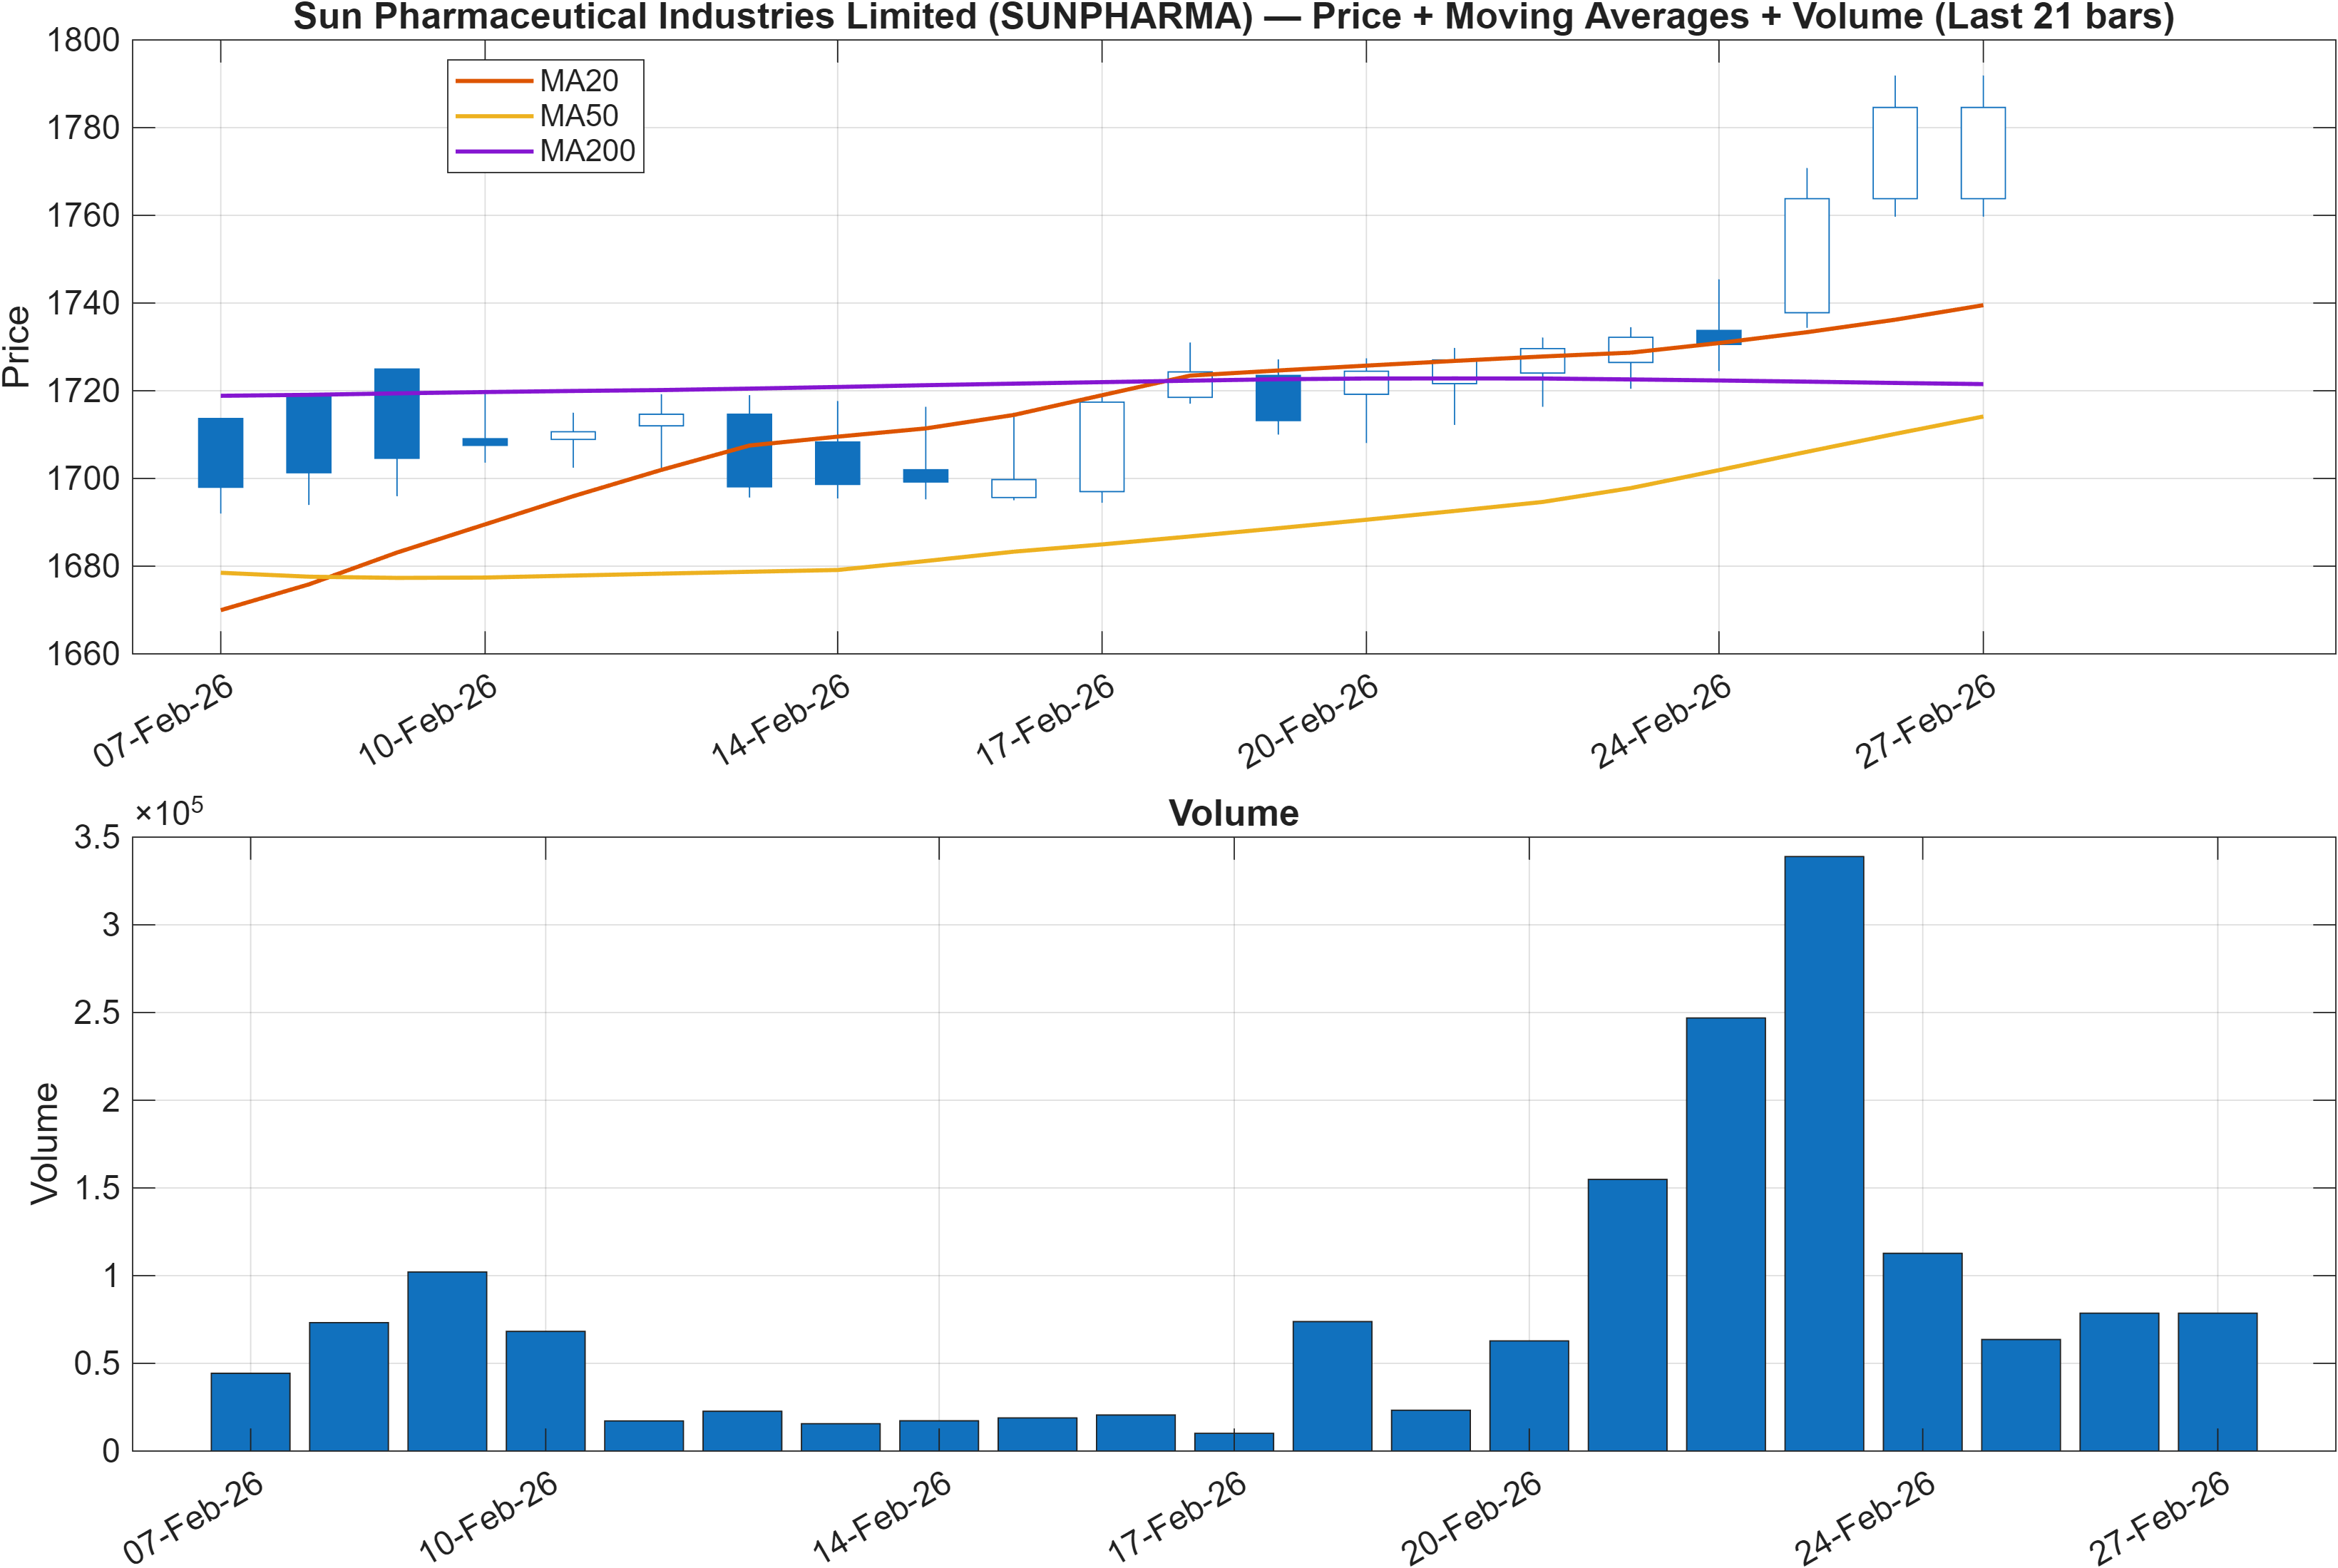
The moving-average read is explicitly split: Close vs MA50 = Bullish, while MA50 vs MA200 = Bearish. This combination is often associated with a transition phase—price is behaving strongly relative to the medium-term trend, but the longer-term trend structure has not fully flipped into a classic “golden-cross” configuration. In practice, that setup can support upside continuation, but it also tends to be more sensitive to sharp mean reversion if momentum gets crowded.
The rank profile supports the notion that trend quality has improved recently: the 3-month rank at #38 is stronger than the 6-month #133 and yearly #232. That sequence is consistent with a market that has been re-rating in the nearer windows. Still, the technical framework should treat the long-term MA relationship as a structural constraint until it resolves.
For price-trend validation, the nearby probabilistic zones in this report provide the practical map: support ~1603.3500 acts as the principal deterioration line, while resistance ~1766.4000 is the immediate continuation threshold. The trend read becomes more robust if upside attempts are accompanied by confirming participation (volume confirmation is referenced in the level scenario). Conversely, given the current momentum intensity (RSI discussed below), trend-following strength can still coexist with short, sharp pullbacks that test the structure.
3) Momentum & volatility dashboard
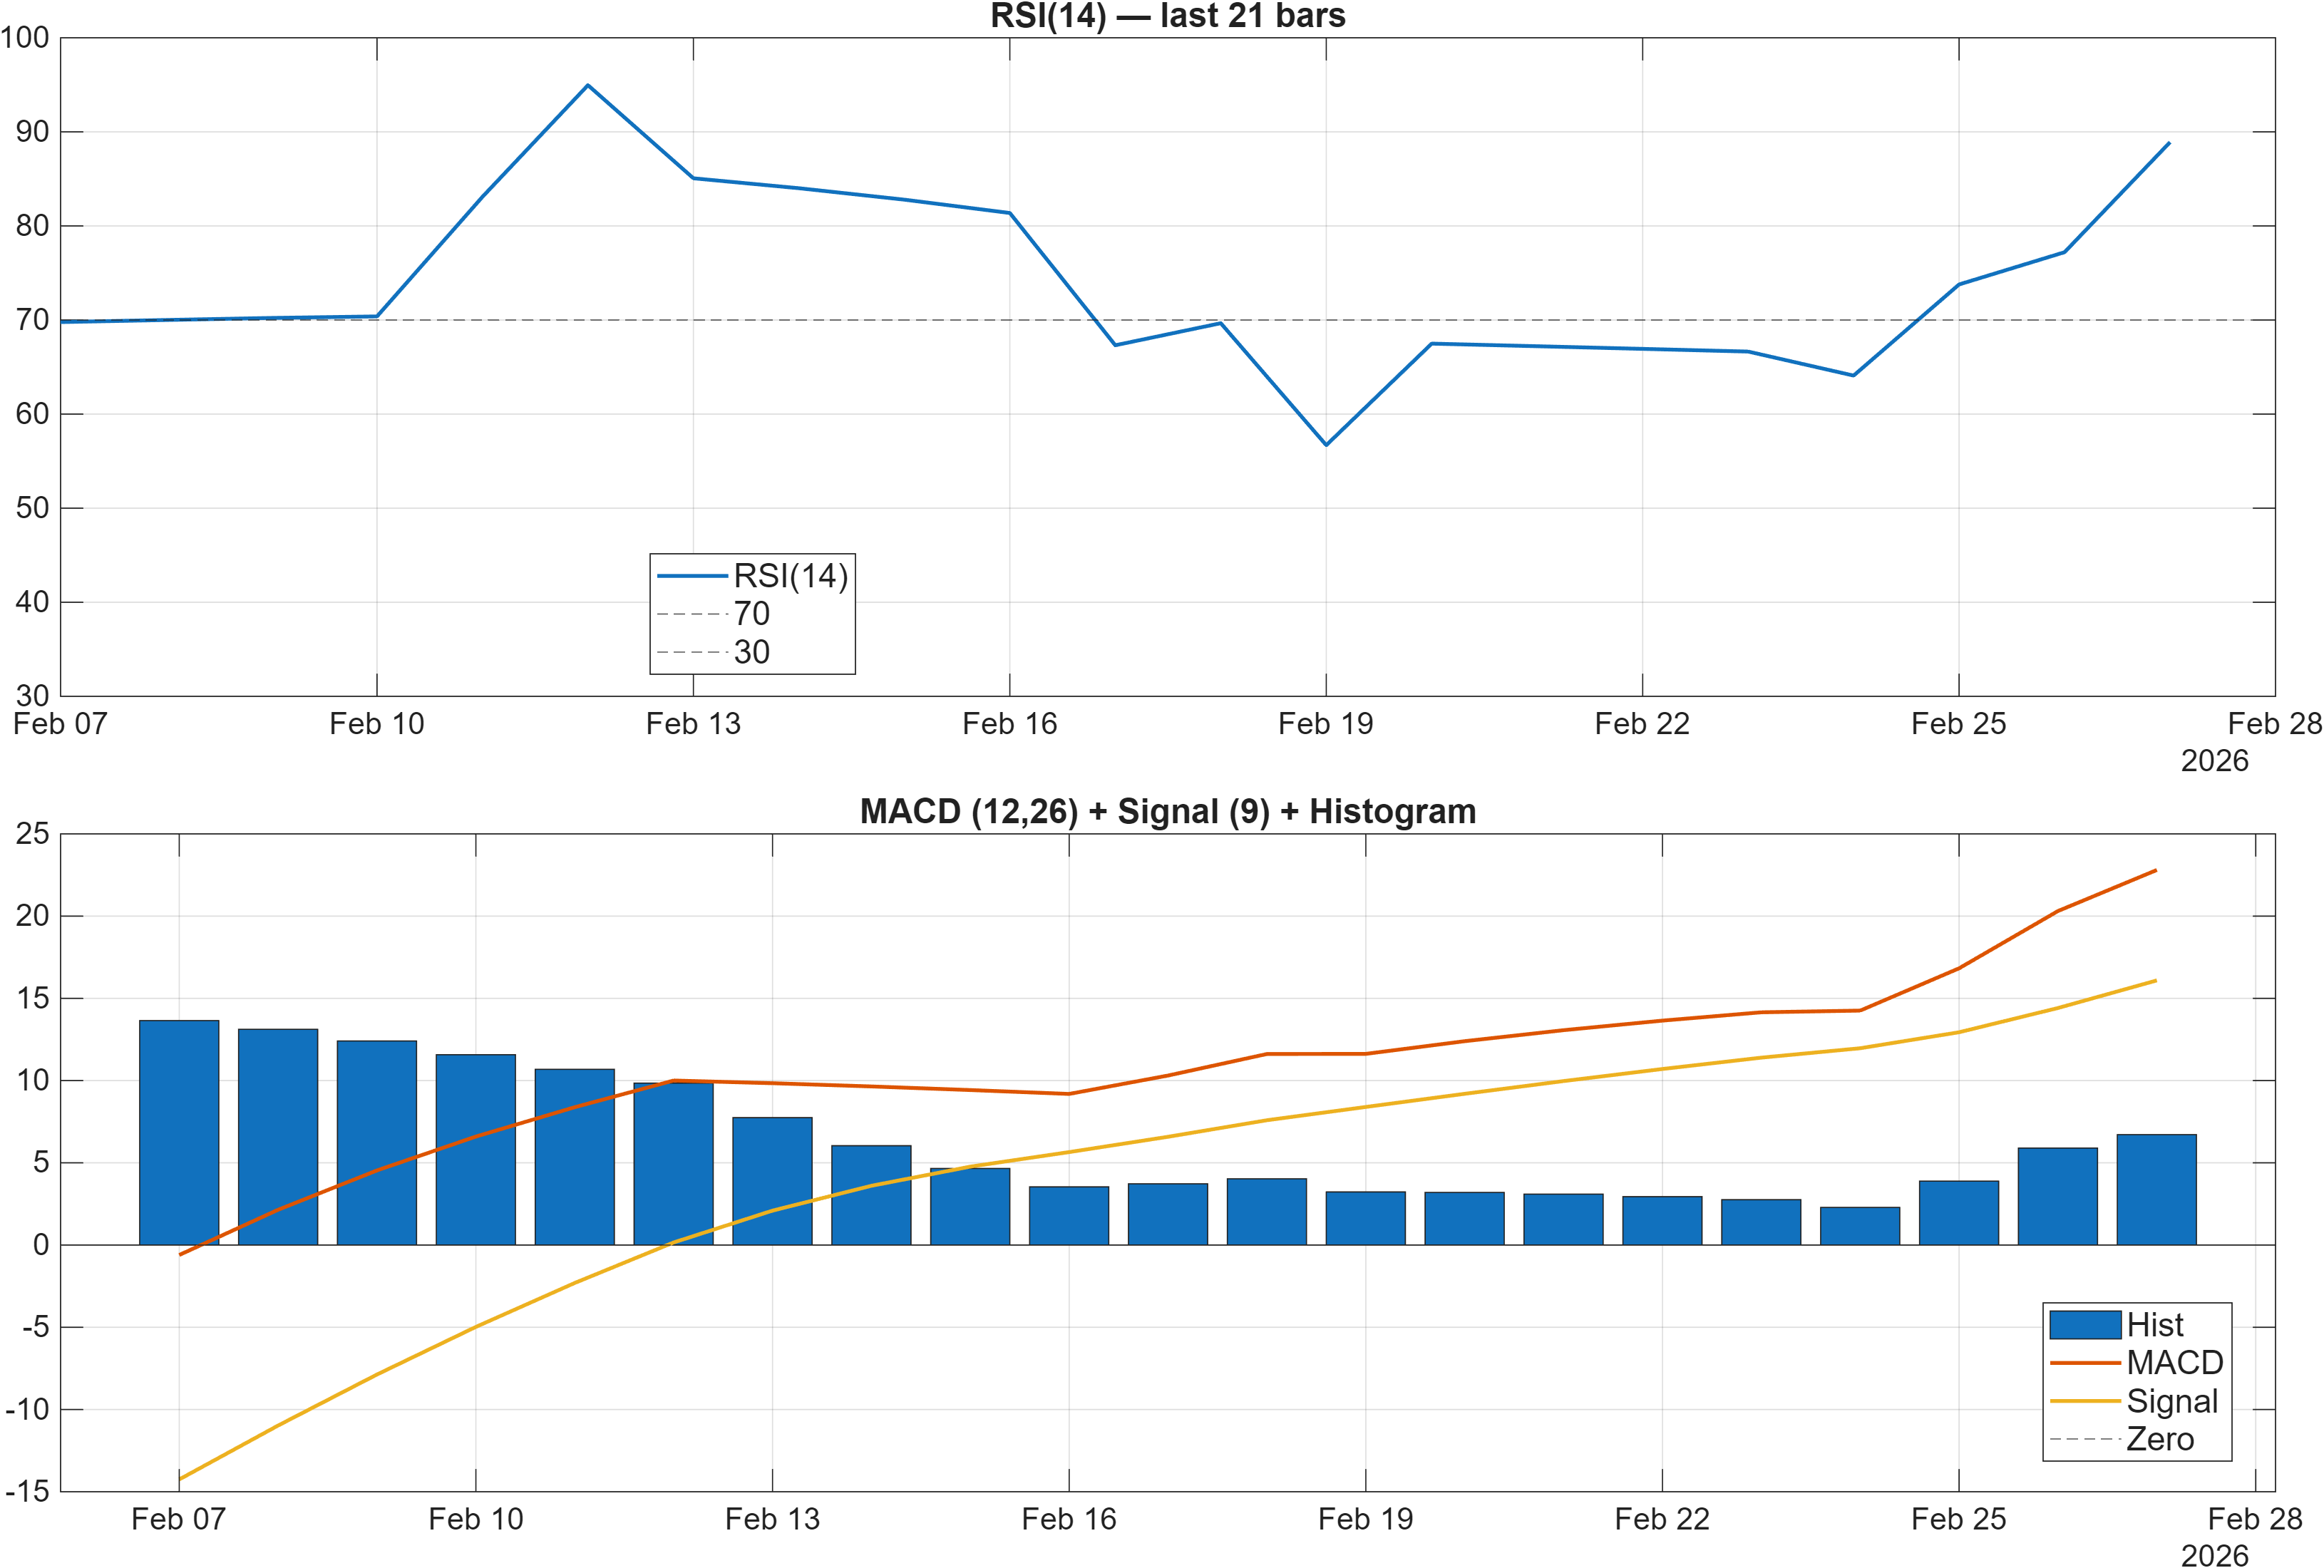
Momentum is firmly positive, but the mix is increasingly about persistence versus exhaustion. The dashboard states RSI bias = Bullish, with RSI(14) 88.9 appearing in the signal set—an elevated reading that commonly coincides with strong trending behavior, while simultaneously raising the probability of short-term cooling phases. The MACD histogram at 6.7140 supports continuation bias, suggesting positive momentum remains present rather than rolling over.
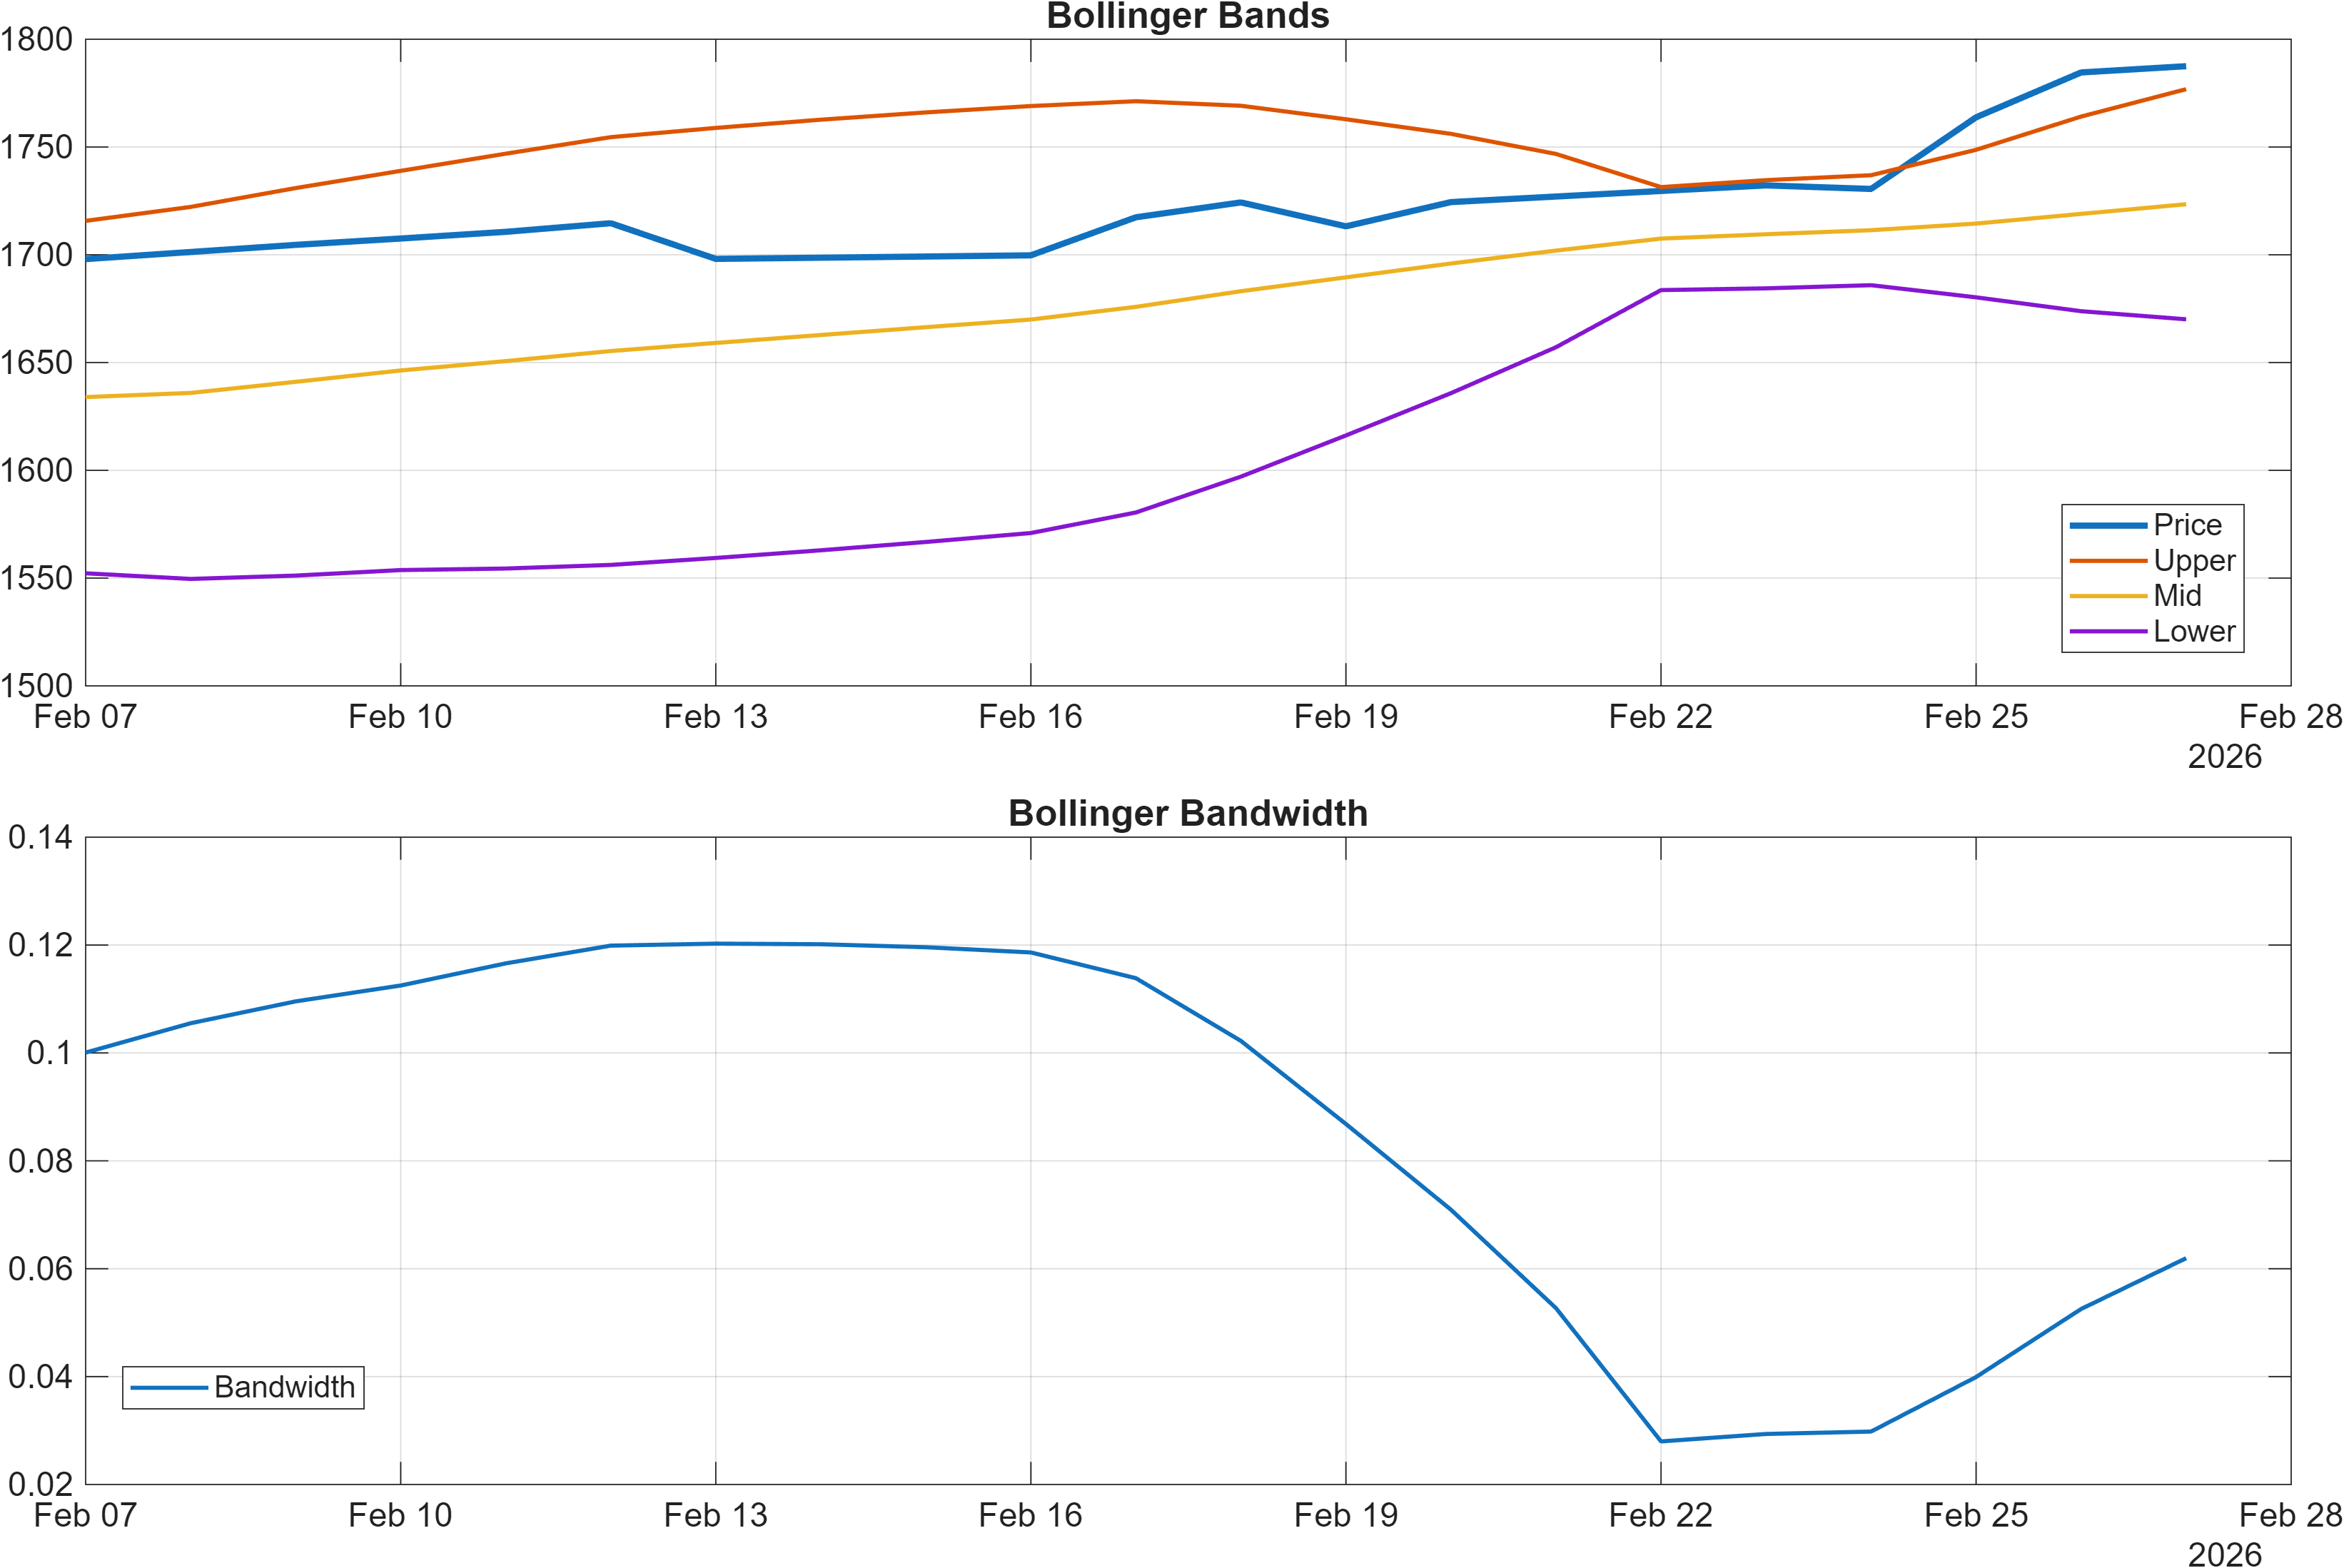
Volatility, however, does not appear to be expanding aggressively. Bollinger bandwidth is 0.0620 (and BB Width in the signal table is 0.06195, marked Neutral). When momentum is strong but bandwidth remains relatively contained, the market can exhibit a “controlled trend” profile—often characterized by orderly advances that are vulnerable to discrete de-risking events rather than continuously widening swings.
Cross-checking with the broader technical stack, the confluence remains Bullish (overall technical score 0.573), but internal dispersion matters: the signal table includes overbought-style tension via Stoch %K 91.29 (Bearish) alongside bullish MACD and RSI cues. This is a classic alignment where direction can remain up, yet incremental upside requires ongoing confirmation rather than assumption—particularly as price approaches the resistance zone described in Section 4.
4) Support / Resistance zones
Support ~ 1603.3500 | Resistance ~ 1766.4000
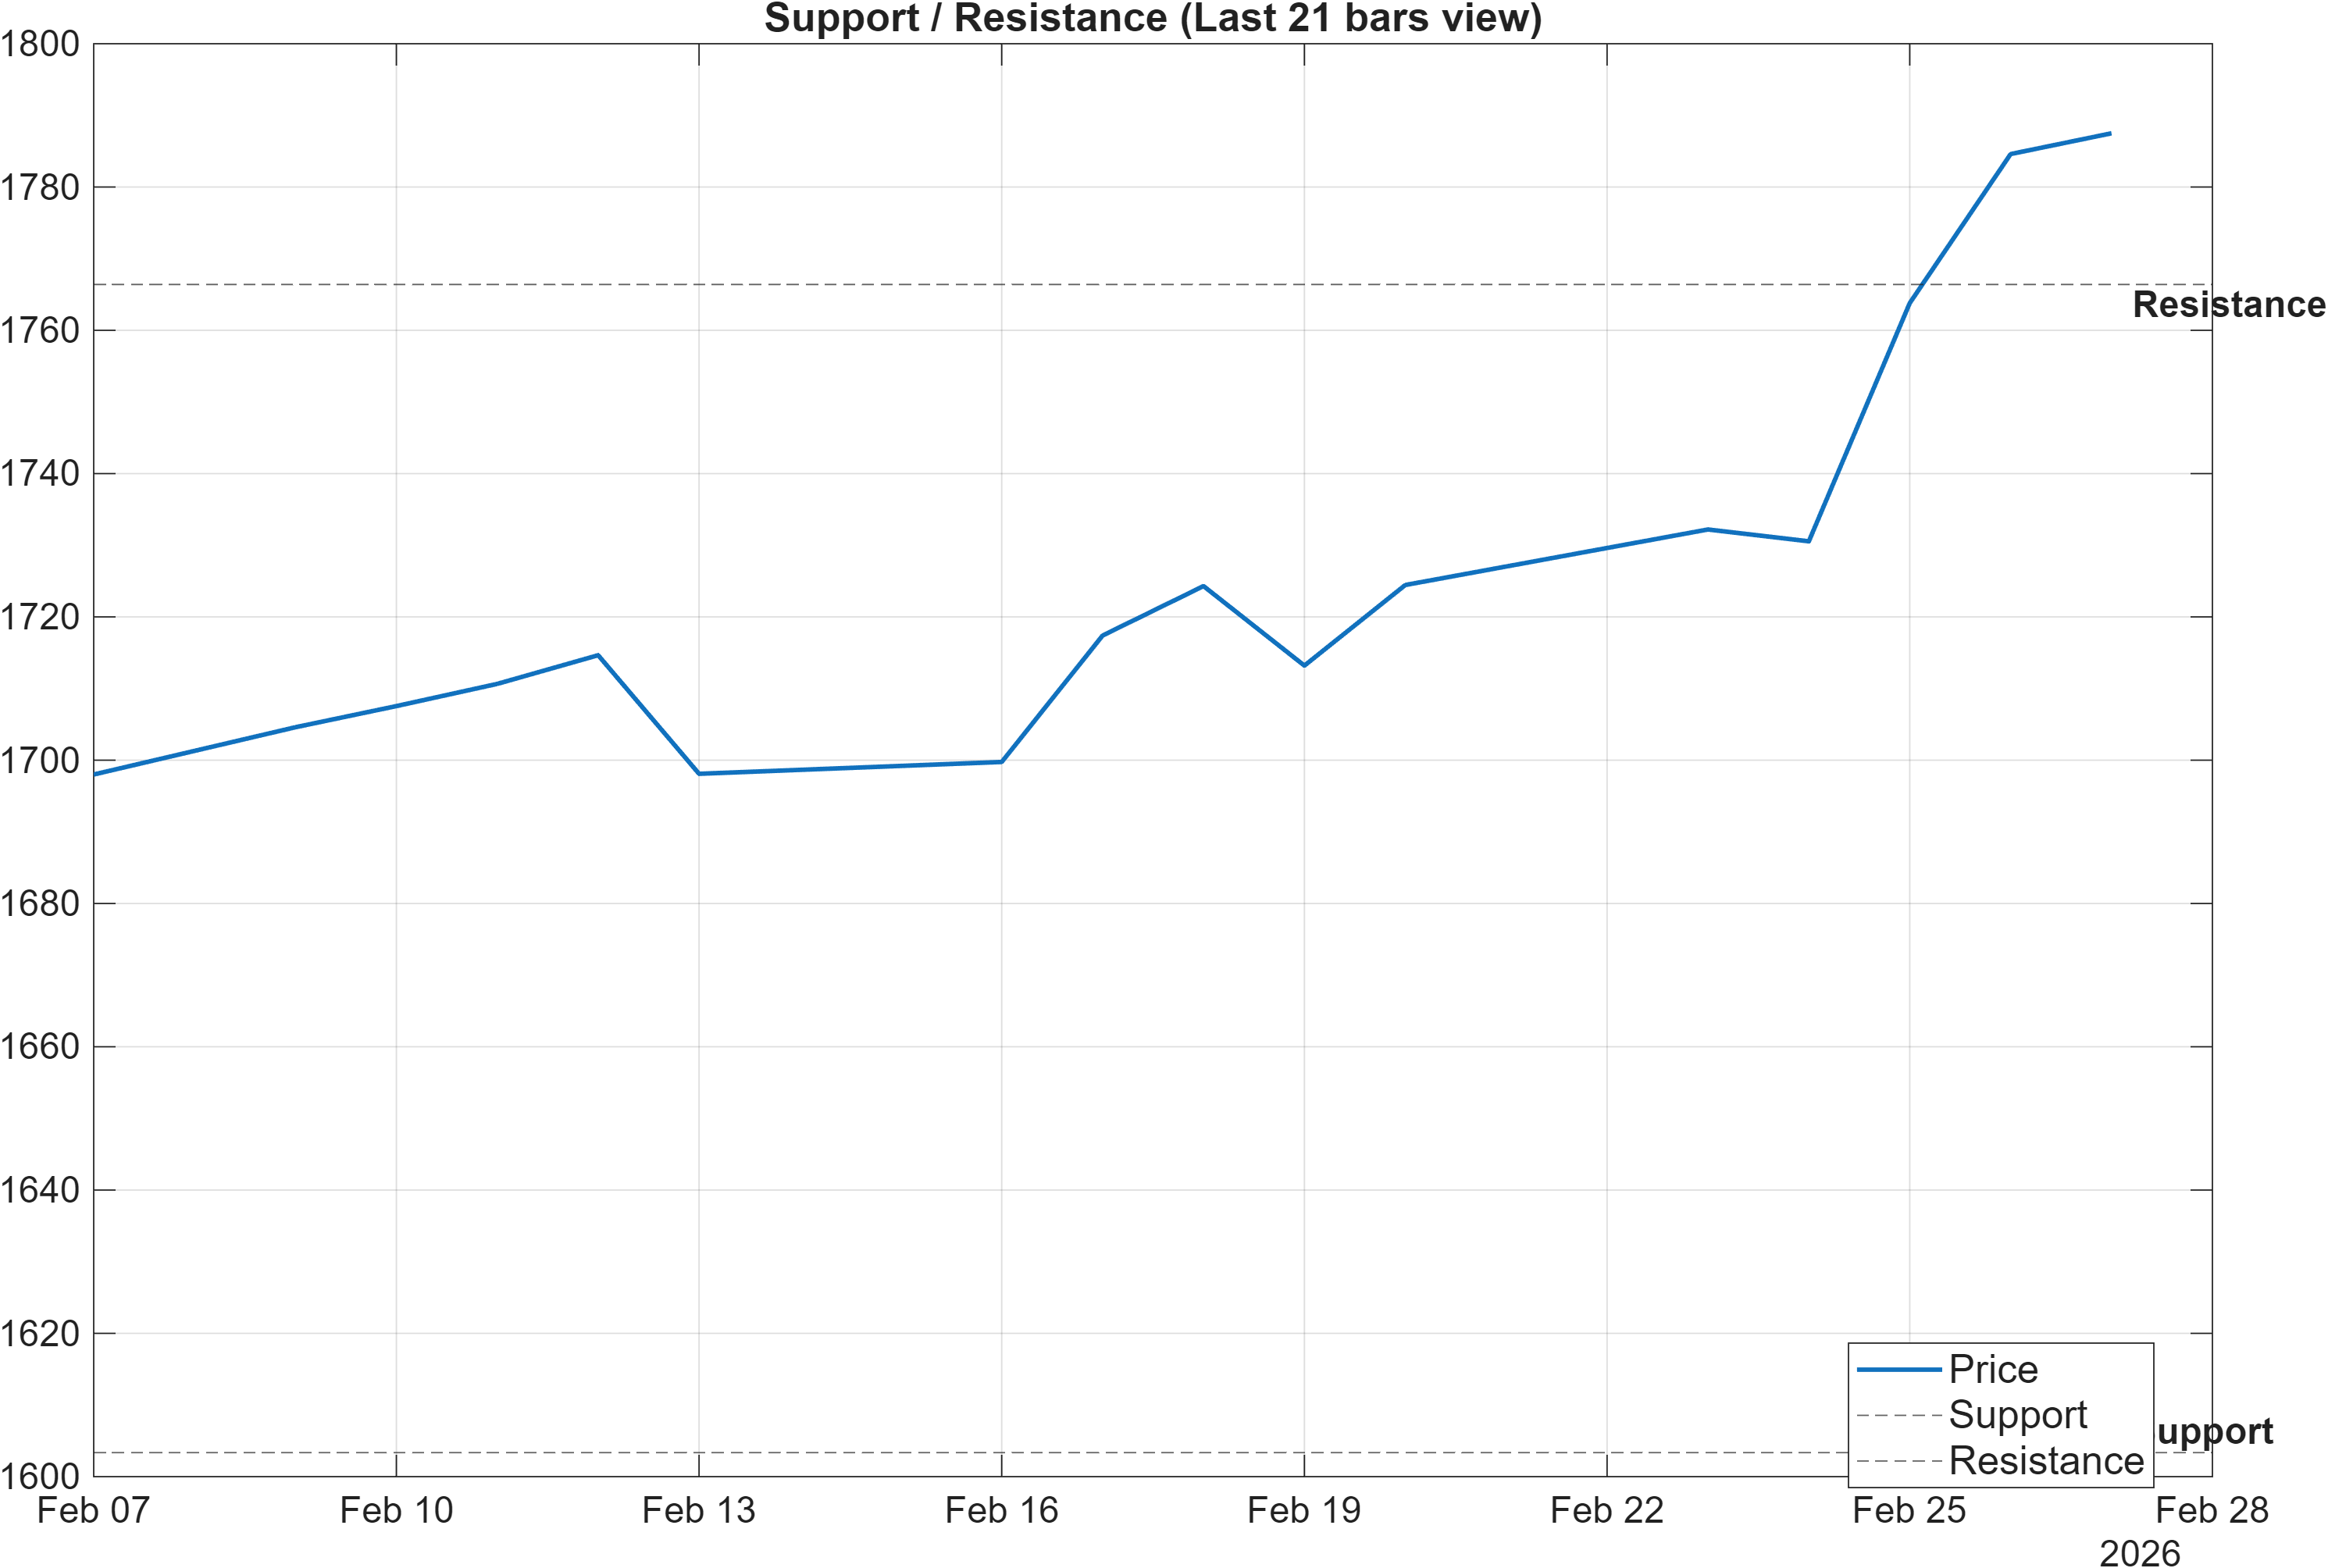
The level structure is the primary decision framework because momentum readings are already extended. With RSI(14) at 88.9 and a positive MACD histogram 6.7140, the market is effectively asking whether strength can convert into a successful regime continuation above 1766.4000, or whether momentum cools into a pullback that tests structure.
The scenario guidance embedded in the report is explicit: a break above resistance with volume implies continuation, while a close below support increases deterioration risk. This framing matters because volatility is not particularly expansive (bandwidth 0.0620), which can make level breaks more meaningful when they occur; narrow-to-moderate bandwidth environments often require a catalyst (participation/volume) to sustain a transition into a higher volatility trend leg.
From a positioning lens, the multi-horizon ranks—weekly #62 and 3-month #38—favor buying interest on constructive tests, but the same ranks also attract crowded momentum participation. Therefore, these zones should be treated as probabilistic rather than deterministic: sustained trade above resistance would improve the probability that the recent leadership persists, while violations of 1603.3500 would challenge the “controlled trend” narrative and shift focus toward risk management.
5) Quant Technical Dashboard (18 Signals)
KGNAI AI Technical Analysis Score (Deep Reinforcement Learning): Rank #237 out of 1223 (Rank 1 represents the strongest technical positioning and a higher probability of favorable price behavior. As ranks increase toward the maximum, the probability of favorable outcomes weakens and bearish positioning becomes more dominant.) | Label: Bullish | Score: 0.612
18-Signal Technical Confluence Score: 0.556 (Bullish)
Overall Technical Score (18-signal confluence + DRL rank blend): 0.573 (Bullish)
Note: The blended score reflects signal strength weighted against broader AI technical ranking, which may temporarily diverge.
Blended technical score breakdown: 0.573 (Bullish | Bull 13 / Bear 3 / Neutral 2)
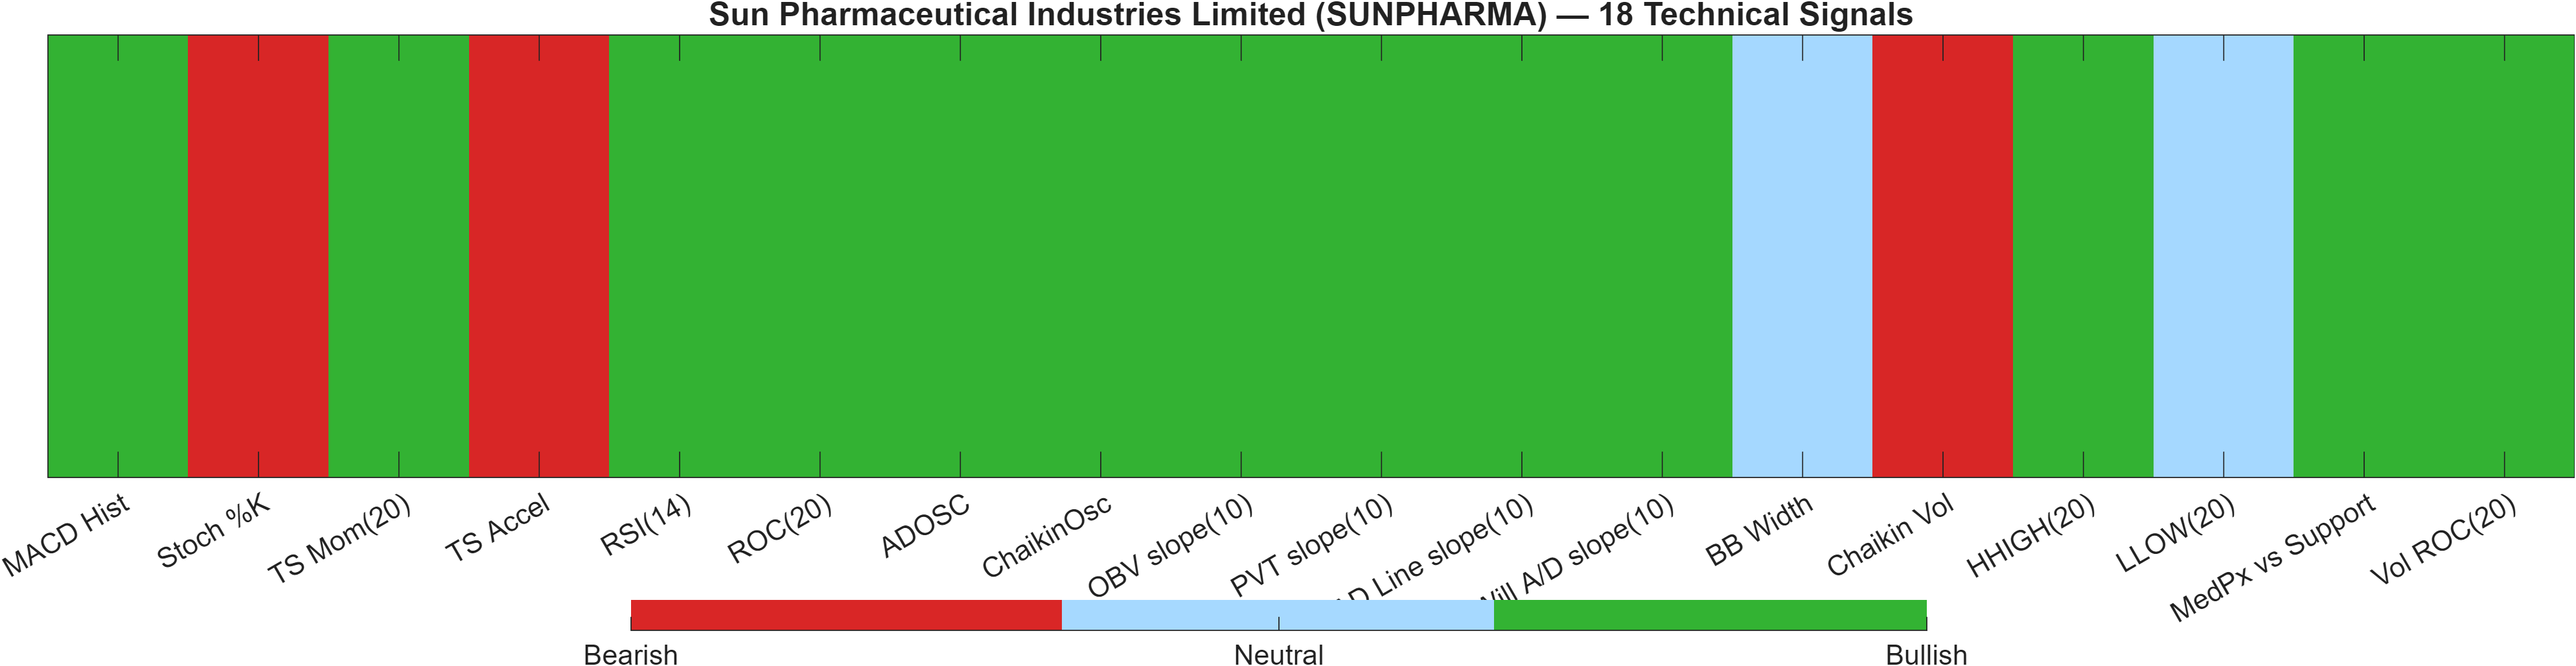
The dashboard’s key message is breadth with pockets of late-cycle tension. The blended view is Bullish with an overall score of 0.573, supported by a confluence score of 0.556 and a DRL Bullish score of 0.612. Importantly, the DRL rank at #237 is constructive but not “front-of-the-book” leadership within 1,223 instruments, which can be consistent with a strong run that is now increasingly dependent on sustained confirmation.
At the indicator level, bullish momentum and participation dominate: MACD Hist 6.714 is Bullish, and accumulation/flow proxies are broadly supportive (for example ADOSC 82.3 and OBV slope(10) 8.835e+05 are Bullish). That combination typically aligns with trend persistence when price advances are being validated by volume-related measures rather than occurring on weak participation.
The counterweights are informative rather than dispositive. Overbought/late-stage signals appear via Stoch %K 91.29 (Bearish) and a negative TS Accel -6 (Bearish), which can be read as momentum deceleration risk even if absolute momentum remains positive. Volatility is not giving a strong directional cue: BB Width 0.06195 is Neutral, aligning with the bandwidth reading in Section 3. Overall, the 13/3/2 Bull-Bear-Neutral split supports the Bullish label, but the bearish subset suggests that continuation is most credible when price action remains responsive around the resistance/support structure.
Signal table (Bull/Bear/Neutral)
| Indicator | Value | Signal |
|---|---|---|
| MACD Hist | 6.714 | Bullish |
| Stoch %K | 91.29 | Bearish |
| TS Mom(20) | 83.3 | Bullish |
| TS Accel | -6 | Bearish |
| RSI(14) | 88.9 | Bullish |
| ROC(20) | 5.067 | Bullish |
| ADOSC | 82.3 | Bullish |
| ChaikinOsc | 1.785e+05 | Bullish |
| OBV slope(10) | 8.835e+05 | Bullish |
| PVT slope(10) | 3708 | Bullish |
| AD Line slope(10) | 6.124e+05 | Bullish |
| Will A/D slope(10) | 92.8 | Bullish |
| BB Width | 0.06195 | Neutral |
| Chaikin Vol | 17.24 | Bearish |
| HHIGH(20) | 1792 | Bullish |
| LLOW(20) | 1694 | Neutral |
| MedPx vs Support | 172.5 | Bullish |
| Vol ROC(20) | 7.361 | Bullish |
Interpretation: Indicator-level signals form the base confluence, which is then adjusted using a separate AI-driven technical ranking model. The final technical score summarizes this combined view.
6) News sentiment + extractive gist
Note: Instrument-specific news matches were not found, so the digest includes broader market/sector headlines. Links are provided for verification.
Sentiment score (avg): 0.140 | Positive: 50% | Neutral: 38% | Negative: 12%
KGNAI AI News Sentiment Score (normalized -1 to +1): 1.00 (as of 2026-02-19) | Label: Bullish | Overall news score: 0.87
Positive Developments
Recent coverage across major financial outlets indicates a constructive risk tone in parts of global equities, with reports pointing to record highs in select benchmarks and earnings-related support in financials. Within India-facing market chatter, attention has also centered on trade setup commentary (short-horizon positioning and breakout frameworks), which can reinforce tactical participation when technical conditions are already strong. This backdrop aligns with SUNPHARMA’s technical posture—Bullish ranks across horizons (including weekly #62 and 3-month #38) and a Bullish blended technical score of 0.573—even though the news items are not instrument-specific. In aggregate, the positive stream functions less as a fundamental catalyst and more as a sentiment tailwind that can keep dip-buying behavior intact, especially if price remains supported above 1603.3500.
Neutral / Mixed Developments
A meaningful portion of the digest is informational, emphasizing market plumbing and investor-protection messaging. Coverage has highlighted regulatory warnings about fraudulent communications and the importance of verification, which is generally neutral for price but relevant for market participation behavior. There is also macro-oriented reporting that frames labor-market conditions as stable, which can be interpreted as supportive for risk assets but not decisively directional. This “mixed but orderly” tone is broadly consistent with the technical volatility picture: Bollinger bandwidth at 0.0620 and BB Width 0.06195 (Neutral) suggest the market is not pricing a disorderly regime shift. In that context, neutral news flow tends to act as background rather than a driver, leaving technical levels—1766.4000 and 1603.3500—as the more immediate decision points.
Negative / Risk Signals
Risk items in the feed lean toward market choppiness and episodic downside catalysts in individual names, alongside reminders of fraud-related activity that can dampen retail risk-taking at the margin. While these stories are not specific to SUNPHARMA, they can contribute to short-lived de-risking across broader indices—relevant when SUNPHARMA’s momentum is already elevated (RSI(14) 88.9) and stochastic conditions show overbought tension (Stoch %K 91.29, Bearish). In such setups, negative macro or market-structure headlines do not need to be severe to trigger a compression-to-pullback phase. The key analytical risk is therefore less about the news itself and more about timing sensitivity: if price loses the 1603.3500 support area, the probability of signal deterioration increases even if the broader rank stack remains Bullish.
- Whether price acceptance develops above 1766.4000 alongside volume confirmation.
- Whether momentum cools from RSI(14) 88.9 without breaking structure near 1603.3500.
- Whether volatility transitions from bandwidth 0.0620 into expansion (trend continuation) or remains contained (range risk).
Sources referenced: Reuters, Bloomberg, Yahoo Finance, MarketWatch, Investing.com
Snapshot: AI Rank (Short–Mid–Long): Bullish (Bullish–Bullish–Bullish) · Technical Confluence: Bullish · Key Levels: Support ~1603.35 | Resistance ~1766.40 · News Sentiment: Neutral
7) Sources
Not available in the provided data.
You may also like: How KGNAI AI ranks instruments across global markets
Disclaimer: KGNAI provides AI-generated analytics and educational market commentary only. This is not financial advice. Markets involve risk. Always do your own research.