
IEX (Indian Energy Exchange Ltd) — 26-Apr-2026 Quant View: Long-Term Rank Strength vs Bearish Technical Confluence
Indian Energy Exchange Ltd (IEX) sits in a nuanced setup where cross-horizon KGNAI ranks remain constructive longer-term, while current indicator confluence leans defensive. Within a 1222-instrument India universe, the 6‑Monthly and Yearly ranks (#7 and #34) place IEX in a strong relative cohort, but the Daily and Weekly ranks (#761 and #789) are neutral, consistent with a near-term cooling phase. The blended technical picture is bearish (18‑signal confluence at -0.444; overall technical score -0.522), reinforced by momentum pressure (MACD histogram -1.1691; RSI(14) 36.75). Volatility is not extreme (Bollinger bandwidth 0.1110), suggesting the market may be in a contained regime where level-based confirmation matters. Key reference zones remain Support ~115.9167 and Resistance ~132.6000, with news sentiment modestly positive (avg 0.148; normalized 1.00) but best treated as contextual rather than decisive.
Key Takeaways
- Rank stance: Short Neutral (Daily #761 / Weekly #789) | Mid Neutral (Monthly #390 / 3‑Monthly #436) | Long Bullish (6‑Monthly #7 / Yearly #34)
- Technical confluence: Bearish (Overall Technical Score -0.522; 18‑signal -0.444)
- Key levels: Support ~ 115.9167 | Resistance ~ 132.6000
- News sentiment bias: slightly constructive (avg 0.148; normalized 1.00), but not a substitute for price confirmation
- Confirmation / invalidation condition: A sustained break above 132.6000 with volume supports continuation; a close below 115.9167 elevates deterioration risk
What KGNAI Measures
KGNAI evaluates assets using large cross-sectional datasets built from millions of structured data points. Inputs incorporate fundamental metrics, technical structures, and systematically processed news sentiment. Statistical models, machine learning, and AI frameworks are used to assess relative positioning, signal alignment, and probabilistic behavior across broad universes.
How to Read This Report
- Ranks are comparative across the tracked universe, not absolute price targets.
- Confluence reflects alignment among independent signal groups.
- Support/resistance levels are probabilistic decision zones, not guarantees.
- Sentiment provides contextual bias within the broader analytical framework.
1) KGNAI AI Analysis
Region: INDIA
Total universe size: 1222 ranked instruments
- Daily rank: #761 out of 1222 — Neutral
- Weekly rank: #789 out of 1222 — Neutral
- Monthly rank: #390 out of 1222 — Neutral
- 3-Monthly rank: #436 out of 1222 — Neutral
- 6-Monthly rank: #7 out of 1222 — Bullish
- Yearly rank: #34 out of 1222 — Bullish
The rank curve is time-horizon split: near-term ranks sit in the lower-middle of the distribution (Daily #761; Weekly #789), while the long-term ranks are in the top decile (6‑Monthly #7) and strong upper cohort (Yearly #34). That combination typically signals that recent price behavior has softened relative to peers without fully dislodging the longer-run relative standing. The mid-range ranks (Monthly #390; 3‑Monthly #436) reinforce this “cooling within a larger constructive regime” interpretation rather than a uniform trend shift across horizons.
The declared term view also reflects this separation: Short-term Neutral, Mid-term Neutral, Long-term Bullish. Practically, this places emphasis on persistence: if the Daily/Weekly ranks remain elevated while the Monthly rank deteriorates from #390, that would represent a broader regime slippage. Conversely, stabilization of short-term ranks while the 6‑Monthly rank remains near #7 would be consistent with the long-horizon thesis staying intact.
Alignment is currently incomplete: ranks argue for longer-horizon relative strength, but they do not yet confirm an immediate bullish impulse. That makes level-based confirmation (Support 115.9167; Resistance 132.6000) and indicator reversal behavior (RSI 36.75; MACD histogram -1.1691) especially relevant in the sections that follow.
2) Price & trend overview
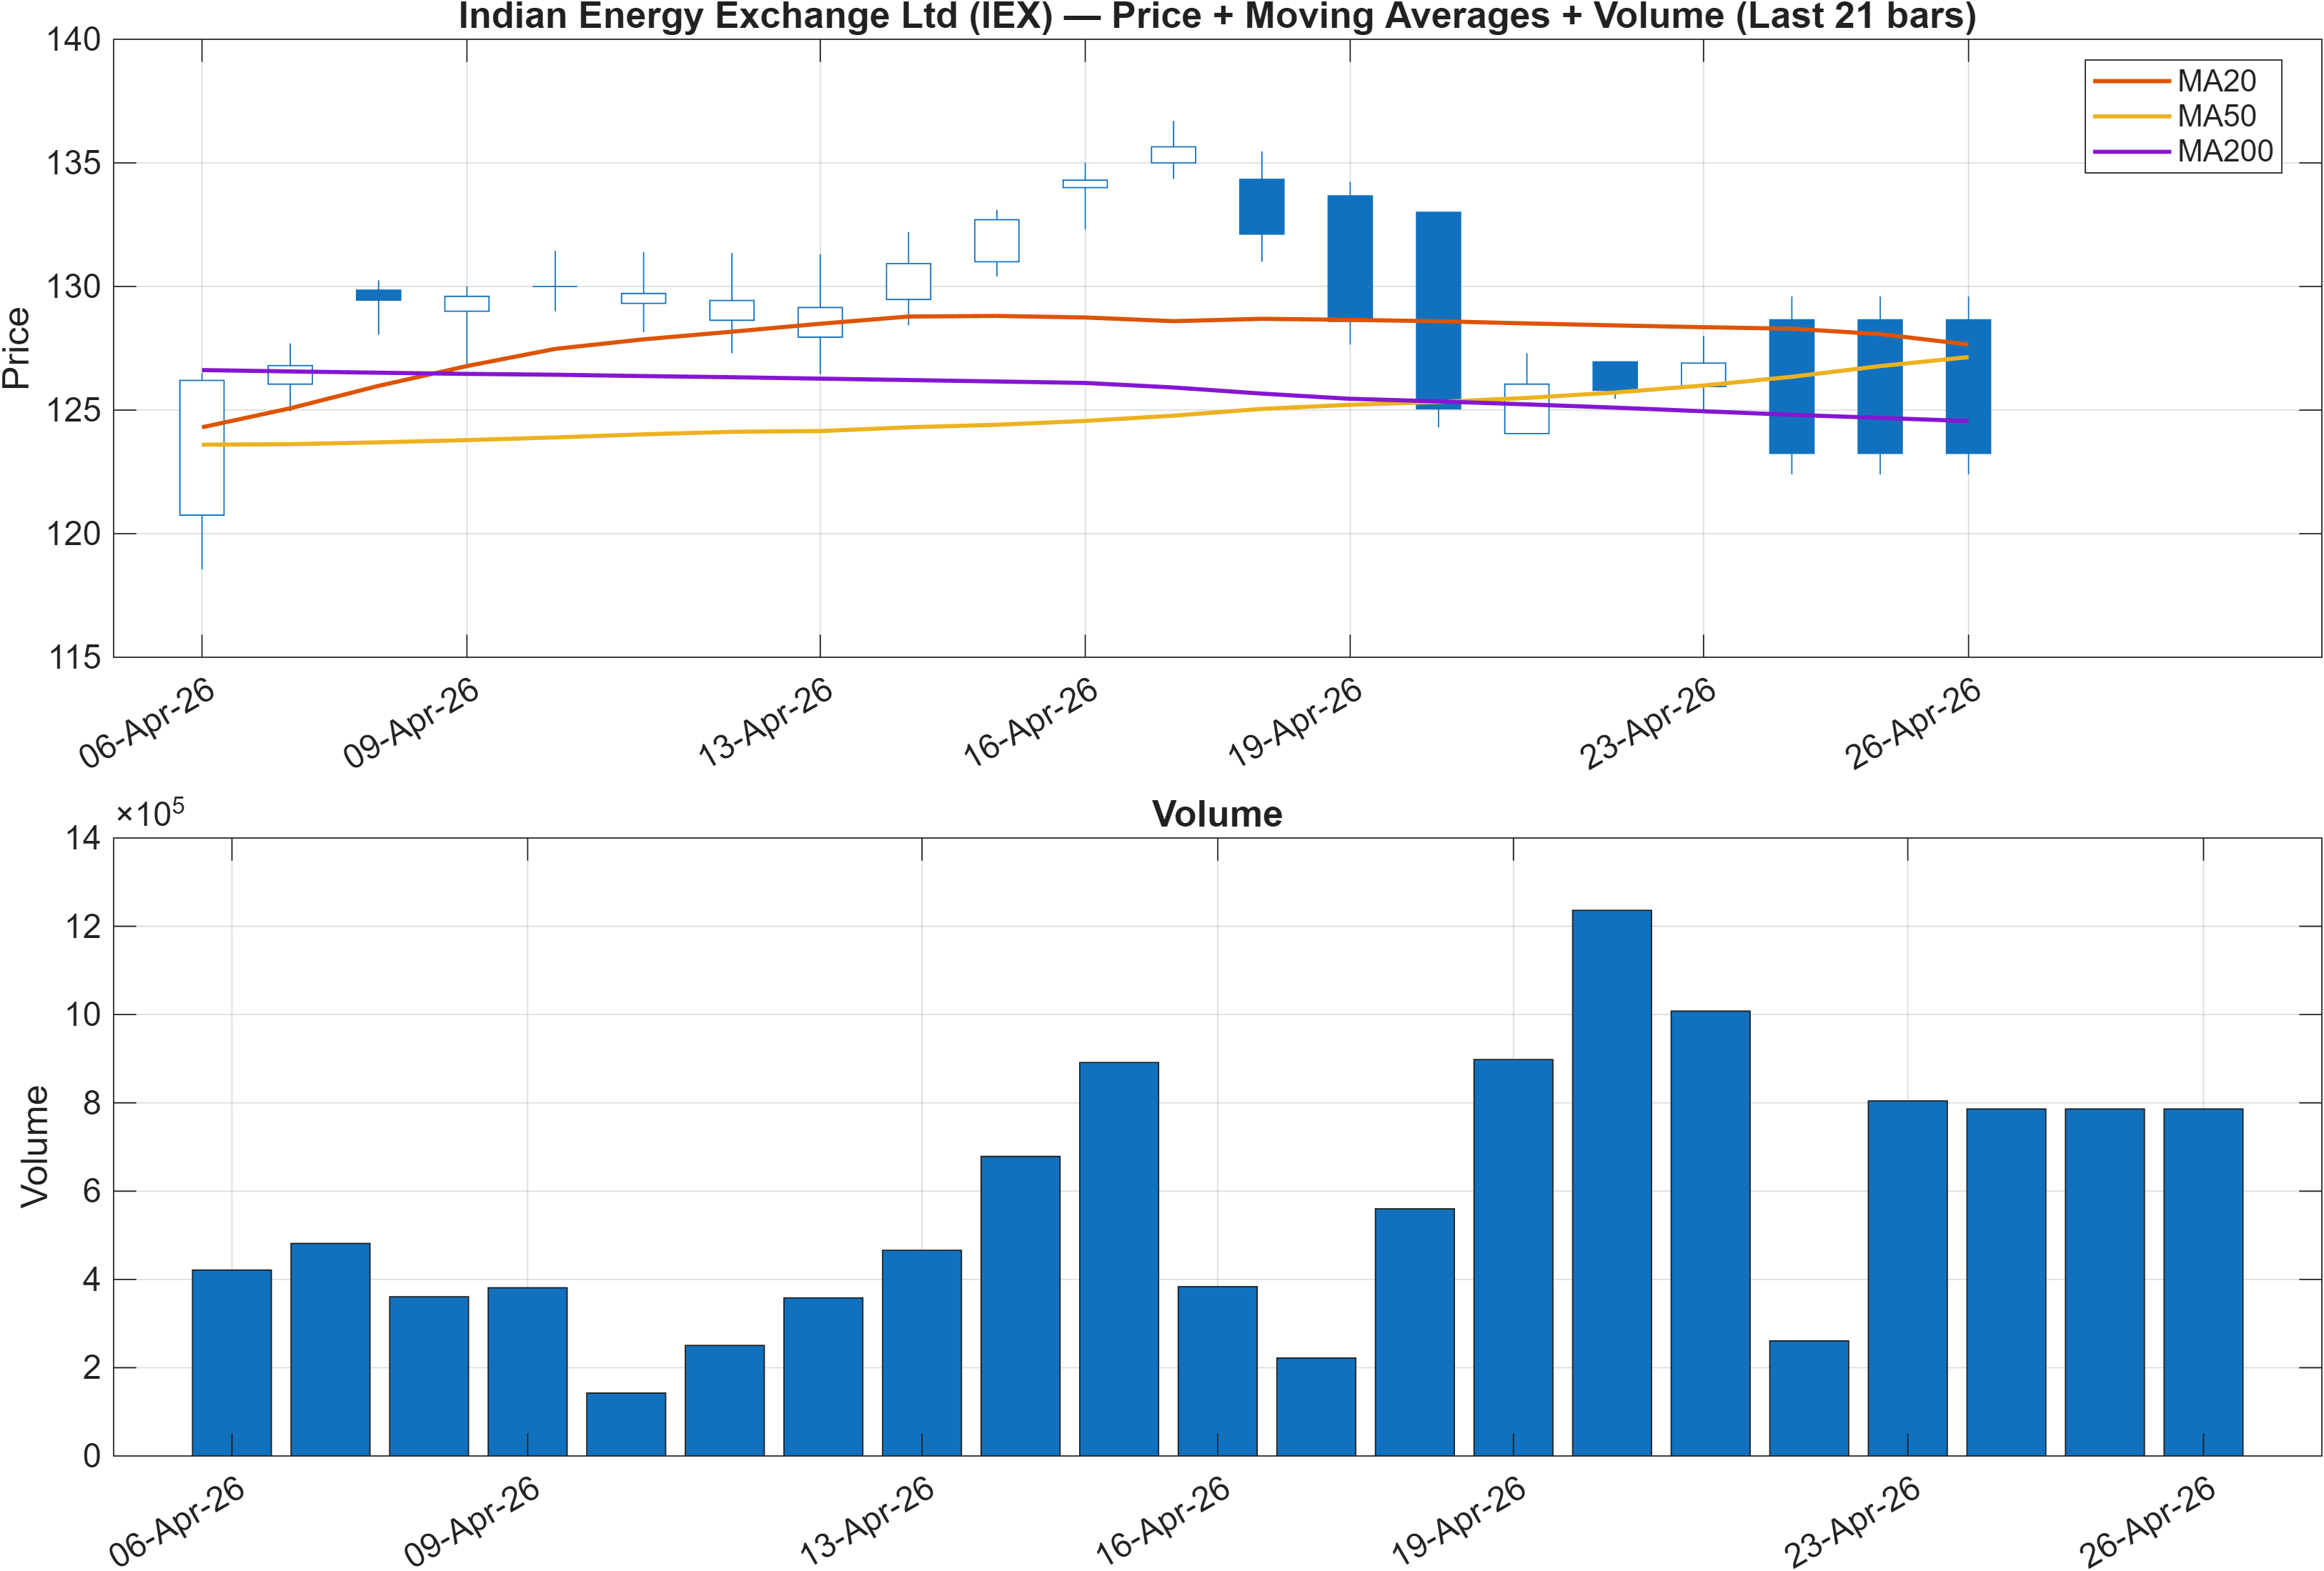
Interpretation: Close vs MA50 = Bearish, MA50 vs MA200 = Bullish.
Trend structure is best described as mixed by timeframe. The close sitting below the MA50 is a near-term bearish condition, often associated with weaker short-cycle participation and slower follow-through on rallies. At the same time, MA50 above MA200 remains bullish, which typically indicates the longer moving-average stack has not fully rolled over into a confirmed downtrend regime.
This “short-term below MA50, but MA50 above MA200” configuration tends to behave like a trend digestion phase: the market is correcting or consolidating while the longer-term bias still leans constructive. That framing is consistent with the rank split where Daily (#761) and Weekly (#789) are neutral while long-horizon ranks remain strong (#7 over 6‑months; #34 yearly).
The practical analytical question becomes whether price can re-assert above the MA50 while holding above the probabilistic support zone at 115.9167. Failure to hold that support would shift emphasis away from “pullback within trend” toward “trend damage,” especially if accompanied by continued negative momentum readings such as MACD histogram -1.1691 and an RSI(14) in the 36.75 area (a zone that frequently coincides with weaker risk appetite).
Conversely, reclaiming momentum alongside a move toward 132.6000 would better align the short-term price/MA condition with the still-bullish longer-term MA relationship. Until that occurs, the trend view remains conditional rather than directional.
3) Momentum & volatility dashboard
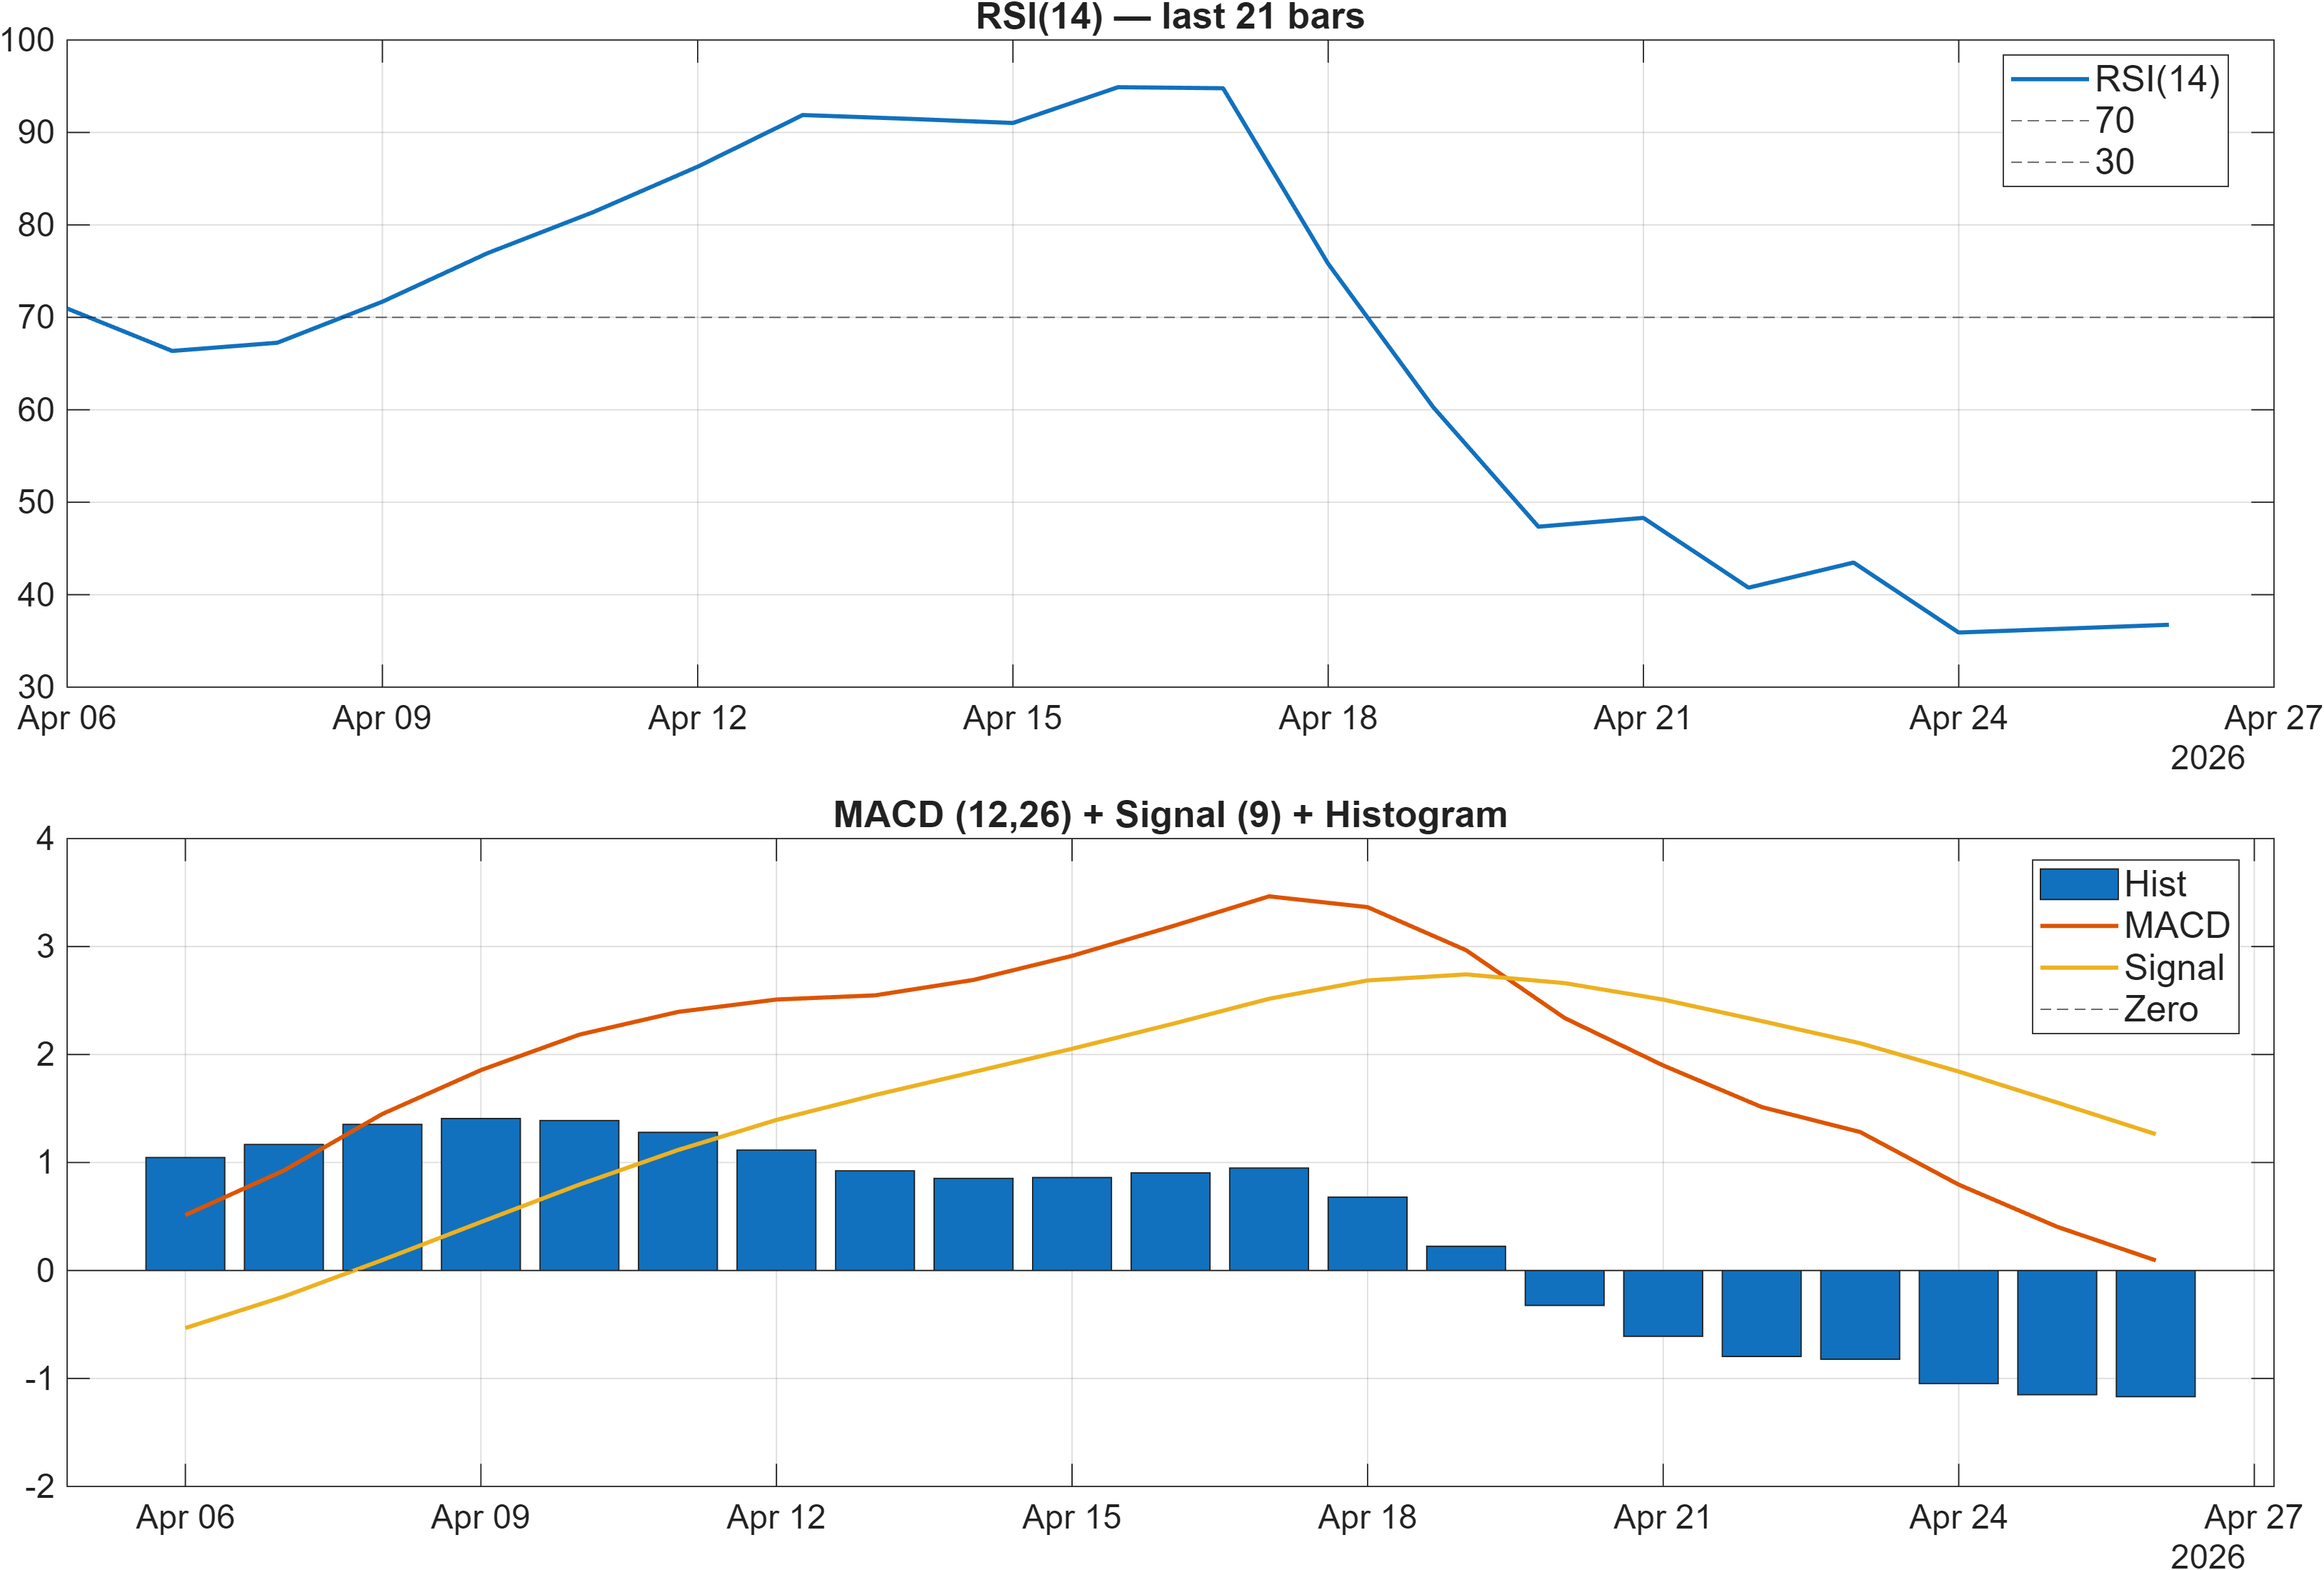
Interpretation: RSI bias = Bearish, MACD hist = -1.1691.
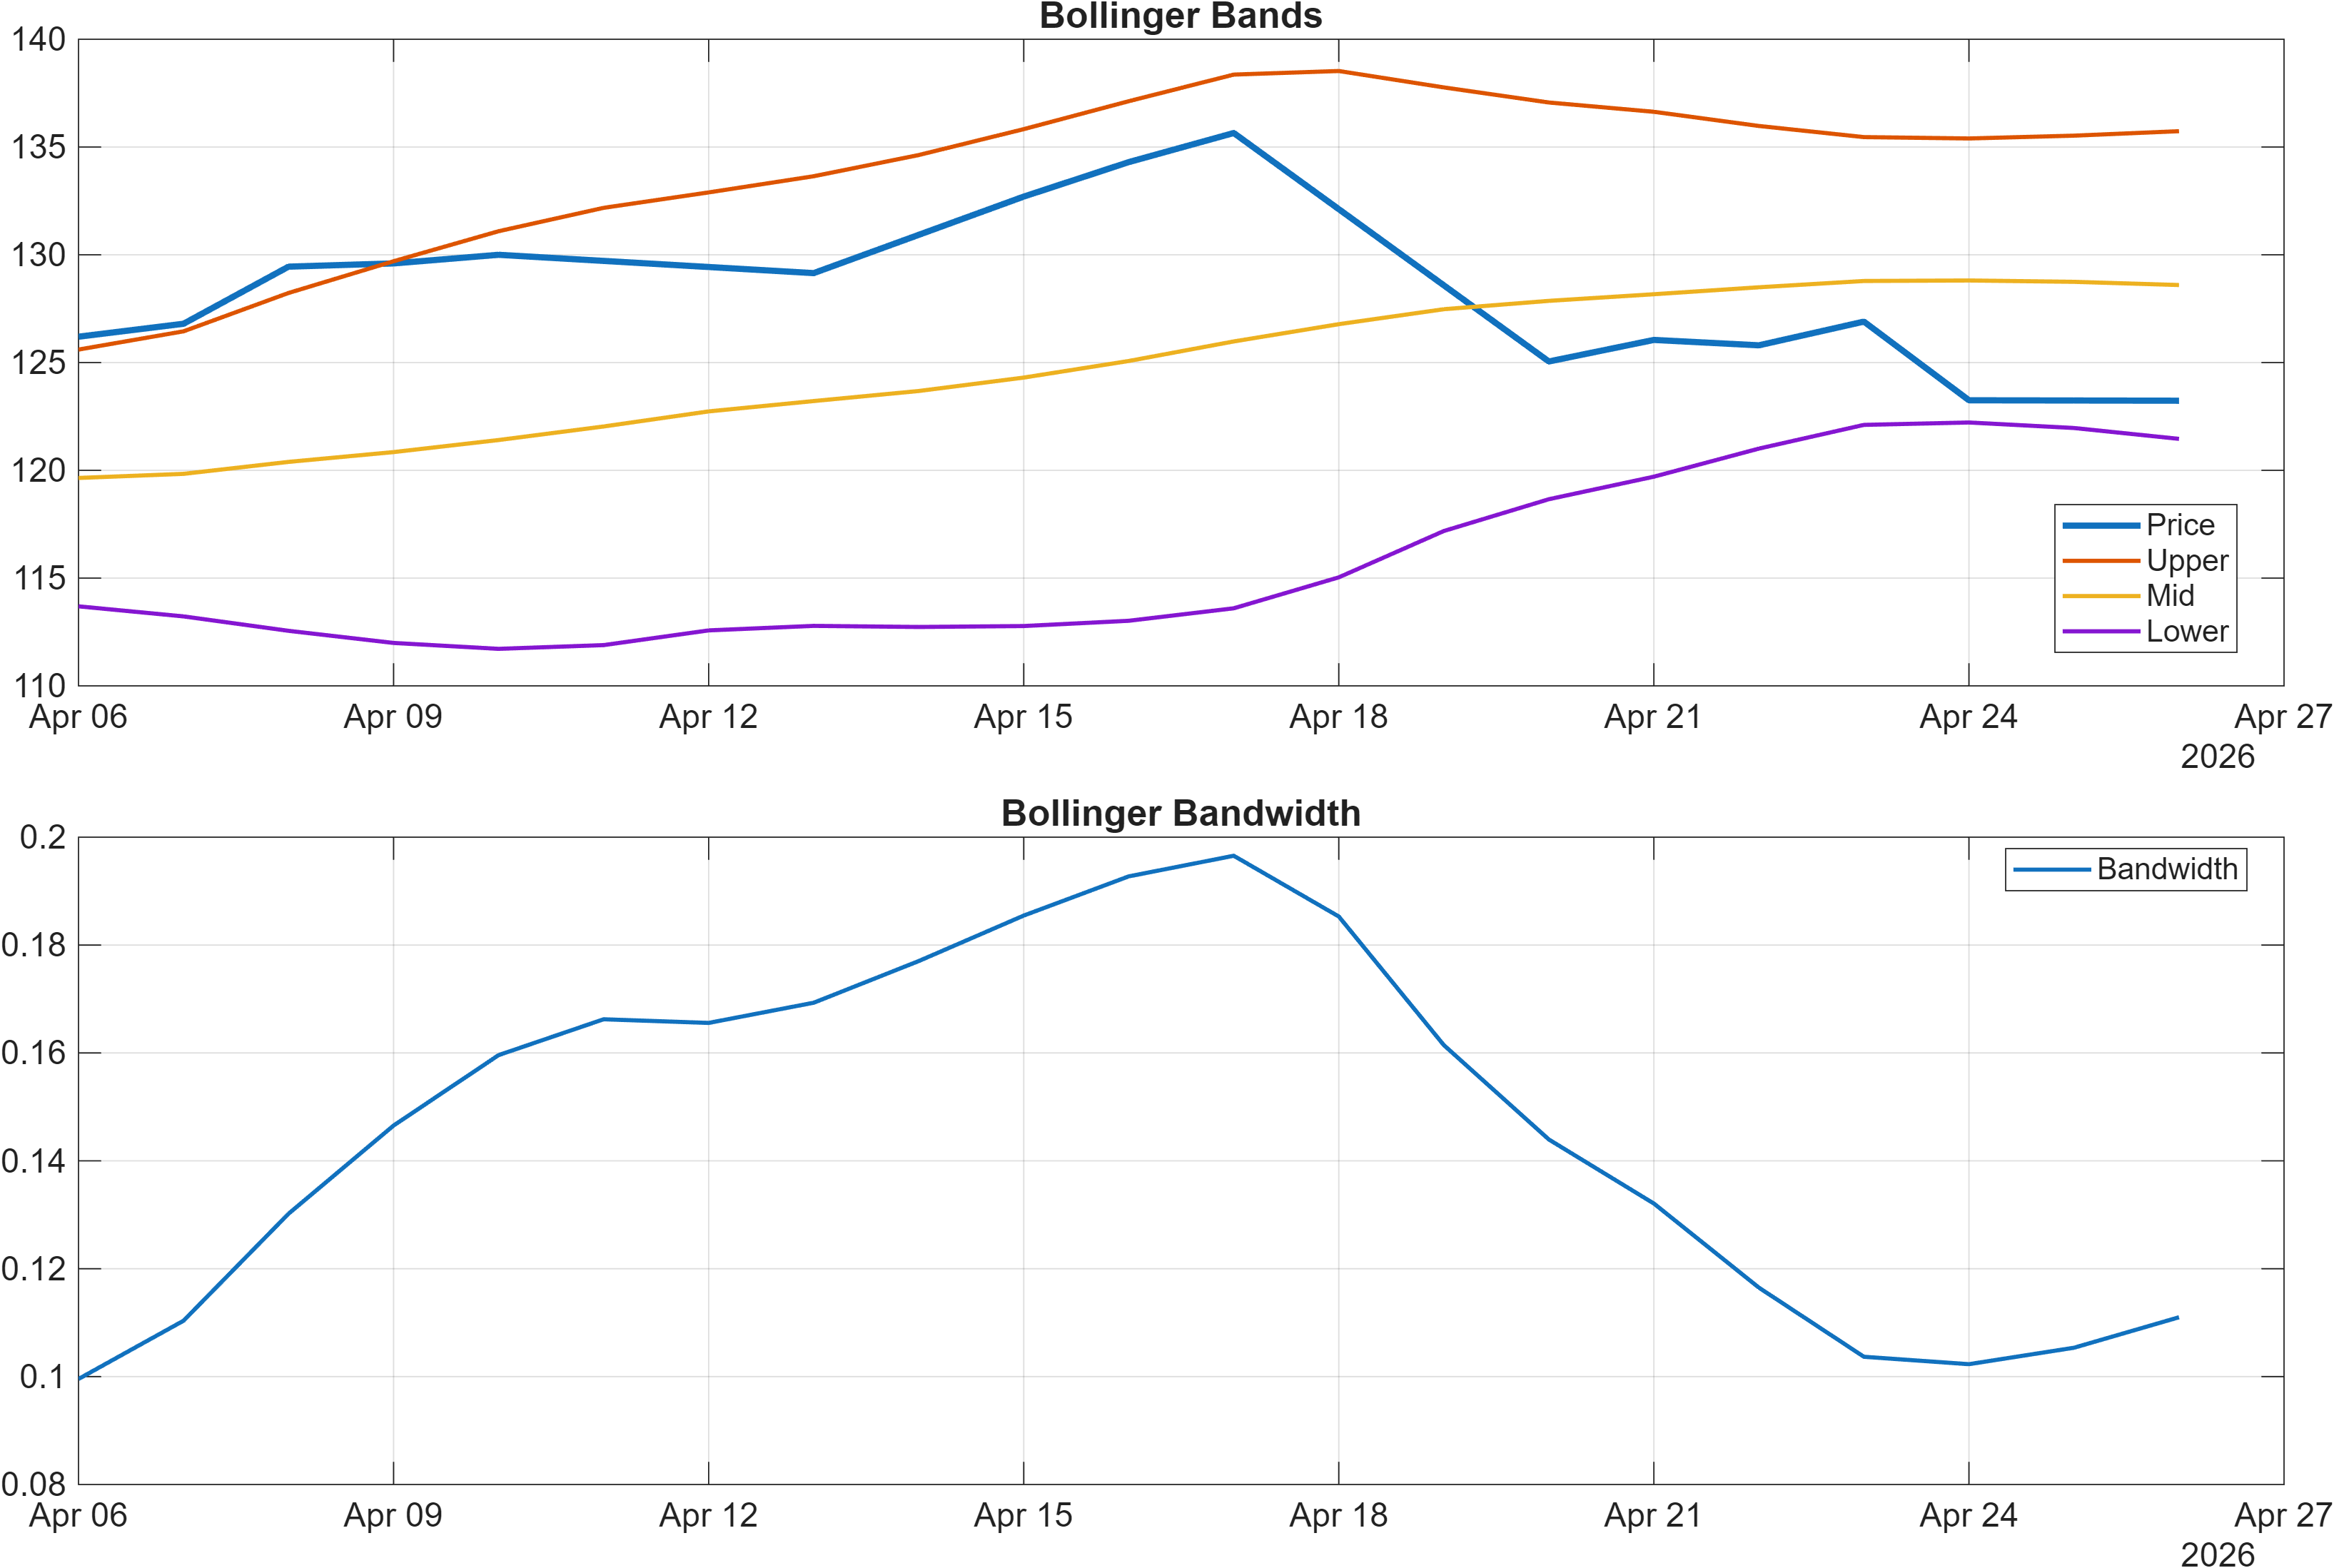
Interpretation: Bandwidth (volatility regime) latest = 0.1110.
Momentum signals are presently tilted to the downside. RSI(14) at 36.75 sits in a bearish bias region, indicating that recent average losses have dominated average gains. The MACD histogram at -1.1691 reinforces that weakness by showing negative momentum pressure relative to the slower trend component. Together, these two indicators align with the bearish close-versus-MA50 condition noted in the trend section.
Volatility, however, appears comparatively contained rather than expanding aggressively. Bollinger bandwidth at 0.1110 suggests a regime that is not exhibiting extreme dispersion. This matters because momentum deterioration during non-expanding volatility can sometimes reflect orderly de-risking or consolidation rather than capitulation. In such environments, support/resistance zones can carry higher decision value, and reversals often require clearer confirmation (e.g., RSI recovering from the mid‑30s back into more neutral territory, or MACD histogram moving toward zero).
A notable nuance from the broader technical dashboard is that not all oscillators are uniformly negative: Stoch %K is 5.944 with a bullish signal, which can occur when price is stretched to the downside on a short lookback. That does not negate RSI/MACD weakness; rather, it highlights potential short-cycle mean reversion inside a still-soft momentum backdrop. If any bounce fails below resistance (132.6000) and momentum remains negative, the bounce would read as corrective rather than trend-reinstating.
Net read: momentum is weak, volatility is moderate, and the path to improving signal quality likely runs through incremental indicator repair rather than a volatility-driven impulse.
4) Support / Resistance zones
Support ~ 115.9167 | Resistance ~ 132.6000
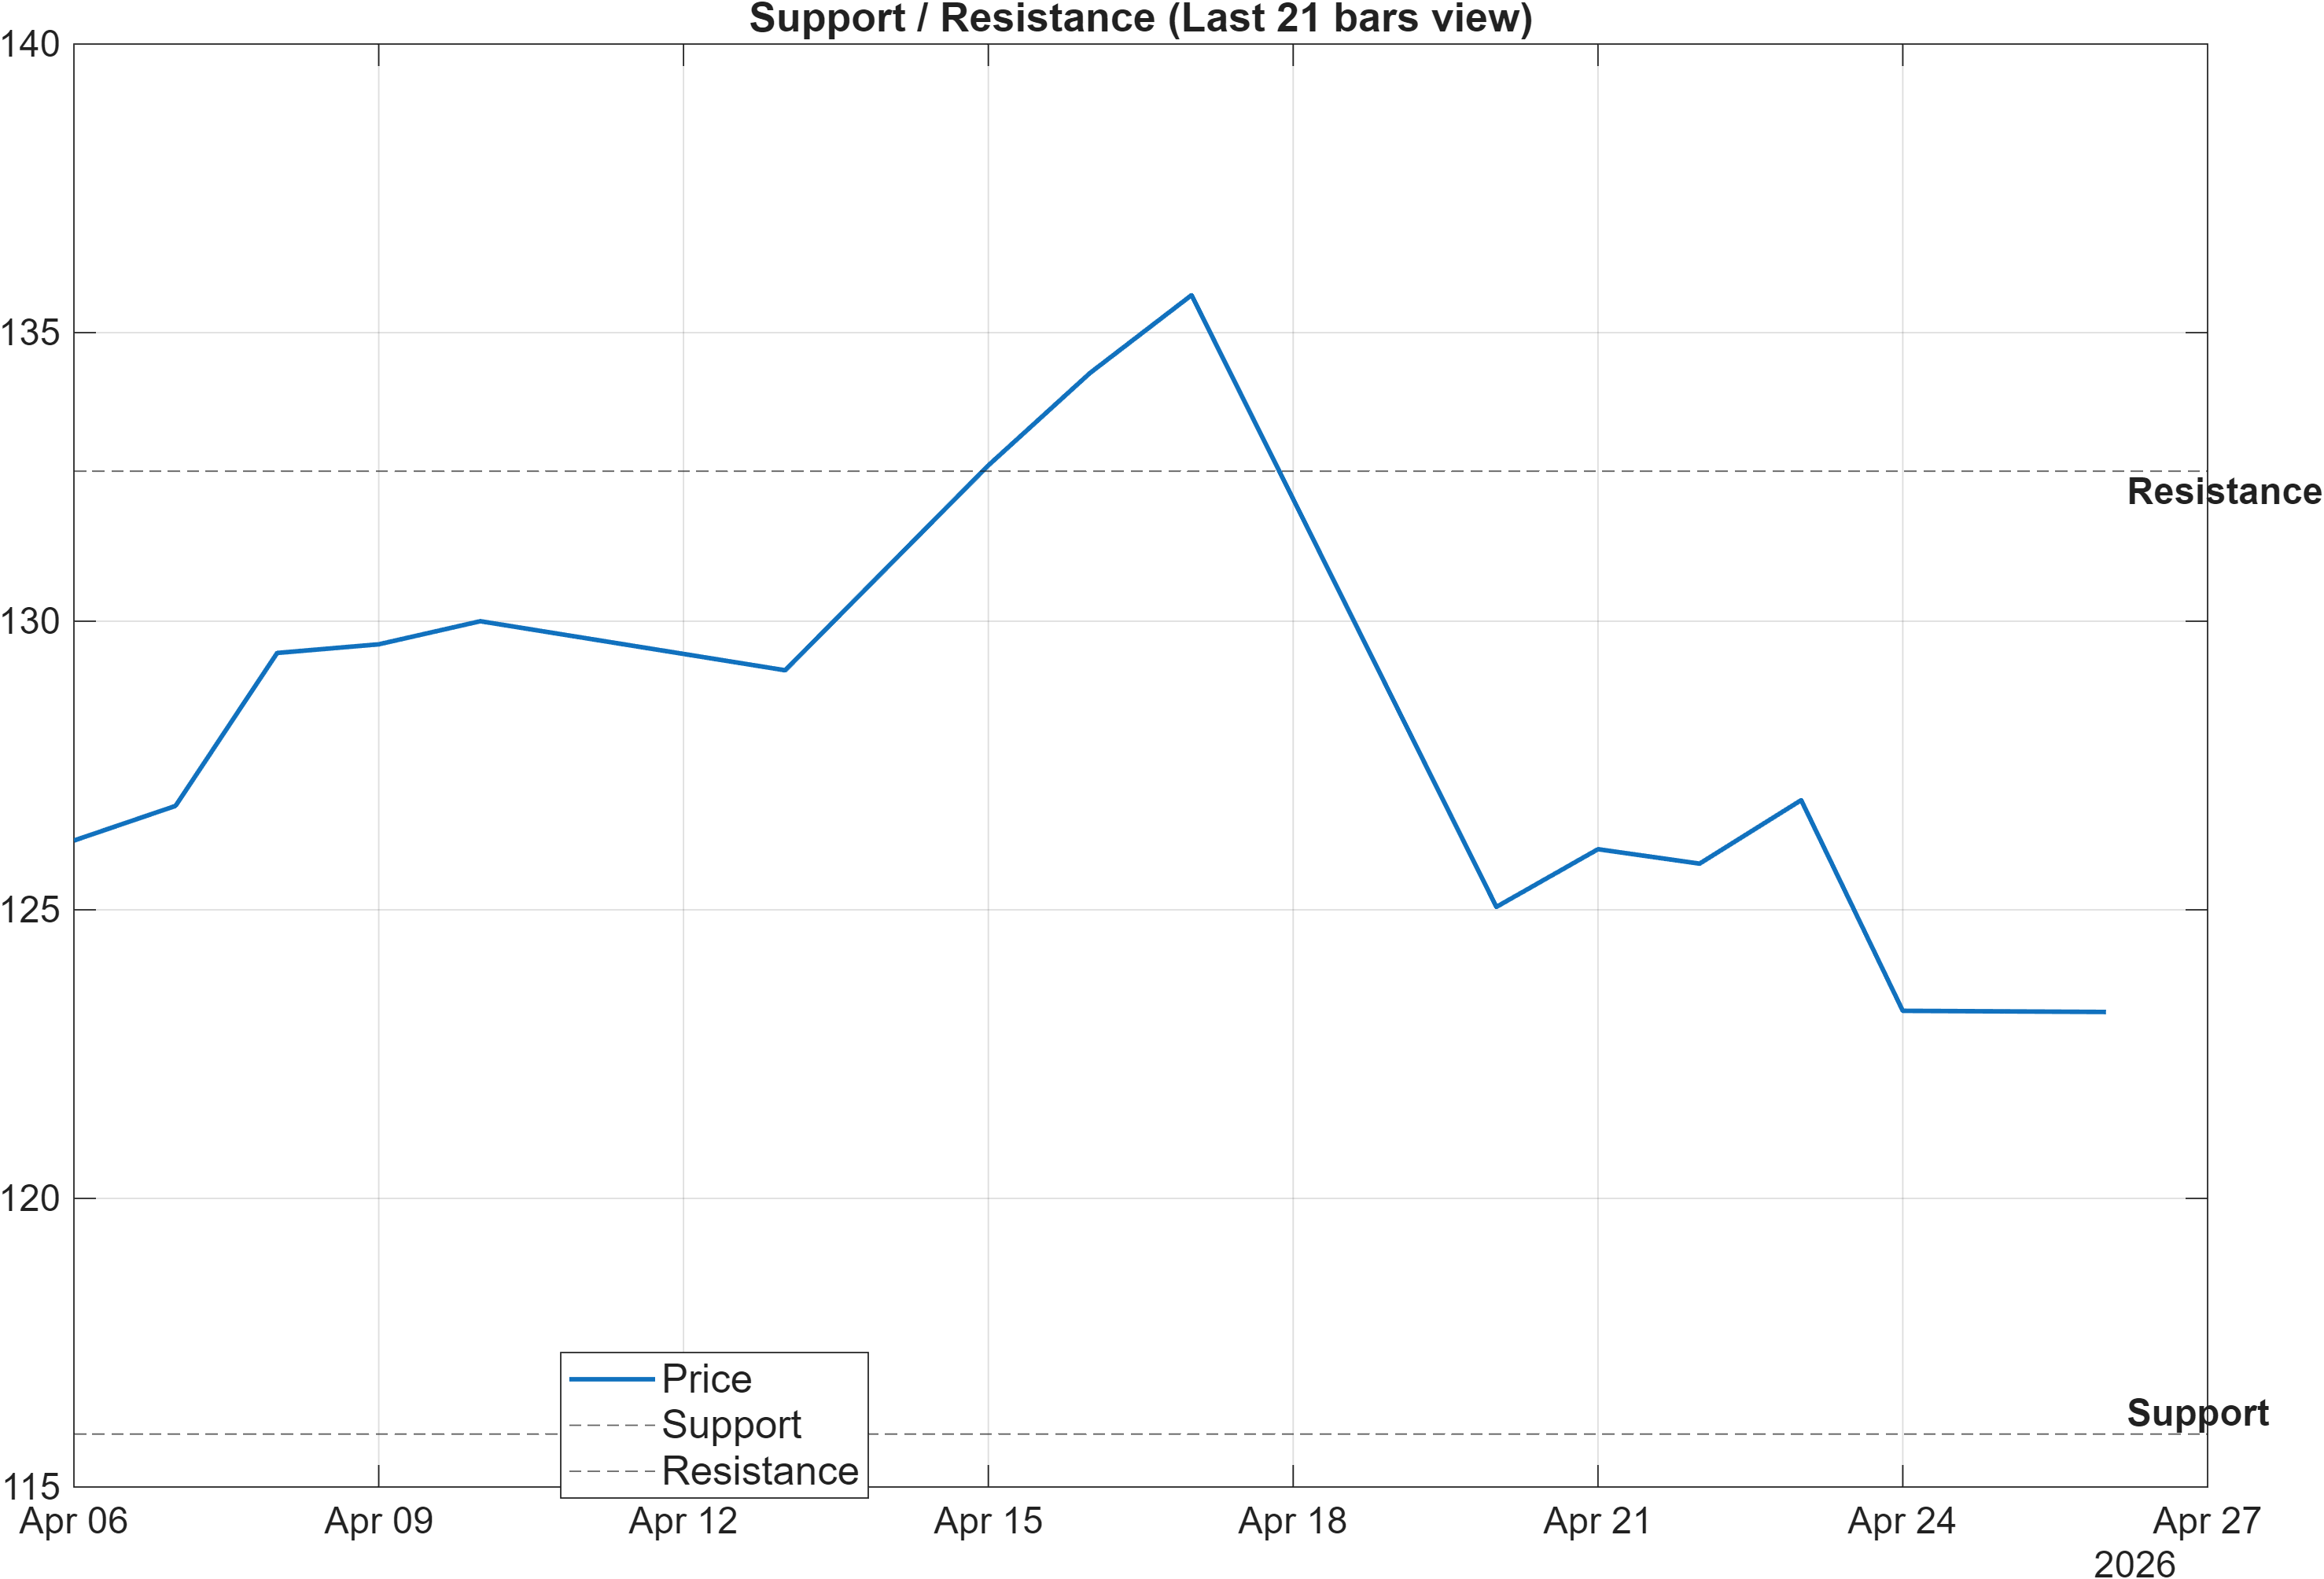
Scenario view: Break above resistance with volume → continuation. Close below support → signal deterioration risk.
The current market structure can be framed as a two-zone decision map. The support region around 115.9167 acts as the primary downside reference: if price closes below this level, the risk is that the already-bearish momentum profile (RSI(14) 36.75; MACD histogram -1.1691) translates into deeper trend impairment rather than a contained pullback. In that case, the short-term neutral ranks (#761 daily; #789 weekly) could be pressured into weaker territory, reducing the probability that the longer-term rank strength remains dominant in practice.
On the upside, resistance near 132.6000 is the key level for confirming that the market is transitioning from “oversold/weak momentum” into a more durable recovery. The scenario language is explicit: a break above resistance with volume implies continuation. This emphasis is consistent with the signal table’s mixed volume/flow messages—ADOSC is bullish at 12.5, yet multiple slope-based accumulation/distribution measures remain bearish (e.g., OBV slope(10) -1.707e+06). A convincing upside resolution typically benefits from broader agreement across flow metrics rather than isolated positives.
The distance between the two zones also matters for trade management and signal validation. With volatility bandwidth at 0.1110 (not extreme), price may oscillate without immediately forcing a breakout. That makes failed tests important: repeated inability to sustain above intermediate pivots (not provided in the data) often keeps the market anchored to the 115.9167–132.6000 range logic.
The key structural question is whether the next directional move is accompanied by improved breadth in technical confirmations, rather than a level break that lacks follow-through.
5) Quant Technical Dashboard (18 Signals)
KGNAI AI Technical Analysis Score (Deep Reinforcement Learning): Rank #1040 out of 1222 (Rank 1 represents the strongest technical positioning and a higher probability of favorable price behavior. As ranks increase toward the maximum, the probability of favorable outcomes weakens and bearish positioning becomes more dominant.) | Label: Bearish | Score: -0.702
18-Signal Technical Confluence Score: -0.444 (Bearish)
Overall Technical Score (18-signal confluence + DRL rank blend): -0.522 (Bearish)
Note: The blended score reflects signal strength weighted against broader AI technical ranking, which may temporarily diverge.
Blended technical score breakdown: -0.522 (Bearish | Bull 4 / Bear 12 / Neutral 2)
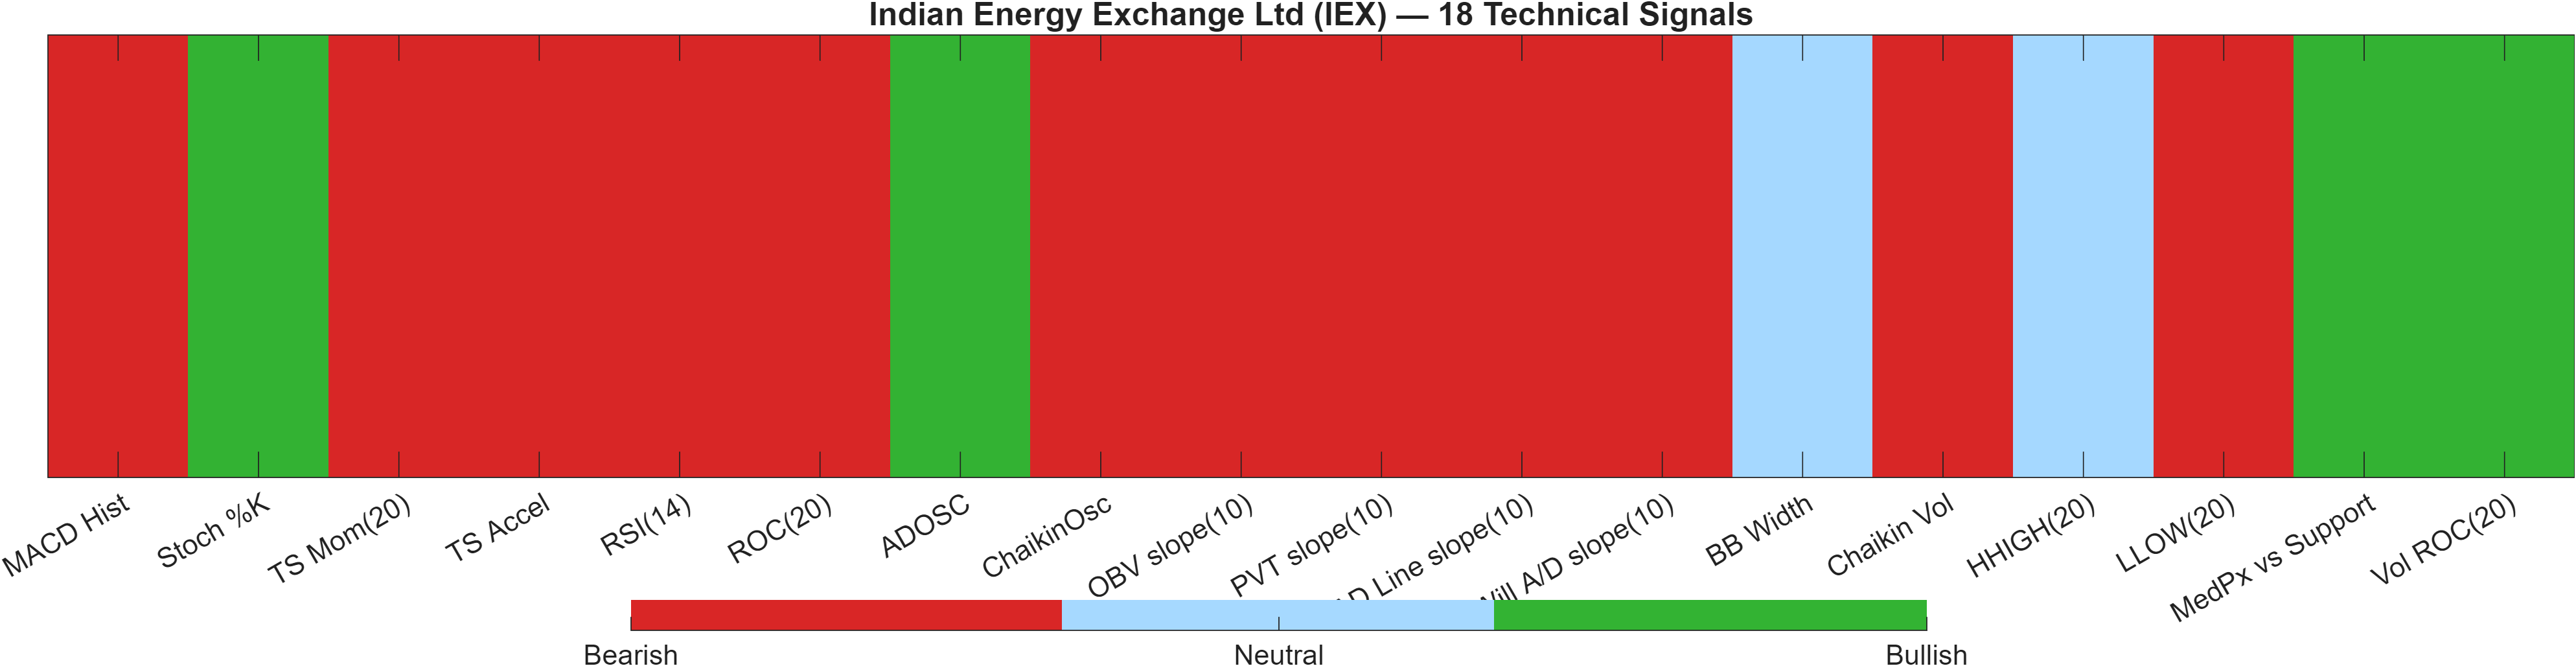
Signal table (Bull/Bear/Neutral)
| Indicator | Value | Signal |
|---|---|---|
| MACD Hist | -1.169 | Bearish |
| Stoch %K | 5.944 | Bullish |
| TS Mom(20) | -3.55 | Bearish |
| TS Accel | -12 | Bearish |
| RSI(14) | 36.75 | Bearish |
| ROC(20) | -2.815 | Bearish |
| ADOSC | 12.5 | Bullish |
| ChaikinOsc | -8.943e+05 | Bearish |
| OBV slope(10) | -1.707e+06 | Bearish |
| PVT slope(10) | -7.837e+04 | Bearish |
| AD Line slope(10) | -3.416e+06 | Bearish |
| Will A/D slope(10) | -19.38 | Bearish |
| BB Width | 0.111 | Neutral |
| Chaikin Vol | 60.5 | Bearish |
| HHIGH(20) | 136.7 | Neutral |
| LLOW(20) | 122.4 | Bearish |
| MedPx vs Support | 10.08 | Bullish |
| Vol ROC(20) | 63.26 | Bullish |
Interpretation: Indicator-level signals form the base confluence, which is then adjusted using a separate AI-driven technical ranking model. The final technical score summarizes this combined view.
The technical layer is unusually decisive relative to the neutral short-term ranks: the DRL technical rank is #1040 out of 1222 with a score of -0.702, and the blended view stays bearish (overall -0.522). This indicates that, across the model’s pattern library, the present configuration resembles weaker technical states more than favorable ones, even if longer-term cross-sectional ranks remain strong (#7 over 6‑months; #34 yearly).
Internally, the confluence breadth is skewed: Bear 12 / Bull 4 / Neutral 2. Momentum and rate-of-change measures are consistently negative (e.g., ROC(20) -2.815, TS Mom(20) -3.55, TS Accel -12), which helps explain why RSI(14) sits at 36.75 and why MACD histogram remains negative (-1.169 on the table). Where the dashboard becomes more nuanced is in the volume/participation split: ADOSC is bullish at 12.5 and Vol ROC(20) is bullish at 63.26, but multiple slope-based flow lines remain bearish (e.g., AD Line slope(10) -3.416e+06, OBV slope(10) -1.707e+06).
That mix can be read as selective activity without broad accumulation confirmation. For confluence to improve, the simplest requirement is not “one indicator turns,” but that bearish clusters (momentum + flow slopes) begin to rotate together—typically visible as MACD histogram lifting toward zero and RSI stabilizing away from the mid‑30s, while negative slope measures flatten.
6) News sentiment + extractive gist
Sentiment score (avg): 0.148 | Positive: 47% | Neutral: 53% | Negative: 0%
KGNAI AI News Sentiment Score (normalized -1 to +1): 1.00 (as of 2026-04-05) | Label: Bullish | Overall news score: 1.00
Positive Developments
Recent coverage across major financial outlets indicates a modestly constructive narrative tone around IEX, consistent with the dataset’s 0% negative share and a slightly positive average sentiment (0.148). The normalized score of 1.00 (dated 2026-04-05) suggests that the language in recent reporting skewed toward supportive interpretations rather than caution-heavy framing. This matters most as a contextual tailwind: when technical conditions are weak (overall technical score -0.522), positive sentiment can help explain why longer-horizon ranks remain strong (6‑Monthly #7; Yearly #34) despite near-term softness. Still, sentiment is most informative when it coincides with observable price confirmation—particularly a recovery that respects 115.9167 and can challenge 132.6000 without immediate rejection.
Neutral / Mixed Developments
The neutral share is slightly higher than the positive share (53% neutral vs 47% positive), implying that much of the newsflow is informational rather than catalyst-driven. In practice, this type of mix often coincides with range-bound trading and a market that is waiting for clearer confirmation from price and indicators. That sits well with the current technical state: volatility is not extreme (Bollinger bandwidth 0.1110), while momentum remains pressured (RSI(14) 36.75; MACD histogram -1.1691). The result is a narrative backdrop that may reduce shock risk but does not independently resolve the chart’s bearish confluence.
Negative / Risk Signals
Even with 0% negative classification in the sentiment split, risk should be framed through price behavior versus levels rather than headline tone. A supportive narrative can coexist with drawdowns when technical conditions are degraded—particularly when the short-term rank is neutral (Daily #761; Weekly #789) and the technical model is firmly bearish (DRL rank #1040; score -0.702). The most relevant “risk signal” from the combined dataset is therefore signal conflict: bullish long-horizon rank strength against bearish short-cycle momentum/flow. If price closes below 115.9167 while momentum remains negative, the probability increases that the longer-term strength is being challenged by an evolving regime shift rather than a routine pullback.
- What to monitor next: Acceptance above 132.6000 alongside improving RSI/MACD behavior.
- What to monitor next: Stability of price action around 115.9167 during weaker momentum readings.
- What to monitor next: Whether flow/volume slopes begin to flatten (e.g., OBV/AD Line slope pressure easing) as volatility stays near 0.1110.
Sources referenced: Reuters, Bloomberg, Yahoo Finance, MarketWatch, Investing.com
7) Sources
- IDEX Gears Up to Report Q1 Earnings: What's in the Cards?
- Idex (IEX) Earnings Expected to Grow: What to Know Ahead of Next Week's Release
- Evaluating IDEX (IEX) Valuation After Recent Mott Acquisition And Mixed Return Performance
- How The Indian Energy Exchange (NSEI:IEX) Narrative Is Evolving As Fair Value Stays Steady
- IDEX Corporation to Webcast First Quarter 2026 Earnings Call
- IDEX Corporation Stock: Is IEX Underperforming the Industrial Sector?
- Q4 Earnings Highs And Lows: IDEX (NYSE:IEX) Vs The Rest Of The Gas and Liquid Handling Stocks
- Is IDEX (IEX) Pricing Look Attractive After Recent Share Price Pullback
You may also like: How KGNAI AI ranks instruments across global markets
Disclaimer: KGNAI provides AI-generated analytics and educational market commentary only. This is not financial advice. Markets involve risk. Always do your own research.