
IMAGICAA (Imagicaaworld Entertainment Ltd) — 29-Apr-2026 Technical & Rank View: Downside Risk Persists
Imagicaaworld Entertainment Ltd (IMAGICAA) screens weak on KGNAI’s cross-sectional ranking framework as of 29-Apr-2026, with short- and mid-horizon ranks clustered near the bottom of the India-tracked universe (1222 instruments). Despite that unfavorable relative positioning, the 18-signal technical confluence and the blended technical score both register as Neutral, indicating a market that may be stabilizing tactically even while broader probabilistic positioning remains pressured. Momentum is mixed: RSI(14) at 43.5 reads soft rather than oversold, while MACD histogram at -0.4488 reflects lingering bearish impulse. Volatility context is moderate, with Bollinger bandwidth around 0.0844, suggesting room for expansion if price approaches key levels. The most actionable map remains the nearby decision zone between support ~37.4250 and resistance ~48.9350, where confirmation is likely to come from a volume-backed break or a failed retest.
Key Takeaways
- Rank stance: Short Bearish | Mid Bearish | Long Bearish (daily/weekly/monthly ranks sit in the lower tail of the 1222-instrument universe).
- Technical confluence: 18-signal confluence -0.056 and blended score -0.283 both Neutral, but DRL technical rank #1109 remains Bearish.
- Key levels: Support ~ 37.4250 | Resistance ~ 48.9350.
- News sentiment bias: Slightly constructive (avg 0.155; 44% positive, 56% neutral, 0% negative) with instrument-specific matches not found.
- Confirmation / invalidation: A volume-backed break above 48.9350 would improve continuation odds; sustained trade below 37.4250 increases deterioration risk.
What KGNAI Measures
KGNAI evaluates assets using large cross-sectional datasets built from millions of structured data points. Inputs incorporate fundamental metrics, technical structures, and systematically processed news sentiment. Statistical models, machine learning, and AI frameworks are used to assess relative positioning, signal alignment, and probabilistic behavior across broad universes.
How to Read This Report
- Ranks are comparative across the tracked universe, not absolute price targets.
- Confluence reflects alignment among independent signal groups.
- Support/resistance levels are probabilistic decision zones, not guarantees.
- Sentiment provides contextual bias within the broader analytical framework.
1) KGNAI AI Analysis
Region: INDIA
Total universe size: 1222 ranked instruments
- Daily rank: #1137 out of 1222 — Bearish
- Weekly rank: #1160 out of 1222 — Bearish
- Monthly rank: #1114 out of 1222 — Bearish
- 3-Monthly rank: #999 out of 1222 — Bearish
- 6-Monthly rank: #978 out of 1222 — Bearish
- Yearly rank: #970 out of 1222 — Neutral
IMAGICAA’s ranking profile is uniformly weak across short and intermediate horizons, with the daily (#1137), weekly (#1160), and monthly (#1114) standings all sitting in the lower tail of the 1222-instrument universe. That clustering matters: when multiple horizons align in the same region of the distribution, the model is effectively flagging a persistent regime rather than a single-window anomaly. The 3-month (#999) and 6-month (#978) ranks remain bearish as well, reinforcing that the broader positioning has not yet rotated into a higher-quality cohort.
The only partial offset is at the longest window shown: the yearly rank (#970) shifts to Neutral. In regime terms, that is consistent with a name that may have avoided the very worst long-cycle outcomes, while still failing to attract favorable cross-sectional characteristics over the last several months. With KGNAI’s framework, this kind of shape often accompanies fragile stabilization: conditions can improve locally, but they typically require corroboration from technical alignment and price behavior to translate into stronger relative ranks.
The term view remains explicitly Bearish across short-, mid-, and long-term in the provided snapshot, so any constructive read should be treated as conditional on subsequent confirmation from price/volume and signal alignment rather than assumed mean reversion.
2) Price & trend overview
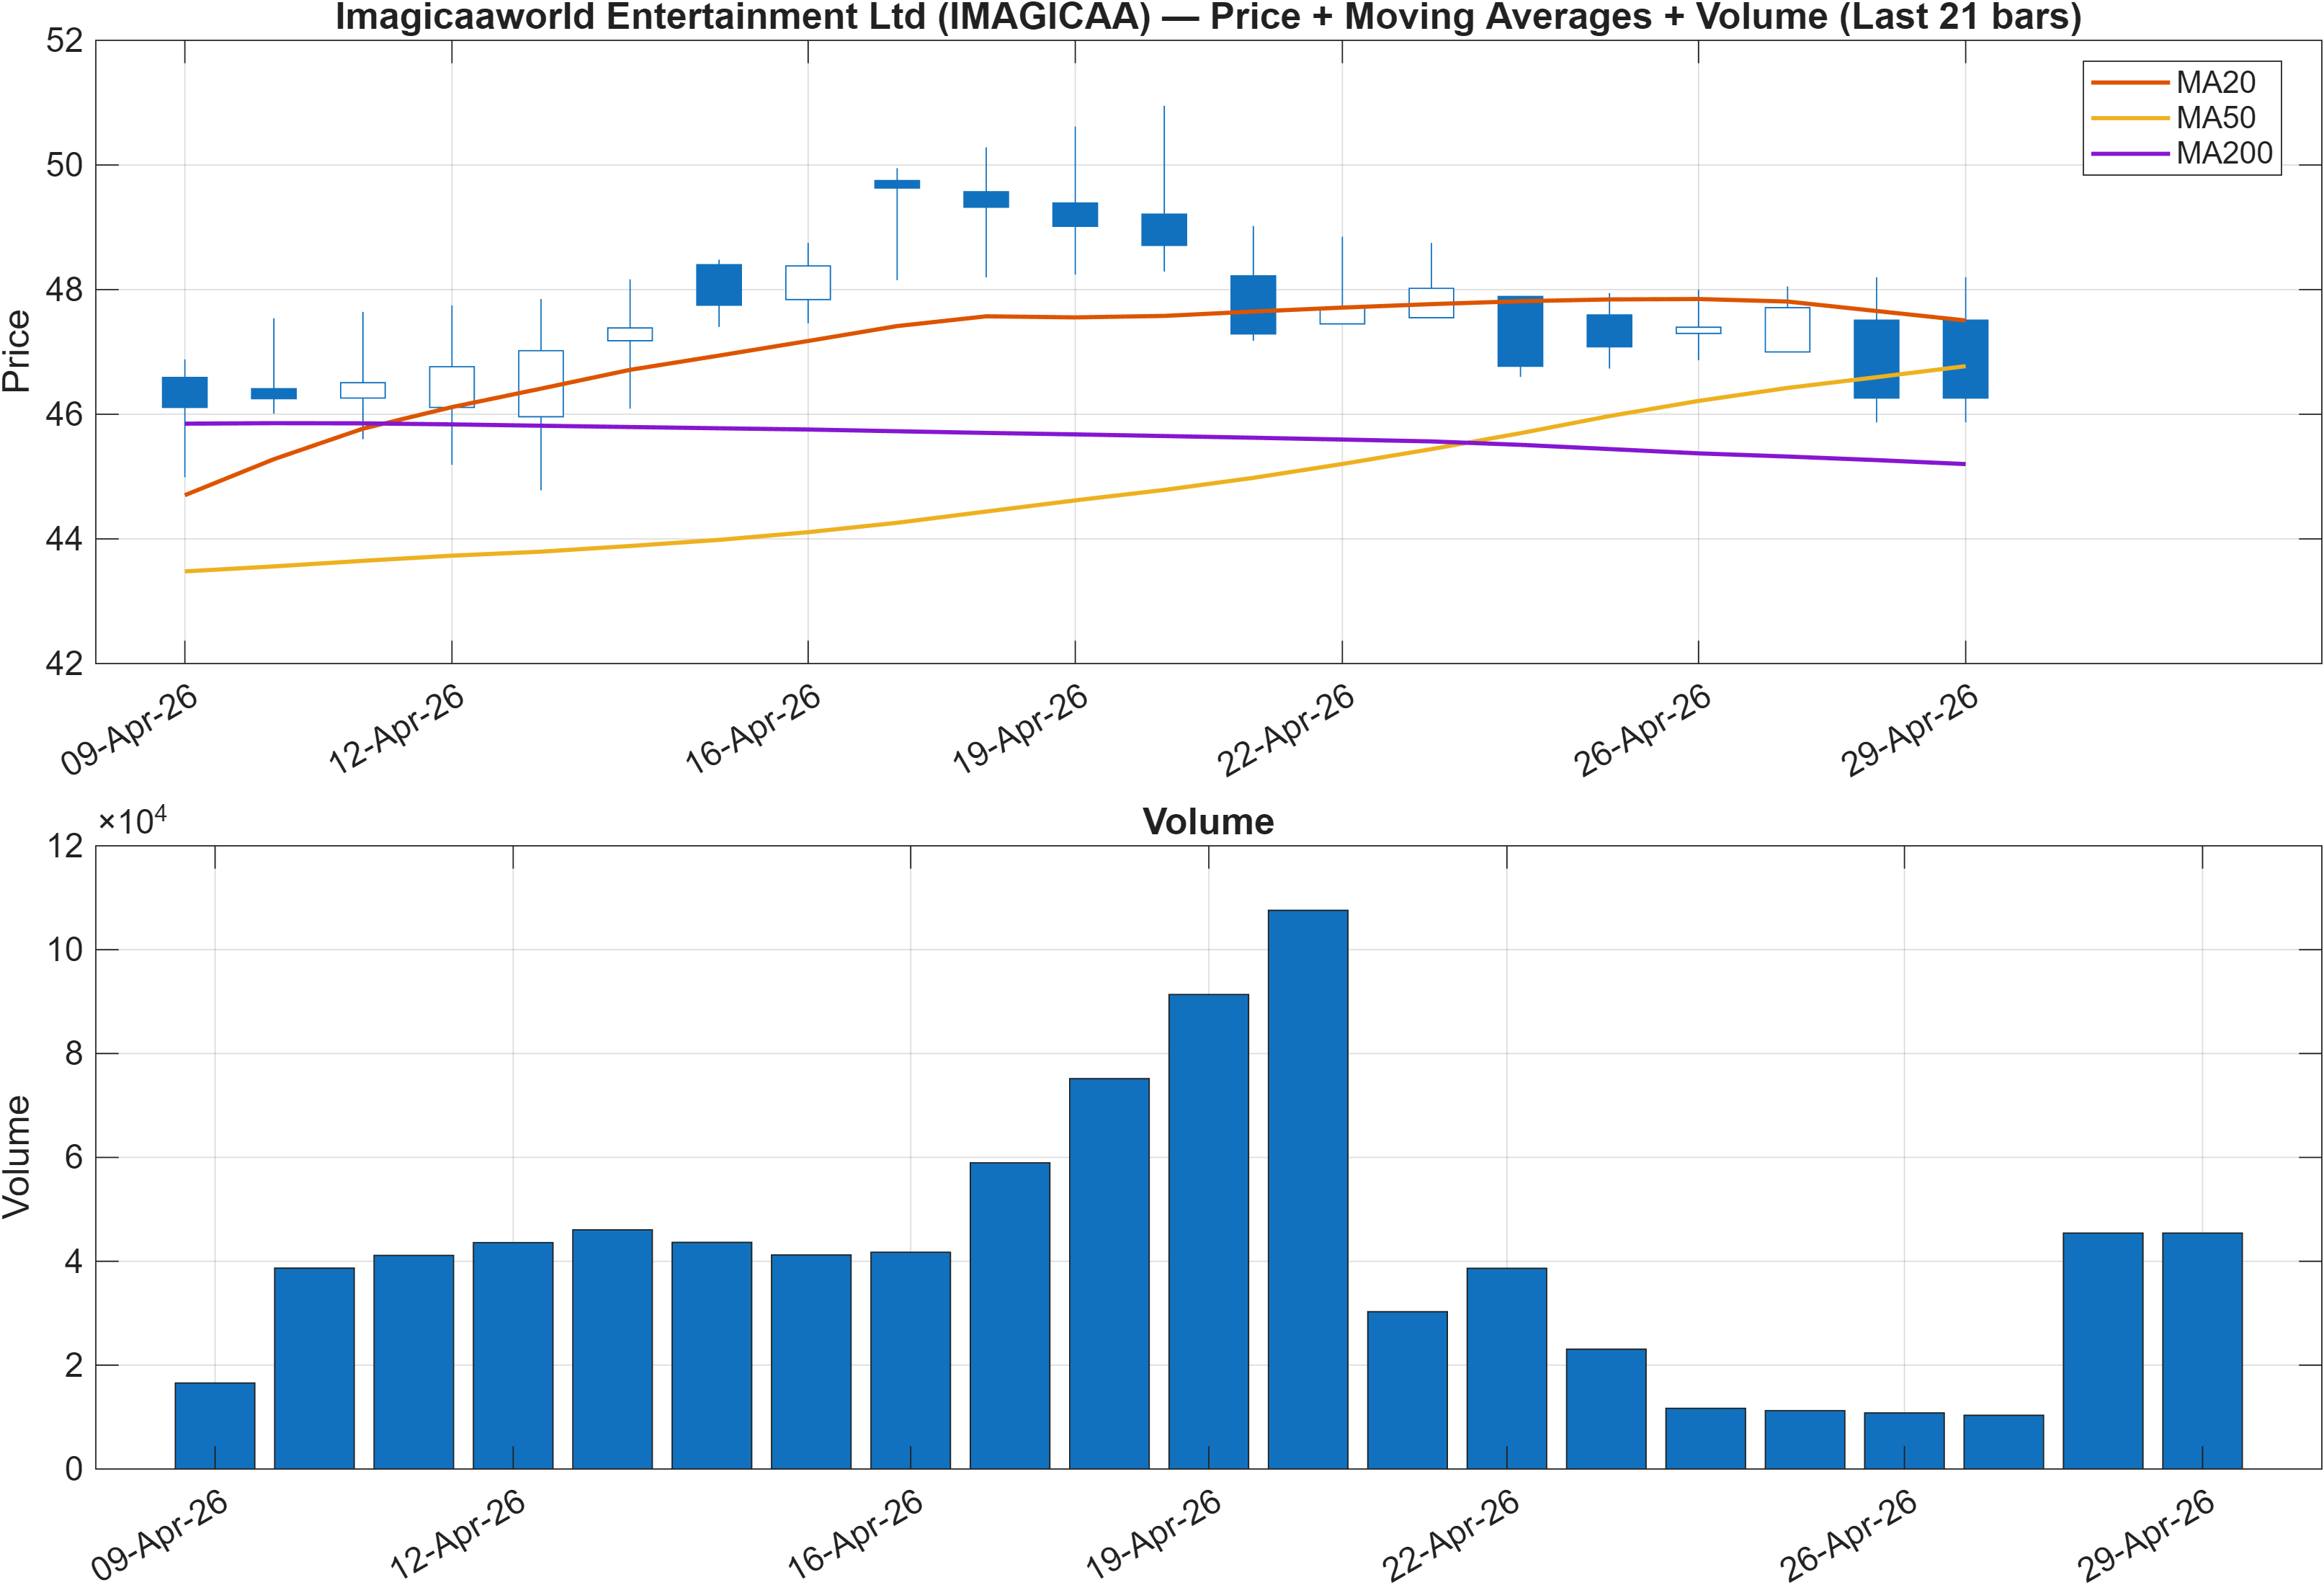
Interpretation: Close vs MA50 = Bearish, MA50 vs MA200 = Bullish.
The moving-average structure embeds a common transition pattern: the close below the MA50 keeps the near-term trend condition bearish, while MA50 above MA200 remains a longer-trend positive. This is not a contradiction so much as a timeframe split—price is currently trading weak versus its intermediate reference line, even though the longer-cycle average structure has not fully rolled over.
Practically, that mix tends to increase sensitivity to retests and failed rallies. A close persistently under the MA50 can keep rallies corrective until the market demonstrates acceptance back above that level. Conversely, the still-bullish MA50/MA200 relationship can act as a “speed limit” on bearish follow-through, especially when other indicators show compression rather than expansion.
The nearby mapped zones—support at 37.4250 and resistance at 48.9350—provide the cleaner decision frame than averages alone. Given the weak cross-sectional ranks (e.g., #1137 daily), any upside attempt typically needs to be trend-validated (price reclaiming key references) rather than purely bounce-driven. Until that happens, the prevailing read remains that downside risk dominates, with countertrend moves requiring tighter confirmation.
3) Momentum & volatility dashboard
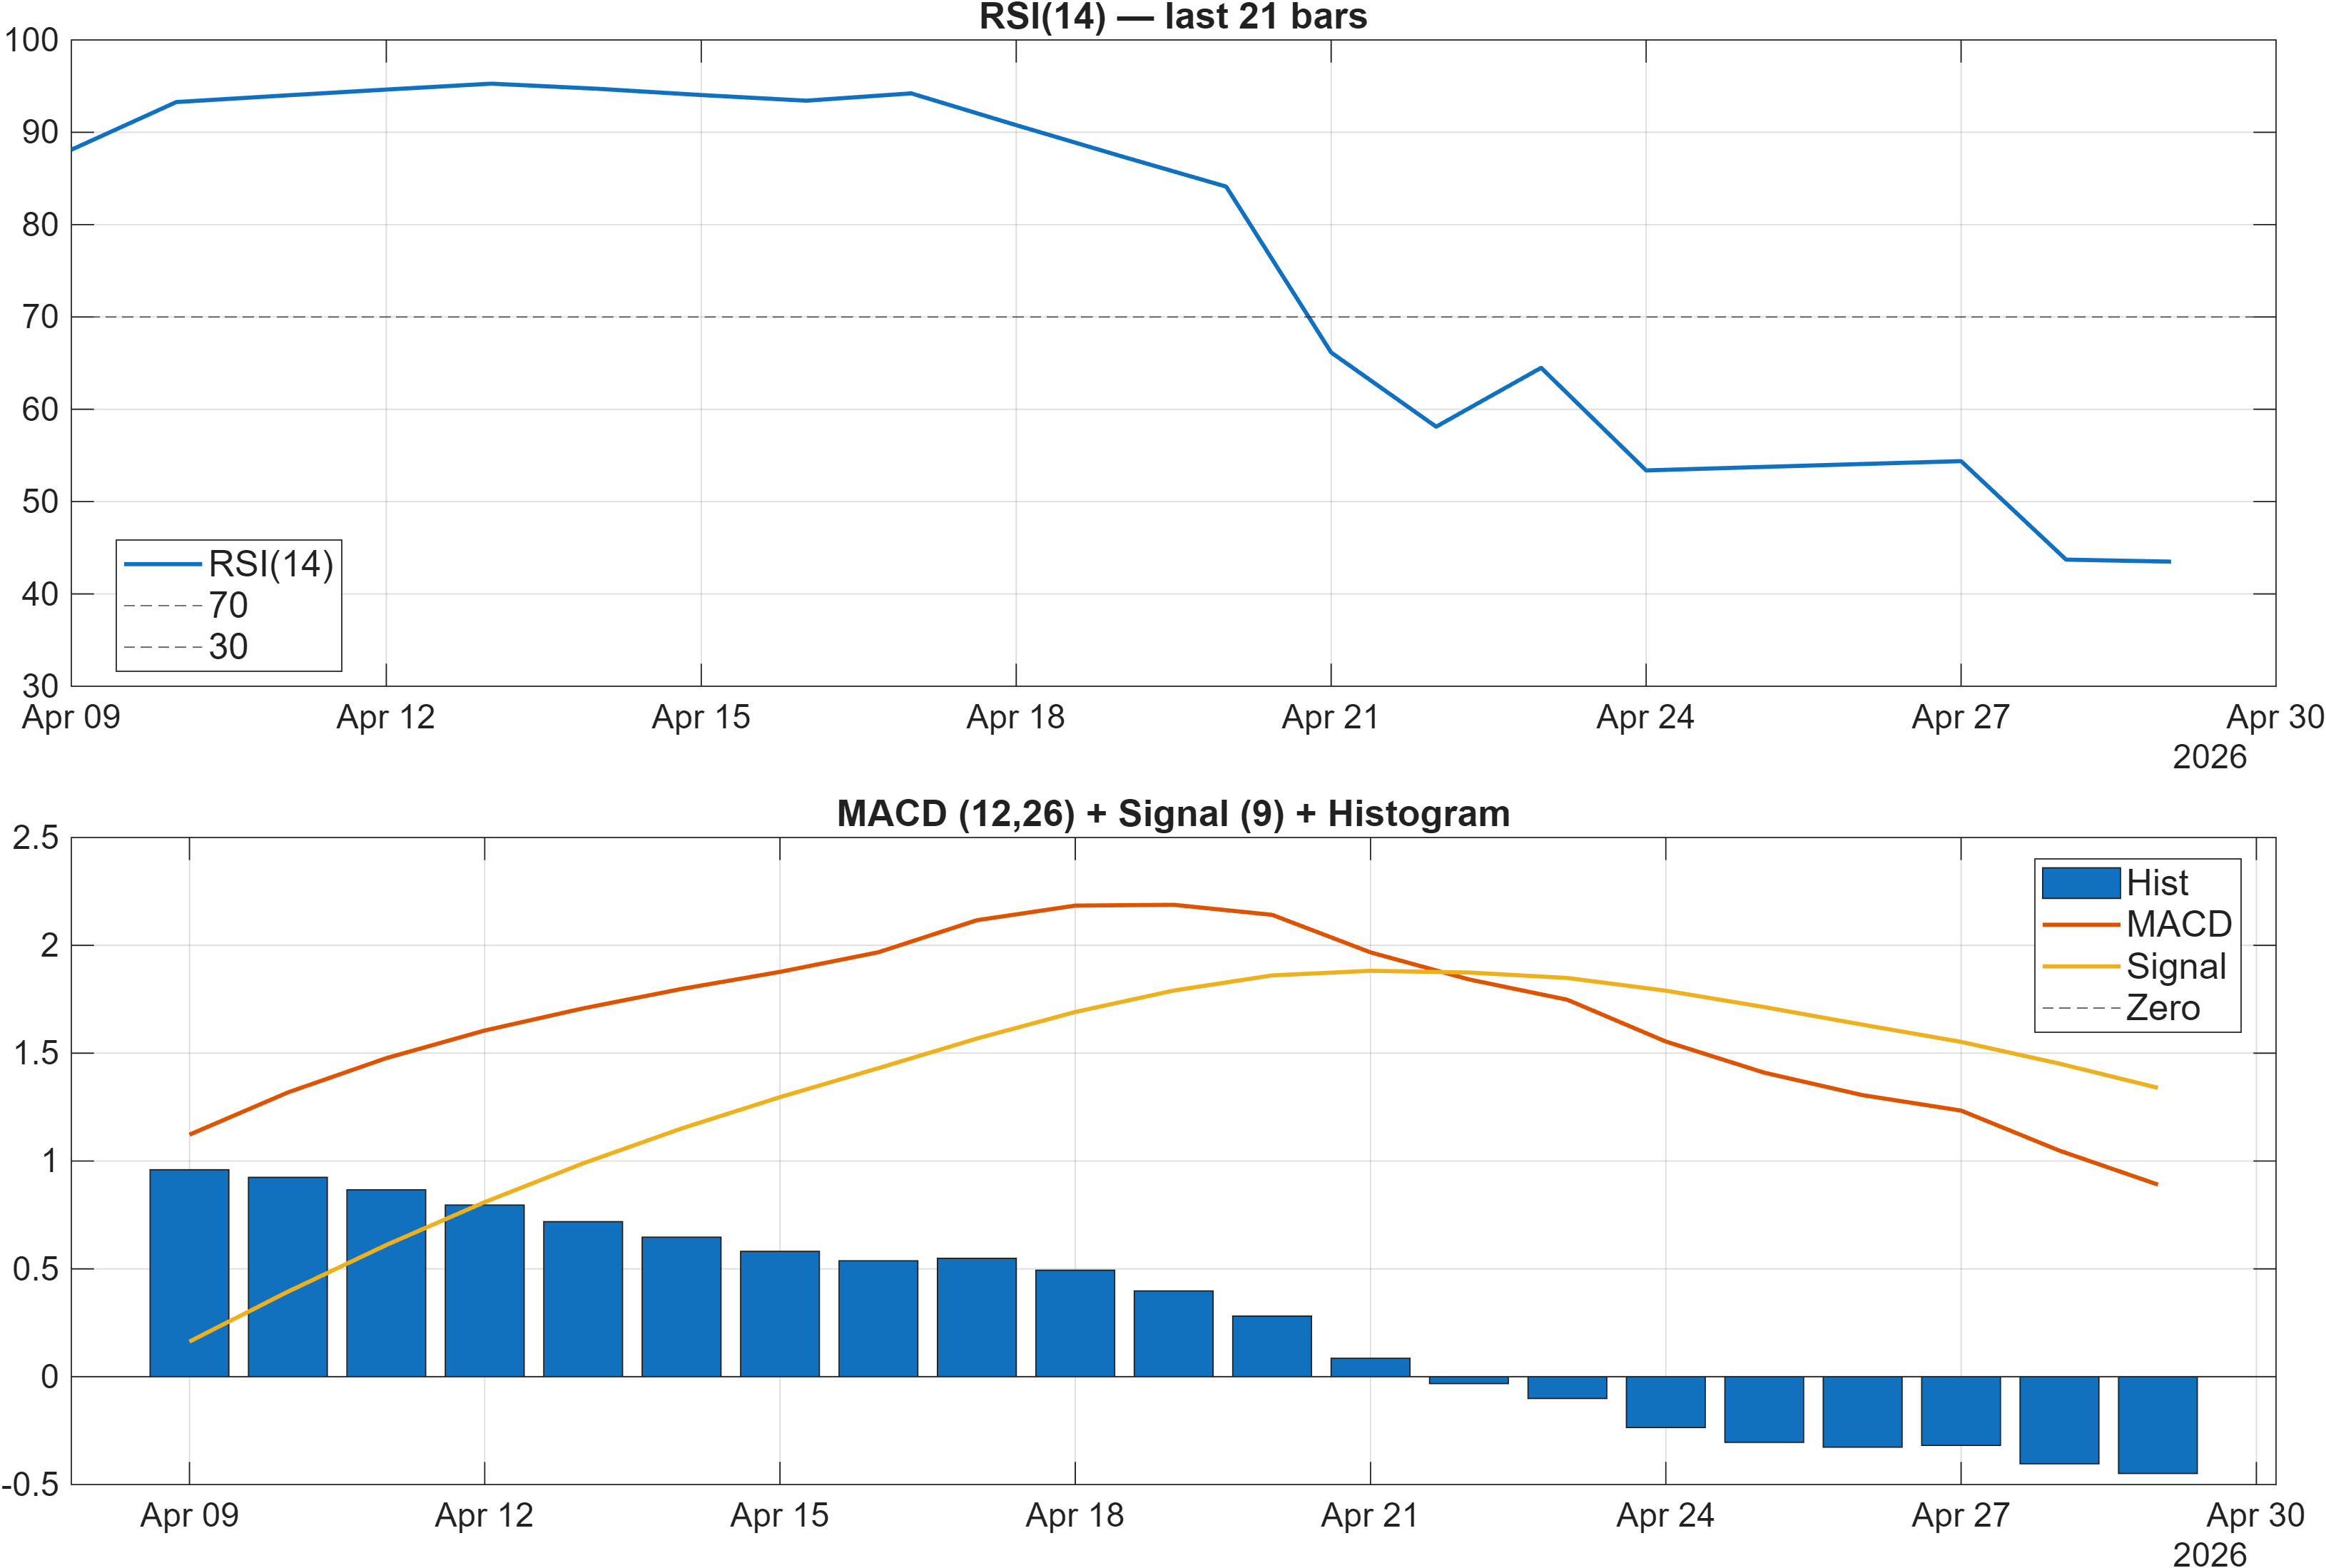
Interpretation: RSI bias = Neutral, MACD hist = -0.4488.
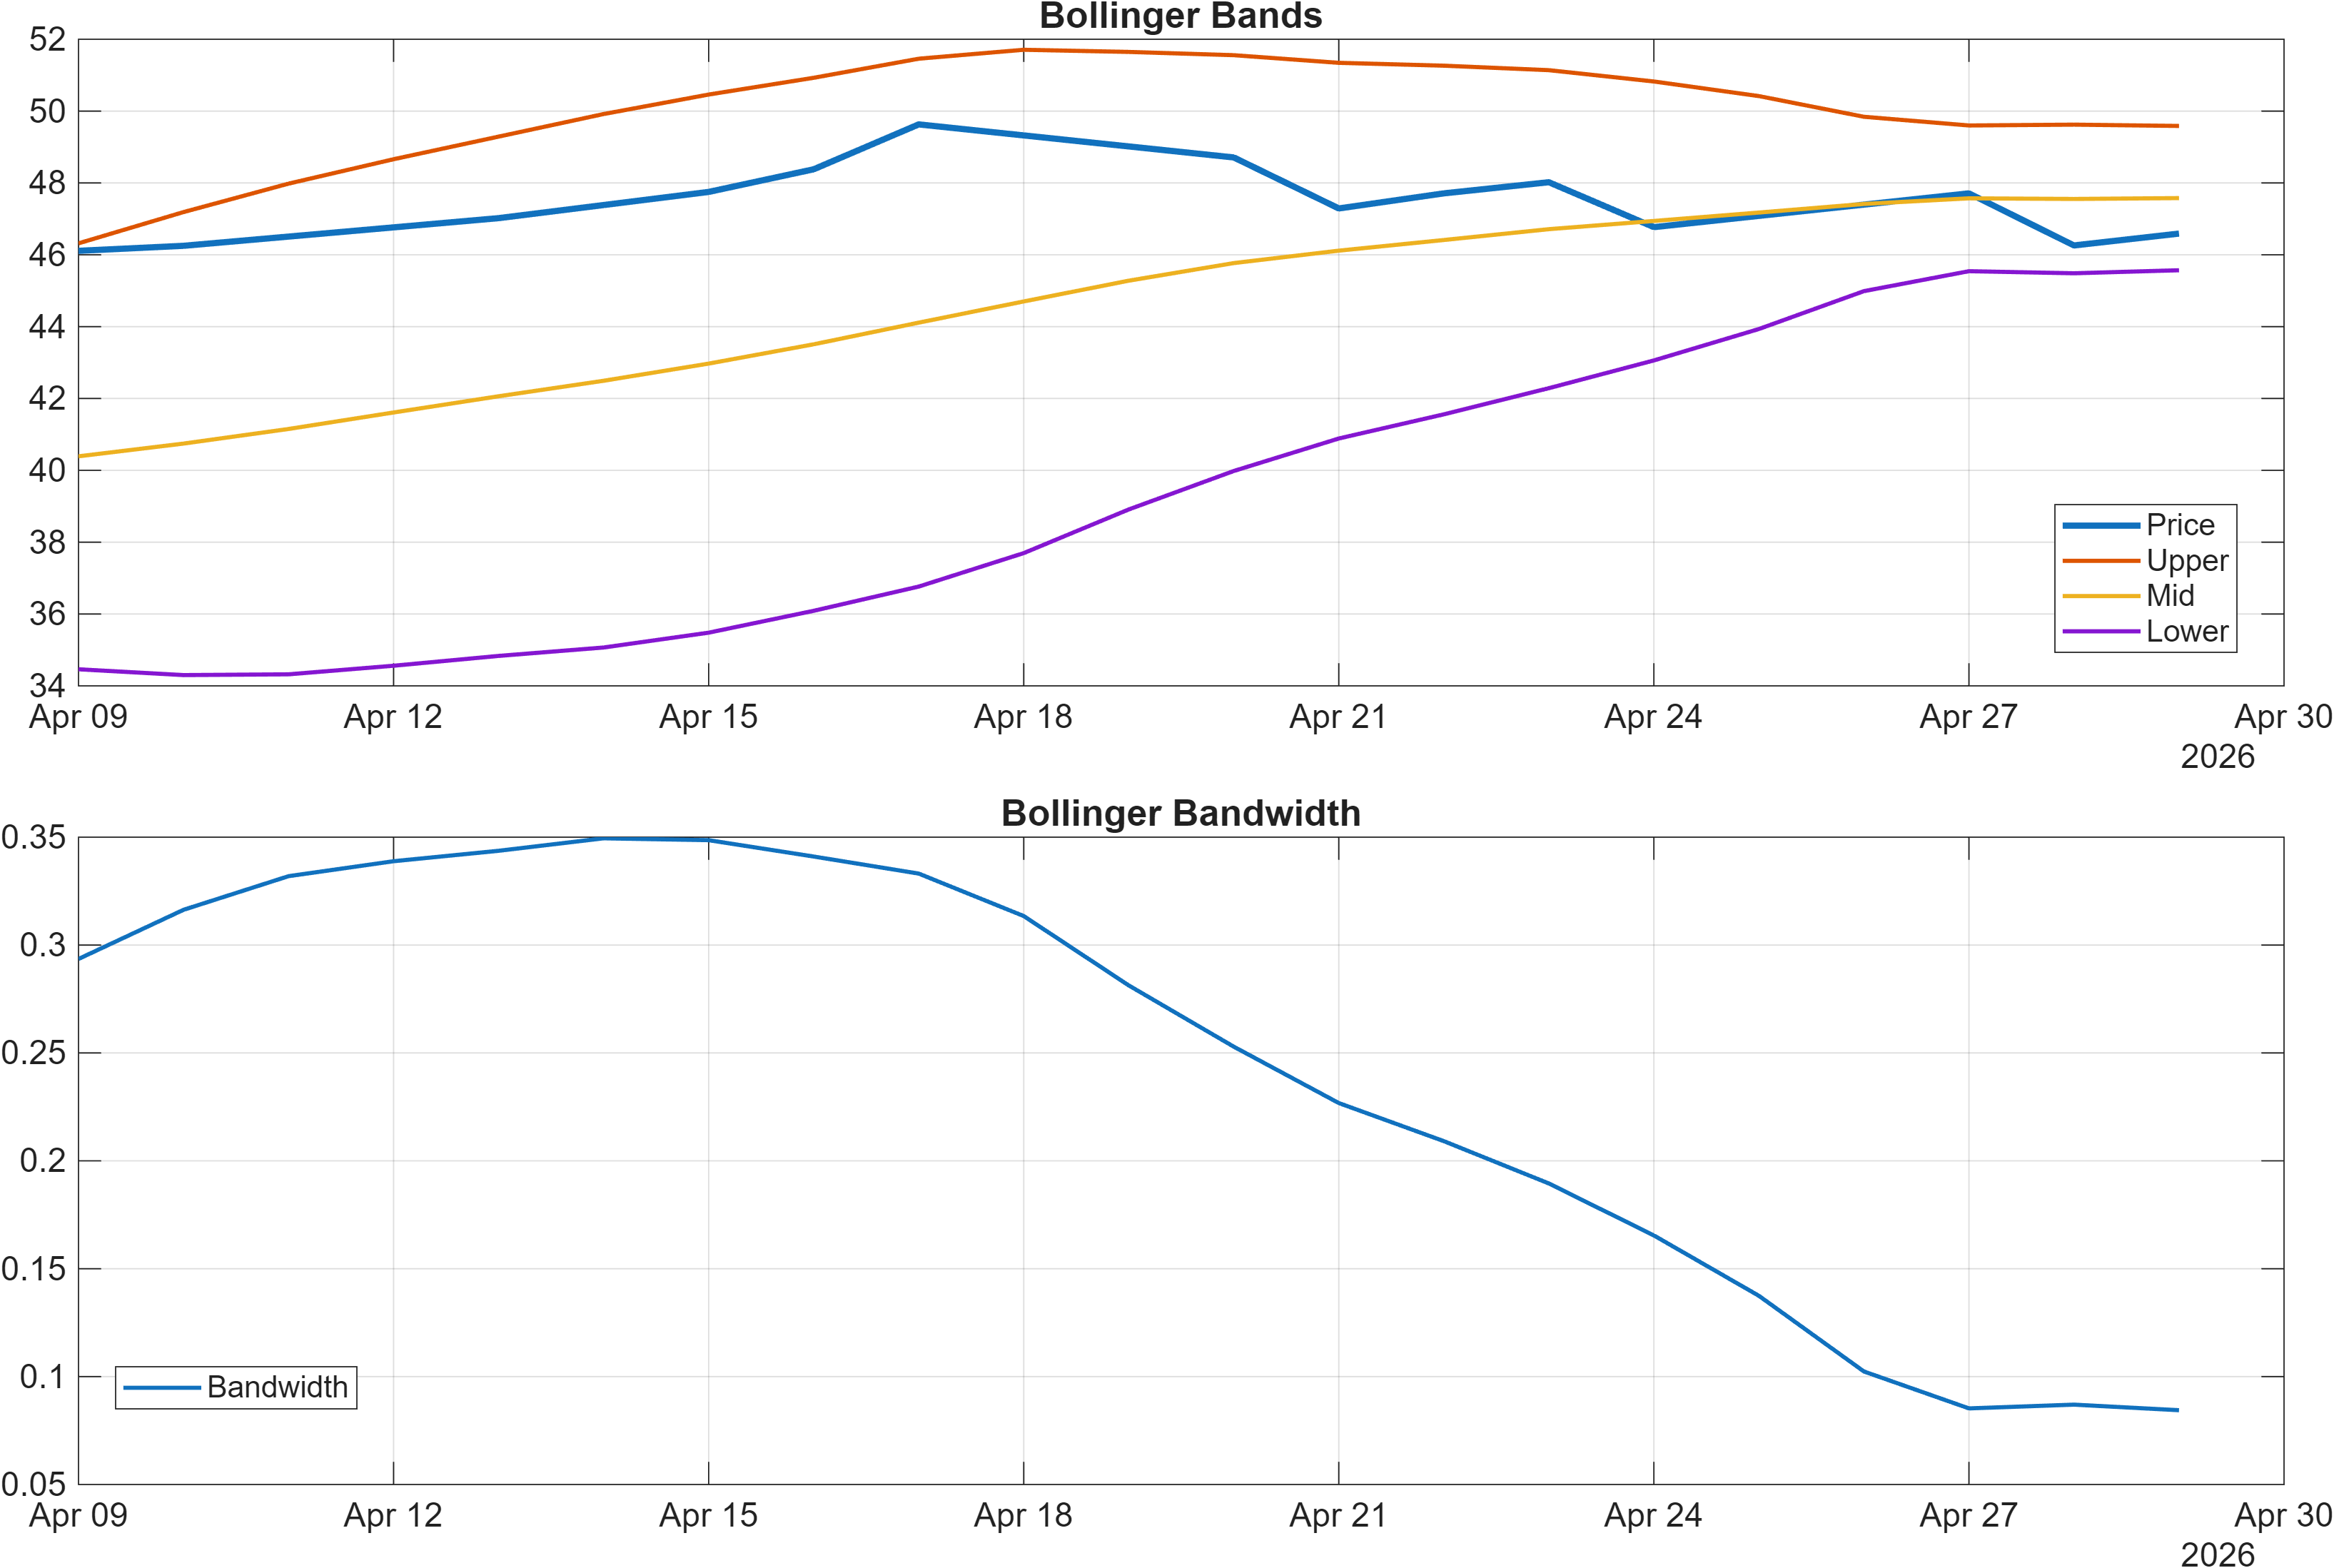
Interpretation: Bandwidth (volatility regime) latest = 0.0844.
Momentum signals are presently asymmetric: MACD’s negative histogram (-0.4488) indicates bearish impulse is still in place, yet RSI is not deeply washed out. The signal table sharpens that picture—RSI(14) at 43.5 is categorized bearish in this framework, implying underpowered demand rather than capitulation. In other words, the setup reads more like weak participation than an exhaustion low.
At the same time, short-horizon oscillators can still produce tactical rebounds. For example, Stoch %K at 7.677 is bullish in the 18-signal map, consistent with a condition where price can mean-revert upward even while the broader impulse remains negative. This combination often creates “two-speed” trading: fast bounces that struggle to convert into sustained trend unless they are accompanied by improving trend metrics and volume confirmation.
Volatility context is also informative. The Bollinger bandwidth near 0.0844 points to a relatively contained regime. When bandwidth is compressed, breaks of nearby levels can be more decisive because volatility expansion tends to accompany directional follow-through. If bandwidth begins to expand while price fails to reclaim key references (e.g., remains under the MA50), the risk shifts toward trend continuation to the downside. If expansion occurs alongside improving breadth/volume indicators, it can support a stabilization narrative.
4) Support / Resistance zones
Support ~ 37.4250 | Resistance ~ 48.9350
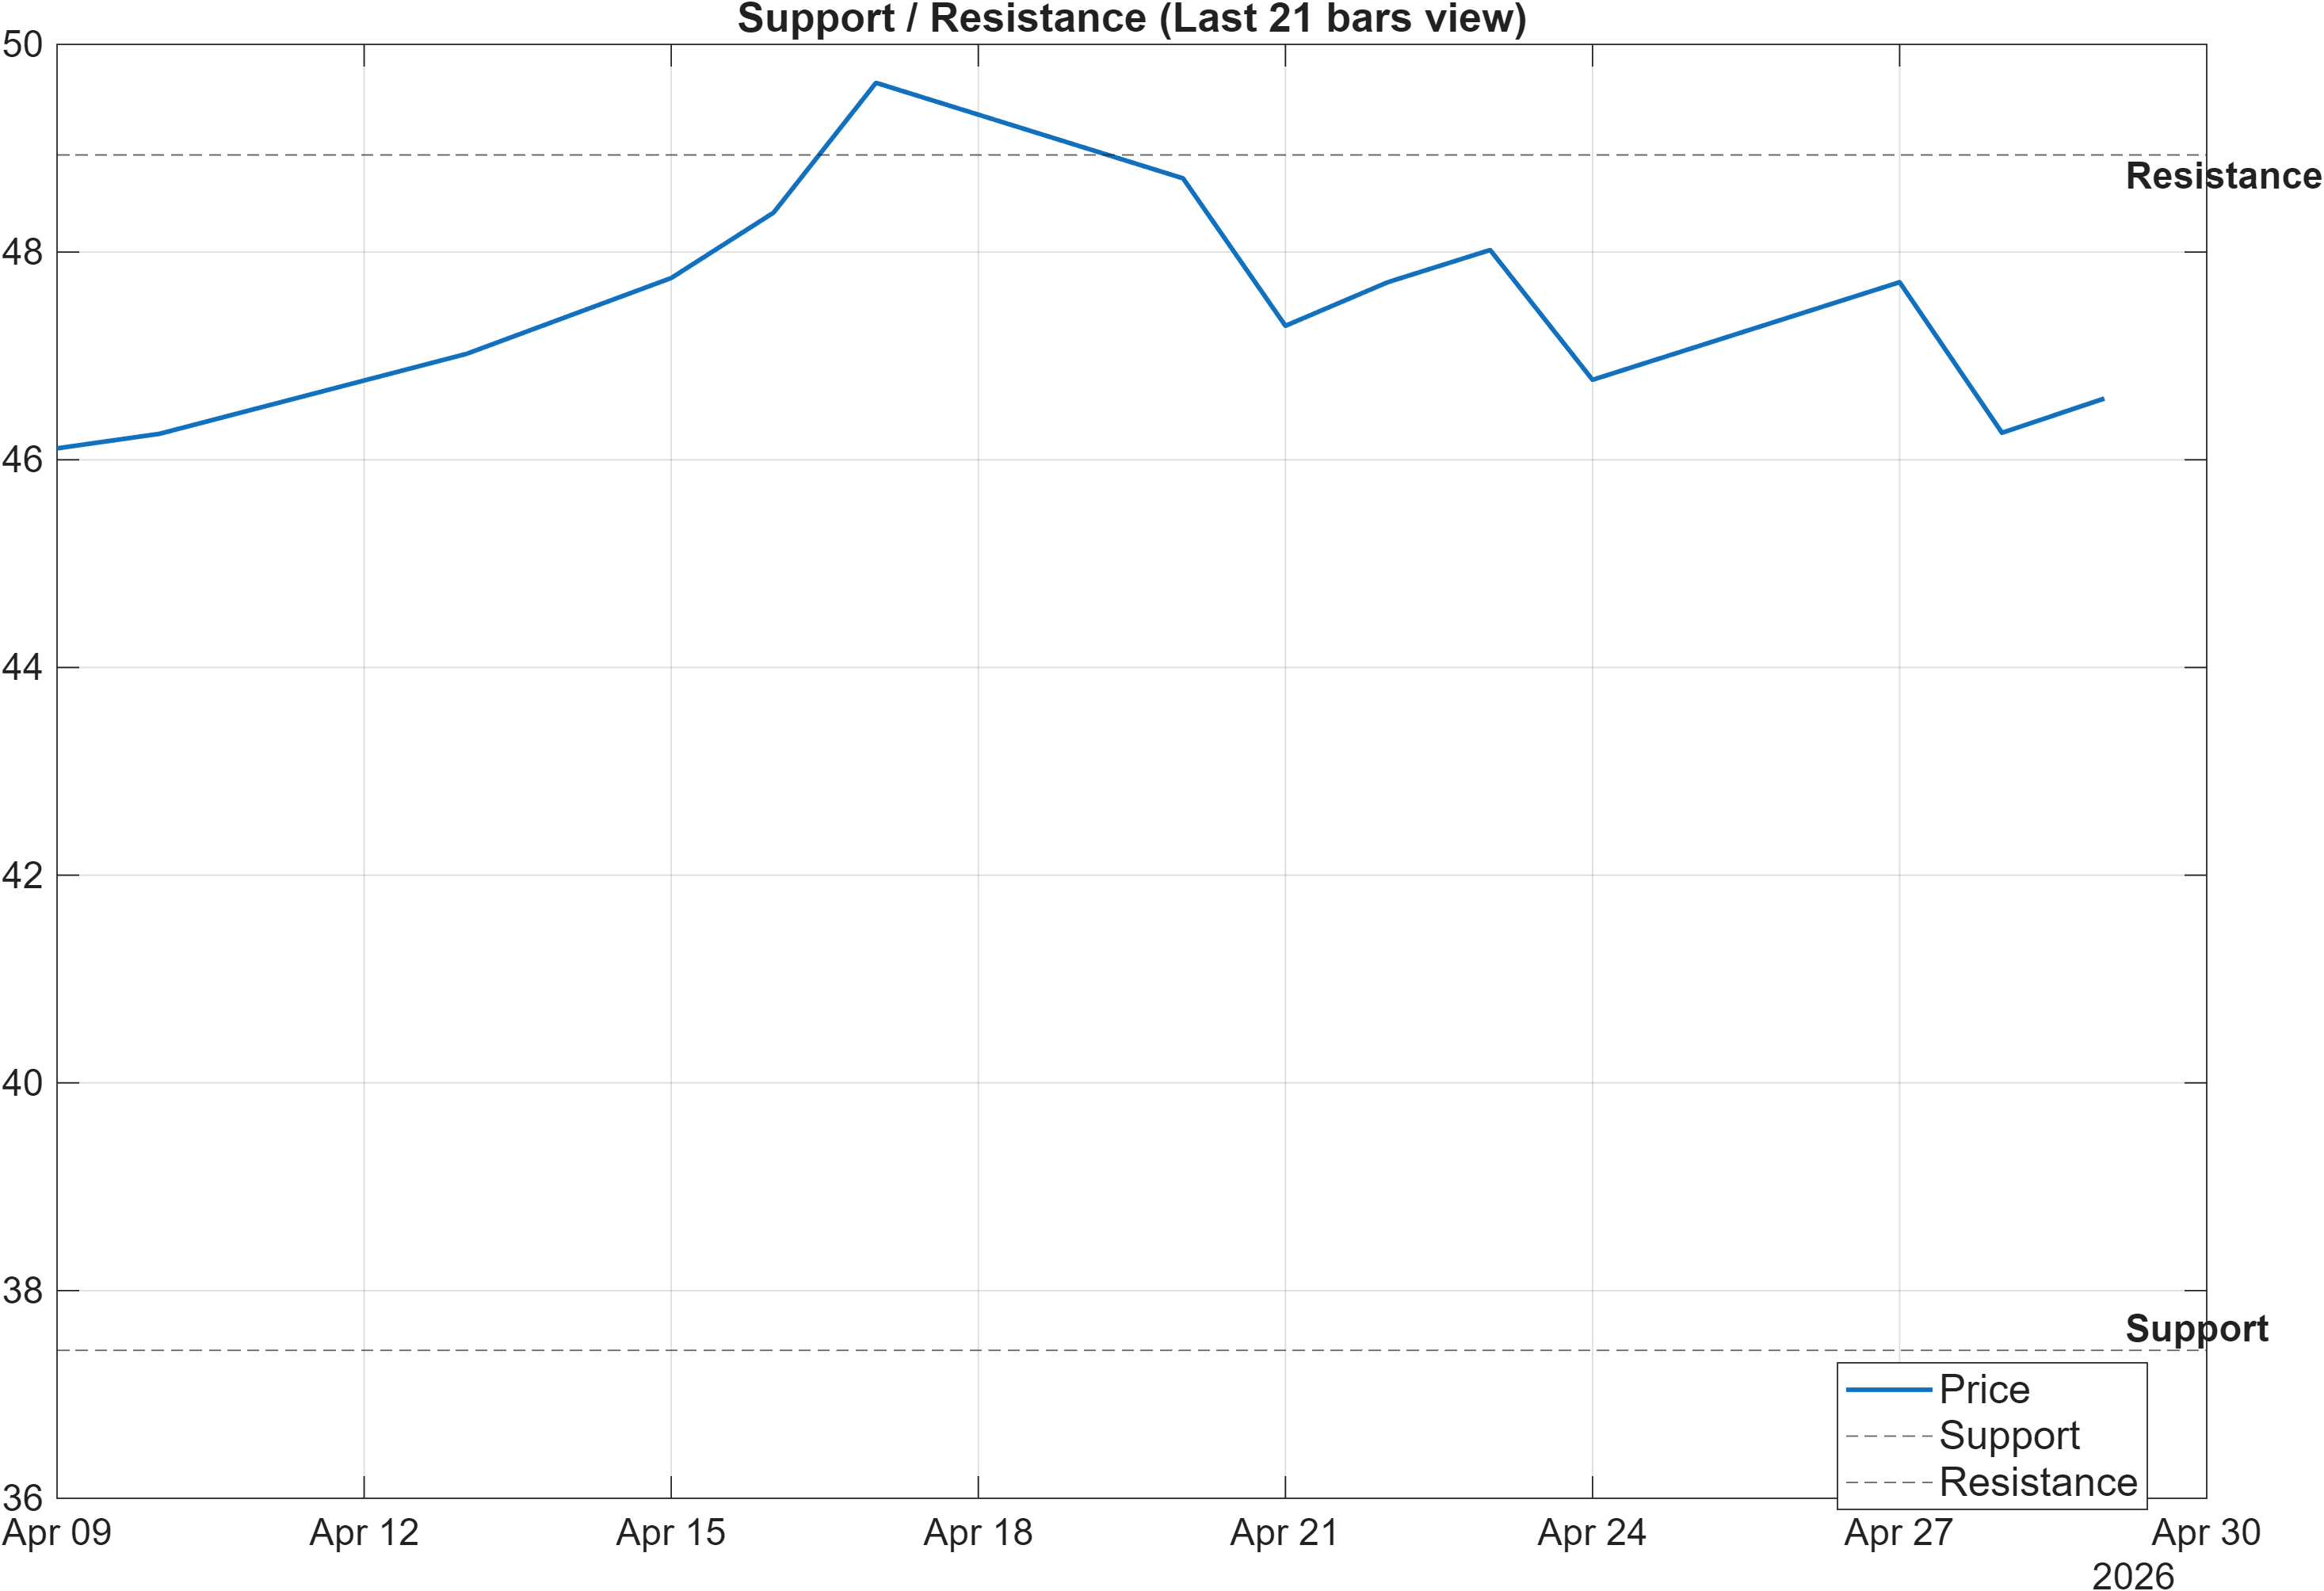
Scenario view: Break above resistance with volume → continuation. Close below support → signal deterioration risk.
The level structure is wide enough to matter for both tactical traders and position managers. Support around 37.4250 is the primary downside “decision zone”: acceptance below it increases the probability that weak cross-sectional ranks (e.g., #1160 weekly) are being expressed through realized downside rather than just relative underperformance. In that case, bearish signals such as MACD histogram at -0.4488 would be treated as consistent with the tape rather than lagging.
On the upside, 48.9350 resistance is the level that must be reclaimed to shift the structure from bounce to continuation. The condition specified in the data—break above resistance with volume—is important because the signal set contains several accumulation/breadth measures that are currently bearish (for example, OBV slope(10) and AD Line slope(10) are flagged bearish in the table). A breakout without volume participation would be less likely to repair those internal measures and more likely to revert.
With the volatility regime (bandwidth ~0.0844) not implying extreme turbulence, the market’s next meaningful information may come from how price behaves on approaches to these zones—especially whether pullbacks hold above prior reaction lows near support, or whether rallies can sustain above resistance rather than immediately failing back into the range.
5) Quant Technical Dashboard (18 Signals)
KGNAI AI Technical Analysis Score (Deep Reinforcement Learning): Rank #1109 out of 1222 (Rank 1 represents the strongest technical positioning and a higher probability of favorable price behavior. As ranks increase toward the maximum, the probability of favorable outcomes weakens and bearish positioning becomes more dominant.) | Label: Bearish | Score: -0.815
18-Signal Technical Confluence Score: -0.056 (Neutral)
Overall Technical Score (18-signal confluence + DRL rank blend): -0.283 (Neutral)
Note: The blended score reflects signal strength weighted against broader AI technical ranking, which may temporarily diverge.
Blended technical score breakdown: -0.283 (Neutral | Bull 7 / Bear 8 / Neutral 3)
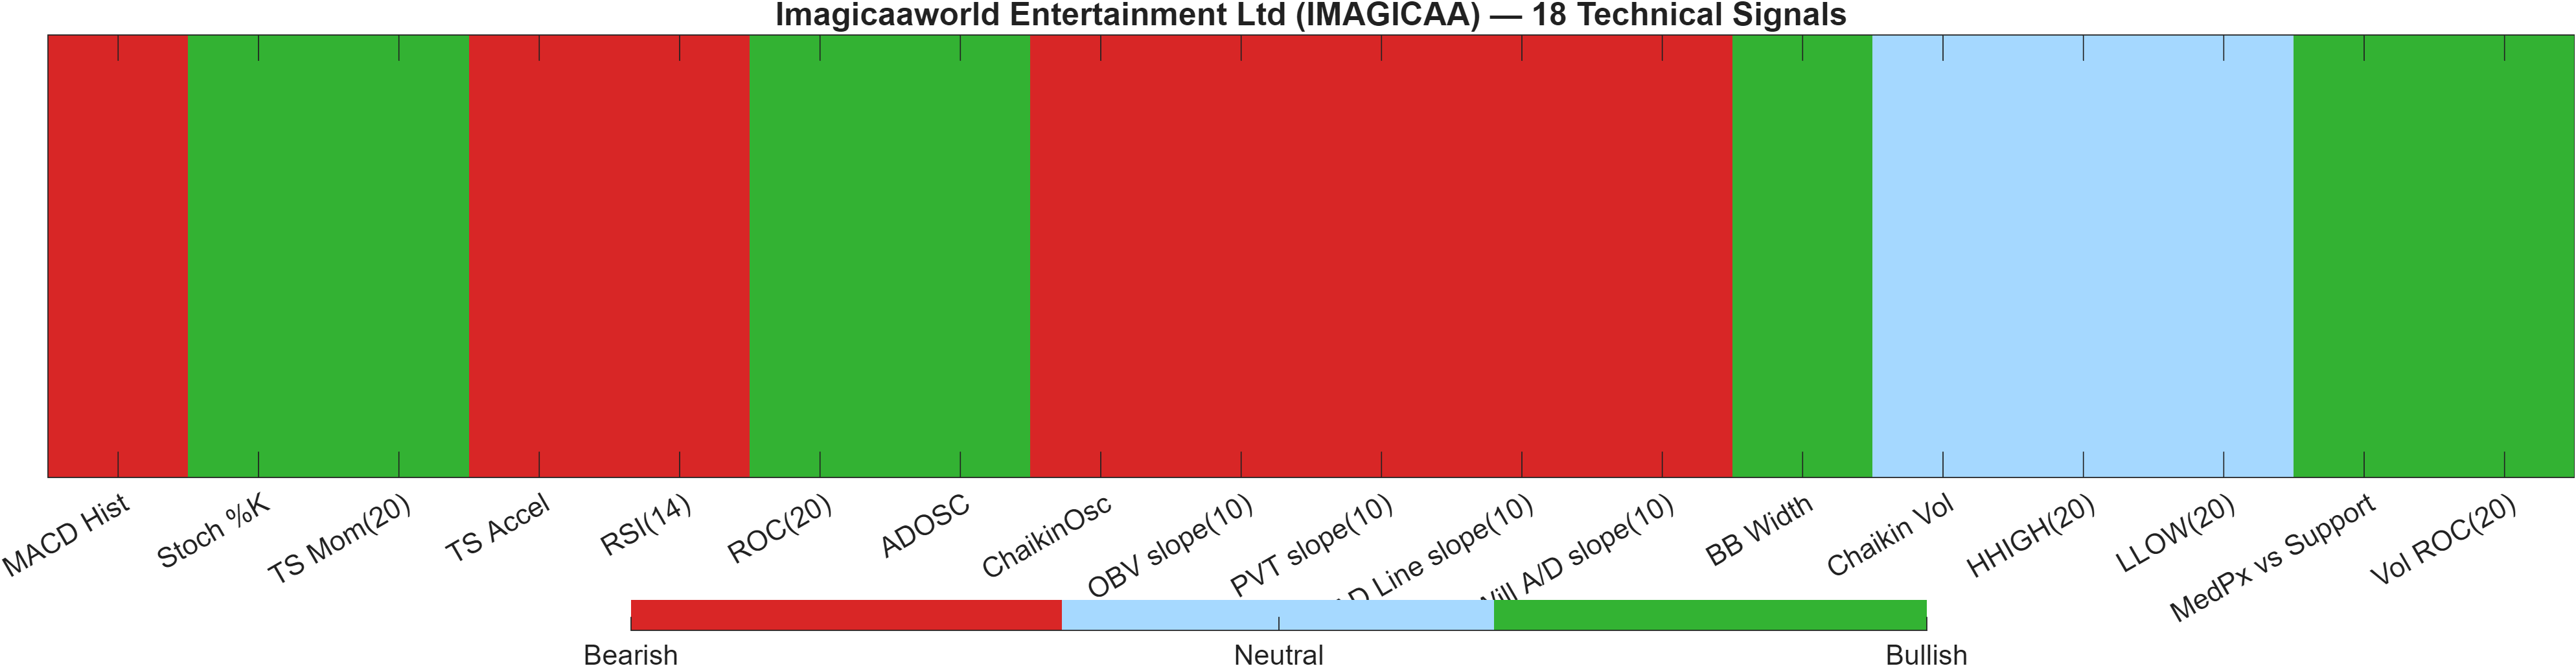
Signal alignment: neutral confluence with bearish ranking pressure
This dashboard highlights a key tension: the 18-signal confluence score (-0.056) and overall blended score (-0.283) both sit in Neutral, yet the DRL technical model rates the instrument poorly with rank #1109 and a bearish score of -0.815. When a blended score is neutral but the AI rank remains deeply bearish, it often implies that the “surface” indicator set is not fully capturing deeper pattern risk (or that stabilization is too early to be trusted).
The heatmap’s internal composition supports that interpretation. The breakdown (Bull 7 / Bear 8 / Neutral 3) is close to balanced, but the bearish side includes several participation and breadth components, which can be harder to repair quickly than oscillators. By contrast, some bullish flags look tactical—such as Stoch %K (7.677) and TS Mom(20) (0.01)—which can improve during rebounds even if the underlying demand profile stays fragile.
Volatility measures provide additional nuance: BB Width is tagged bullish (table shows 0.08443), consistent with a regime that can support directional moves if a break occurs. But with MACD histogram (-0.4488) bearish and multiple volume/breadth slopes negative, upside attempts may require stronger confirmation than usual to overcome the drag implied by the DRL rank.
Signal table (Bull/Bear/Neutral)
| Indicator | Value | Signal |
|---|---|---|
| MACD Hist | -0.4488 | Bearish |
| Stoch %K | 7.677 | Bullish |
| TS Mom(20) | 0.01 | Bullish |
| TS Accel | -7.867 | Bearish |
| RSI(14) | 43.5 | Bearish |
| ROC(20) | 0.7351 | Bullish |
| ADOSC | 23.18 | Bullish |
| ChaikinOsc | -4.405e+04 | Bearish |
| OBV slope(10) | -1.009e+05 | Bearish |
| PVT slope(10) | -2532 | Bearish |
| AD Line slope(10) | -2.004e+05 | Bearish |
| Will A/D slope(10) | -4.68 | Bearish |
| BB Width | 0.08443 | Bullish |
| Chaikin Vol | -20.11 | Neutral |
| HHIGH(20) | 50.95 | Neutral |
| LLOW(20) | 44.78 | Neutral |
| MedPx vs Support | 9.61 | Bullish |
| Vol ROC(20) | 17.48 | Bullish |
Interpretation: Indicator-level signals form the base confluence, which is then adjusted using a separate AI-driven technical ranking model. The final technical score summarizes this combined view.
6) News sentiment + extractive gist
Note: Instrument-specific news matches were not found, so the digest includes broader market/sector headlines. Links are provided for verification.
Sentiment score (avg): 0.155 | Positive: 44% | Neutral: 56% | Negative: 0%
KGNAI AI News Sentiment Score (normalized -1 to +1): Not available (as of —) | Label: Not available | Overall news score: 0.16
Positive Developments
Recent coverage across major financial outlets indicates a modestly constructive tone in the broader market backdrop feeding into this digest. The sentiment mix shows 44% positive and 0% negative, which can help limit near-term reflexivity risk when technical conditions are attempting to stabilize. In that context, IMAGICAA’s Neutral technical confluence (-0.056) is not facing a strongly hostile headline environment in the provided set. However, because the news is not instrument-specific, this should be treated as contextual bias rather than an explanatory driver for price. The more relevant takeaway is that an improving macro/sector tone can support attempts to reclaim technical reference points—particularly if price action approaches 48.9350 resistance and market participants require a reason to add risk.
Neutral / Mixed Developments
The neutral share of coverage is larger (56%), consistent with an environment where investors are monitoring policy, cross-border technology restrictions, and near-term risk appetite without a single dominant narrative. For IMAGICAA, this neutral-heavy mix aligns with the broader analytical split already visible in the data: momentum remains soft (e.g., MACD histogram -0.4488), while volatility is contained (bandwidth ~0.0844), often producing range-bound behavior until a catalyst emerges. In such regimes, headline flow can amplify moves around technical levels, but typically does not override the structural message from ranks, where the instrument remains positioned in the lower tail on daily/weekly/monthly horizons.
Negative / Risk Signals
Although the sentiment breakdown shows 0% negative in the matched set, the broader risk framing in recent coverage still highlights pockets of uncertainty (policy, inflation discourse, and growth expectations) that can tighten liquidity and reduce tolerance for weaker relative setups. That matters for IMAGICAA because the ranking profile is persistently bearish (e.g., #1160 weekly and #1114 monthly), and the DRL technical rank remains poor at #1109. In practice, even a mildly risk-off swing in the broader tape can push such names toward support ~37.4250 more quickly than the neutral confluence score alone would suggest. The key is not “bad news,” but whether risk conditions shift enough to keep price below key references (close vs MA50 is bearish) and prevent confirmation above resistance.
What to monitor next
- Whether price can reclaim and hold above the MA50 while MACD histogram improves from -0.4488.
- Behavior at 48.9350: breakout with volume vs. rejection back into range.
- Any volatility expansion from 0.0844 bandwidth coinciding with a test of 37.4250 support.
Sources referenced: Reuters, Bloomberg, Yahoo Finance, MarketWatch, Investing.com
7) Sources
Not available in the provided data.
Snapshot: AI Rank (Short–Mid–Long): Bearish (Bearish–Bearish–Bearish) · Technical Confluence: Neutral · Key Levels: Support ~37.42 | Resistance ~48.94 · News Sentiment: Positive
You may also like: How KGNAI AI ranks instruments across global markets
Disclaimer: KGNAI provides AI-generated analytics and educational market commentary only. This is not financial advice. Markets involve risk. Always do your own research.