
INDHOTEL (Indian Hotels Co. Ltd.) — 24-Apr-2026 Technical & AI Rank Review with Short-Term Bearish Pressure and Mixed Confirmation
Indian Hotels Co. Ltd. (INDHOTEL) enters 24-Apr-2026 with a distinctly uneven signal stack: the daily AI rank sits in the lower tail of the universe (#1018/1222), while the weekly and monthly ranks remain neutral (#567 and #738). That divergence argues for caution when interpreting near-term price action as “trend confirmation,” particularly given a Bearish DRL technical rank (#1101/1222) alongside an 18-signal confluence that is only slightly positive (0.056, Neutral). Momentum reads mixed: RSI(14) is neutral at 47.09, but MACD histogram is negative at -0.4881. Volatility is not extreme, with Bollinger Bandwidth at 0.1332, which can keep directional moves contained until a decisive level breaks. From a market-structure perspective, the current setup concentrates decision risk around support ~575.2667 and resistance ~668.8583, making level behavior more informative than indicator noise.
- Rank stance: Short-term Bearish | Mid-term Neutral | Long-term Neutral
- Technical confluence label: Neutral (18-signal score 0.056; blended technical score -0.202)
- Key levels: Support ~575.2667 | Resistance ~668.8583
- News sentiment bias: Neutral (avg 0.090; Positive 25% / Neutral 63% / Negative 12%)
- Confirmation / invalidation condition: A hold above 668.8583 with volume improves continuation odds; a close below 575.2667 raises deterioration risk.
KGNAI evaluates assets using large cross-sectional datasets built from millions of structured data points. Inputs incorporate fundamental metrics, technical structures, and systematically processed news sentiment. Statistical models, machine learning, and AI frameworks are used to assess relative positioning, signal alignment, and probabilistic behavior across broad universes.
- Ranks are comparative across the tracked universe, not absolute price targets.
- Confluence reflects alignment among independent signal groups.
- Support/resistance levels are probabilistic decision zones, not guarantees.
- Sentiment provides contextual bias within the broader analytical framework.
1) KGNAI AI Analysis
Region: INDIA
Total universe size: 1222 ranked instruments
- Daily rank: #1018 out of 1222 — Bearish
- Weekly rank: #567 out of 1222 — Neutral
- Monthly rank: #738 out of 1222 — Neutral
- 3-Monthly rank: #738 out of 1222 — Neutral
- 6-Monthly rank: #949 out of 1222 — Neutral
- Yearly rank: #898 out of 1222 — Neutral
The rank profile is best read as a time-horizon disagreement. The daily rank (#1018) places INDHOTEL in the weaker cohort of the 1222-instrument universe, aligning with a Bearish short-term label. By contrast, the weekly rank (#567) sits closer to the center of the distribution, while monthly and 3-monthly ranks (#738) maintain a neutral bias. This pattern is typical when short-term tape weakens without broad evidence that the intermediate trend has fully rolled over.
Longer-horizon ranks remain neutral but not strong: 6-month (#949) and yearly (#898) sit in the weaker half, implying that even if the stock stabilizes, the cross-sectional positioning is not currently in an “upper-quartile leadership” regime. From a decision standpoint, the ranking stack suggests that near-term downside pressure is more probable than near-term leadership, while the medium horizon still requires price-level confirmation before concluding a durable regime shift. This is consistent with the framework note that signals are probabilistic and optimized for stability rather than sensitivity.
Term view: Short-term: Bearish. Mid-term: Neutral. Long-term: Neutral.
Want the full universe and complete rank tables? Unlock full access on KGNAI: https://www.kgnai.com/pricing
2) Price & trend overview
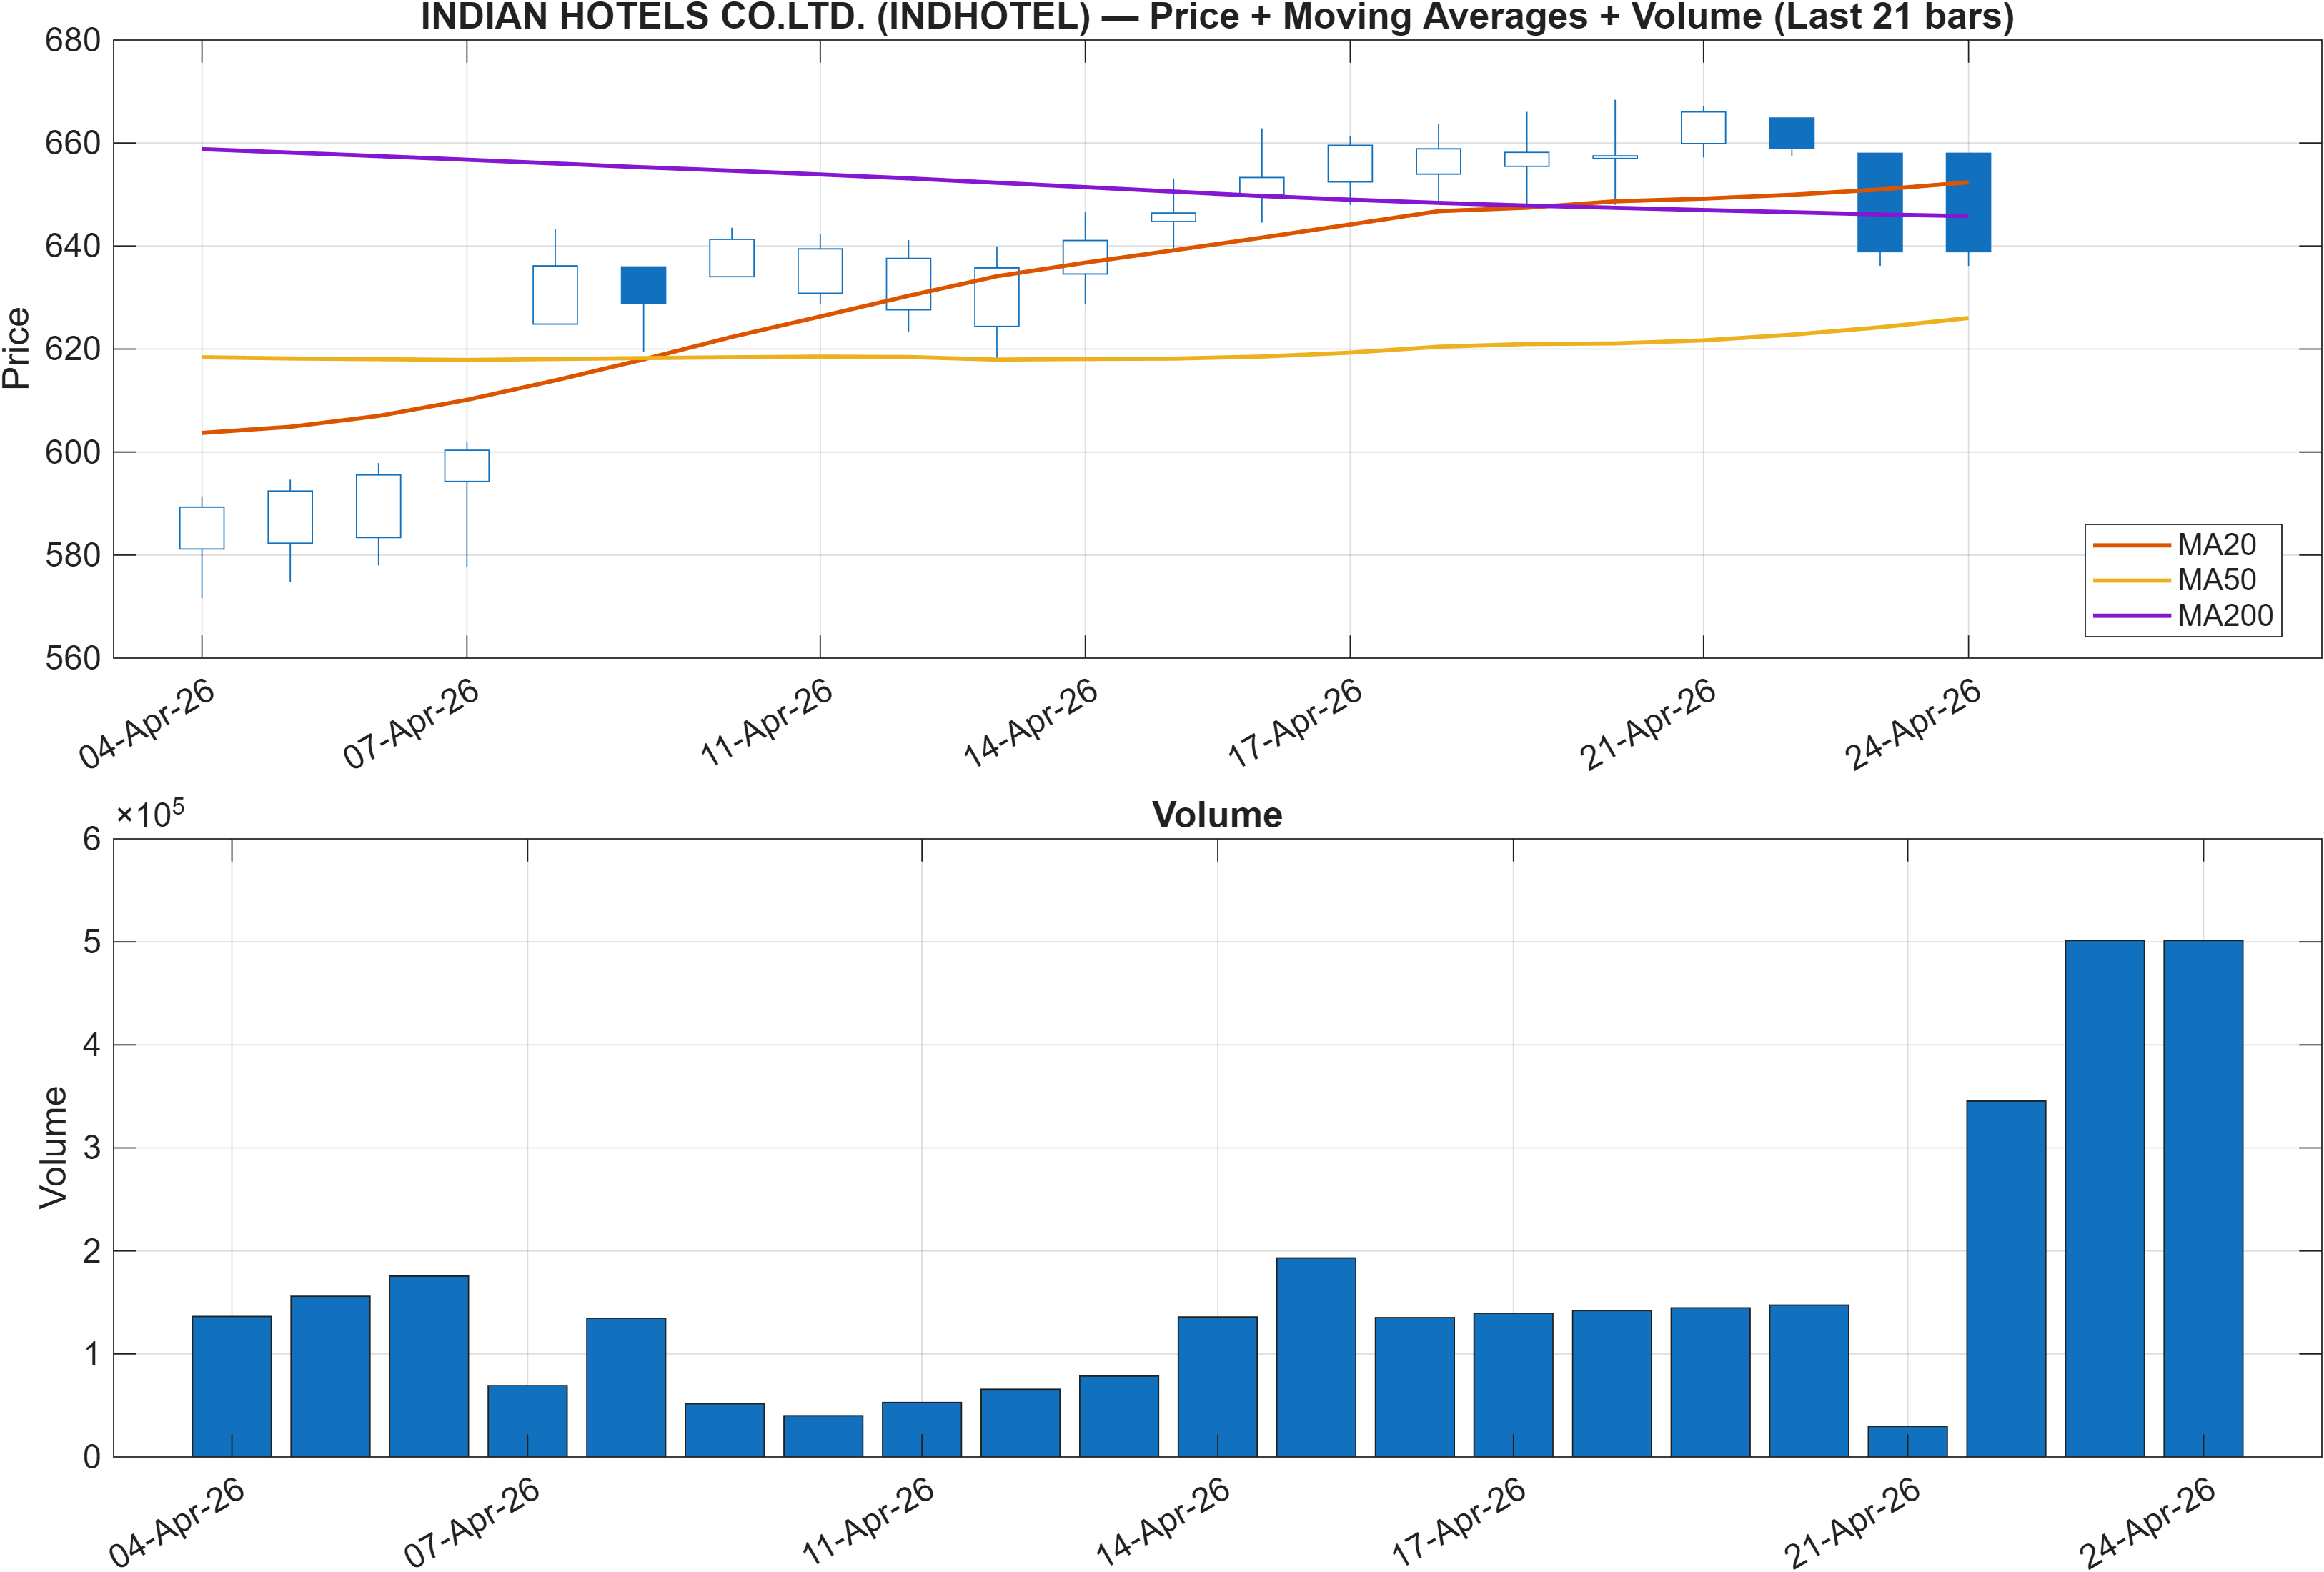
Interpretation: Close vs MA50 = Bullish, MA50 vs MA200 = Bearish.
Trend state: short-term lift inside a weaker longer structure
The moving-average read is explicitly split: close vs MA50 is Bullish, while MA50 vs MA200 is Bearish. That combination often describes a rebound phase that has not yet repaired the longer-cycle trend. In practice, this tends to shift analytical emphasis away from “trend-following confirmation” and toward level acceptance: whether price can sustain above commonly referenced reference points long enough to pull longer-term averages into alignment.
This split also matches the rank regime: the daily rank (#1018) indicates weaker short-term cross-sectional behavior even as the close can still be above a shorter average. When those two coexist, it frequently signals fragile upside—price may look improved locally, but relative positioning across the broader universe remains poor. Conversely, the weekly rank (#567) being neutral argues that the move has not fully broken intermediate structure either.
Volume context matters because a Bullish close vs MA50 without supportive participation can fade quickly; however, the present report does not provide explicit volume statistics beyond the chart. Not available in the provided data. Given the defined levels later in the report, the cleanest confirmation logic is to treat trend as conditional: improvement is more credible if it progresses toward the 668.8583 resistance zone, while failure that pulls price back toward 575.2667 would align the moving-average split with renewed downside pressure.
3) Momentum & volatility dashboard
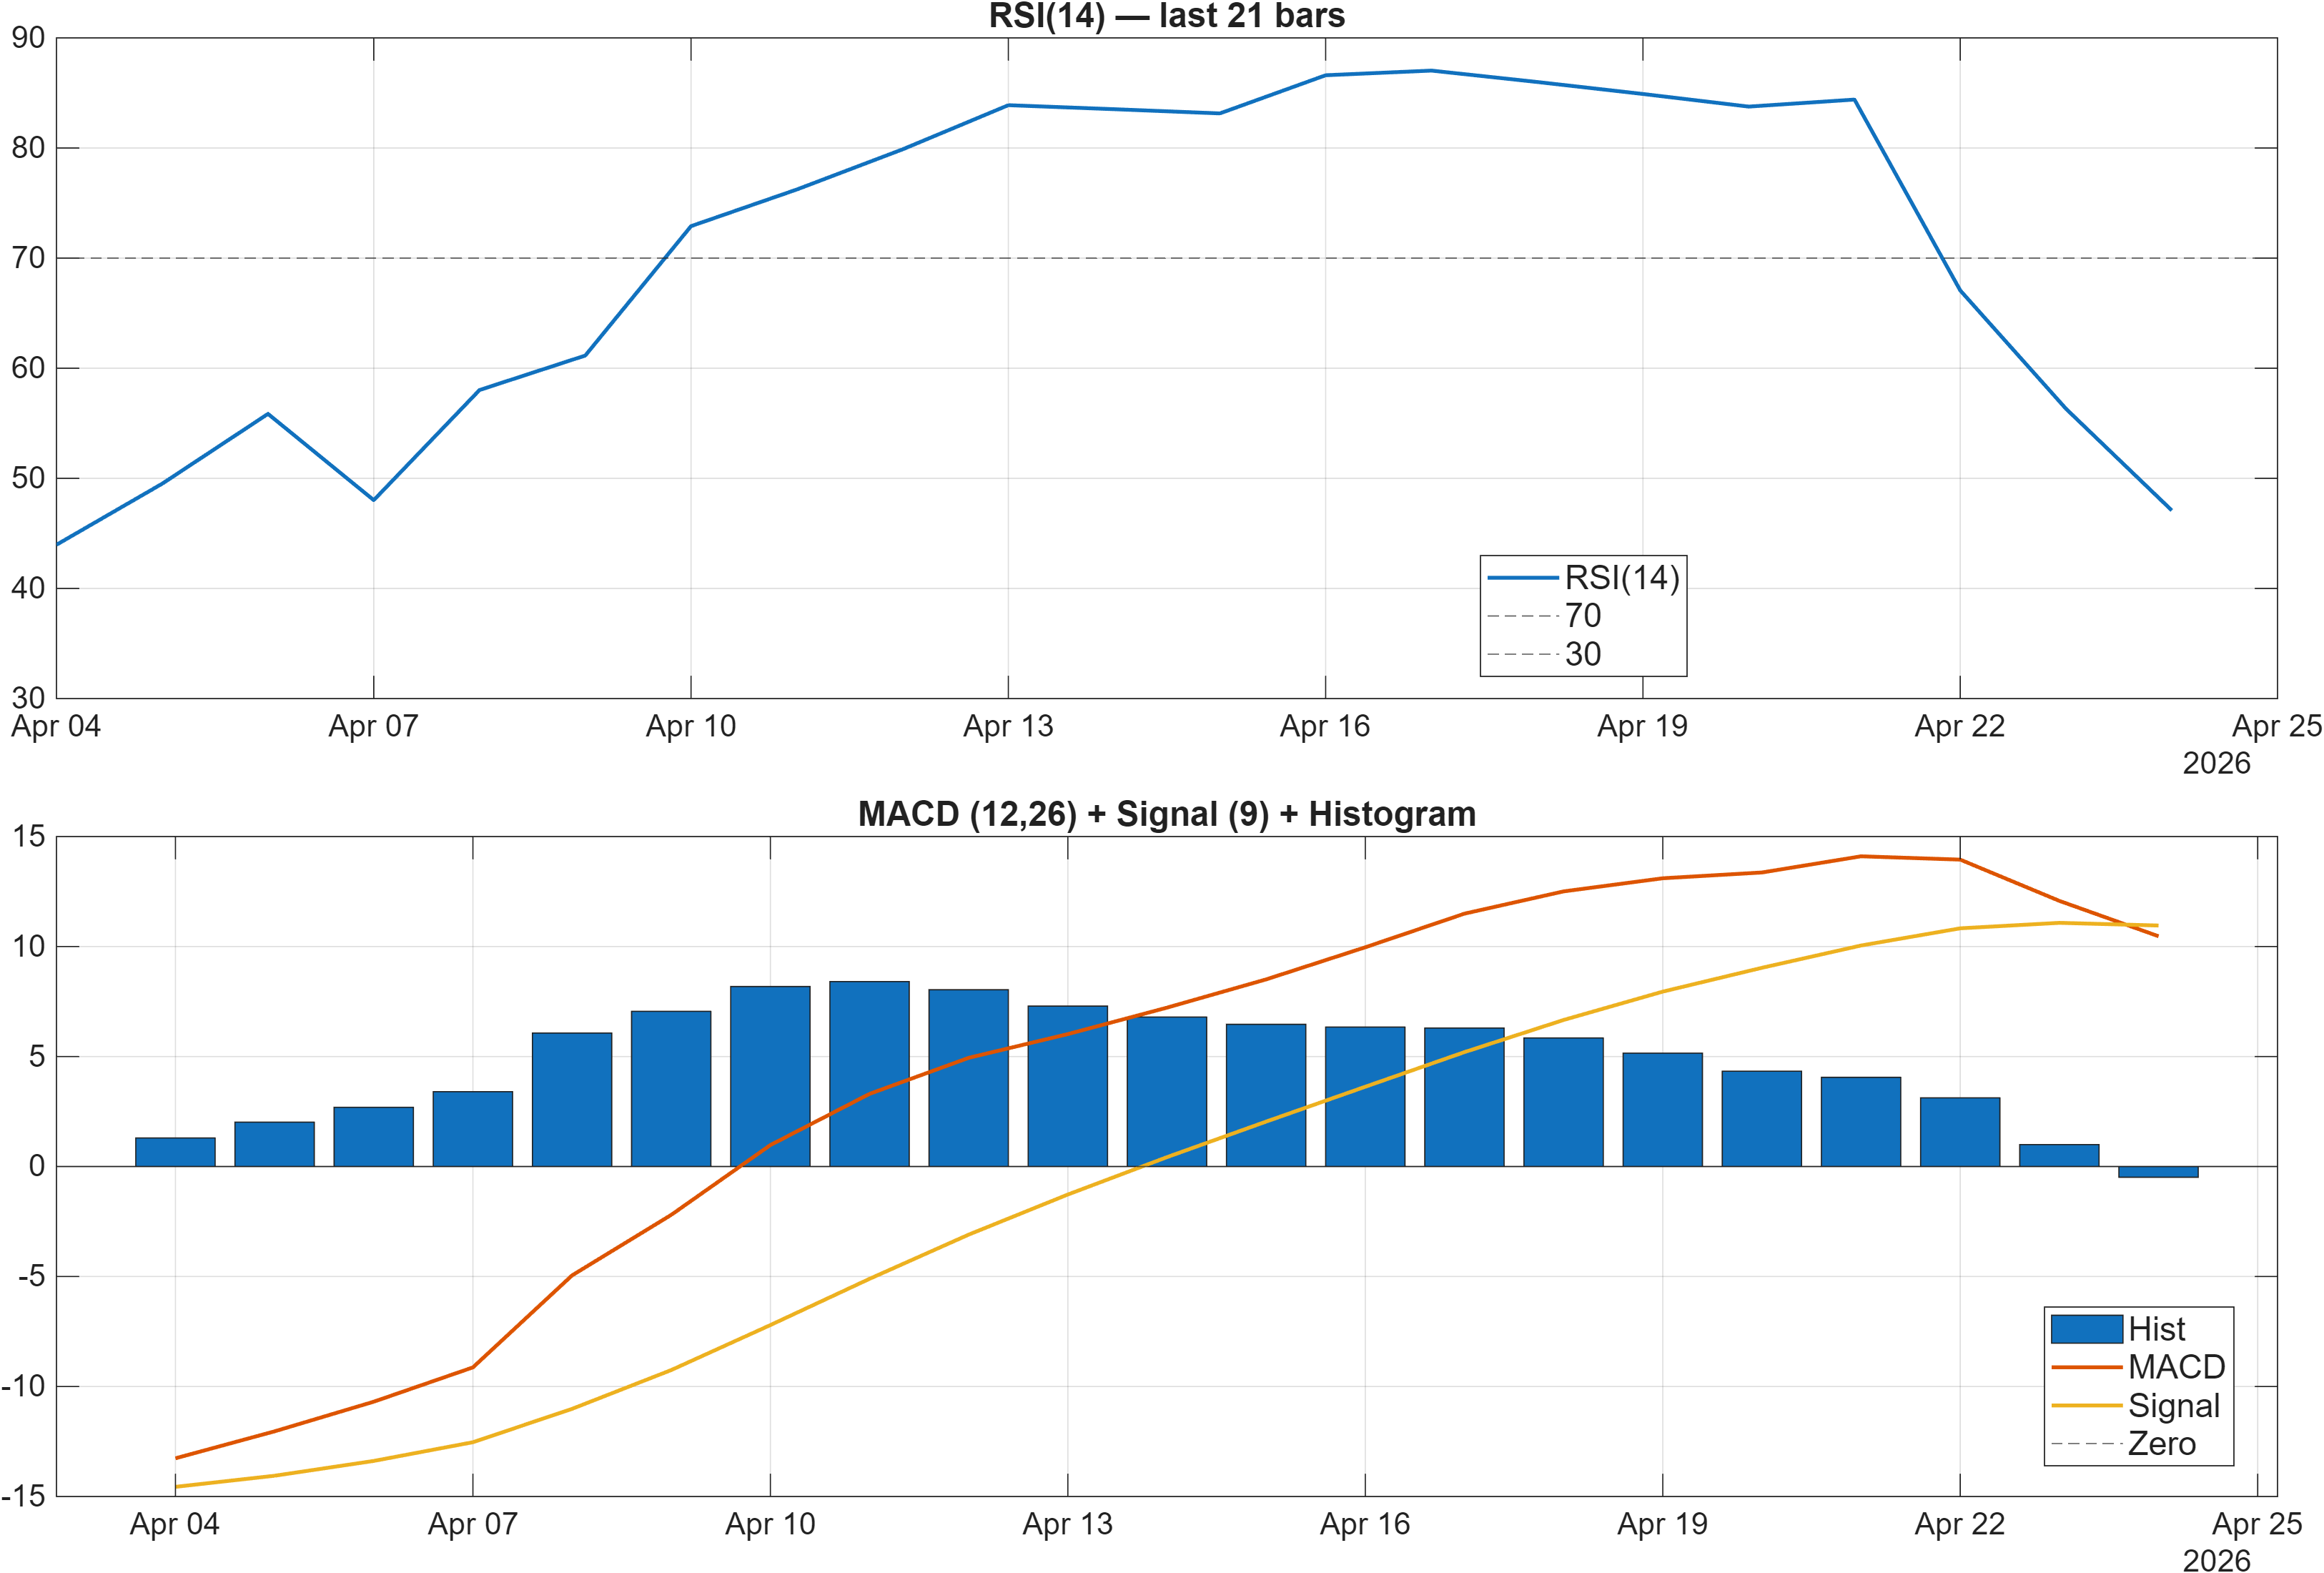
Interpretation: RSI bias = Neutral, MACD hist = -0.4881.
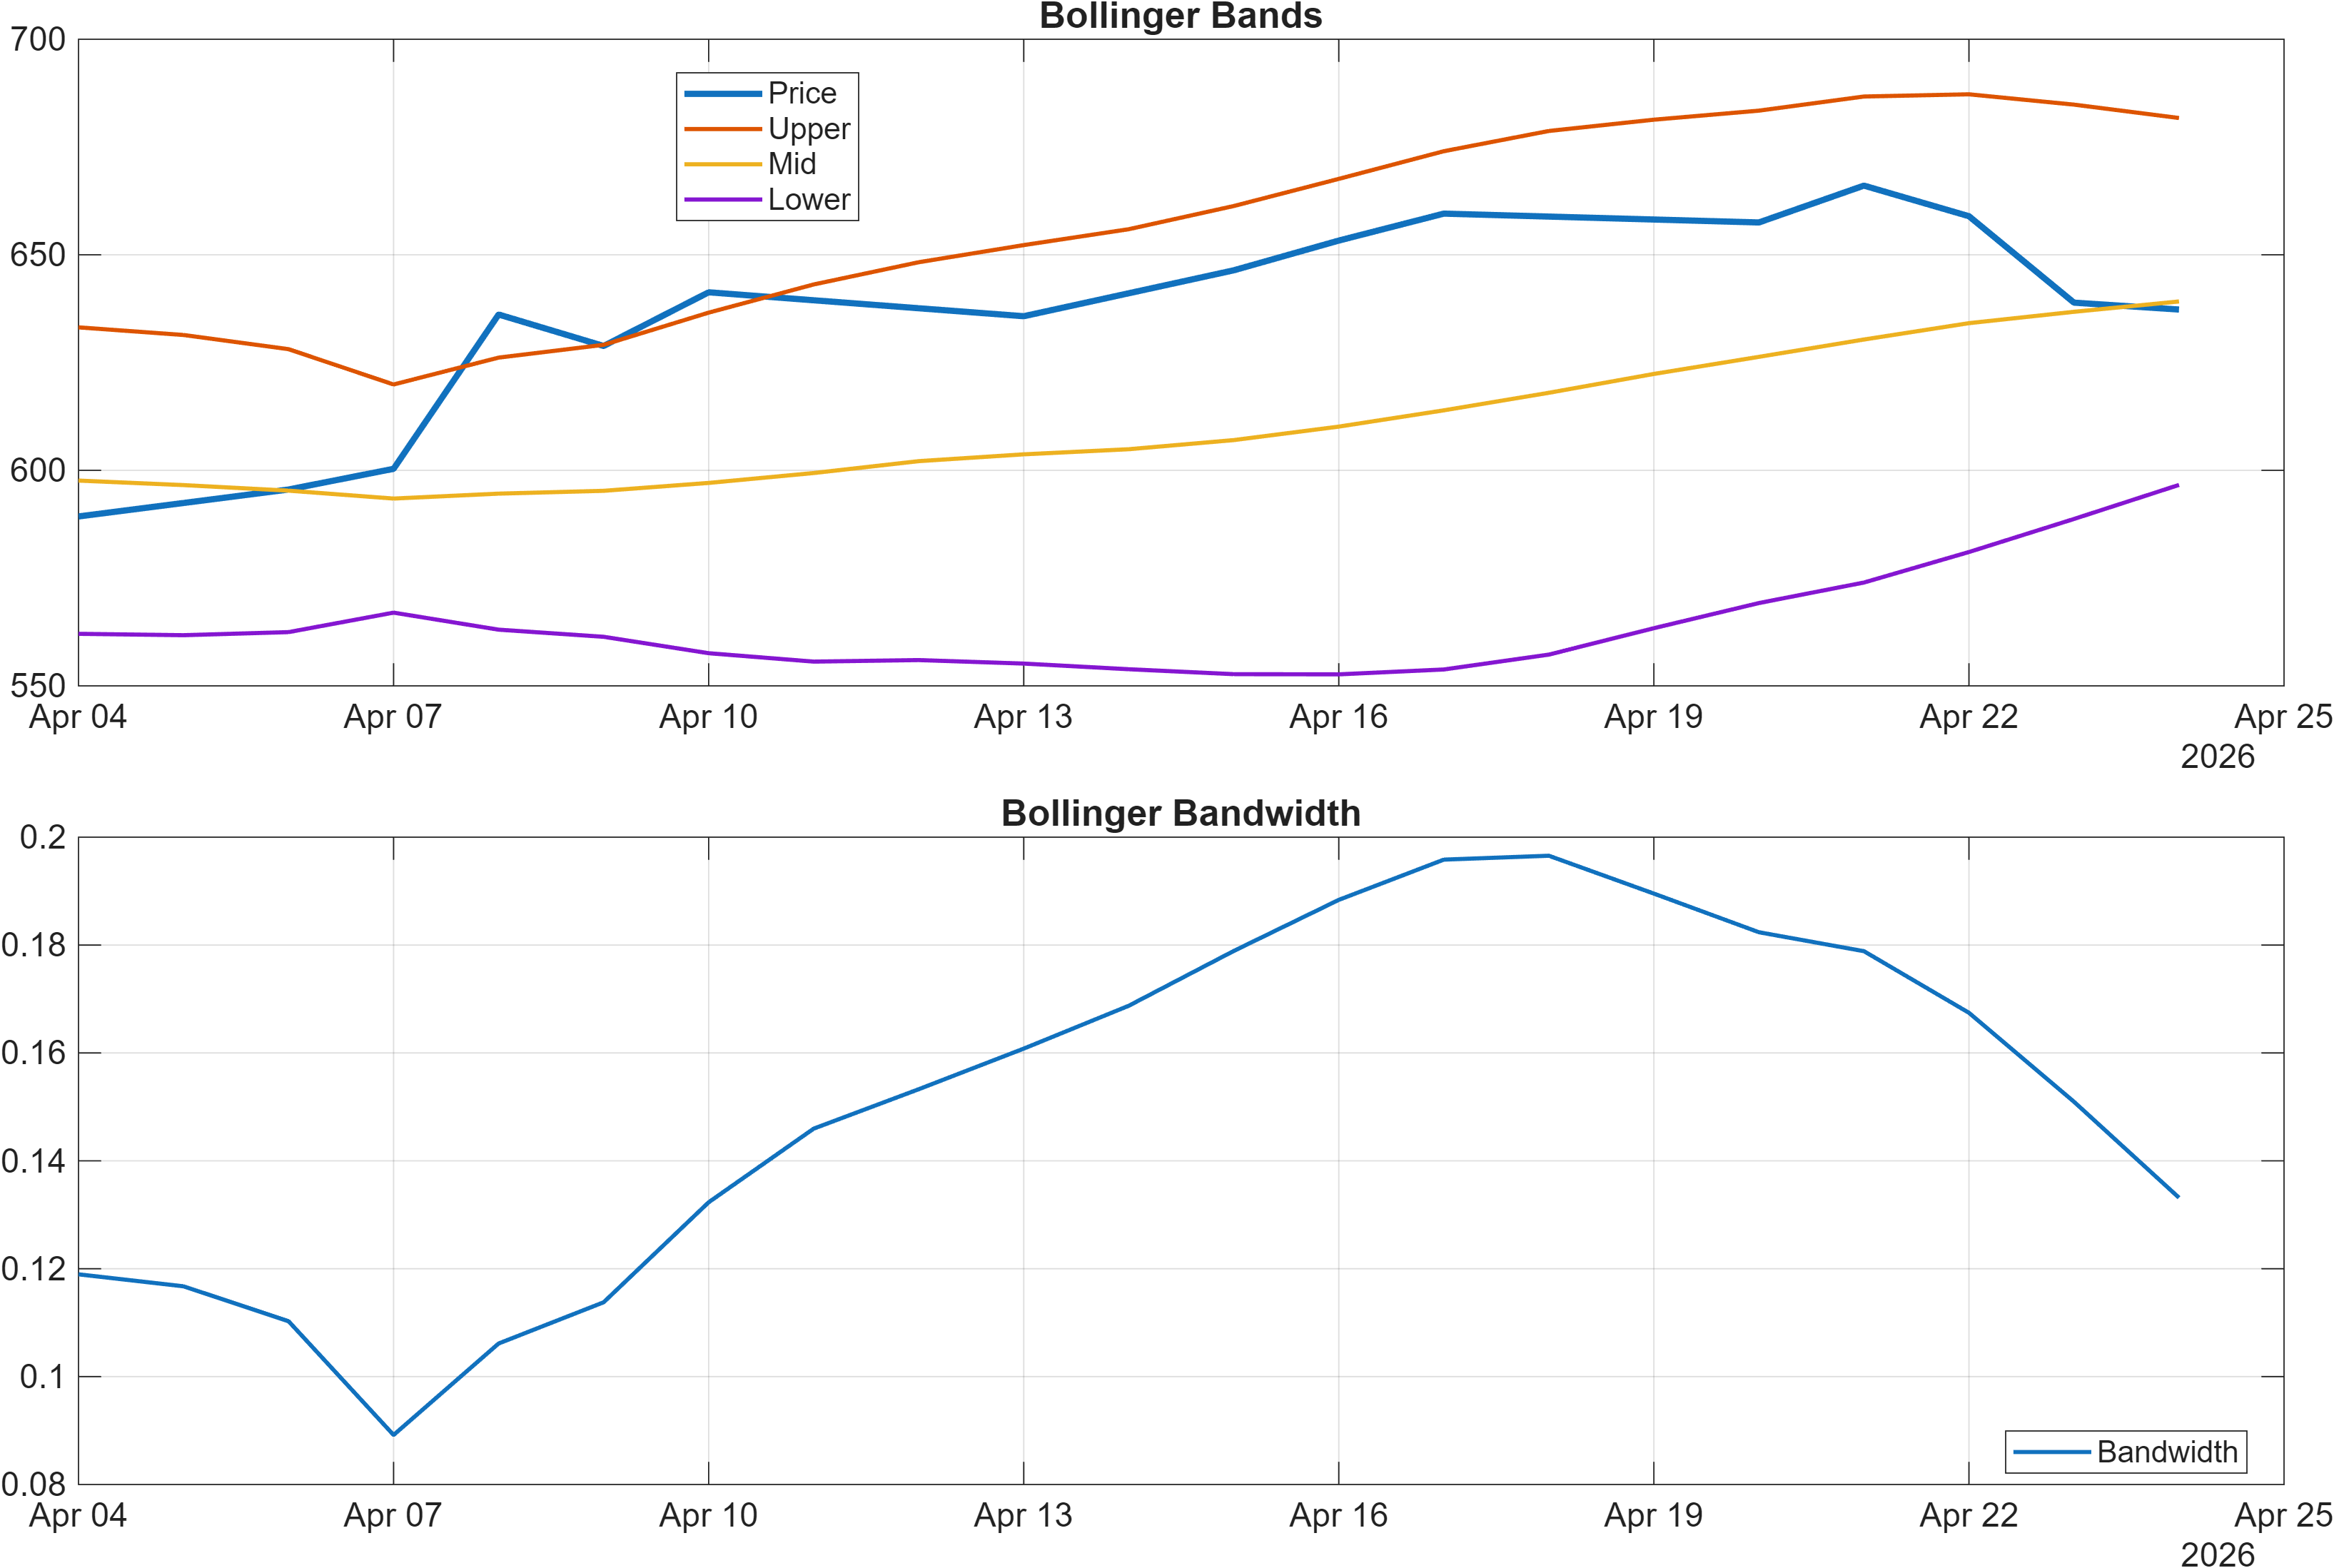
Interpretation: Bandwidth (volatility regime) latest = 0.1332.
Momentum divergence: neutral oscillator, negative MACD impulse
Momentum is not delivering a single, clean message. RSI(14) at 47.09 sits in a neutral zone that typically reflects balance rather than persistent accumulation or distribution. At the same time, the MACD histogram at -0.4881 indicates a negative impulse component, which can act as a headwind for sustained upside unless it starts compressing toward zero. This is consistent with the mixed cross-horizon ranks: short-term weakness can coexist with a non-oversold oscillator.
Volatility conditions are also informative. Bollinger Bandwidth at 0.1332 points to a regime that is neither extremely compressed nor notably expanded. In such conditions, price may “respect” nearby technical levels and drift within ranges until a catalyst forces expansion. That makes support/resistance behavior more decision-relevant than trying to extract directional conviction from a single momentum reading.
The indicator stack also suggests a sequencing risk: with RSI neutral, downside can still occur without triggering classic oversold signals early, particularly if the negative MACD impulse persists. Conversely, any improvement that flips the histogram while RSI remains below midline can still represent a constructive early turn—yet it would remain a confirmation-seeking setup rather than a fully aligned momentum regime. The next sections—levels and multi-signal confluence—are therefore critical for distinguishing a controlled consolidation from a deterioration phase.
4) Support / Resistance zones
Support ~ 575.2667 | Resistance ~ 668.8583
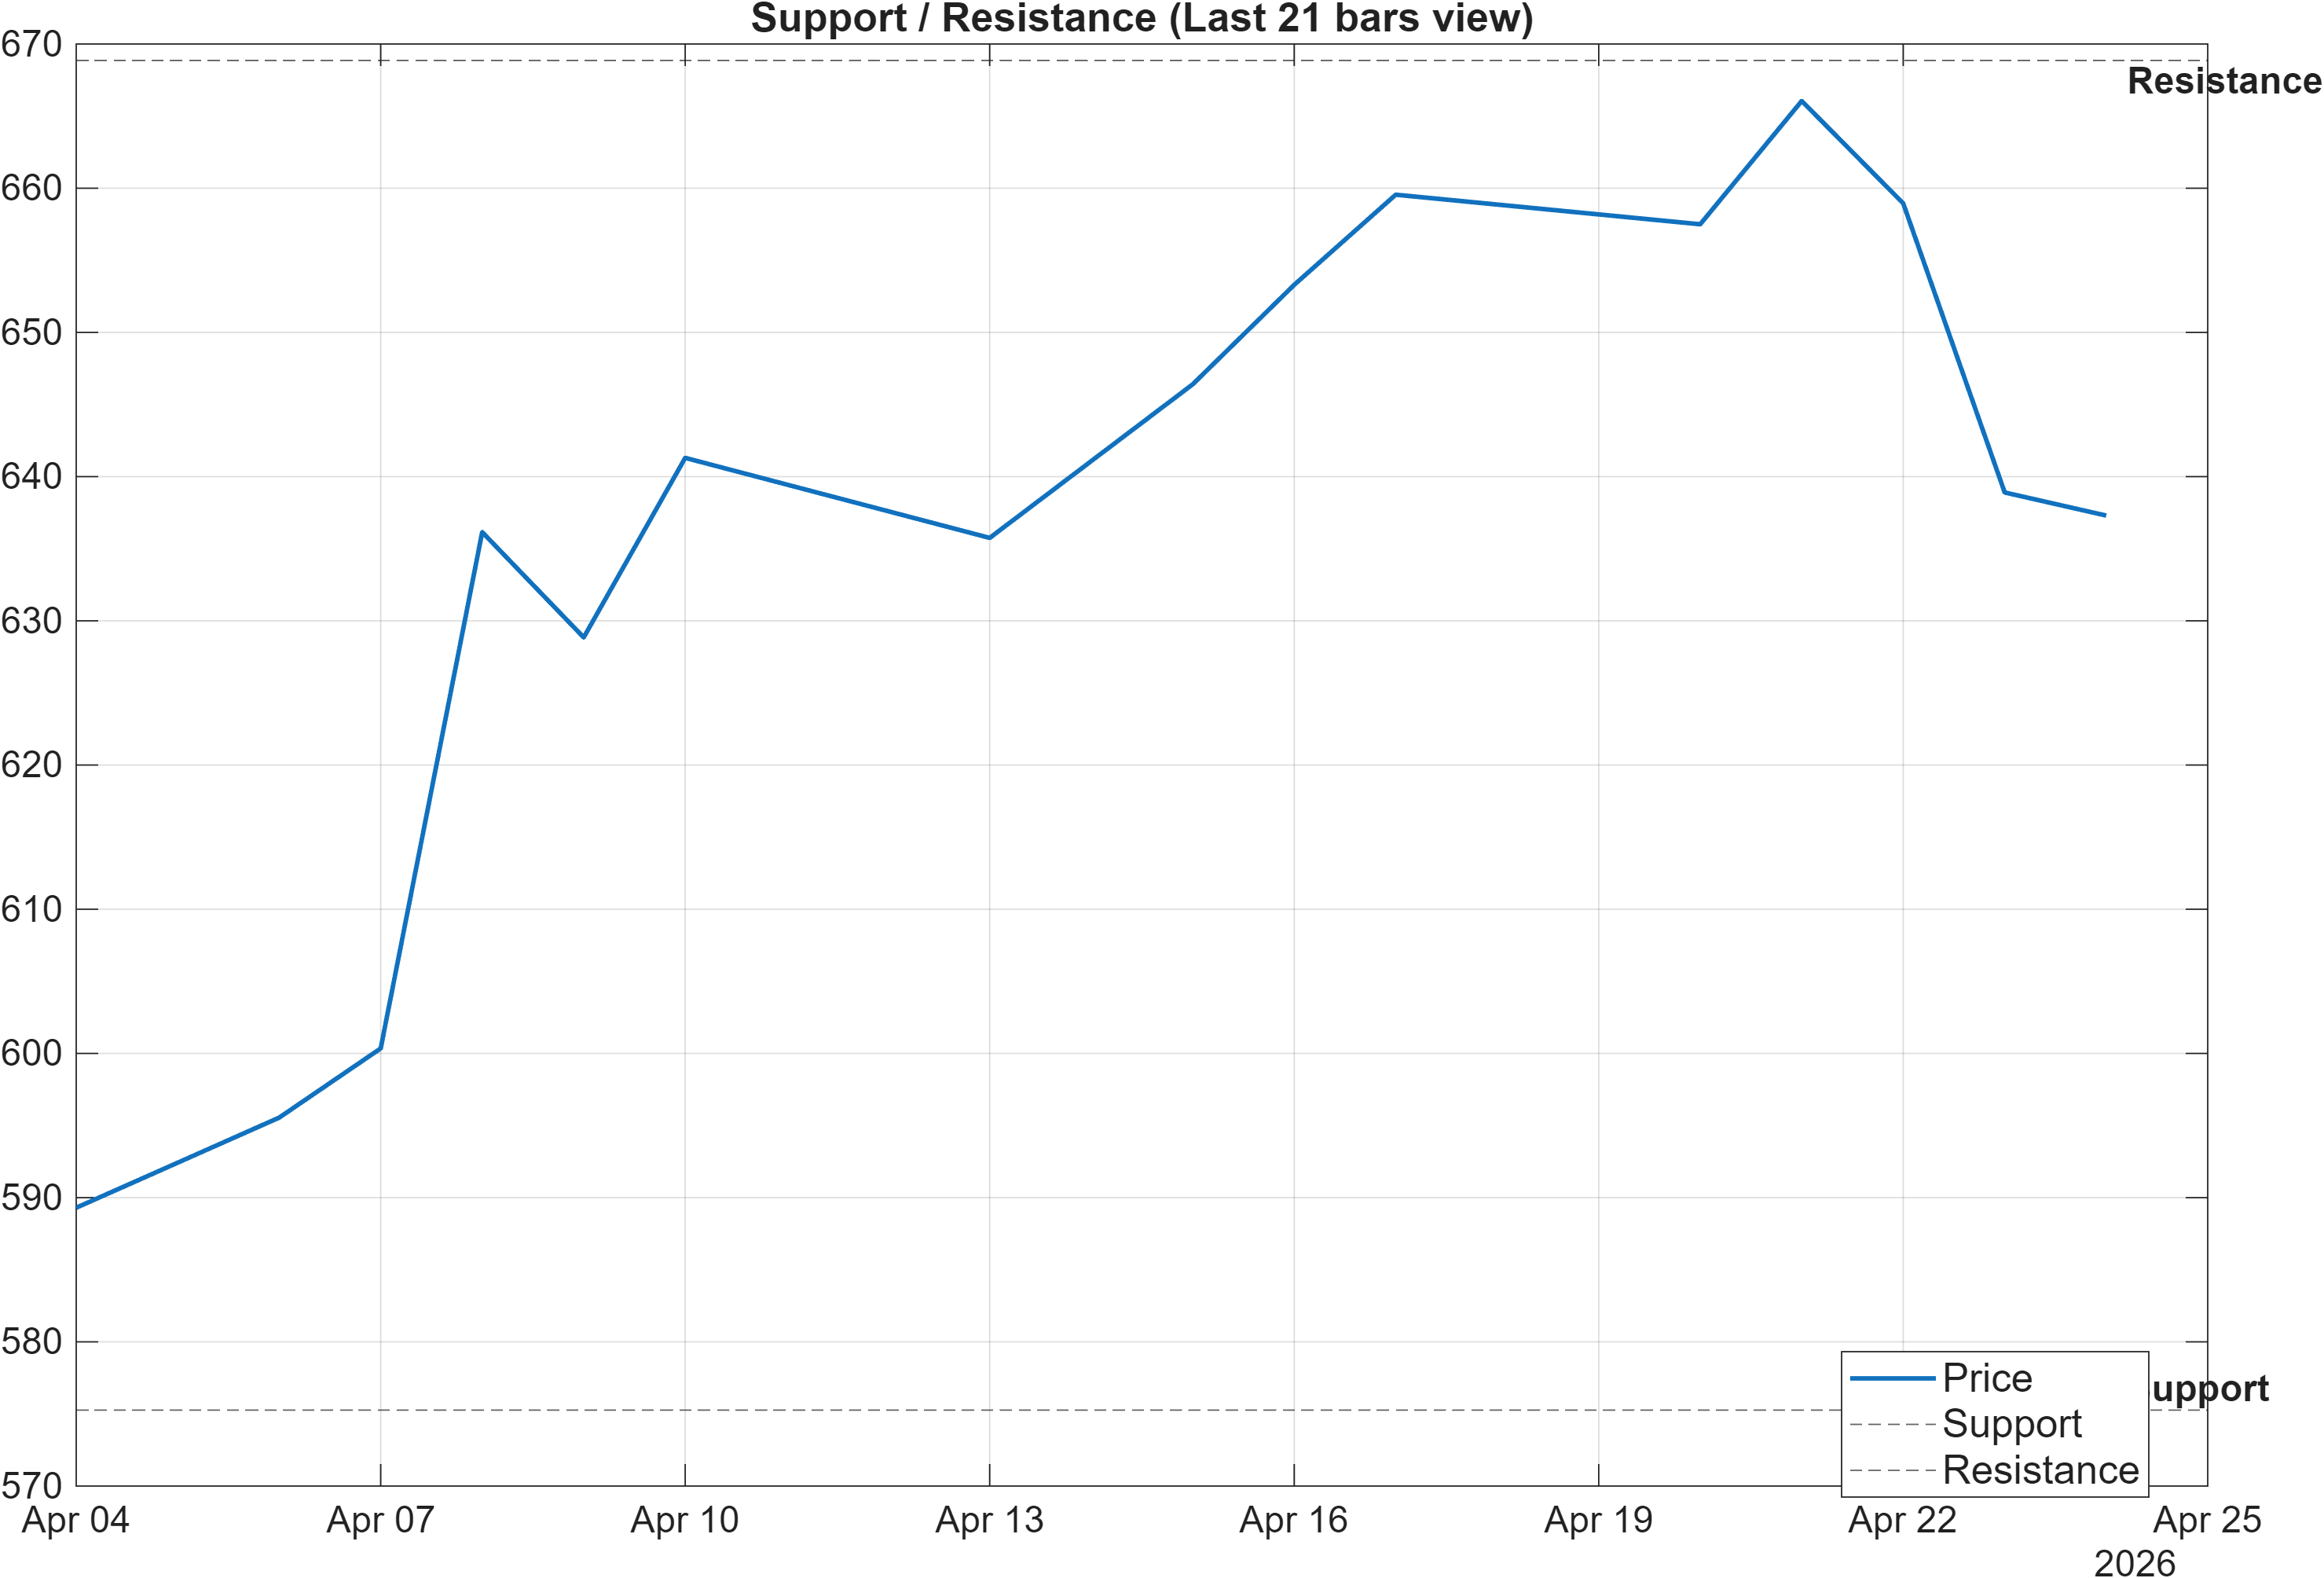
Scenario view: Break above resistance with volume → continuation. Close below support → signal deterioration risk.
Level discipline: decision zones dominate in mixed-signal regimes
With a neutral-to-mixed indicator backdrop and a short-term bearish rank, the market’s reaction to the primary zones—575.2667 support and 668.8583 resistance—becomes the highest signal-to-noise input in the current dataset. A range of roughly this magnitude can absorb multiple indicator “flips” without delivering a durable trend, which is why level acceptance (closing behavior around the zone) is more informative than intraday probes.
The signal table later shows HHIGH(20) at 668.4 and LLOW(20) at 574.8, which closely bracket the stated resistance and support. That proximity implies the zones are not arbitrary: they correspond to recent 20-day extremes. When resistance aligns with a recent high, failed tests can reinforce supply, while clean acceptance above it can force repositioning and reduce mean-reversion pressure.
Risk is more asymmetric on the downside given the daily rank (#1018) and the Bearish DRL technical rank (#1101). Under that backdrop, a close below 575.2667 is not merely a “technical break”; it would also synchronize price with the weaker cross-sectional read, increasing the probability that subsequent rebounds are corrective rather than trend-restoring. On the other side, a break above 668.8583 is most meaningful if accompanied by evidence of participation; the report’s scenario explicitly flags “with volume,” though quantified volume confirmation is not available in the provided data.
5) Quant Technical Dashboard (18 Signals)
KGNAI AI Technical Analysis Score (Deep Reinforcement Learning): Rank #1101 out of 1222 (Rank 1 represents the strongest technical positioning and a higher probability of favorable price behavior. As ranks increase toward the maximum, the probability of favorable outcomes weakens and bearish positioning becomes more dominant.) | Label: Bearish | Score: -0.802
18-Signal Technical Confluence Score: 0.056 (Neutral)
Overall Technical Score (18-signal confluence + DRL rank blend): -0.202 (Neutral)
Note: The blended score reflects signal strength weighted against broader AI technical ranking, which may temporarily diverge.
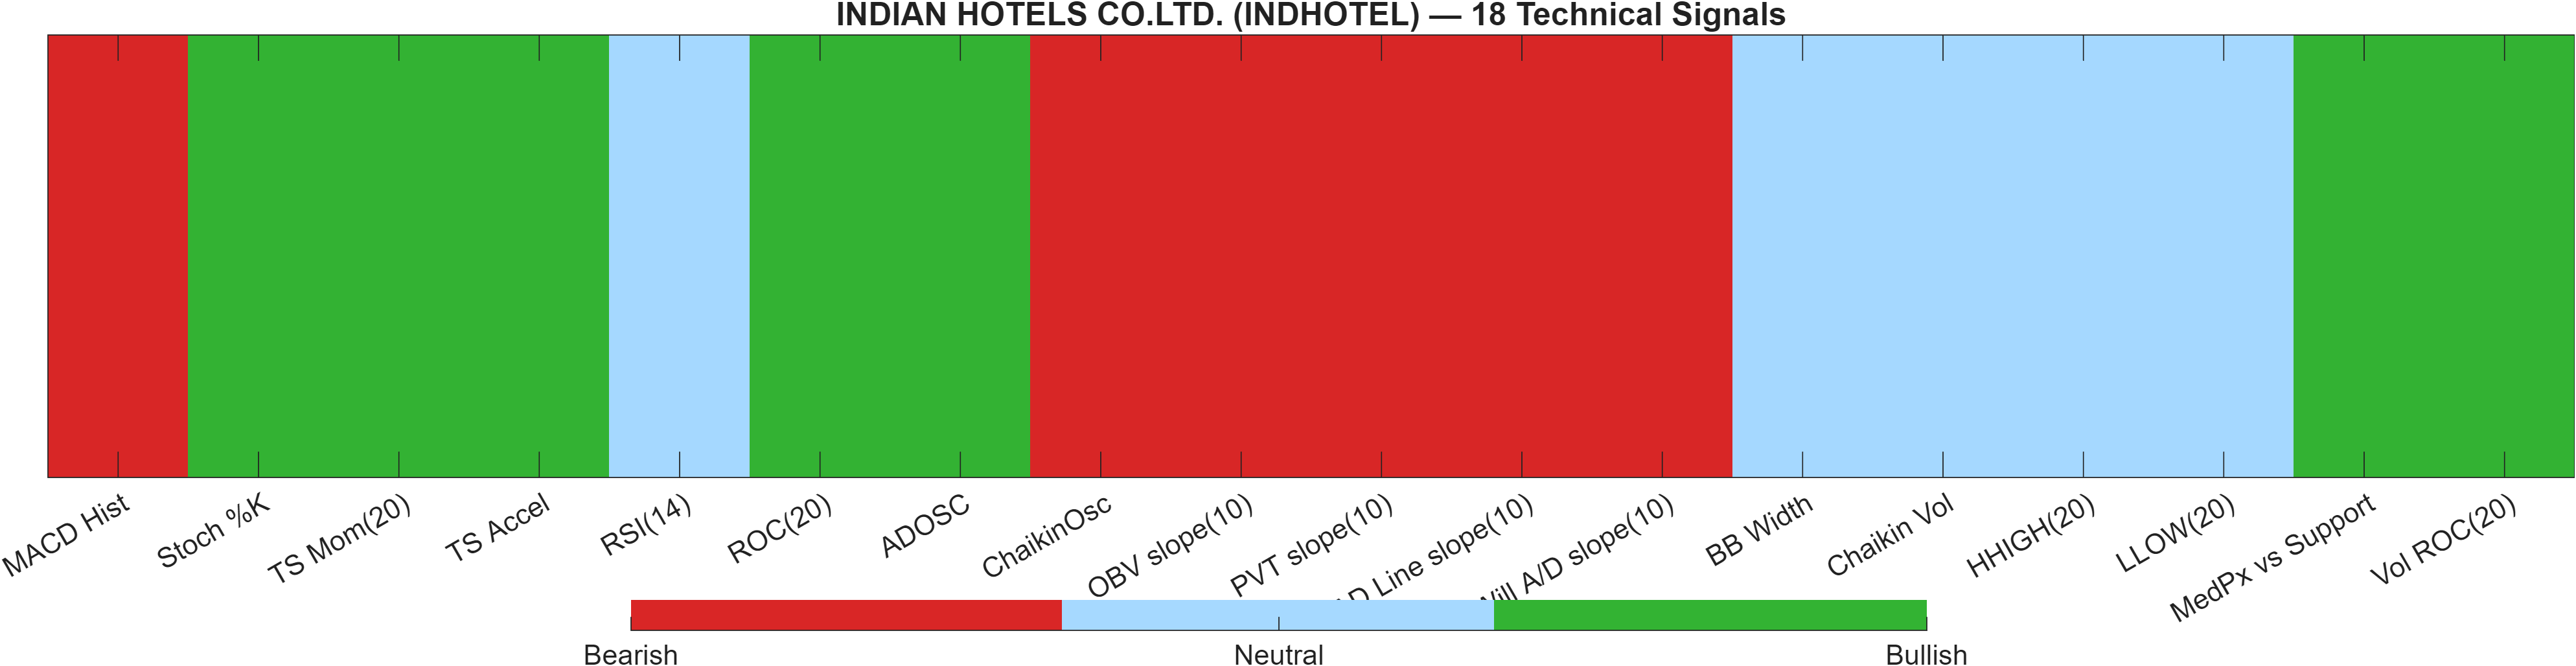
Blended technical score breakdown: -0.202 (Neutral | Bull 7 / Bear 6 / Neutral 5)
Confluence vs. AI rank: mild neutrality masking a heavier tail risk
The dashboard highlights a key tension: the 18-signal confluence is slightly positive at 0.056 (Neutral), yet the DRL rank is Bearish (#1101/1222) with a score of -0.802. The blended outcome lands at -0.202 (Neutral), which is consistent with a market that can oscillate without a durable edge while still carrying latent downside risk in the broader pattern-recognition layer.
Internally, the count split (Bull 7 / Bear 6 / Neutral 5) suggests signal dispersion rather than strong alignment. For example, momentum-style measures show pockets of strength (e.g., Stoch %K at 8.527 marked Bullish and ROC(20) at 7.575 Bullish), while multiple flow/participation proxies lean Bearish (e.g., OBV slope(10) -7.834e+05 and AD Line slope(10) -7.706e+05). That mix can occur when price rebounds but participation remains inconsistent, producing rallies that are easier to fade.
The volatility inputs do not force a directional conclusion: BB Width 0.1332 is Neutral and Chaikin Vol -2.664 is Neutral, supporting the view that the market may be awaiting a range resolution. In such states, the DRL layer can lean Bearish even when surface indicators are balanced, because it weights broader technical positioning across the universe. For decision-making, it argues to prioritize confirmation at 668.8583 rather than treating the slight-positive confluence as a standalone “buy” signal.
Signal table (Bull/Bear/Neutral)
| Indicator | Value | Signal |
|---|---|---|
| MACD Hist | -0.4881 | Bearish |
| Stoch %K | 8.527 | Bullish |
| TS Mom(20) | 46.48 | Bullish |
| TS Accel | 75.35 | Bullish |
| RSI(14) | 47.09 | Neutral |
| ROC(20) | 7.575 | Bullish |
| ADOSC | 6.293 | Bullish |
| ChaikinOsc | -3.083e+05 | Bearish |
| OBV slope(10) | -7.834e+05 | Bearish |
| PVT slope(10) | -1.462e+04 | Bearish |
| AD Line slope(10) | -7.706e+05 | Bearish |
| Will A/D slope(10) | -14.4 | Bearish |
| BB Width | 0.1332 | Neutral |
| Chaikin Vol | -2.664 | Neutral |
| HHIGH(20) | 668.4 | Neutral |
| LLOW(20) | 574.8 | Neutral |
| MedPx vs Support | 71.81 | Bullish |
| Vol ROC(20) | 221.4 | Bullish |
Interpretation: Indicator-level signals form the base confluence, which is then adjusted using a separate AI-driven technical ranking model. The final technical score summarizes this combined view.
6) News sentiment + extractive gist
Note: Instrument-specific news matches were not found, so the digest includes broader market/sector headlines. Links are provided for verification.
Sentiment score (avg): 0.090 | Positive: 25% | Neutral: 63% | Negative: 12%
KGNAI AI News Sentiment Score (normalized -1 to +1): 0.99 (as of 2025-07-08) | Label: Bullish | Overall news score: 1.00
Positive Developments
Recent coverage across major financial outlets indicates a constructive tone around selective equity opportunities, earnings-related upside surprises, and tactical “trading guide” framing—elements that can lift risk appetite even when the featured stories are not instrument-specific. In the provided sentiment aggregation, that shows up as a modestly positive average (0.090) with a 25% positive share and a dominant neutral share (63%). For INDHOTEL, this kind of backdrop can help stabilize price behavior near well-defined technical zones, particularly when volatility is not elevated (BB Width 0.1332). Importantly, the platform’s normalized news score is shown as 0.99 (Bullish, as of 2025-07-08), which can be read as a supportive bias in the broader narrative environment—even though it does not substitute for technical confirmation given the stock’s Bearish short-term rank (#1018/1222) and negative MACD impulse (-0.4881).
Neutral / Mixed Developments
The neutral cluster in the digest is dominated by macro and cross-asset risk framing—equity index drawdowns, geopolitical tension, and mixed corporate results. Such coverage typically transmits through volatility and correlation rather than through single-name fundamentals, which is consistent with the note that instrument-specific matches were not found. With 63% of items categorized as neutral and RSI(14) at 47.09, the informational flow is better interpreted as “context” than as a directional driver. For INDHOTEL, neutral macro-heavy news tends to amplify the importance of technical acceptance at the edges of the range: markets often defer commitment until either 668.8583 (resistance) is reclaimed convincingly or 575.2667 (support) fails on a closing basis.
Negative / Risk Signals
Risk coverage in the digest emphasizes earnings disappointments, outlook cuts, and broad risk-off sessions—factors that can compress multiples and reduce tolerance for technically weak setups. While the negative share is comparatively contained at 12%, it matters because INDHOTEL’s technical picture is already carrying asymmetry: the DRL technical rank is #1101/1222 (Bearish) and MACD histogram is -0.4881. In that configuration, negative macro or earnings shocks elsewhere can have an outsized impact by accelerating de-risking into nearby support. The key operational risk is not that sentiment is decisively bearish (it is not), but that moderate external stress can be sufficient to push a mixed-confluence chart into a more directional downswing—especially if price begins to close below 575.2667.
- Whether price can accept above 668.8583 (not just test it), ideally with visible participation on the chart.
- Whether the stock holds 575.2667 on a closing basis during broader market stress.
- Whether MACD histogram (-0.4881) begins to compress toward zero while RSI remains stable near 47.09.
Sources referenced: Reuters, Bloomberg, Yahoo Finance, MarketWatch, Investing.com
7) Sources
Not available in the provided data.
You may also like: How KGNAI AI ranks instruments across global markets
Disclaimer: KGNAI provides AI-generated analytics and educational market commentary only. This is not financial advice. Markets involve risk. Always do your own research.