
KALYANKJIL (Kalyan Jewellers India Limited) — Neutral ranks with bearish technical confluence (15-May-2026)
As of 15-May-2026, KGNAI’s cross-sectional positioning for Kalyan Jewellers India Limited (KALYANKJIL) sits in a short-to-mid neutral stance, while the technical stack leans bearish. Daily, weekly, and monthly ranks are neutral, but the 3-month horizon turns bullish (#108 out of 1222), creating a timeframe divergence that often coincides with transition regimes rather than clean continuation. On-chart structure also signals stress: price is below MA50 and the MA50 is below MA200, aligning with a weaker trend state. Momentum/participation measures add asymmetry—RSI(14) at 27.89 and a negative MACD histogram (-6.1976) point to downside momentum, yet some volume dynamics (e.g., Vol ROC(20) at 247.4) argue for monitoring whether selling pressure is nearing exhaustion. Key decision levels are clearly defined at support ~364.9500 and resistance ~448.2250, with news sentiment broadly neutral (avg 0.148).
- Rank stance: Short-term Neutral (Daily #507; Weekly #315) | Mid-term Neutral (Monthly #622) | Long-term Not available (6M/1Y not available)
- Technical confluence: Bearish (18-signal score -0.556; blended overall -0.487; DRL technical rank #810)
- Key levels: Support ~364.9500 | Resistance ~448.2250
- News sentiment bias: Neutral (avg 0.148; 44% positive / 56% neutral / 0% negative)
- Confirmation / invalidation condition: A break above 448.2250 with volume supports continuation; a close below 364.9500 increases deterioration risk.
KGNAI evaluates assets using large cross-sectional datasets built from millions of structured data points. Inputs incorporate fundamental metrics, technical structures, and systematically processed news sentiment. Statistical models, machine learning, and AI frameworks are used to assess relative positioning, signal alignment, and probabilistic behavior across broad universes.
- Ranks are comparative across the tracked universe, not absolute price targets.
- Confluence reflects alignment among independent signal groups.
- Support/resistance levels are probabilistic decision zones, not guarantees.
- Sentiment provides contextual bias within the broader analytical framework.
1) KGNAI AI Analysis
Region: INDIA
Total universe size: 1222 ranked instruments
- Daily rank: #507 out of 1222 — Neutral
- Weekly rank: #315 out of 1222 — Neutral
- Monthly rank: #622 out of 1222 — Neutral
- 3-Monthly rank: #108 out of 1222 — Bullish
- 6-Monthly rank: Not available for this horizon — Not available
- Yearly rank: Not available for this horizon — Not available
Cross-horizon alignment vs divergence
The rank stack is neutral on the shorter horizons—daily (#507), weekly (#315), and monthly (#622) sit near the mid-band of the 1222-instrument universe—while the 3-month rank improves materially to #108 (bullish). This split matters because it frames the current tape as a potential late-stage drawdown inside a still-constructive intermediate window, rather than a uniformly weak setup. In practice, that kind of divergence often surfaces when downside momentum is strong enough to pressure short-term models, but not yet large enough to fully reverse the broader cross-sectional behavior.
The “term view” reinforces this: Short-term: Neutral, Mid-term: Neutral, and Long-term: Not available due to missing 6M/1Y horizons. With long-horizon ranks not available in the provided data, the more defensible read is to treat the 3-month bullish rank as a conditional tailwind—not a standalone override—until price/technical confluence improves.
From a market-structure perspective, neutral ranks can be informative when paired with strong technical skew (Section 5): they suggest the instrument is not isolated as an extreme outlier in the universe, even though the current signal mix is directionally negative. That combination tends to heighten the importance of well-defined decision levels (support 364.9500 and resistance 448.2250) as regime filters.
KGNAI ranks each instrument across large universes using multiple proprietary AI tests and statistical models (millions of data points). Lower ranks generally indicate stronger probability of favorable performance behavior, while higher ranks indicate weaker probability and more bearish positioning.
Term view: Short-term: Neutral. Mid-term: Neutral. Long-term: Not available.
Want the full universe and complete rank tables? Unlock full access on KGNAI: https://www.kgnai.com/pricing
2) Price & trend overview
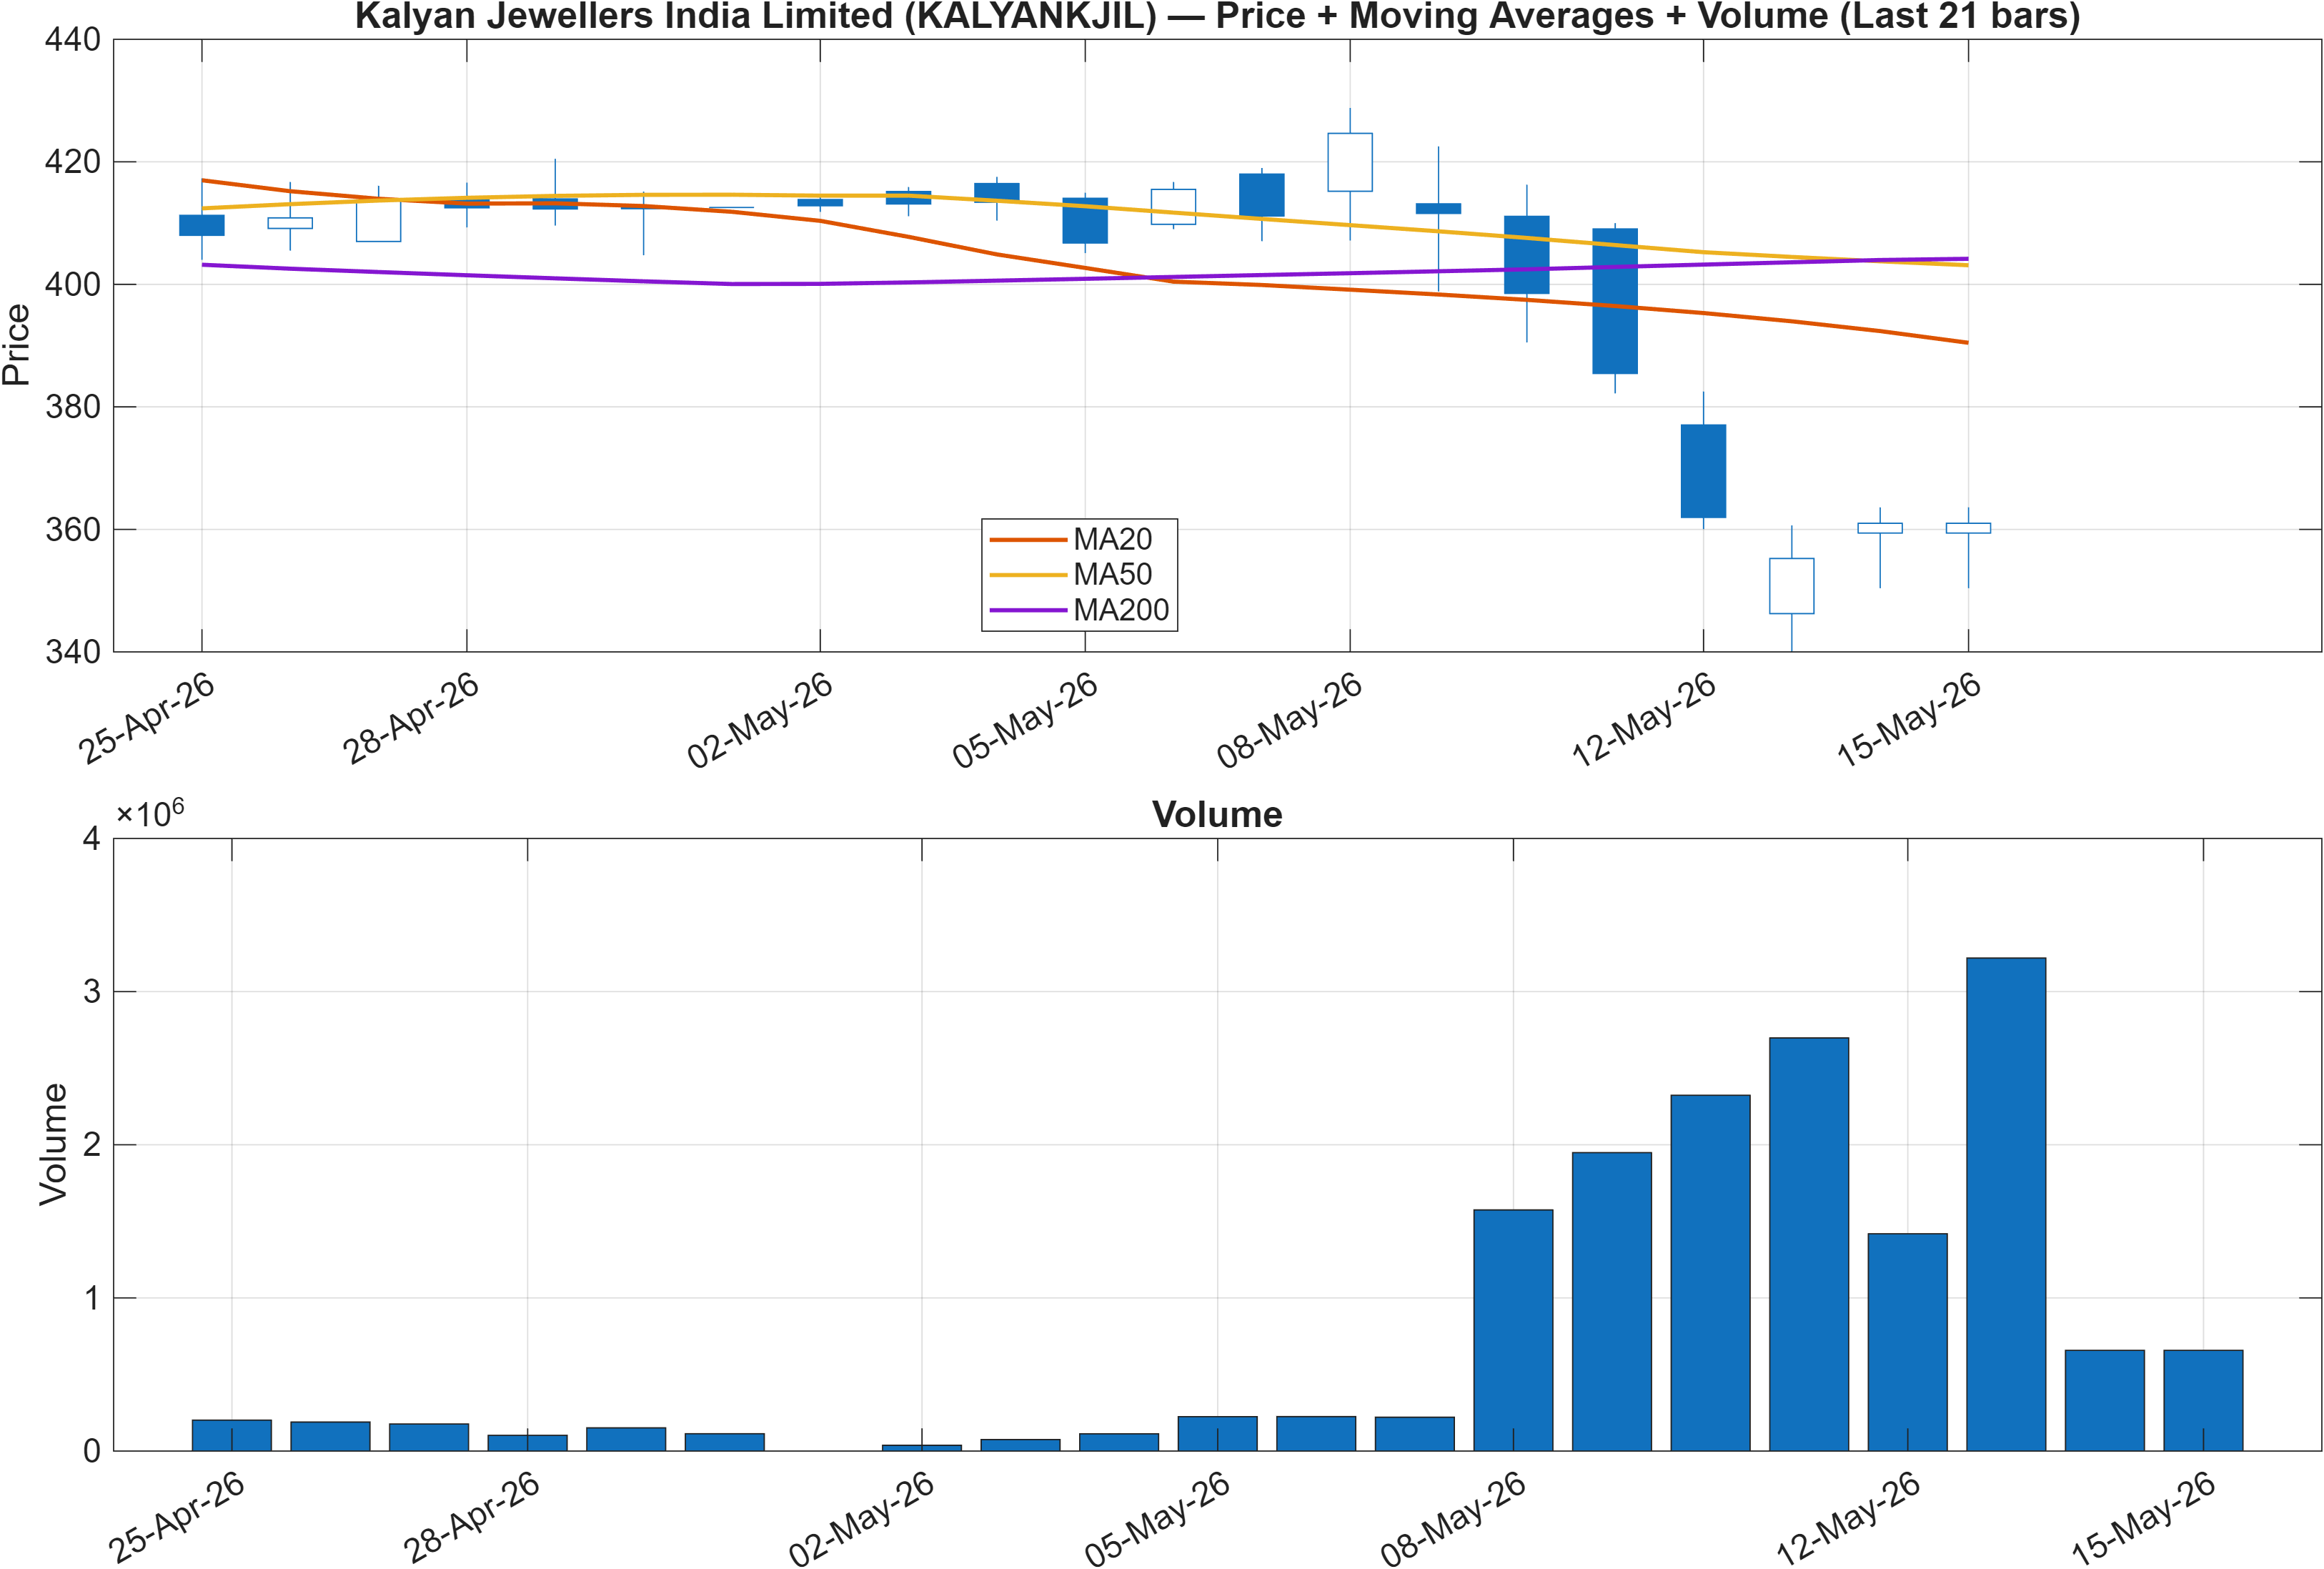
Trend state: downside structure with a potential base-building requirement
Trend diagnostics are currently tilted to the downside: the close is below MA50 and MA50 is below MA200 (bearish/bearish). This two-layer moving-average configuration often corresponds to a market phase where rallies face overhead supply and require repeated confirmation through higher lows and improving momentum before the trend profile changes.
Against that backdrop, the support/resistance map (support 364.9500, resistance 448.2250) becomes the practical scaffold for interpreting price action. When price is operating beneath key moving averages, the probability of “mean reversion rallies” increases, but follow-through tends to be more selective unless participation improves. The participation question is relevant here because later sections show mixed volume evidence—some accumulation-style readings exist (e.g., ADOSC 56.06 bullish), but other flow proxies deteriorate (e.g., OBV slope(10) -9.372e+06 bearish).
The rank divergence adds nuance: the 3-month bullish rank (#108) implies the intermediate relative behavior has been stronger than the current short-term technical posture suggests. For trend readers, that combination often points to a “repair” phase—where the instrument may need to reclaim key averages and stabilize above decision zones before the intermediate signal can express cleanly. Until then, trend persistence risk remains elevated given the bearish MA stack and the broader confluence score.
Interpretation: Close vs MA50 = Bearish, MA50 vs MA200 = Bearish.
3) Momentum & volatility dashboard
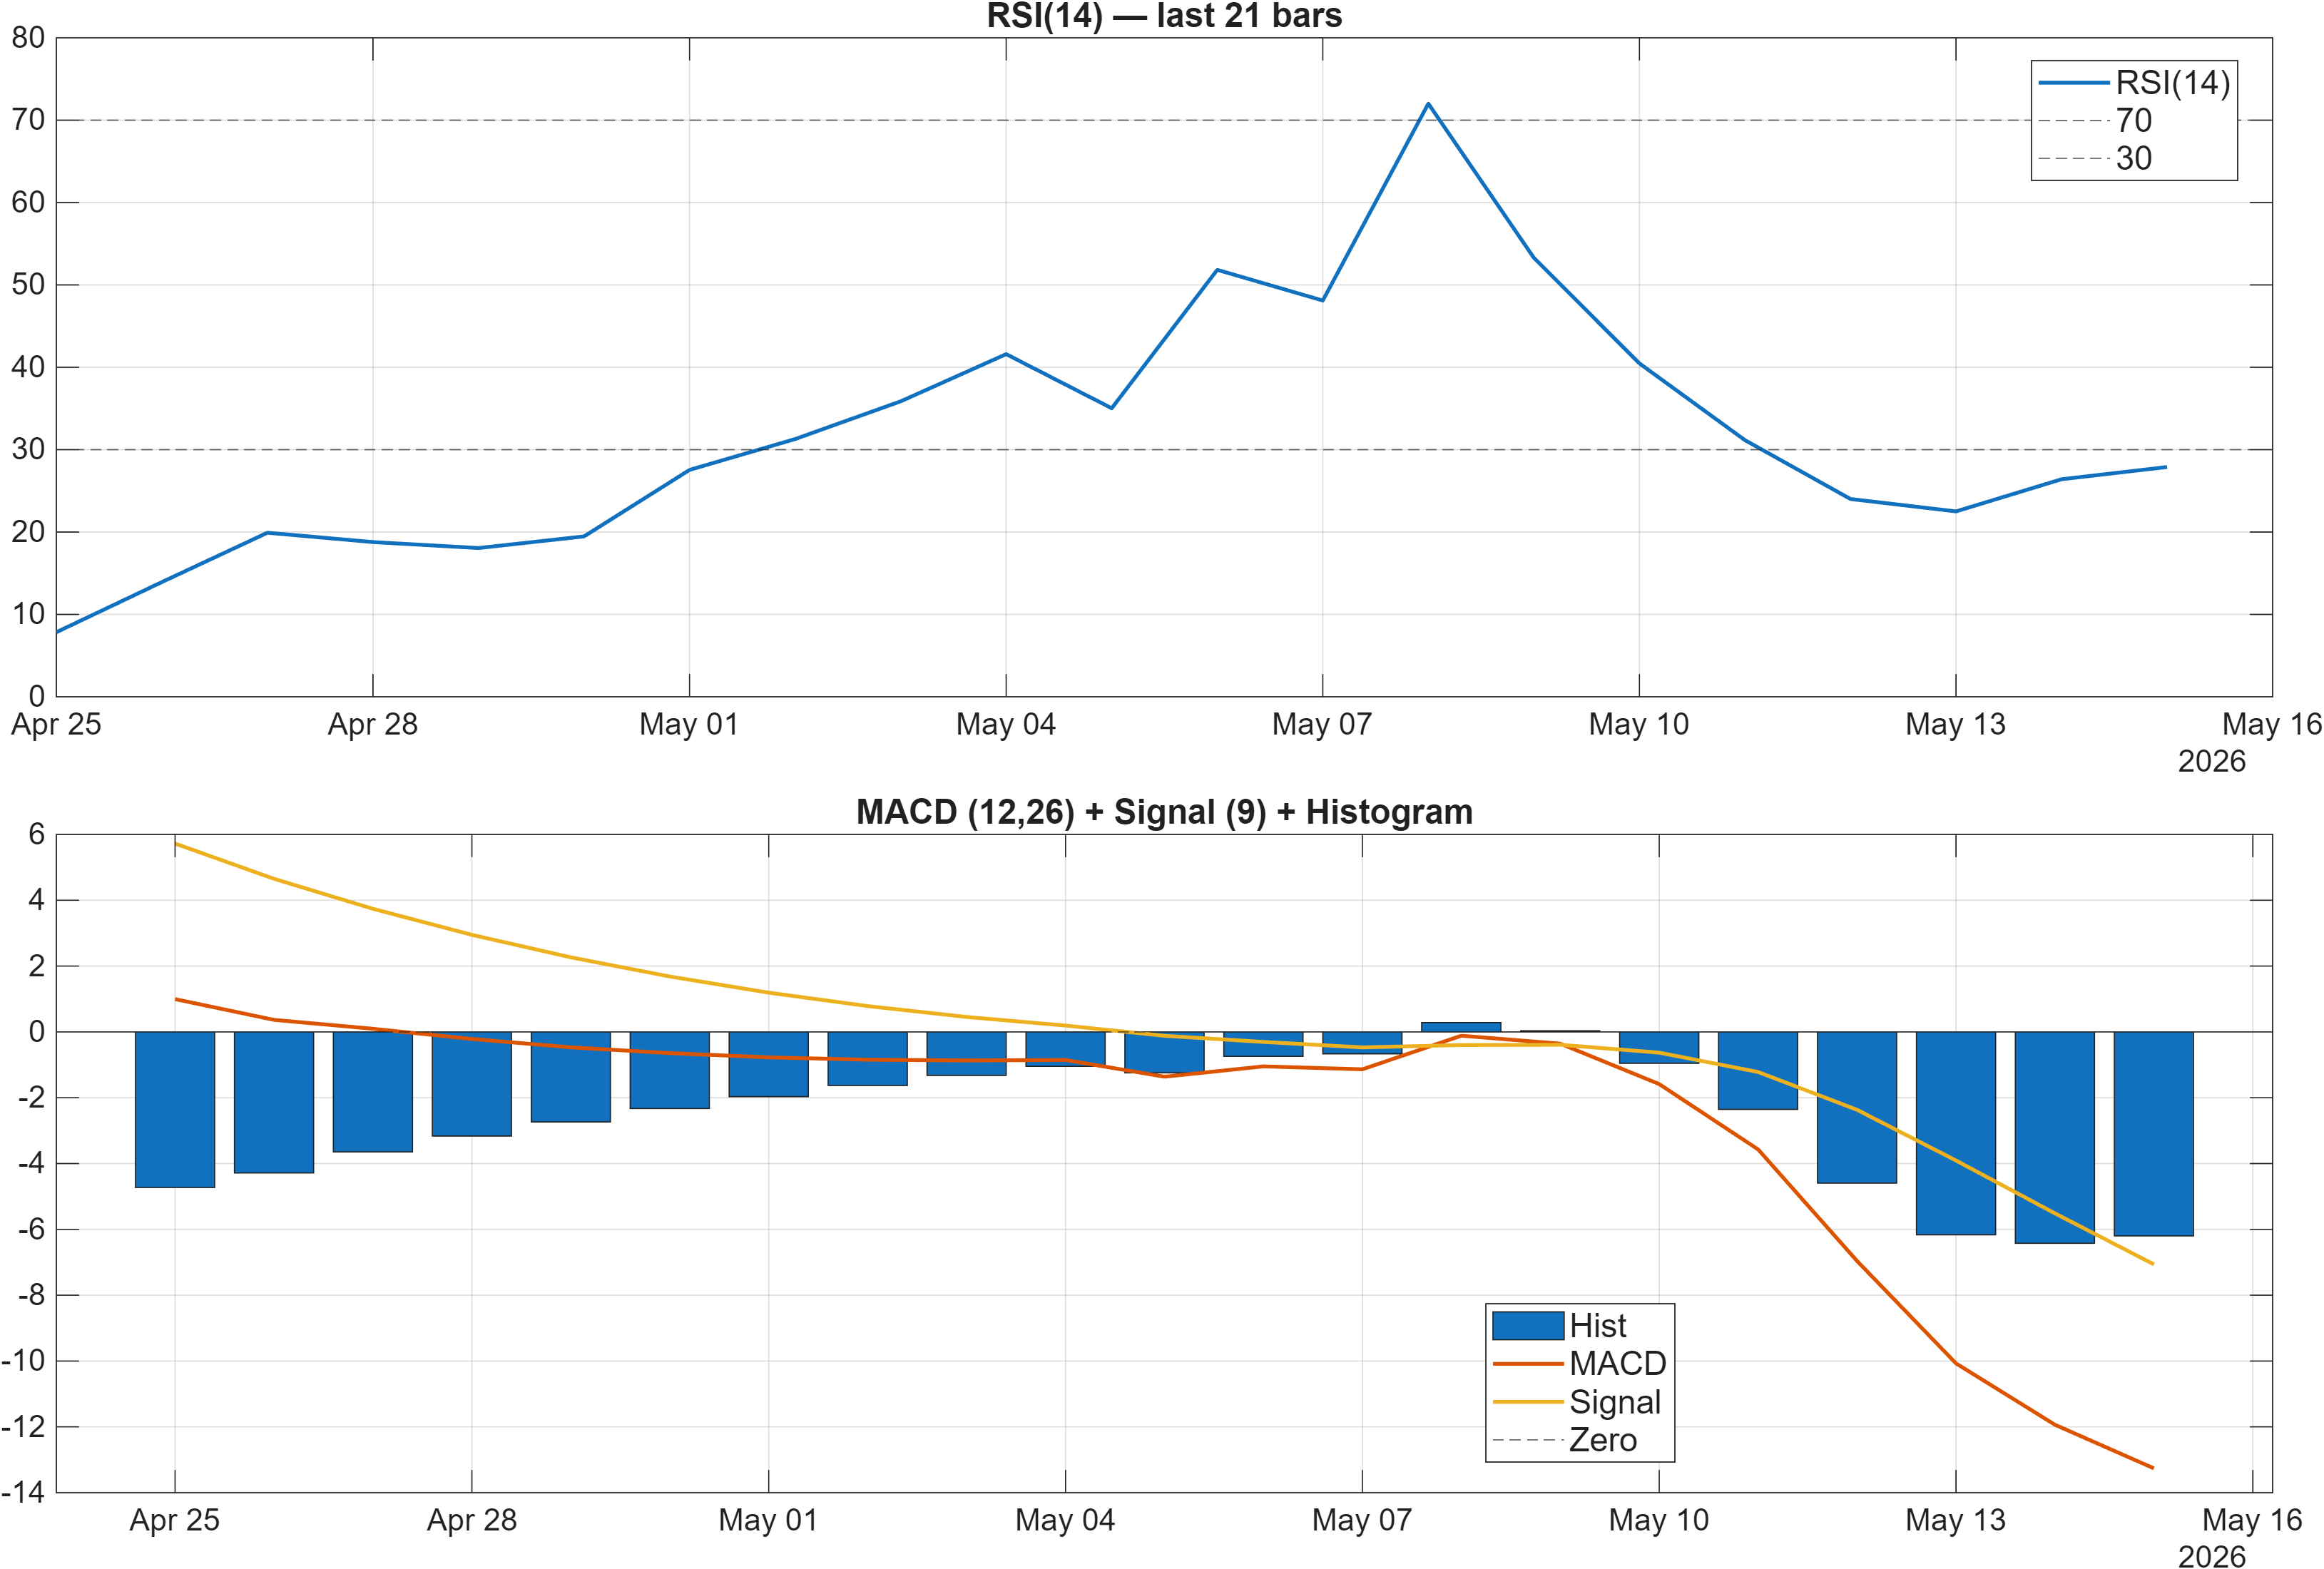
Interpretation: RSI bias = Bearish, MACD hist = -6.1976.
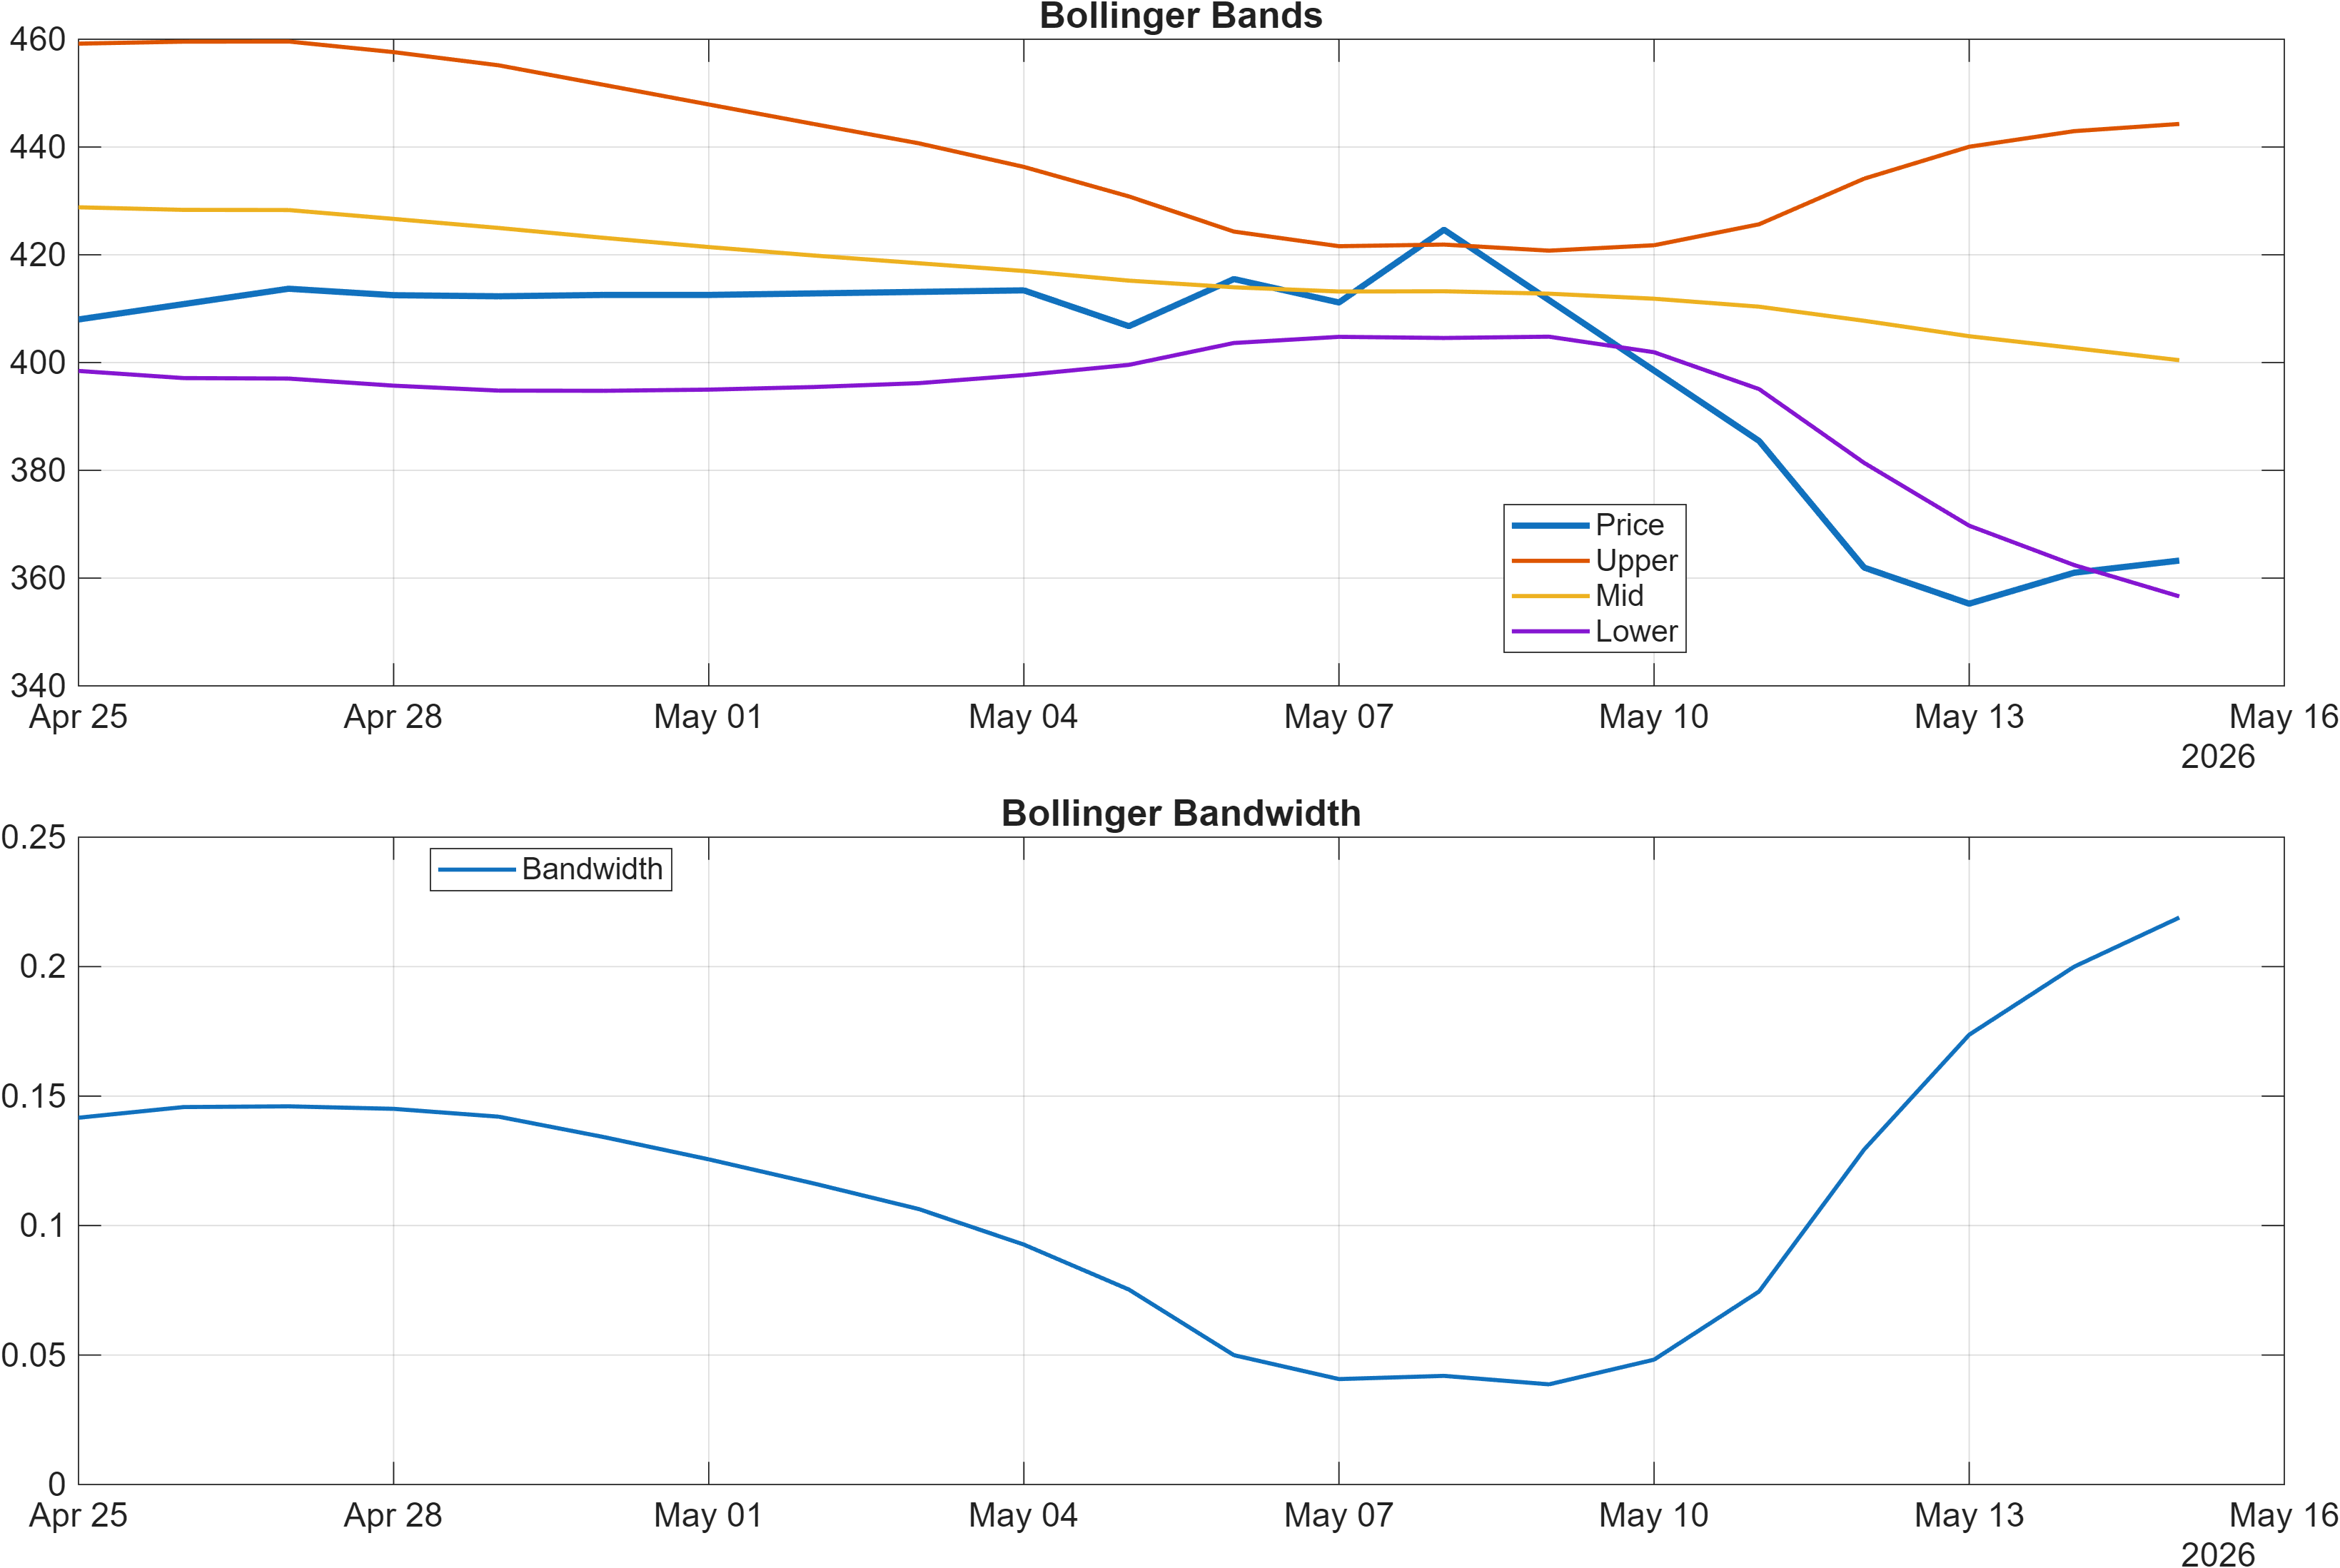
Interpretation: Bandwidth (volatility regime) latest = 0.2189.
Momentum pressure vs volatility regime: oversold-like readings without confirmed turn
Momentum signals are presently skewed negative, led by RSI(14) at 27.89 and a MACD histogram at -6.1976. Taken together, this typically indicates downside momentum has been persistent rather than episodic. Importantly, a low RSI can coincide with both “capitulation” behavior and “trend continuation” behavior; the differentiator is whether momentum begins to recover while price holds above a defined support zone.
Volatility conditions help contextualize that momentum. Bollinger Bandwidth is 0.2189, a reading that suggests volatility is present but not necessarily in an extreme expansion. In many tapes, the absence of a sharp volatility spike can mean selling is more orderly—often producing longer basing processes rather than a single inflection day. That interpretation is directionally consistent with the mixed cross-horizon ranks (neutral short-term, bullish 3-month).
Additional momentum/velocity measures reinforce the current pressure: TS Mom(20) at -49.85 and ROC(20) at -11.59 remain bearish, signaling that the pullback has both magnitude and persistence. For confirmation watchers, the more actionable question becomes whether subsequent rebounds can lift RSI away from the 20s while MACD histogram contraction (less negative) begins to appear—conditions that would align better with the intermediate rank strength.
4) Support / Resistance zones
Support ~ 364.9500 | Resistance ~ 448.2250
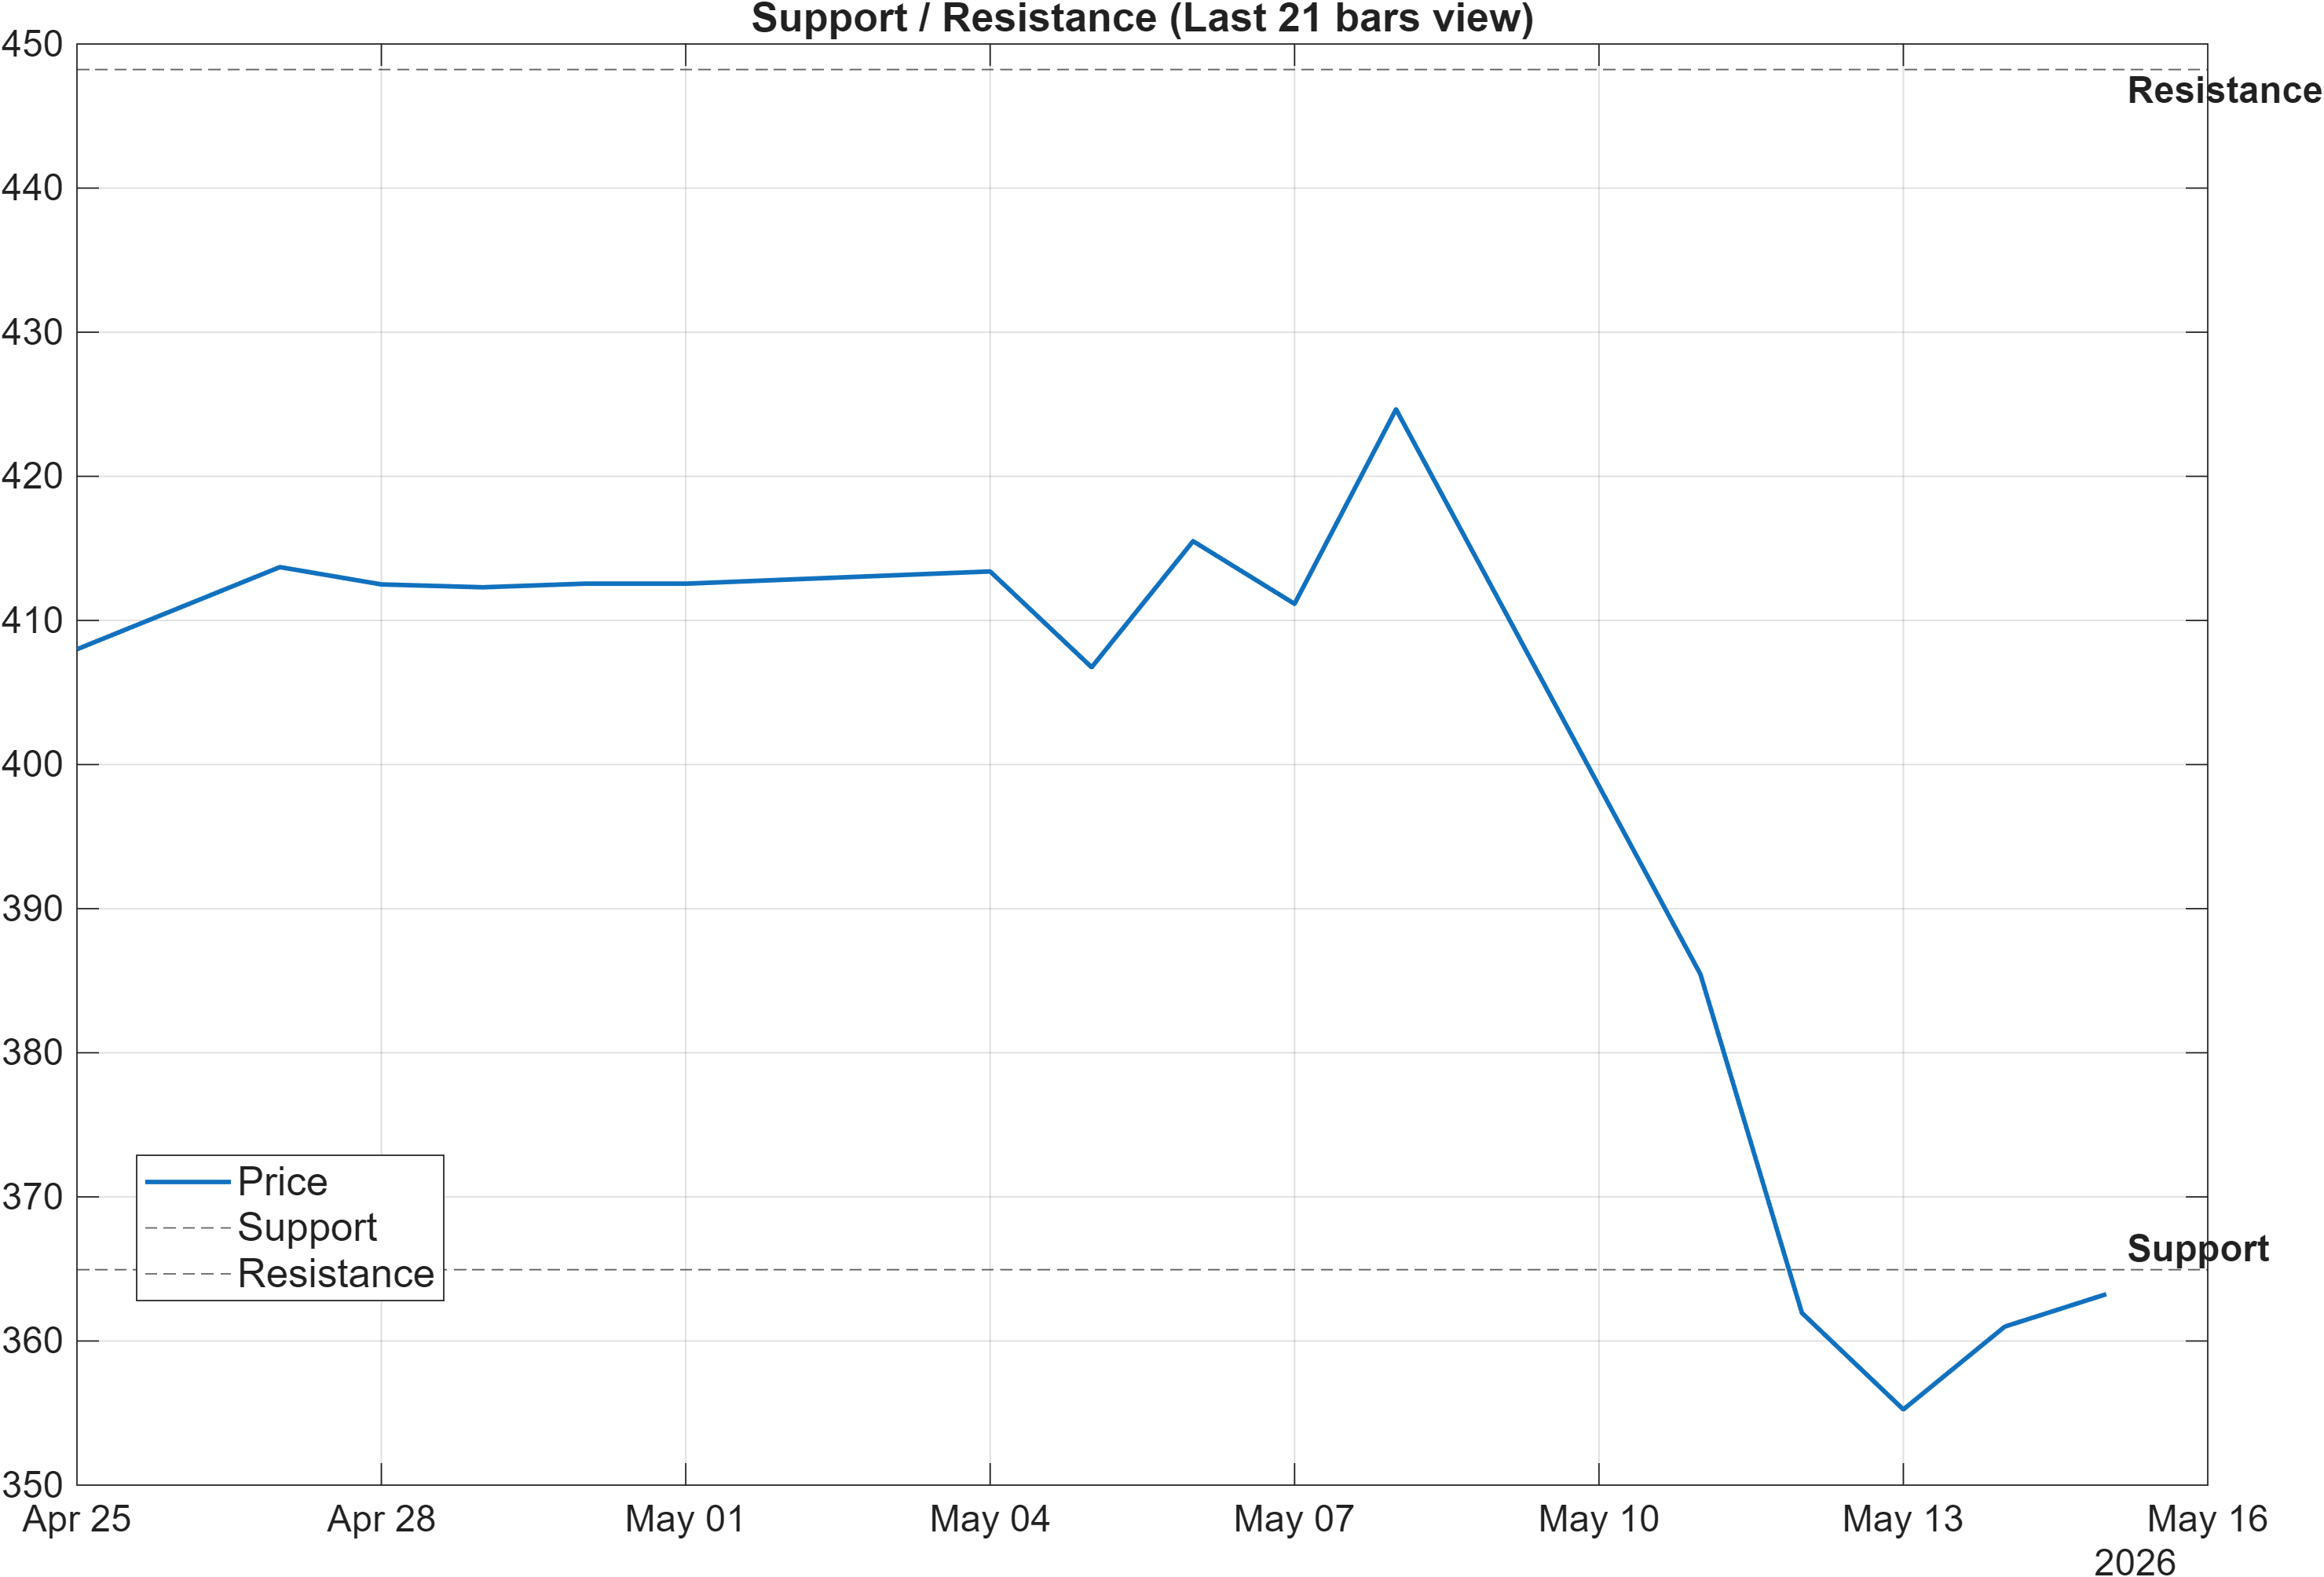
Decision zones: mapping continuation vs deterioration risk
The level structure is compact and clean: 364.9500 defines the near-term support zone, while 448.2250 marks resistance. With trend measures bearish (close vs MA50 bearish; MA50 vs MA200 bearish) and momentum stressed (RSI(14) 27.89; MACD histogram -6.1976), these zones operate less as “targets” and more as probabilistic regime filters.
On the upside, reclaiming 448.2250 with convincing volume would shift the weight of evidence toward a transition from “sell-the-rip” dynamics to a more constructive structure. That matters because the intermediate cross-sectional read (3-month rank #108) suggests there is a pre-existing foundation of relative strength that could reassert—if price can resolve above supply.
On the downside, a close below 364.9500 increases the probability that weak momentum is not merely a short-term flush but a deeper structural break. Several participation proxies already lean bearish (e.g., AD Line slope(10) -5.964e+05 and PVT slope(10) -3.034e+05), implying that a support failure could coincide with renewed distribution rather than benign volatility.
In range-bound or transition regimes, false breaks can occur; pairing the level test with momentum behavior (RSI recovery vs continued suppression) and volatility changes (Bandwidth 0.2189 expanding or compressing) helps separate “noise” from a durable shift.
Scenario view: Break above resistance with volume → continuation. Close below support → signal deterioration risk.
5) Quant Technical Dashboard (18 Signals)
KGNAI AI Technical Analysis Score (Deep Reinforcement Learning): Rank #810 out of 1222 (Rank 1 represents the strongest technical positioning and a higher probability of favorable price behavior. As ranks increase toward the maximum, the probability of favorable outcomes weakens and bearish positioning becomes more dominant.) | Label: Neutral | Score: -0.326
18-Signal Technical Confluence Score: -0.556 (Bearish)
Overall Technical Score (18-signal confluence + DRL rank blend): -0.487 (Bearish)
Note: The blended score reflects signal strength weighted against broader AI technical ranking, which may temporarily diverge.
Blended technical score breakdown: -0.487 (Bearish | Bull 2 / Bear 12 / Neutral 4)
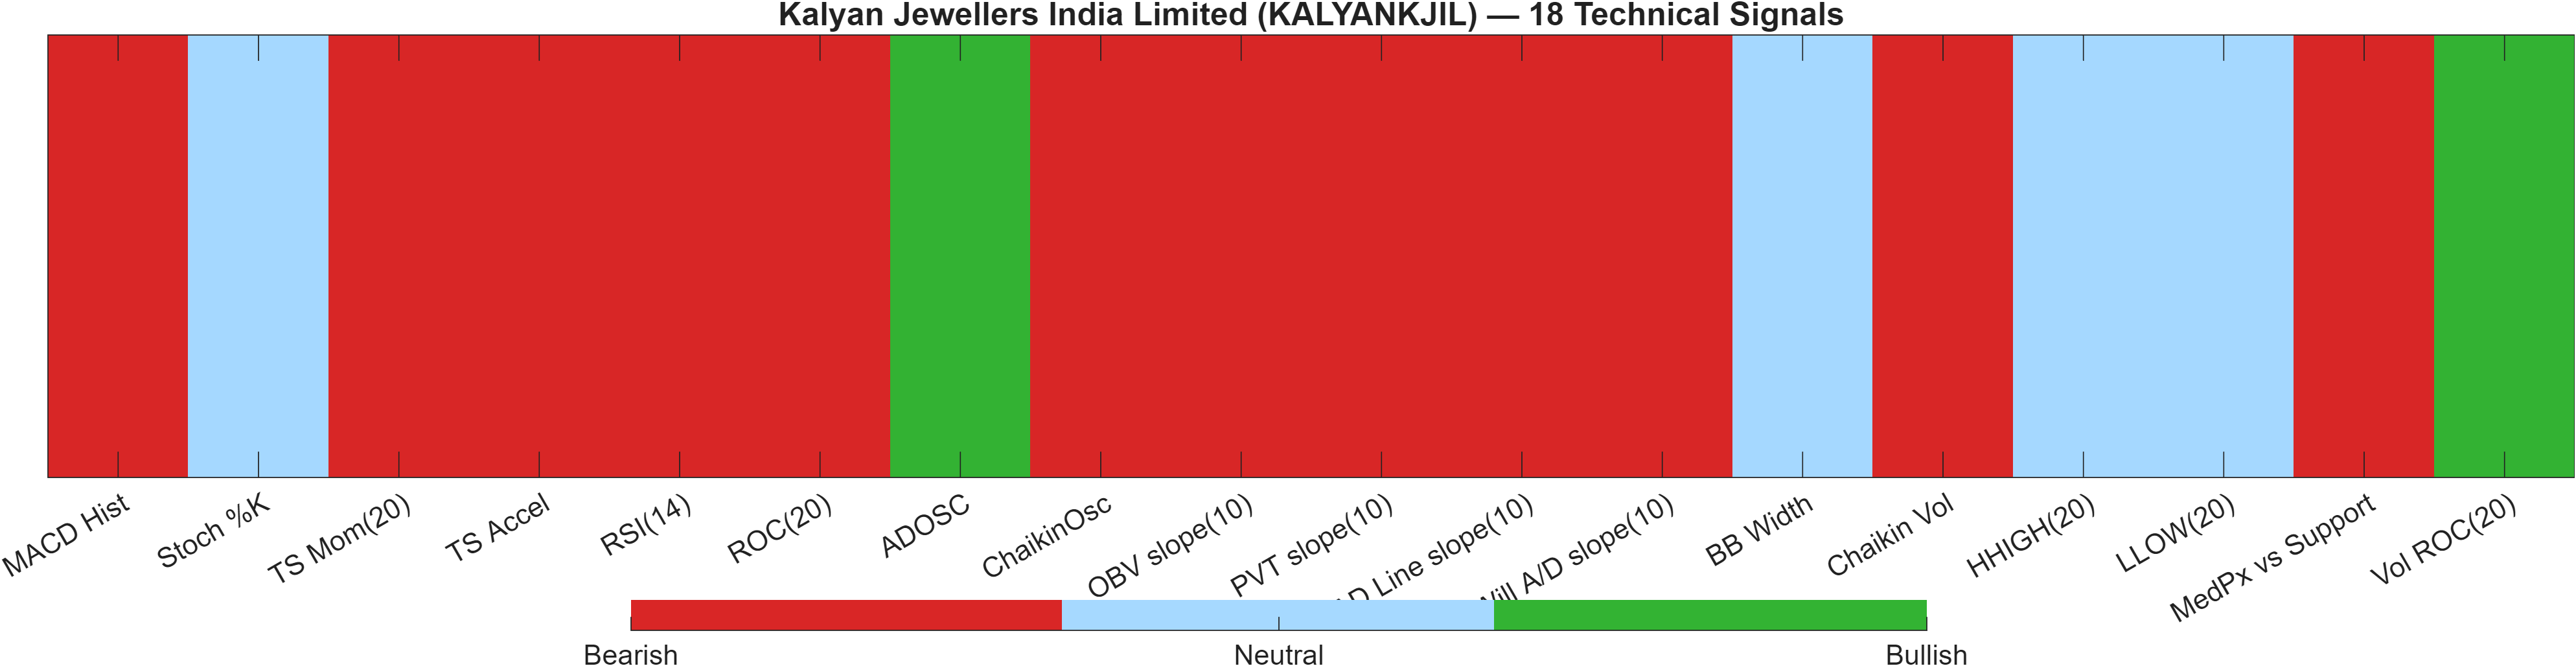
Confluence read: breadth of bearish signals outweighs isolated participation strength
The technical layer is decisively negative on aggregate: the 18-signal confluence score is -0.556 and the overall blended technical score is -0.487, both labeled Bearish. The blend also records a skewed signal mix (Bull 2 / Bear 12 / Neutral 4), indicating that weakness is not isolated to one indicator family.
Momentum is a primary drag: RSI(14) 27.89 is bearish and MACD Hist -6.198 is bearish, consistent with declining trend impulse. Rate-of-change measures reinforce the same directionality (e.g., ROC(20) -11.59). This alignment across independent momentum tests tends to be more informative than any single indicator in isolation.
Participation metrics, however, are not uniformly negative. ADOSC 56.06 is bullish and Vol ROC(20) 247.4 is bullish, which can sometimes appear when turnover increases during a selloff or when early accumulation begins beneath the surface. Yet several slopes tied to volume/flow remain bearish (e.g., OBV slope(10) -9.372e+06), suggesting that bullish participation readings are not broadly confirmed.
The DRL technical rank sits at #810 with a neutral label and score -0.326, underscoring a subtle tension: the rules-based confluence is more bearish than the model’s relative technical positioning. When this gap appears, level behavior (support 364.9500 / resistance 448.2250) often becomes the most objective arbiter.
Signal table (Bull/Bear/Neutral)
| Indicator | Value | Signal |
|---|---|---|
| MACD Hist | -6.198 | Bearish |
| Stoch %K | 23.56 | Neutral |
| TS Mom(20) | -49.85 | Bearish |
| TS Accel | -46.4 | Bearish |
| RSI(14) | 27.89 | Bearish |
| ROC(20) | -11.59 | Bearish |
| ADOSC | 56.06 | Bullish |
| ChaikinOsc | -2.497e+05 | Bearish |
| OBV slope(10) | -9.372e+06 | Bearish |
| PVT slope(10) | -3.034e+05 | Bearish |
| AD Line slope(10) | -5.964e+05 | Bearish |
| Will A/D slope(10) | -56.57 | Bearish |
| BB Width | 0.2189 | Neutral |
| Chaikin Vol | 121.2 | Bearish |
| HHIGH(20) | 428.8 | Neutral |
| LLOW(20) | 340.1 | Neutral |
| MedPx vs Support | -7.95 | Bearish |
| Vol ROC(20) | 247.4 | Bullish |
Interpretation: Indicator-level signals form the base confluence, which is then adjusted using a separate AI-driven technical ranking model. The final technical score summarizes this combined view.
6) News sentiment + extractive gist
Note: Instrument-specific news matches were not found, so the digest includes broader market/sector headlines. Links are provided for verification.
Sentiment score (avg): 0.148 | Positive: 44% | Neutral: 56% | Negative: 0%
KGNAI AI News Sentiment Score (normalized -1 to +1): Not available (as of —) | Label: Not available | Overall news score: 0.15
Positive Developments
Recent coverage across major financial outlets indicates a generally constructive risk backdrop in global equities, with technology-led strength and a tone of selective optimism. In that context, the news mix supporting the broader market narrative aligns with the digest’s 0.148 average sentiment and a 44% positive share. For KALYANKJIL, the key analytical relevance is indirect: a supportive risk environment can make it easier for oversold technical conditions—such as RSI(14) at 27.89—to stabilize into tradable rebounds, particularly if higher turnover accompanies upside attempts. The dataset also shows at least some participation signals that could become supportive if confirmed (e.g., Vol ROC(20) at 247.4 and ADOSC 56.06 both flagged bullish). The takeaway is not a catalyst claim, but a context read: macro-tone positivity can reduce friction for level-based mean reversion, provided resistance (448.2250) is approached with improving breadth rather than fading momentum.
Neutral / Mixed Developments
A notable portion of the digest is informational and policy-oriented, consistent with the 56% neutral classification. Such items tend to influence positioning through liquidity, participation constraints, and short-term volatility rather than through direct issuer-specific fundamentals—especially relevant here because instrument-specific news matches were not found. With Bollinger Bandwidth at 0.2189, volatility is not presented as an extreme regime; accordingly, incremental regulatory or market-structure updates may show up more as gradual changes in trading behavior than as abrupt price gaps. In a neutral rank setting (daily #507; weekly #315; monthly #622), these conditions often keep price action “range-aware,” making the 364.9500 to 448.2250 corridor more analytically central than headline noise.
Negative / Risk Signals
The risk channel in the digest is relatively contained in sentiment terms (0% negative), but the broader risk framing still matters because KALYANKJIL’s tape is technically fragile. When price is below MA50 and MA50 is below MA200, downside shocks—whether from risk-off flows, liquidity re-pricing, or global cross-asset volatility—tend to transmit more efficiently. That sensitivity is reinforced by the bearish technical confluence (-0.556) and the breadth of bearish indicators (12 bears out of 18). Under that regime, the most practical risk signal is structural rather than narrative: a close below 364.9500 would increase deterioration risk, especially if participation metrics that are currently bearish (e.g., OBV slope(10) -9.372e+06) continue to confirm distribution. The news digest does not supply instrument-specific negatives; the risk is therefore interpreted as setup-dependent rather than event-dependent.
- Whether price can reclaim 448.2250 with participation consistent with the bullish Vol ROC(20) 247.4.
- Whether RSI(14) 27.89 begins to recover while MACD histogram (-6.1976) contracts toward zero.
- Whether support at 364.9500 holds on closes as flow measures (e.g., OBV slope) evolve.
Sources referenced: Reuters, Bloomberg, Yahoo Finance, MarketWatch, Investing.com
Snapshot: AI Rank (Short–Mid–Long): Neutral (Neutral–Neutral–Not available) · Technical Confluence: Bearish · Key Levels: Support ~364.95 | Resistance ~448.23 · News Sentiment: Neutral
7) Sources
Not available in the provided data.
You may also like: How KGNAI AI ranks instruments across global markets
Disclaimer: KGNAI provides AI-generated analytics and educational market commentary only. This is not financial advice. Markets involve risk. Always do your own research.