
STEELXIND (Steel Exchange India Ltd.) — 13-May-2026 Quant Signal Review | Neutral Near-Term, Bearish Mid-Term Bias
Steel Exchange India Ltd. (STEELXIND) is currently positioned in a mixed regime across KGNAI’s cross-sectional ranking framework, where near-term stability is not yet translating into mid-term leadership. The daily rank (#542 of 1222) sits near the middle of the tracked universe, while the monthly (#1006) and 3-monthly (#1001) ranks sit deeper in the weaker cohort—suggesting that any short-run improvements still lack durability. On the technical layer, the blended view remains Neutral, with an Overall Technical Score of 0.087 and a modestly negative 18-signal confluence (-0.056), indicating balance rather than conviction. Momentum inputs (e.g., MACD histogram -0.0962) lean cautious, while volatility is not extreme (Bollinger bandwidth 0.1147). Key decision zones remain clearly defined at support ~7.1200 and resistance ~10.7183, with news sentiment mildly positive but broadly neutral (0.111 average).
Key Takeaways
- Rank stance: Short-term Neutral | Mid-term Bearish | Long-term Neutral
- Technical confluence label: Neutral (18-signal confluence -0.056; blended technical score 0.087)
- Key levels: Support ~7.1200 | Resistance ~10.7183
- News sentiment bias: Neutral (avg 0.111; Pos 37% / Neu 50% / Neg 12%)
- Confirmation / invalidation condition: A break above 10.7183 with volume supports continuation behavior; a close below 7.1200 increases deterioration risk.
What KGNAI Measures
KGNAI evaluates assets using large cross-sectional datasets built from millions of structured data points. Inputs incorporate fundamental metrics, technical structures, and systematically processed news sentiment. Statistical models, machine learning, and AI frameworks are used to assess relative positioning, signal alignment, and probabilistic behavior across broad universes.
How to Read This Report
- Ranks are comparative across the tracked universe, not absolute price targets.
- Confluence reflects alignment among independent signal groups.
- Support/resistance levels are probabilistic decision zones, not guarantees.
- Sentiment provides contextual bias within the broader analytical framework.
1) KGNAI AI Analysis
Region: INDIA
Total universe size: 1222 ranked instruments
- Daily rank: #542 out of 1222 — Neutral
- Weekly rank: #839 out of 1222 — Neutral
- Monthly rank: #1006 out of 1222 — Bearish
- 3-Monthly rank: #1001 out of 1222 — Bearish
- 6-Monthly rank: #881 out of 1222 — Neutral
- Yearly rank: #886 out of 1222 — Neutral
Cross-sectional positioning: stability without mid-term leadership
STEELXIND’s rank stack reflects a time-horizon mismatch. The daily rank (#542) and weekly rank (#839) remain in neutral territory, indicating the asset is not currently screening as an extreme outlier on short-run behavior. However, the monthly rank (#1006) and 3-monthly rank (#1001) sit in the weaker portion of the 1222-instrument universe, which typically corresponds to less favorable probabilistic behavior in the model’s mid-term tests.
The longer windows are less decisive: 6-monthly (#881) and yearly (#886) both read Neutral. That pattern—mid-term bearishness alongside neutral long-term placement—often occurs when an instrument has not re-established sustained trend strength after prior weakness, but also is not exhibiting ongoing structural breakdown at the broadest horizon.
The most actionable implication is not directionality but confidence calibration. With the mid-term ranking deeper in the lower cohort than the daily/weekly readings, the model is effectively flagging that short-term improvements require confirmation before they can be treated as regime change. In this context, single-week price moves tend to carry less informational value than whether subsequent technical signals (trend, momentum, and volume) begin to align consistently.
Term view (as provided): Short-term: Neutral. Mid-term: Bearish. Long-term: Neutral.
Want the full universe and complete rank tables?
2) Price & trend overview
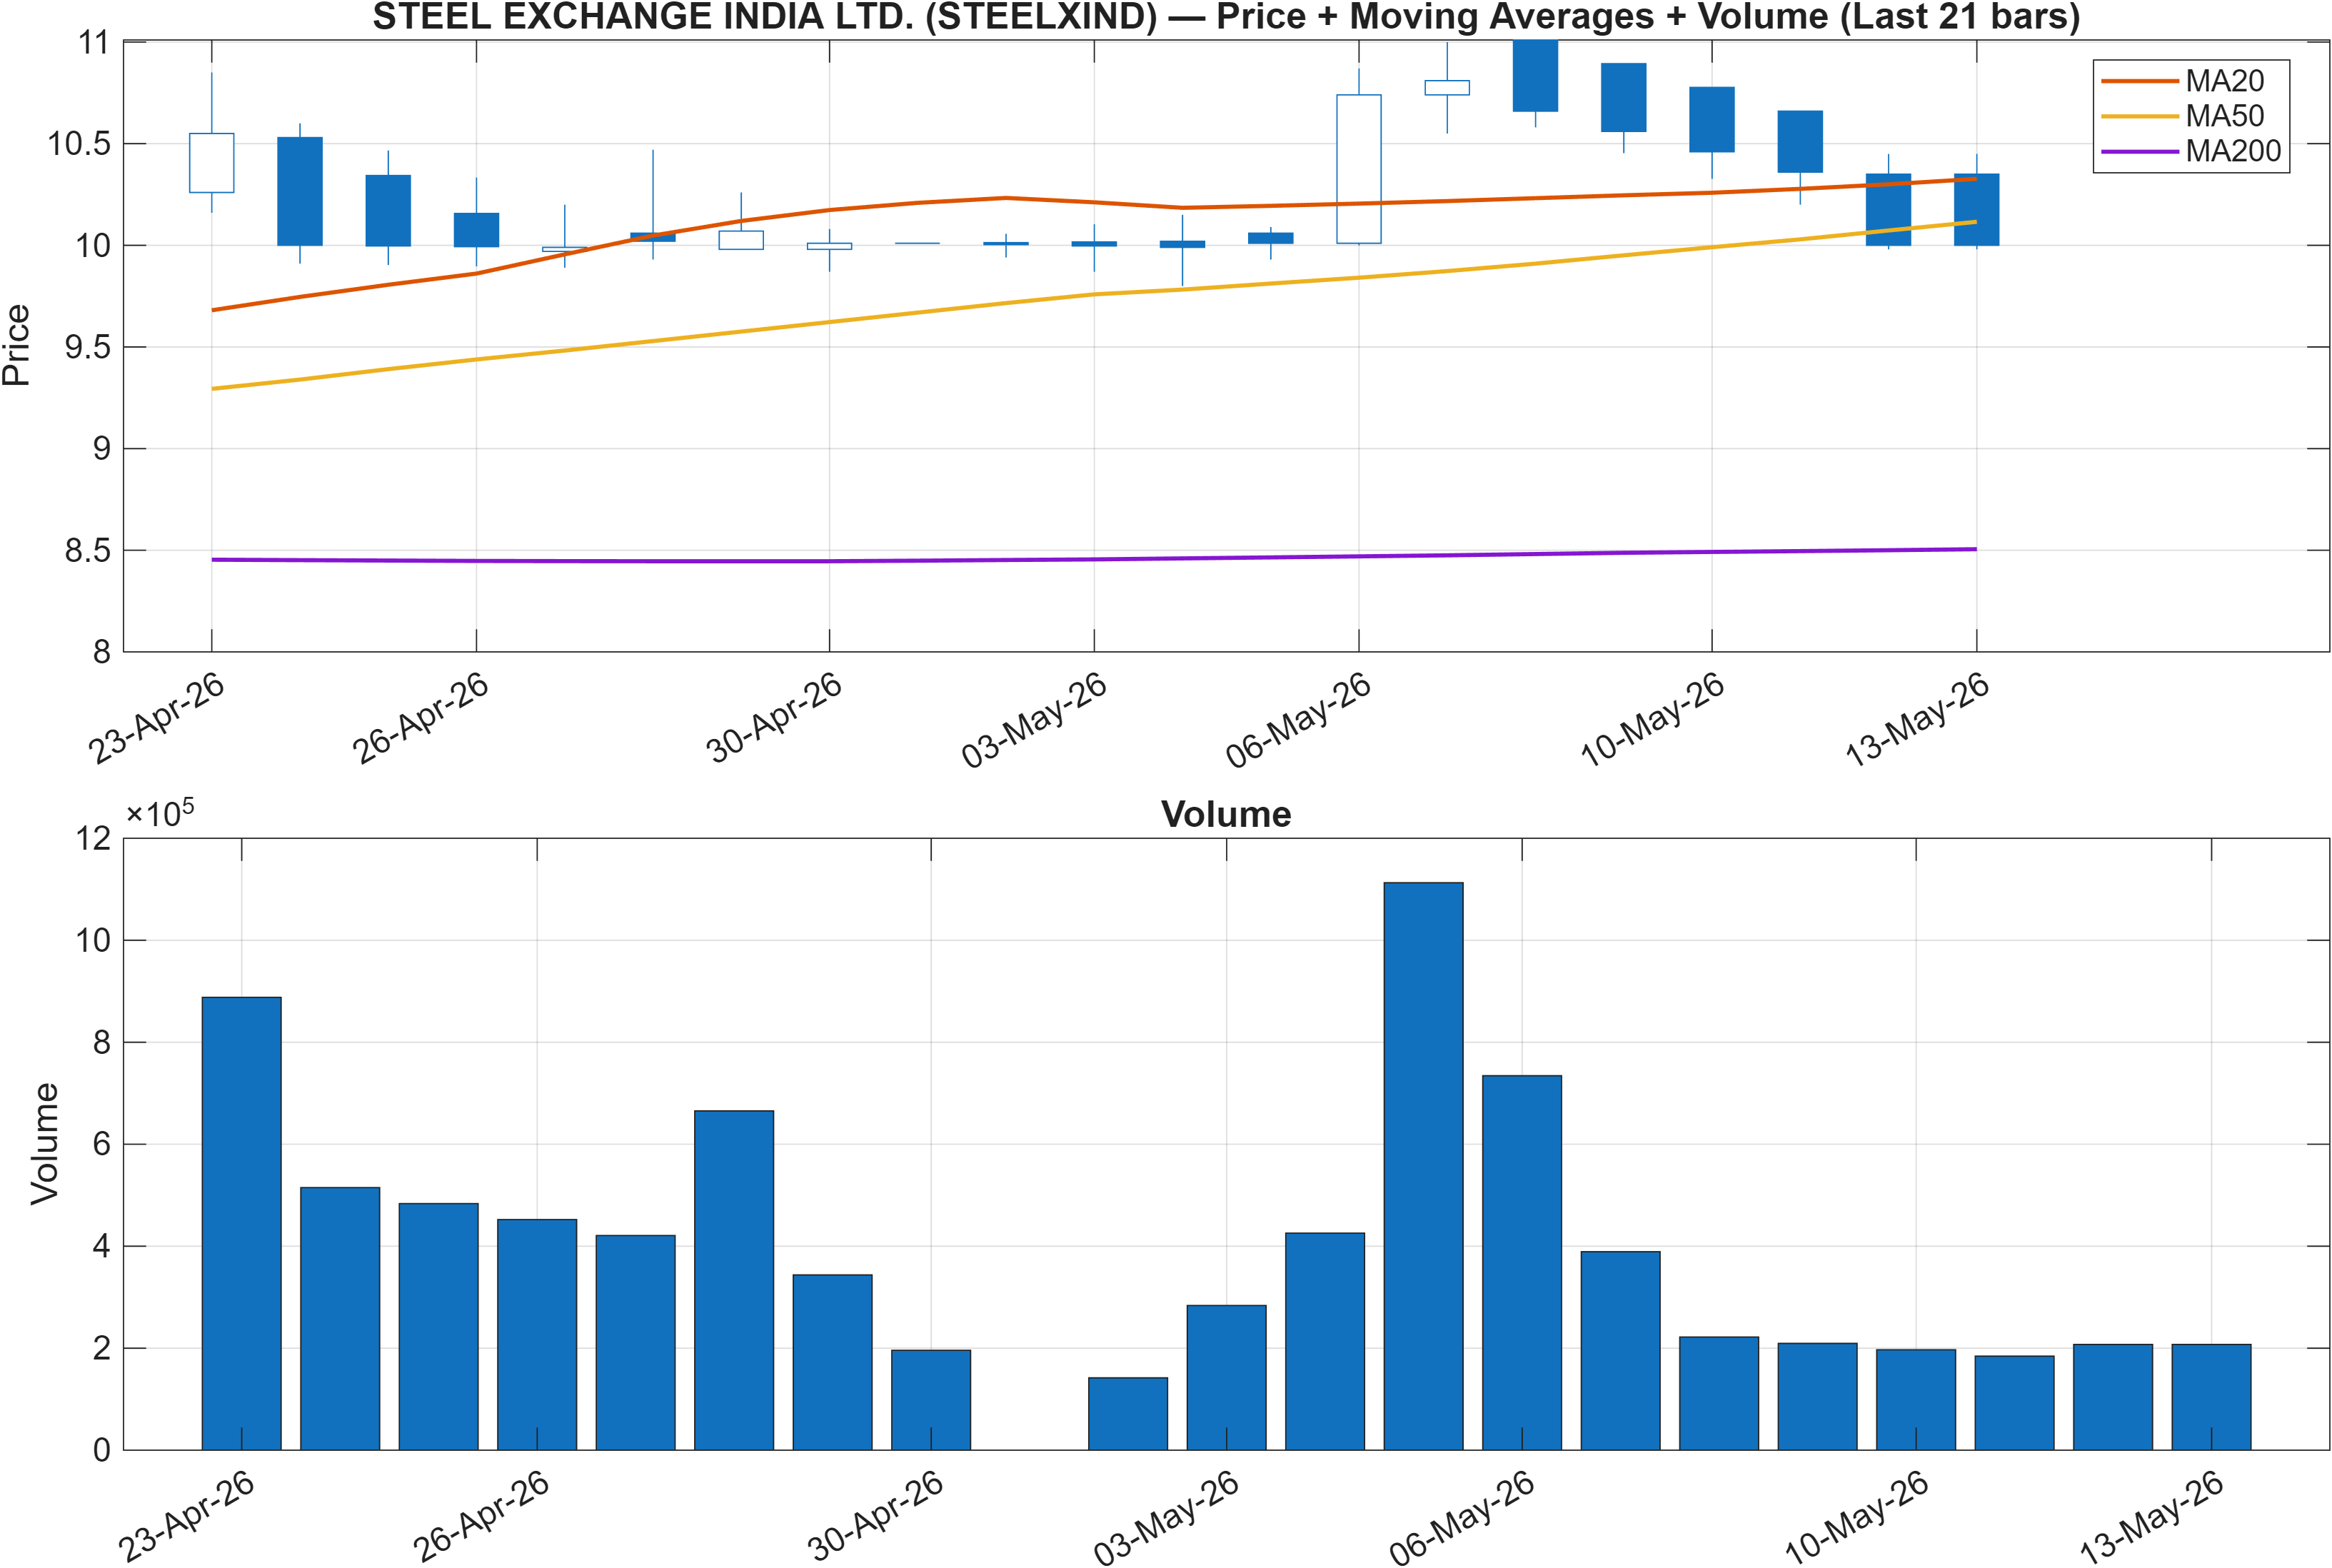
Trend structure: near-term pressure inside a longer-term positive slope
The moving-average configuration captures an important regime split: Close vs MA50 = Bearish while MA50 vs MA200 = Bullish. This combination frequently reflects a market that is still sitting within a broader positive structure, yet experiencing a corrective or consolidative phase that has not fully resolved. For trend followers, the bearish close-to-MA50 relationship tends to act as a constraint until price can re-establish acceptance above the intermediate trend proxy.
From a ranking perspective, this is consistent with the model’s cross-horizon tension—neutral short-run placement (e.g., #542 daily) without a supportive mid-term profile (#1006 monthly). In practical screening terms, this setup can produce range behavior where directional edges are weaker and mean-reversion signals can temporarily dominate, especially when momentum indicators are also muted.
The most useful way to frame the chart is through conditional validation. The closer price remains to the MA50 from below, the more the market behaves as if it is “testing” the intermediate trend rather than resuming it. Conversely, sustained trading back above the MA50 would reduce the corrective interpretation and would likely need to be accompanied by improving momentum (see MACD histogram in Section 3) to be treated as more than a brief bounce.
With key horizontal zones later defined at support ~7.1200 and resistance ~10.7183, the trend picture can be summarized as: intermediate weakness remains the active risk, while the longer moving-average relationship suggests the broader structure has not fully flipped into a persistent downtrend.
3) Momentum & volatility dashboard
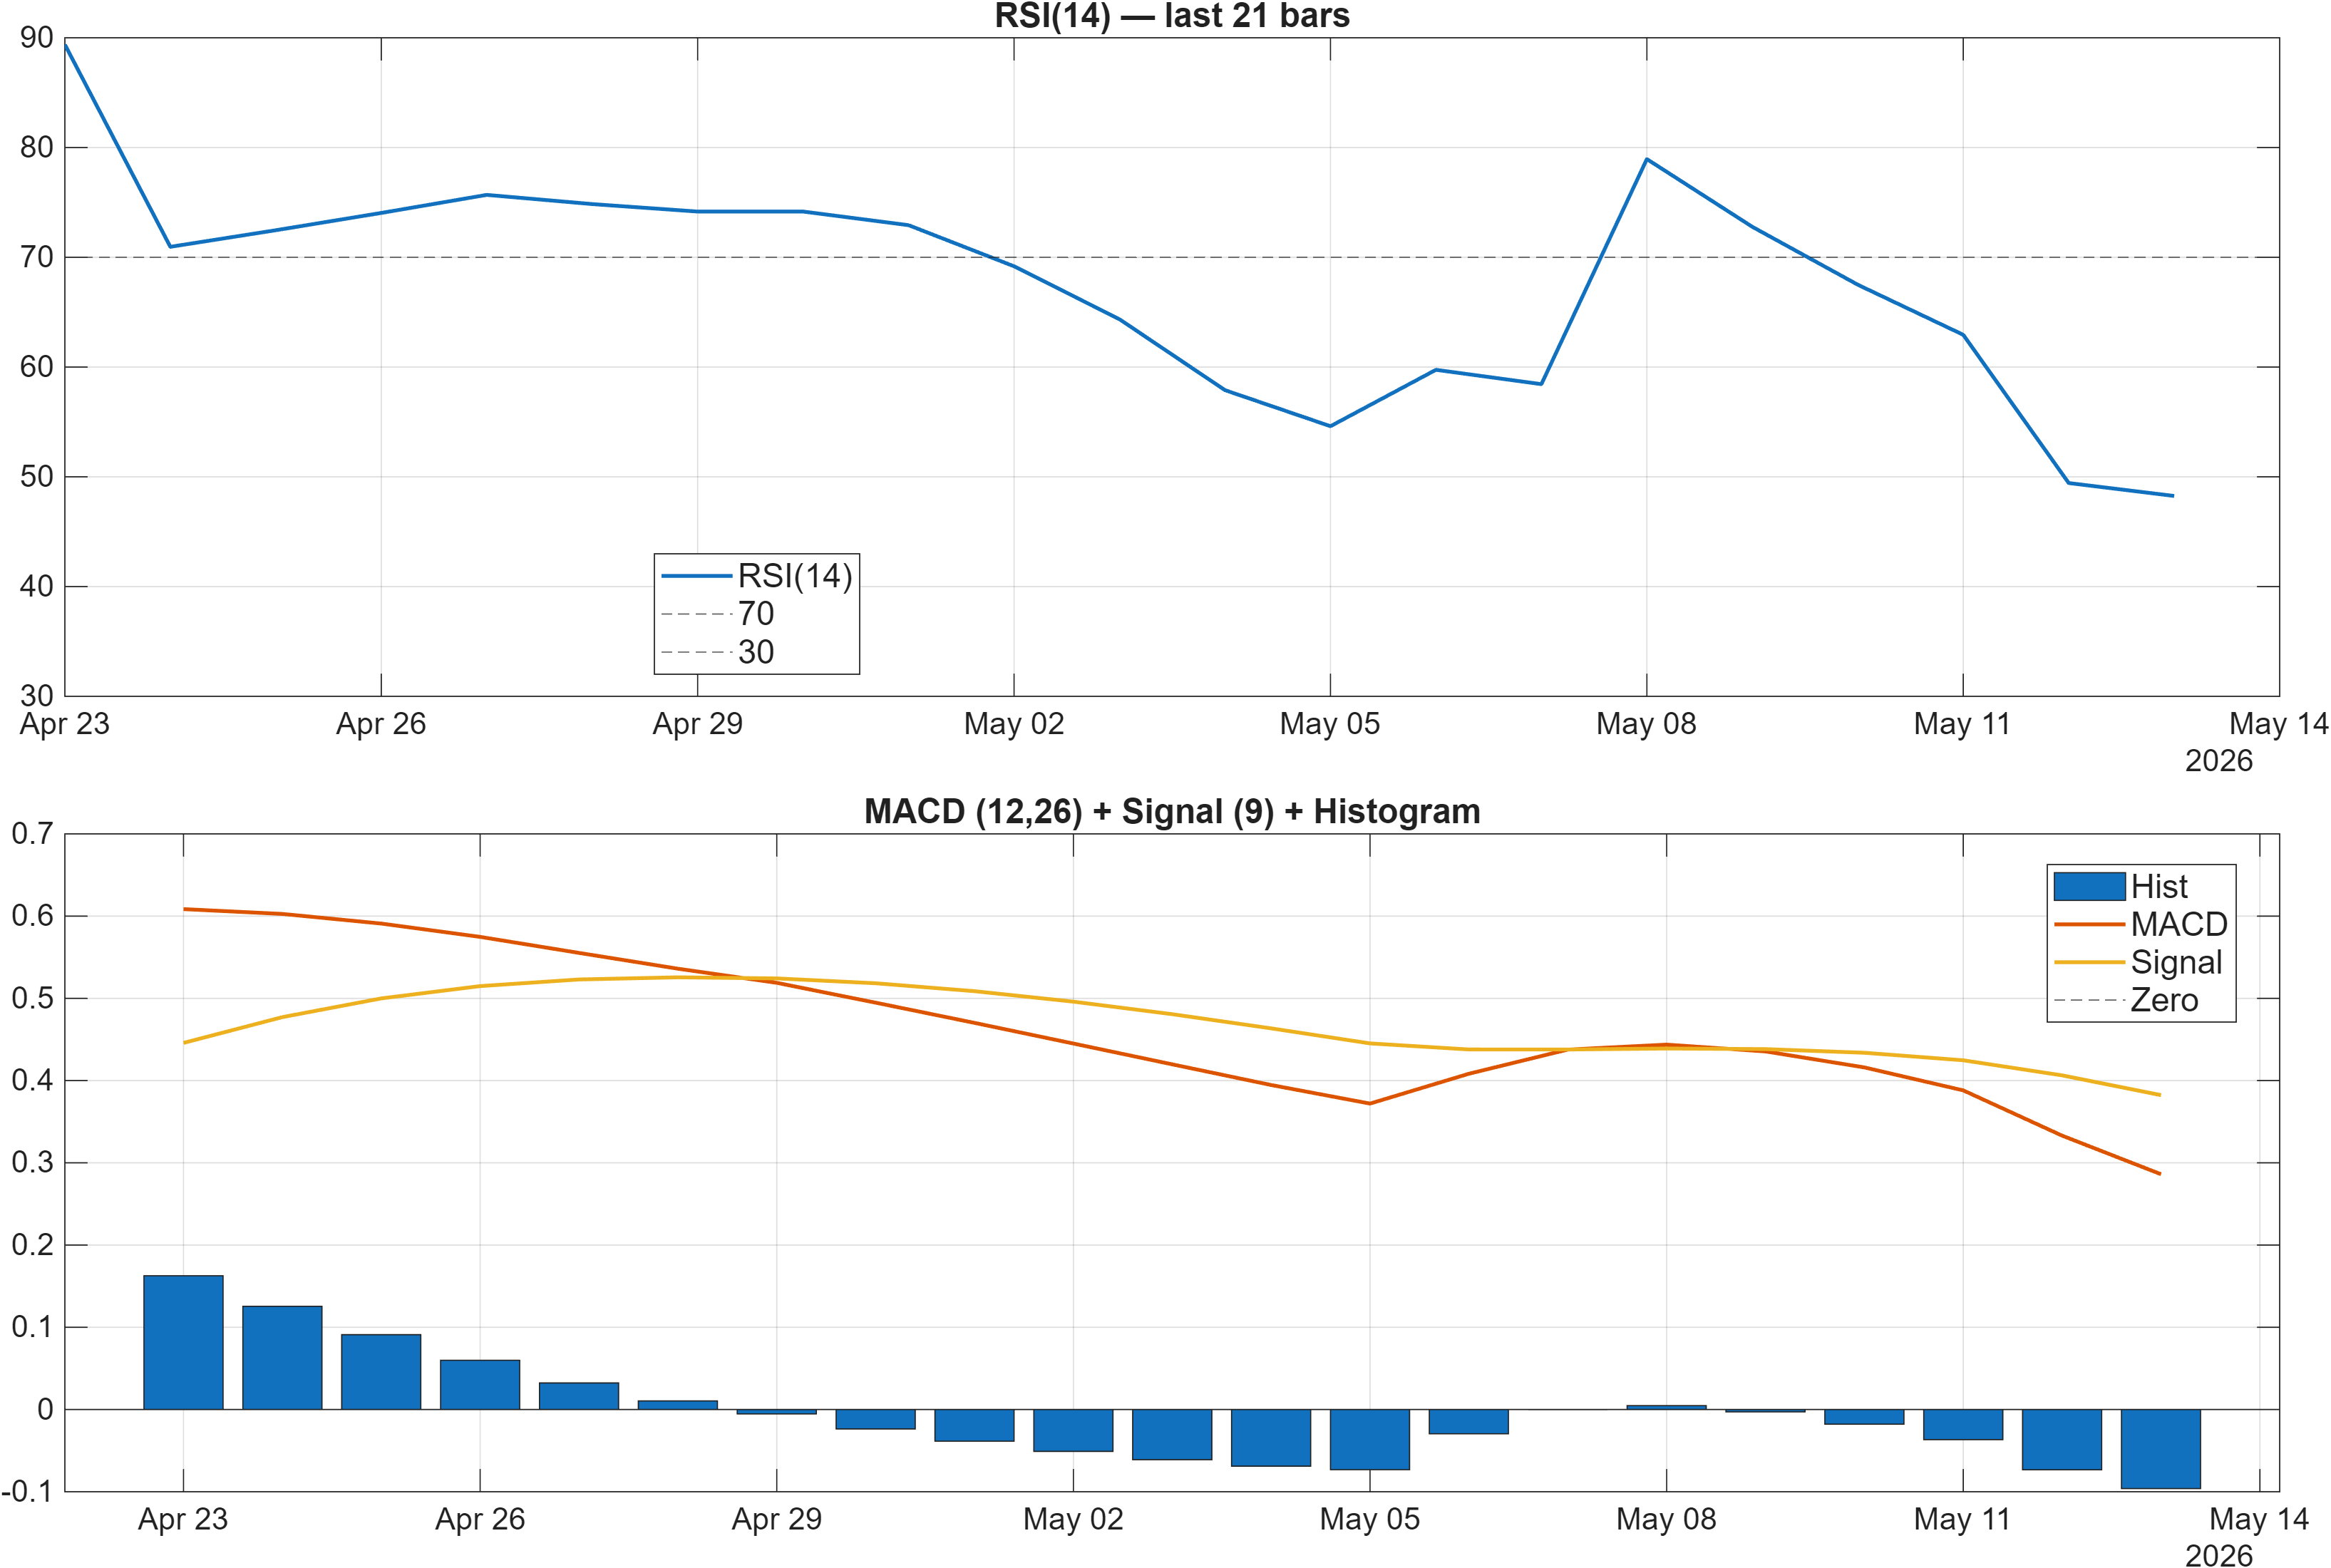
Interpretation: RSI bias = Neutral, MACD hist = -0.0962.
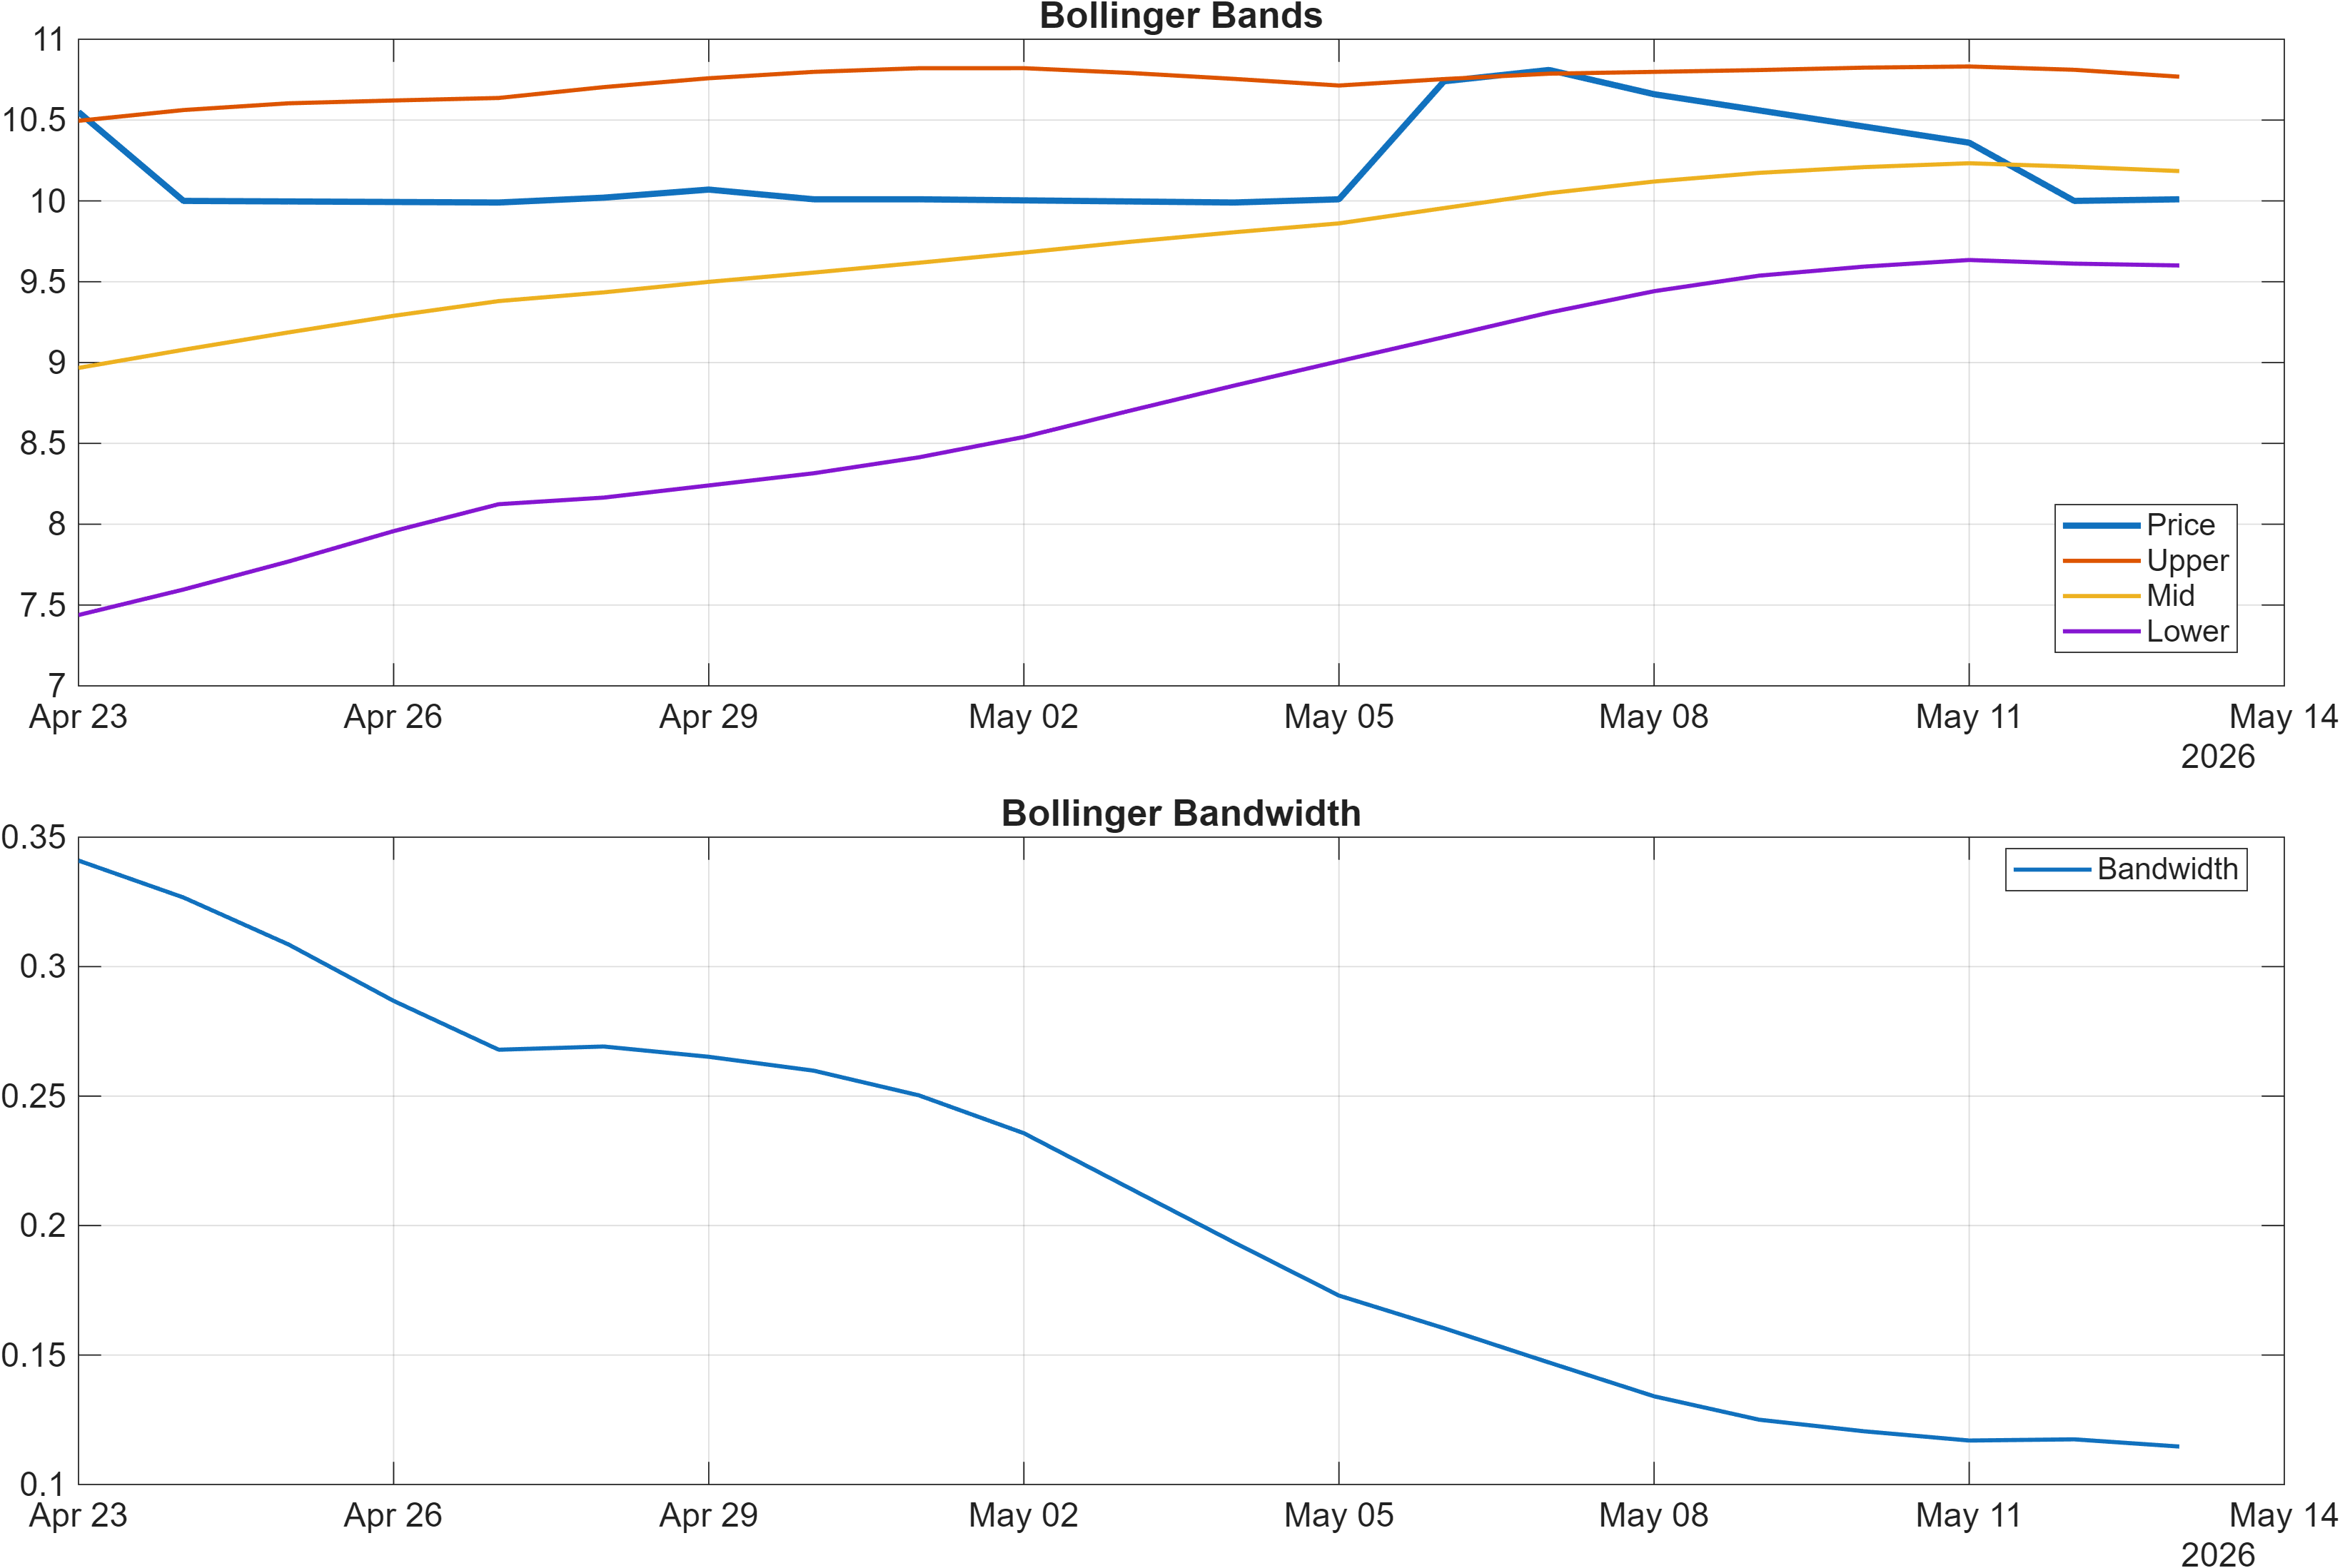
Interpretation: Bandwidth (volatility regime) latest = 0.1147.
Momentum is not confirming trend strength; volatility is contained
The momentum panel is broadly consistent with a non-trending or corrective phase. RSI(14) at 48.26 sits near the midline, aligning with the provided “RSI bias = Neutral” and indicating limited directional pressure. At the same time, the MACD histogram at -0.0962 (and -0.09618 in the signal table) tilts negative, which commonly signals that upside attempts are not yet producing sustained acceleration.
The volatility regime adds an additional constraint: Bollinger bandwidth at 0.1147 suggests contained volatility rather than an expanding breakout environment. When bandwidth is moderate and momentum is mixed, price often oscillates within established zones, and signals can flip quickly without follow-through. This backdrop tends to reward confirmation—particularly when using support/resistance and moving-average recapture tests—over early anticipation.
Several dashboard inputs echo this “compression” behavior. For example, TS Mom(20) = 0 and RSI(14) = 48.26 read as balance, while negative acceleration in the table (TS Accel = -2.152) and negative MACD histogram lean cautious. The net effect is a momentum profile that does not provide a strong directional edge on its own, which is consistent with the platform’s Neutral technical labeling in Section 5.
Until either momentum turns more consistently positive (MACD histogram improving toward/above zero) or volatility expands with directional follow-through, the higher-quality read is that STEELXIND remains in a waiting-for-confirmation regime rather than a clean trend phase.
4) Support / Resistance zones
Support ~ 7.1200 | Resistance ~ 10.7183
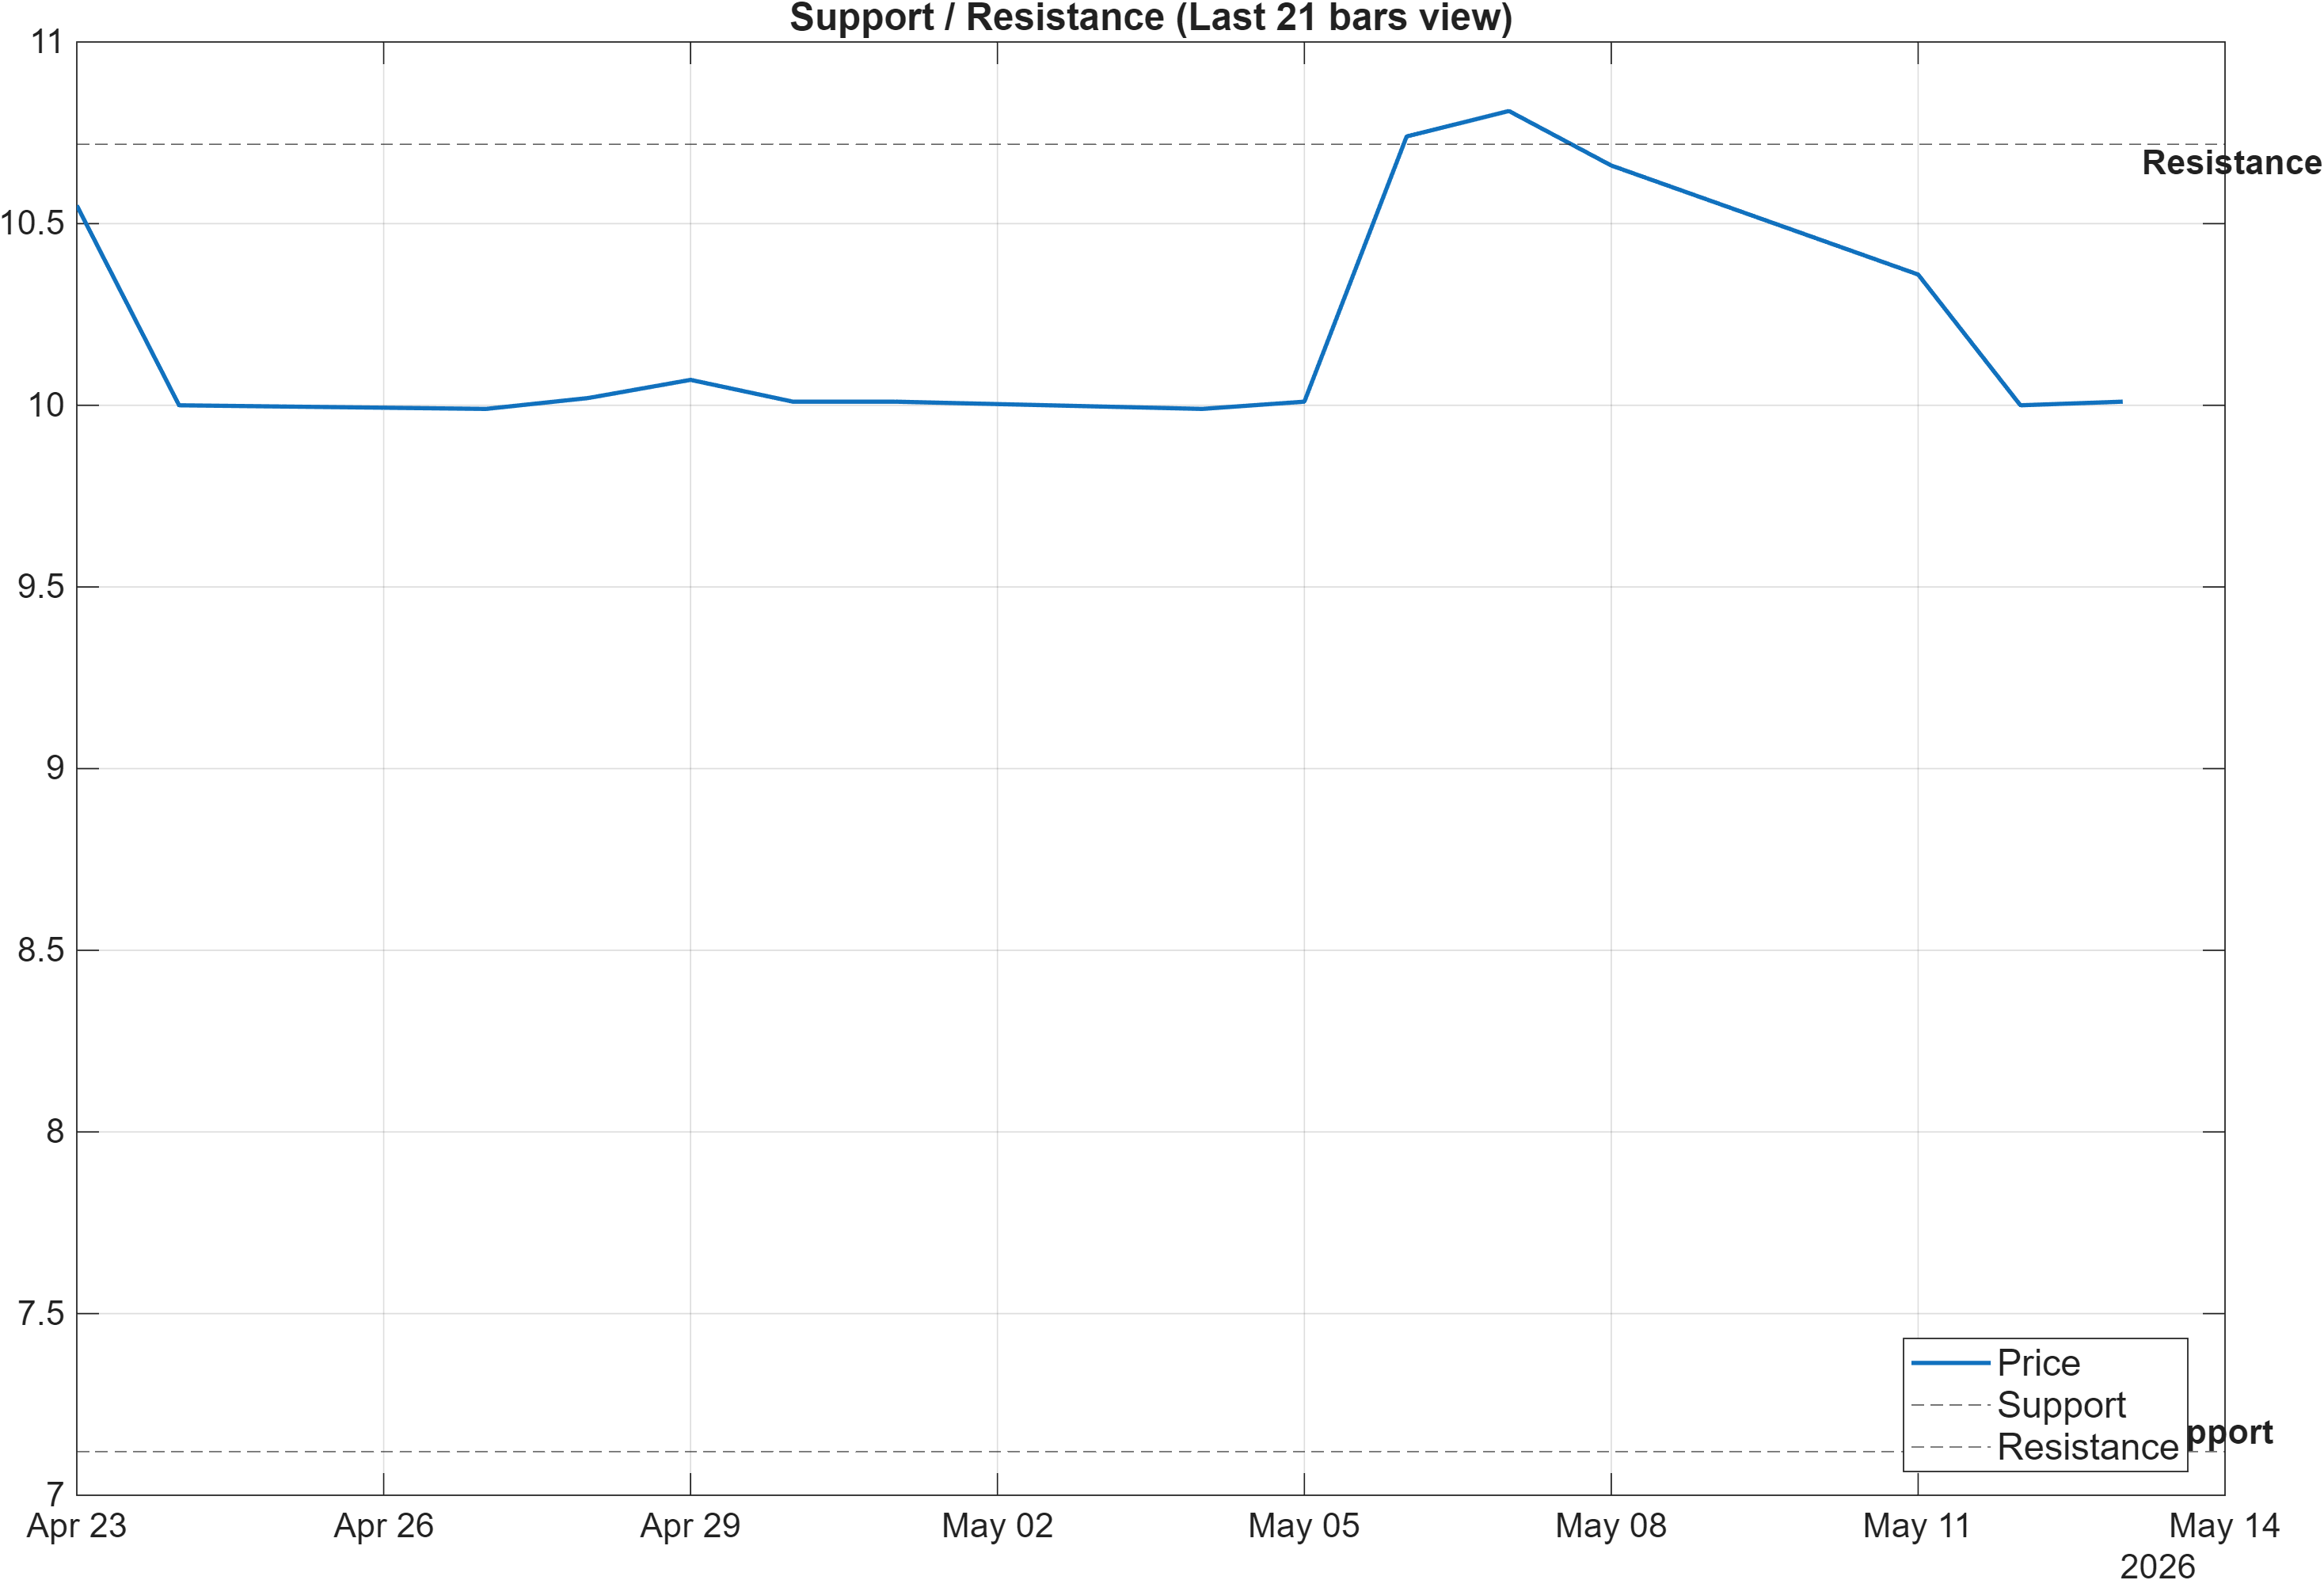
Decision zones: probabilistic boundaries for regime confirmation
The current map is straightforward: support ~7.1200 and resistance ~10.7183 define the primary risk/validation boundaries. In a neutral-to-mixed technical environment—supported by RSI(14) 48.26 and a negative MACD histogram (-0.0962)—these zones often matter more than incremental indicator shifts, because they represent where positioning and liquidity tend to concentrate.
The provided scenario framing is aligned with standard market structure logic: a break above resistance with volume increases the probability of continuation behavior, while a close below support elevates deterioration risk. Importantly, the moving-average interpretation from Section 2 (Close vs MA50 bearish; MA50 vs MA200 bullish) suggests that a resistance break would also function as a structural repair event—potentially shifting the asset from correction back toward trend participation.
Conversely, a close below 7.1200 would occur in a context where mid-term ranks already sit weak (#1006 monthly, #1001 3-monthly). That would represent alignment between price structure and the weaker mid-term probabilistic profile, reducing the case for treating current conditions as merely consolidative.
With volatility moderate (bandwidth 0.1147), false breaks remain a practical risk. The highest quality confirmations typically include (1) acceptance beyond the level, and (2) supportive momentum behavior—e.g., MACD histogram improving rather than remaining negative—so that the breakout is not solely a volatility spike.
5) Quant Technical Dashboard (18 Signals)
KGNAI AI Technical Analysis Score (Deep Reinforcement Learning): Rank #355 out of 1222 (Rank 1 represents the strongest technical positioning and a higher probability of favorable price behavior. As ranks increase toward the maximum, the probability of favorable outcomes weakens and bearish positioning becomes more dominant.) | Label: Neutral | Score: 0.419
18-Signal Technical Confluence Score: -0.056 (Neutral)
Overall Technical Score (18-signal confluence + DRL rank blend): 0.087 (Neutral)
Note: The blended score reflects signal strength weighted against broader AI technical ranking, which may temporarily diverge.
Blended technical score breakdown: 0.087 (Neutral | Bull 6 / Bear 7 / Neutral 5)
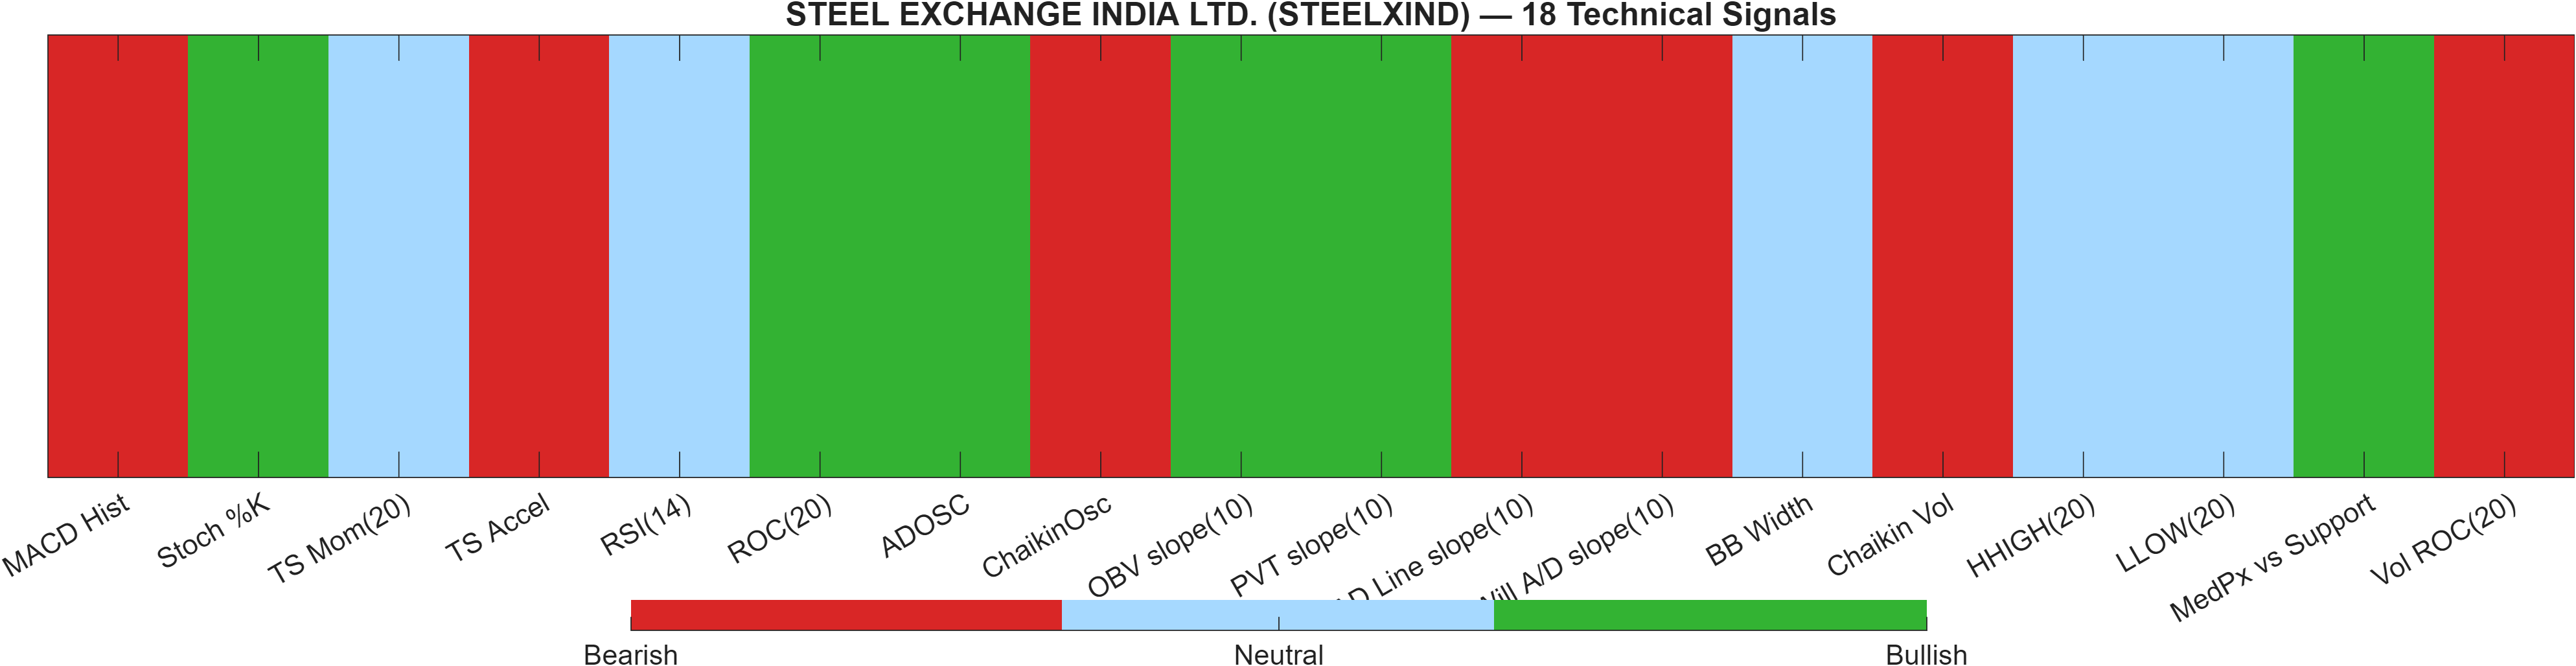
Signal balance: mixed internals keep the label Neutral
The technical dashboard is best read as a balance-of-evidence exercise rather than a single-indicator verdict. The 18-signal confluence score of -0.056 sits close to flat, and the blended outcome remains Neutral with an Overall Technical Score of 0.087. The distribution (Bull 6 / Bear 7 / Neutral 5) is the key: the bearish side has a slight count advantage, but not enough dominance to flip the composite into a sustained bearish regime.
The DRL technical layer adds context from a separate model family: rank #355 of 1222 with a score of 0.419 and a Neutral label. Being closer to the upper quartile than the mid-term AI ranks (e.g., #1006 monthly) suggests that some parts of the technical state space are not as weak as the mid-term cross-sectional view implies—another form of model-level divergence.
A few indicator-level examples illustrate why conviction is limited. Momentum is not cleanly positive (MACD Hist -0.09618 is Bearish), while RSI remains centered (RSI(14) 48.26 is Neutral). At the same time, some participation signals lean constructive, such as OBV slope(10) 7.904e+05 flagged Bullish. Volatility is not providing a breakout cue either (BB Width 0.1147 is Neutral).
Signal table (Bull/Bear/Neutral)
| Indicator | Value | Signal |
|---|---|---|
| MACD Hist | -0.09618 | Bearish |
| Stoch %K | 16.53 | Bullish |
| TS Mom(20) | 0 | Neutral |
| TS Accel | -2.152 | Bearish |
| RSI(14) | 48.26 | Neutral |
| ROC(20) | 0.1 | Bullish |
| ADOSC | 12.77 | Bullish |
| ChaikinOsc | -1.784e+05 | Bearish |
| OBV slope(10) | 7.904e+05 | Bullish |
| PVT slope(10) | 4.215e+04 | Bullish |
| AD Line slope(10) | -1.513e+05 | Bearish |
| Will A/D slope(10) | -0.83 | Bearish |
| BB Width | 0.1147 | Neutral |
| Chaikin Vol | 45.32 | Bearish |
| HHIGH(20) | 11.01 | Neutral |
| LLOW(20) | 9.8 | Neutral |
| MedPx vs Support | 3.095 | Bullish |
| Vol ROC(20) | -59.71 | Bearish |
The practical takeaway is that the model is not observing a strong, uniform push from independent signal groups. In this state, level-based confirmation (Section 4) and rank improvement across horizons (Section 1) generally matter more than isolated indicator flips.
6) News sentiment + extractive gist
Note: Instrument-specific news matches were not found, so the digest includes broader market/sector headlines. Links are provided for verification.
Sentiment score (avg): 0.111 | Positive: 37% | Neutral: 50% | Negative: 12%
KGNAI AI News Sentiment Score (normalized -1 to +1): Not available (as of —) | Label: Not available | Overall news score: 0.11
Positive Developments
Recent coverage across major financial outlets indicates a constructive tone in parts of the broader equity and corporate landscape, anchored by selective reports of operational strength and margin resilience. Within the provided digest, several corporate updates emphasize growth in pre-sales and collections, profit expansion, and business scale-up initiatives despite cost and demand cross-currents. In a cross-asset sense, this kind of reporting typically supports a mild risk-on bias, which aligns with the headline sentiment mix showing 37% positive versus 12% negative, and an average sentiment score of 0.111. For STEELXIND specifically, the relevance is indirect given the absence of instrument-matched articles; however, constructive broader coverage can still matter through liquidity, sector rotation, and general risk appetite. The key constraint is that this mildly supportive context has not yet translated into strong technical confirmation—STEELXIND remains Neutral on the blended technical score (0.087), with mid-term ranks still weak.
Neutral / Mixed Developments
The neutral bucket is dominated by macro and market-structure narratives where direction is less clear. The digest includes themes such as inflation sensitivity, evolving expectations around central bank policy, and the market impact of geopolitical tension—developments that often generate two-sided flows rather than persistent trend continuation. This ambiguity is consistent with the news mix showing 50% neutral items and with the technical state for STEELXIND, where RSI(14) at 48.26 signals neither overbought nor oversold pressure. With volatility not elevated (Bollinger bandwidth 0.1147), price behavior can remain range-bound while participants wait for clearer macro confirmation. In this environment, investors often focus on whether assets can hold key levels (support ~7.1200) while monitoring for improving momentum (MACD histogram moving up from -0.0962).
Negative / Risk Signals
Risk-oriented coverage in the digest clusters around market pullbacks, pressure from inflation surprises, and renewed sensitivity to geopolitical headlines. Such narratives tend to widen dispersion across sectors and can amplify downside reactions in instruments that already screen weaker on mid-term positioning. For STEELXIND, that matters because the model’s mid-term ranks are already in the weaker cohort (#1006 monthly, #1001 3-monthly), and momentum is not supportive (MACD histogram -0.0962). The most material risk from a market-structure standpoint is that negative macro or risk-off impulses can turn a neutral technical setup into a breakdown if price loses a well-defined decision zone. Here, the focal invalidation line remains a close below ~7.1200, which would increase the probability that the mid-term bearish rank structure is being reinforced by price action rather than contested.
What to monitor next
- Whether price can reclaim intermediate trend control (Close vs MA50 currently Bearish) while MACD histogram improves from -0.0962.
- Reaction quality at ~10.7183 (resistance) and ~7.1200 (support), including volume behavior around any break attempts.
- Whether the mid-term ranks (#1006 monthly, #1001 3-monthly) begin to improve alongside technical confluence (-0.056).
Sources referenced: Reuters, Bloomberg, Yahoo Finance, MarketWatch, Investing.com
Snapshot: AI Rank (Short–Mid–Long): Mixed (Neutral–Bearish–Neutral) · Technical Confluence: Neutral · Key Levels: Support ~7.12 | Resistance ~10.72 · News Sentiment: Neutral
7) Sources
Not available in the provided data.
You may also like: How KGNAI AI ranks instruments across global markets
Disclaimer: KGNAI provides AI-generated analytics and educational market commentary only. This is not financial advice. Markets involve risk. Always do your own research.