
Kalyan Jewellers India Limited (KALYANKJIL) — 20-Feb-2026 Technical & Rank Review with a Neutral-to-Balanced Stance
Kalyan Jewellers India Limited (KALYANKJIL) presents a mixed, decision-zone setup as of 20-Feb-2026: the KGNAI ranking layer is uneven across horizons, while the indicator layer leans constructive. The Weekly rank (#78 out of 1214) sits in the upper tier versus the broader universe, but the Daily rank (#703) and Monthly rank (#949) push the profile back toward neutral/lagging behavior. Technically, the dashboard blends to an Overall Technical Score of 0.274 (Neutral) even as the 18-signal confluence reads 0.333 (Bullish), highlighting an alignment gap between short-run signals and broader AI technical positioning (DRL rank #524). Key price decision areas remain clearly defined at Support ~361.5500 and Resistance ~506.7000, while news sentiment is modestly positive-to-neutral (avg 0.044).
- Rank stance (Short / Mid / Long): Neutral / Neutral / Not available (Daily #703, Weekly #78, Monthly #949)
- Technical confluence label: Bullish (18-signal score 0.333), but blended remains Neutral (0.274)
- Key levels: Support ~361.5500 | Resistance ~506.7000
- News sentiment bias: Neutral (avg 0.044; 25% positive / 63% neutral / 12% negative)
- Confirmation / invalidation: A sustained break above 506.7000 with volume supports continuation; a close below 361.5500 increases deterioration risk.
What KGNAI Measures
KGNAI evaluates instruments through relative positioning across large universes, emphasizing stability and cross-signal agreement rather than isolated indicator strength. Outputs are designed to reflect probabilistic behavior patterns observed at scale, where alignment and divergence can be more informative than any single metric.
How to Read This Report
- Ranks are comparative, not absolute (position within 1214 instruments).
- Confluence reflects signal agreement across RSI, MACD, Bollinger Bands, trend and volume signals.
- Support/resistance are decision zones where behavior often changes.
- Sentiment adds context and can either reinforce or conflict with the technical read.
KGNAI Signal + Technical Snapshot + News Sentiment Digest
As of: 20-Feb-2026
Ticker: KALYANKJIL
1) KGNAI AI Analysis
Region: INDIA
Total universe size: 1214 ranked instruments
- Daily rank: #703 out of 1214 — Neutral
- Weekly rank: #78 out of 1214 — Bullish
- Monthly rank: #949 out of 1214 — Neutral
- 3-Monthly rank: Not available for this horizon — Not available
- 6-Monthly rank: Not available for this horizon — Not available
- Yearly rank: Not available for this horizon — Not available
The rank profile is best described as timeframe-fragmented. The Weekly rank (#78) places KALYANKJIL in the upper portion of the 1214-instrument universe, consistent with favorable mid-frequency behavior. In contrast, the Daily rank (#703) sits closer to the middle-to-lower half, and the Monthly rank (#949) falls into a weaker relative cohort, implying that longer-aggregation behavior has not kept pace.
This split often coincides with transitional phases: either a developing up-move that has not yet “earned” higher longer-horizon placement, or a rebound that remains vulnerable to reversal if follow-through fails. The absence of 3-month, 6-month, and yearly ranks (“Not available”) reduces clarity on whether the weekly strength is a continuation within a larger regime or a short-lived deviation.
The term view in the dataset remains Short-term: Neutral and Mid-term: Neutral, aligning with the idea that the weekly strength is not yet broad-based enough to upgrade the overall stance. For positioning discipline, the most actionable takeaway is not the weekly rank alone, but the gap between #78 (weekly) and #949 (monthly), which signals elevated uncertainty around persistence.
KGNAI ranks each instrument across large universes using multiple proprietary AI tests and statistical models (millions of data points). Lower ranks generally indicate stronger probability of favorable performance behavior, while higher ranks indicate weaker probability and more bearish positioning.
Term view: Short-term: Neutral. Mid-term: Neutral. Long-term: Not available.
Want the full universe and complete rank tables? Unlock full access on KGNAI: https://www.kgnai.com/pricing
2) Price & trend overview
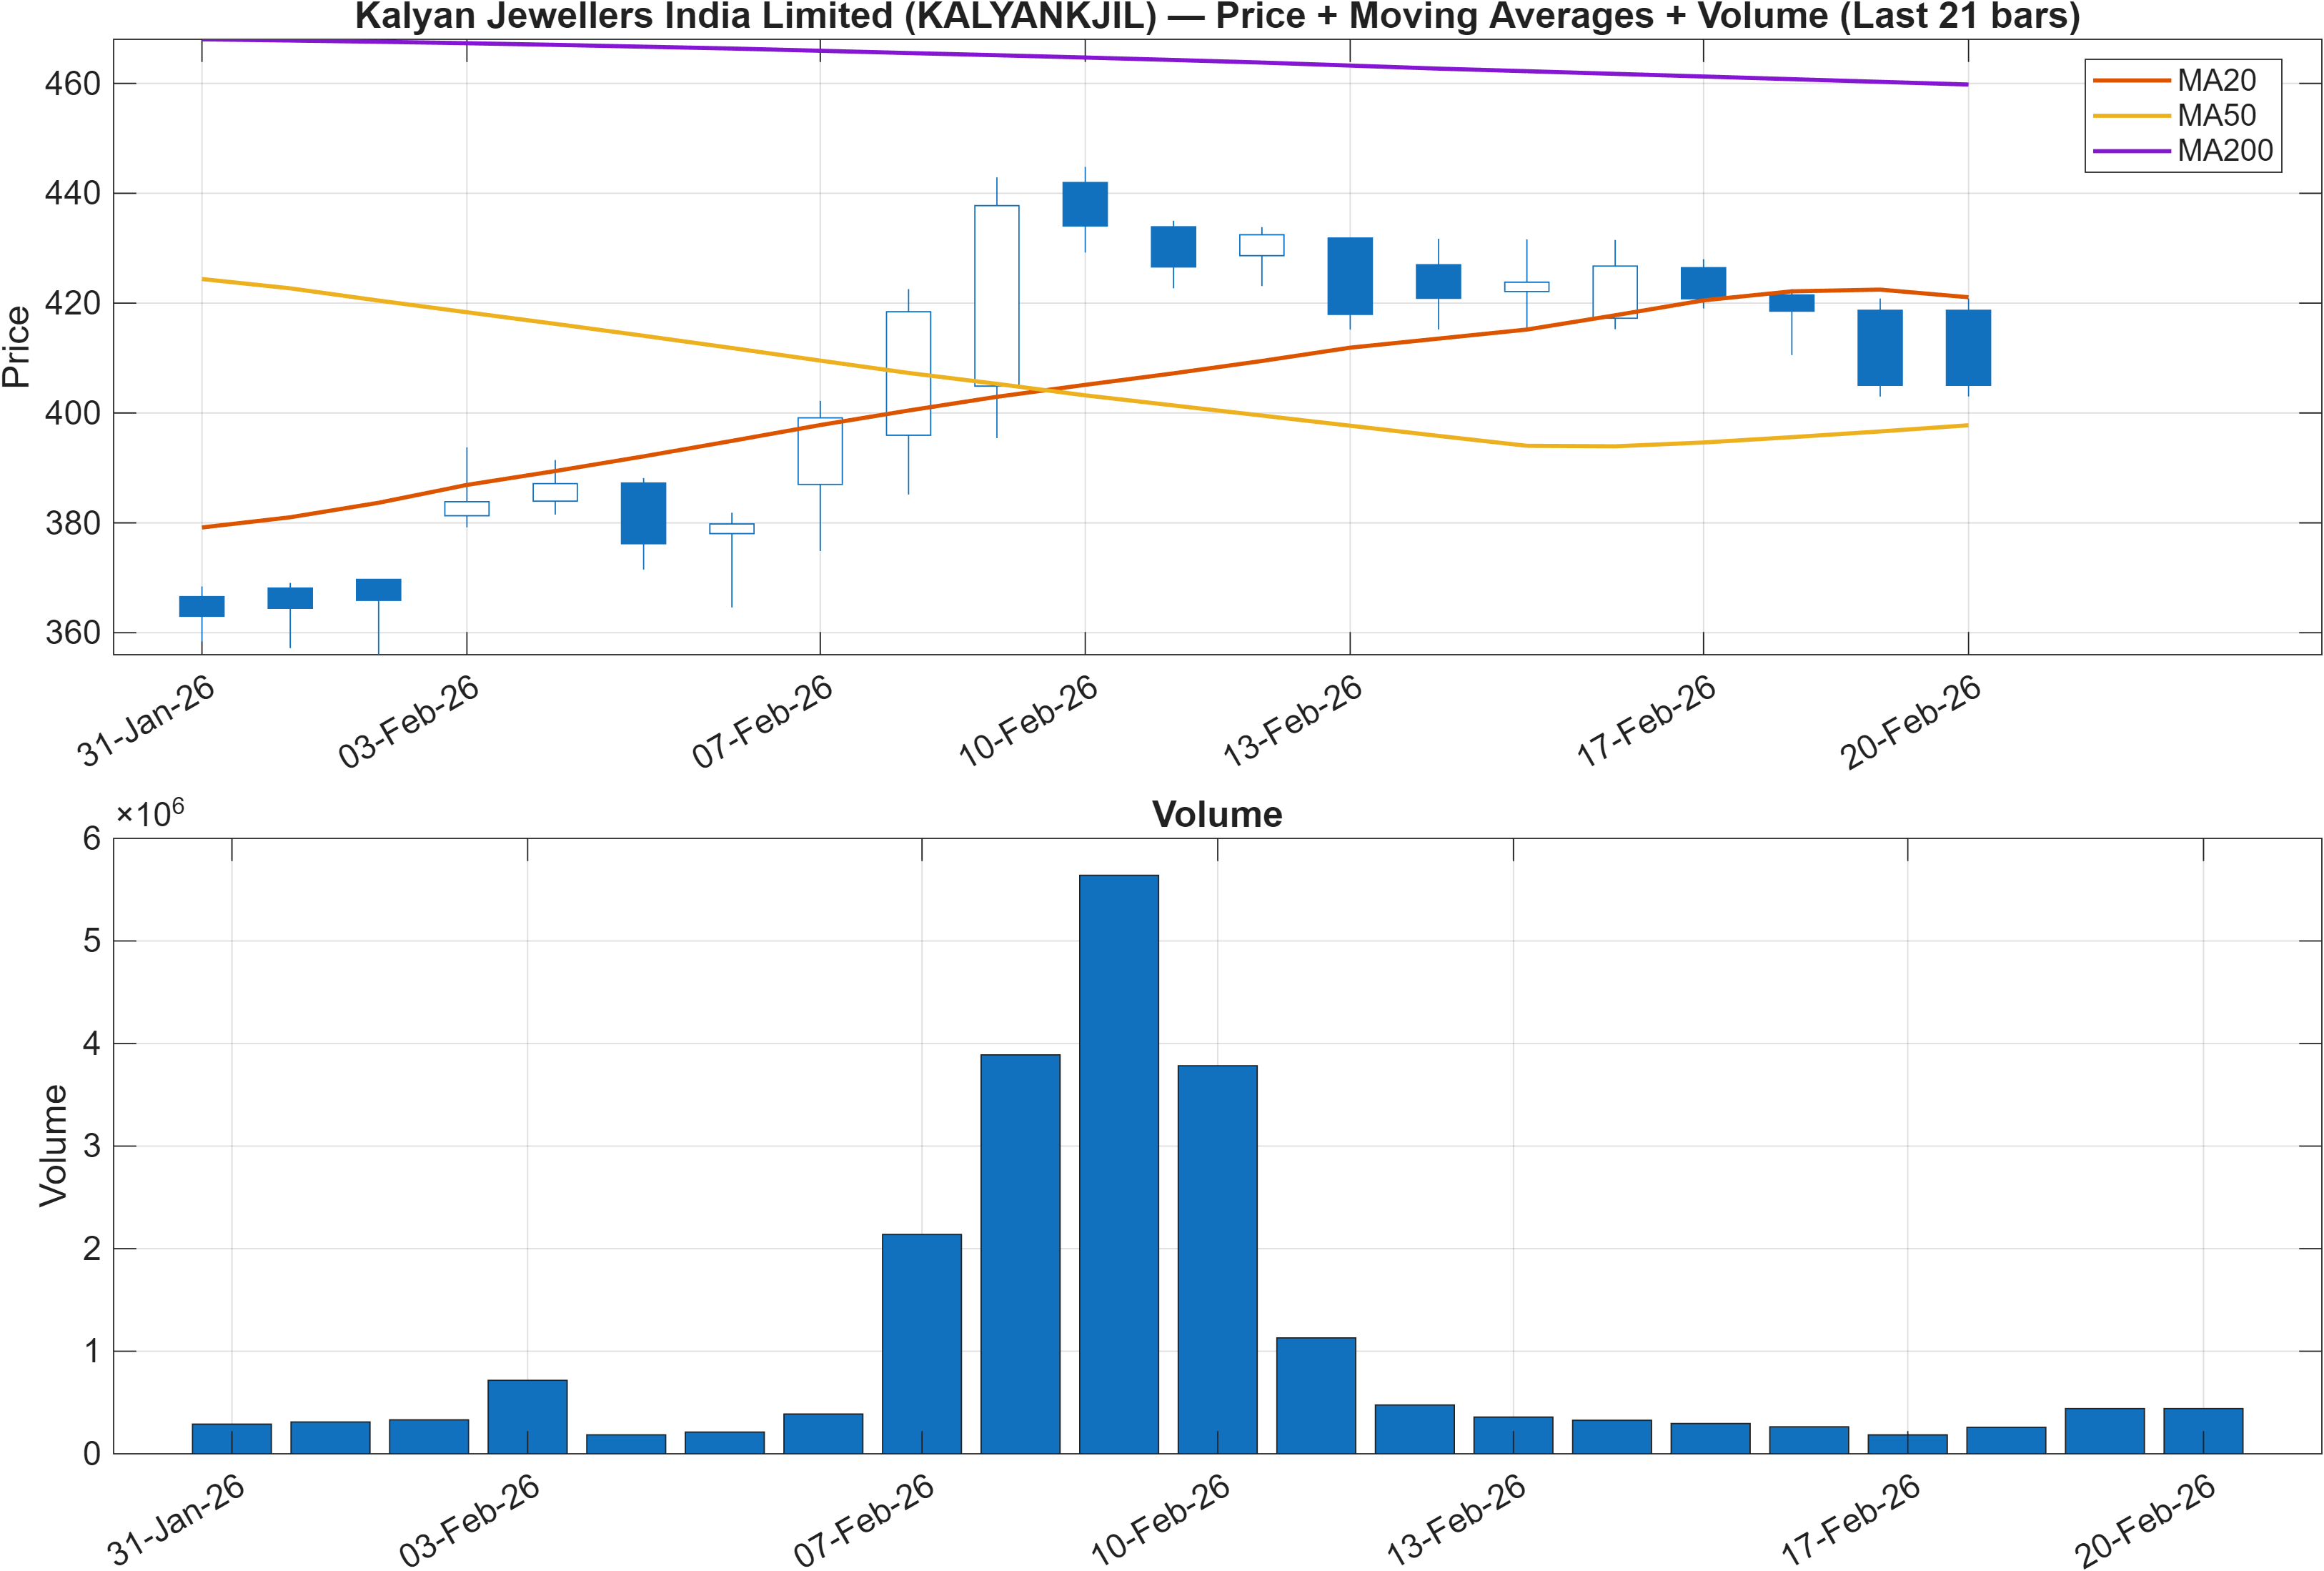
Trend interpretation hinges on a deliberate contradiction: Close vs MA50 = Bullish, while MA50 vs MA200 = Bearish. That combination commonly describes a rebound inside a larger, slower-moving downtrend (or a late-stage downtrend attempting to stabilize). In practical trading terms, the nearer-term moving average alignment supports momentum continuity, but the longer-term moving average structure argues for caution when price approaches overhead supply.
This fits the rank dispersion seen earlier: the Weekly rank (#78) suggests the rebound/trend leg has been constructive recently, yet the Monthly rank (#949) implies the higher-timeframe context remains less favorable. When this occurs, risk tends to concentrate around “failure points” where price stalls and volume fades, or where a pullback tests the integrity of the MA50 relationship.
For KALYANKJIL specifically, the range framing from the levels section (support 361.5500, resistance 506.7000) complements the moving average read: as price travels toward the upper boundary, the bearish MA50–MA200 relationship can become more influential. Conversely, as long as price behavior remains consistent with the Close>MA50 bullish condition, the market is still rewarding the shorter-term trend.
Interpretation: Close vs MA50 = Bullish, MA50 vs MA200 = Bearish.
3) Momentum & volatility dashboard
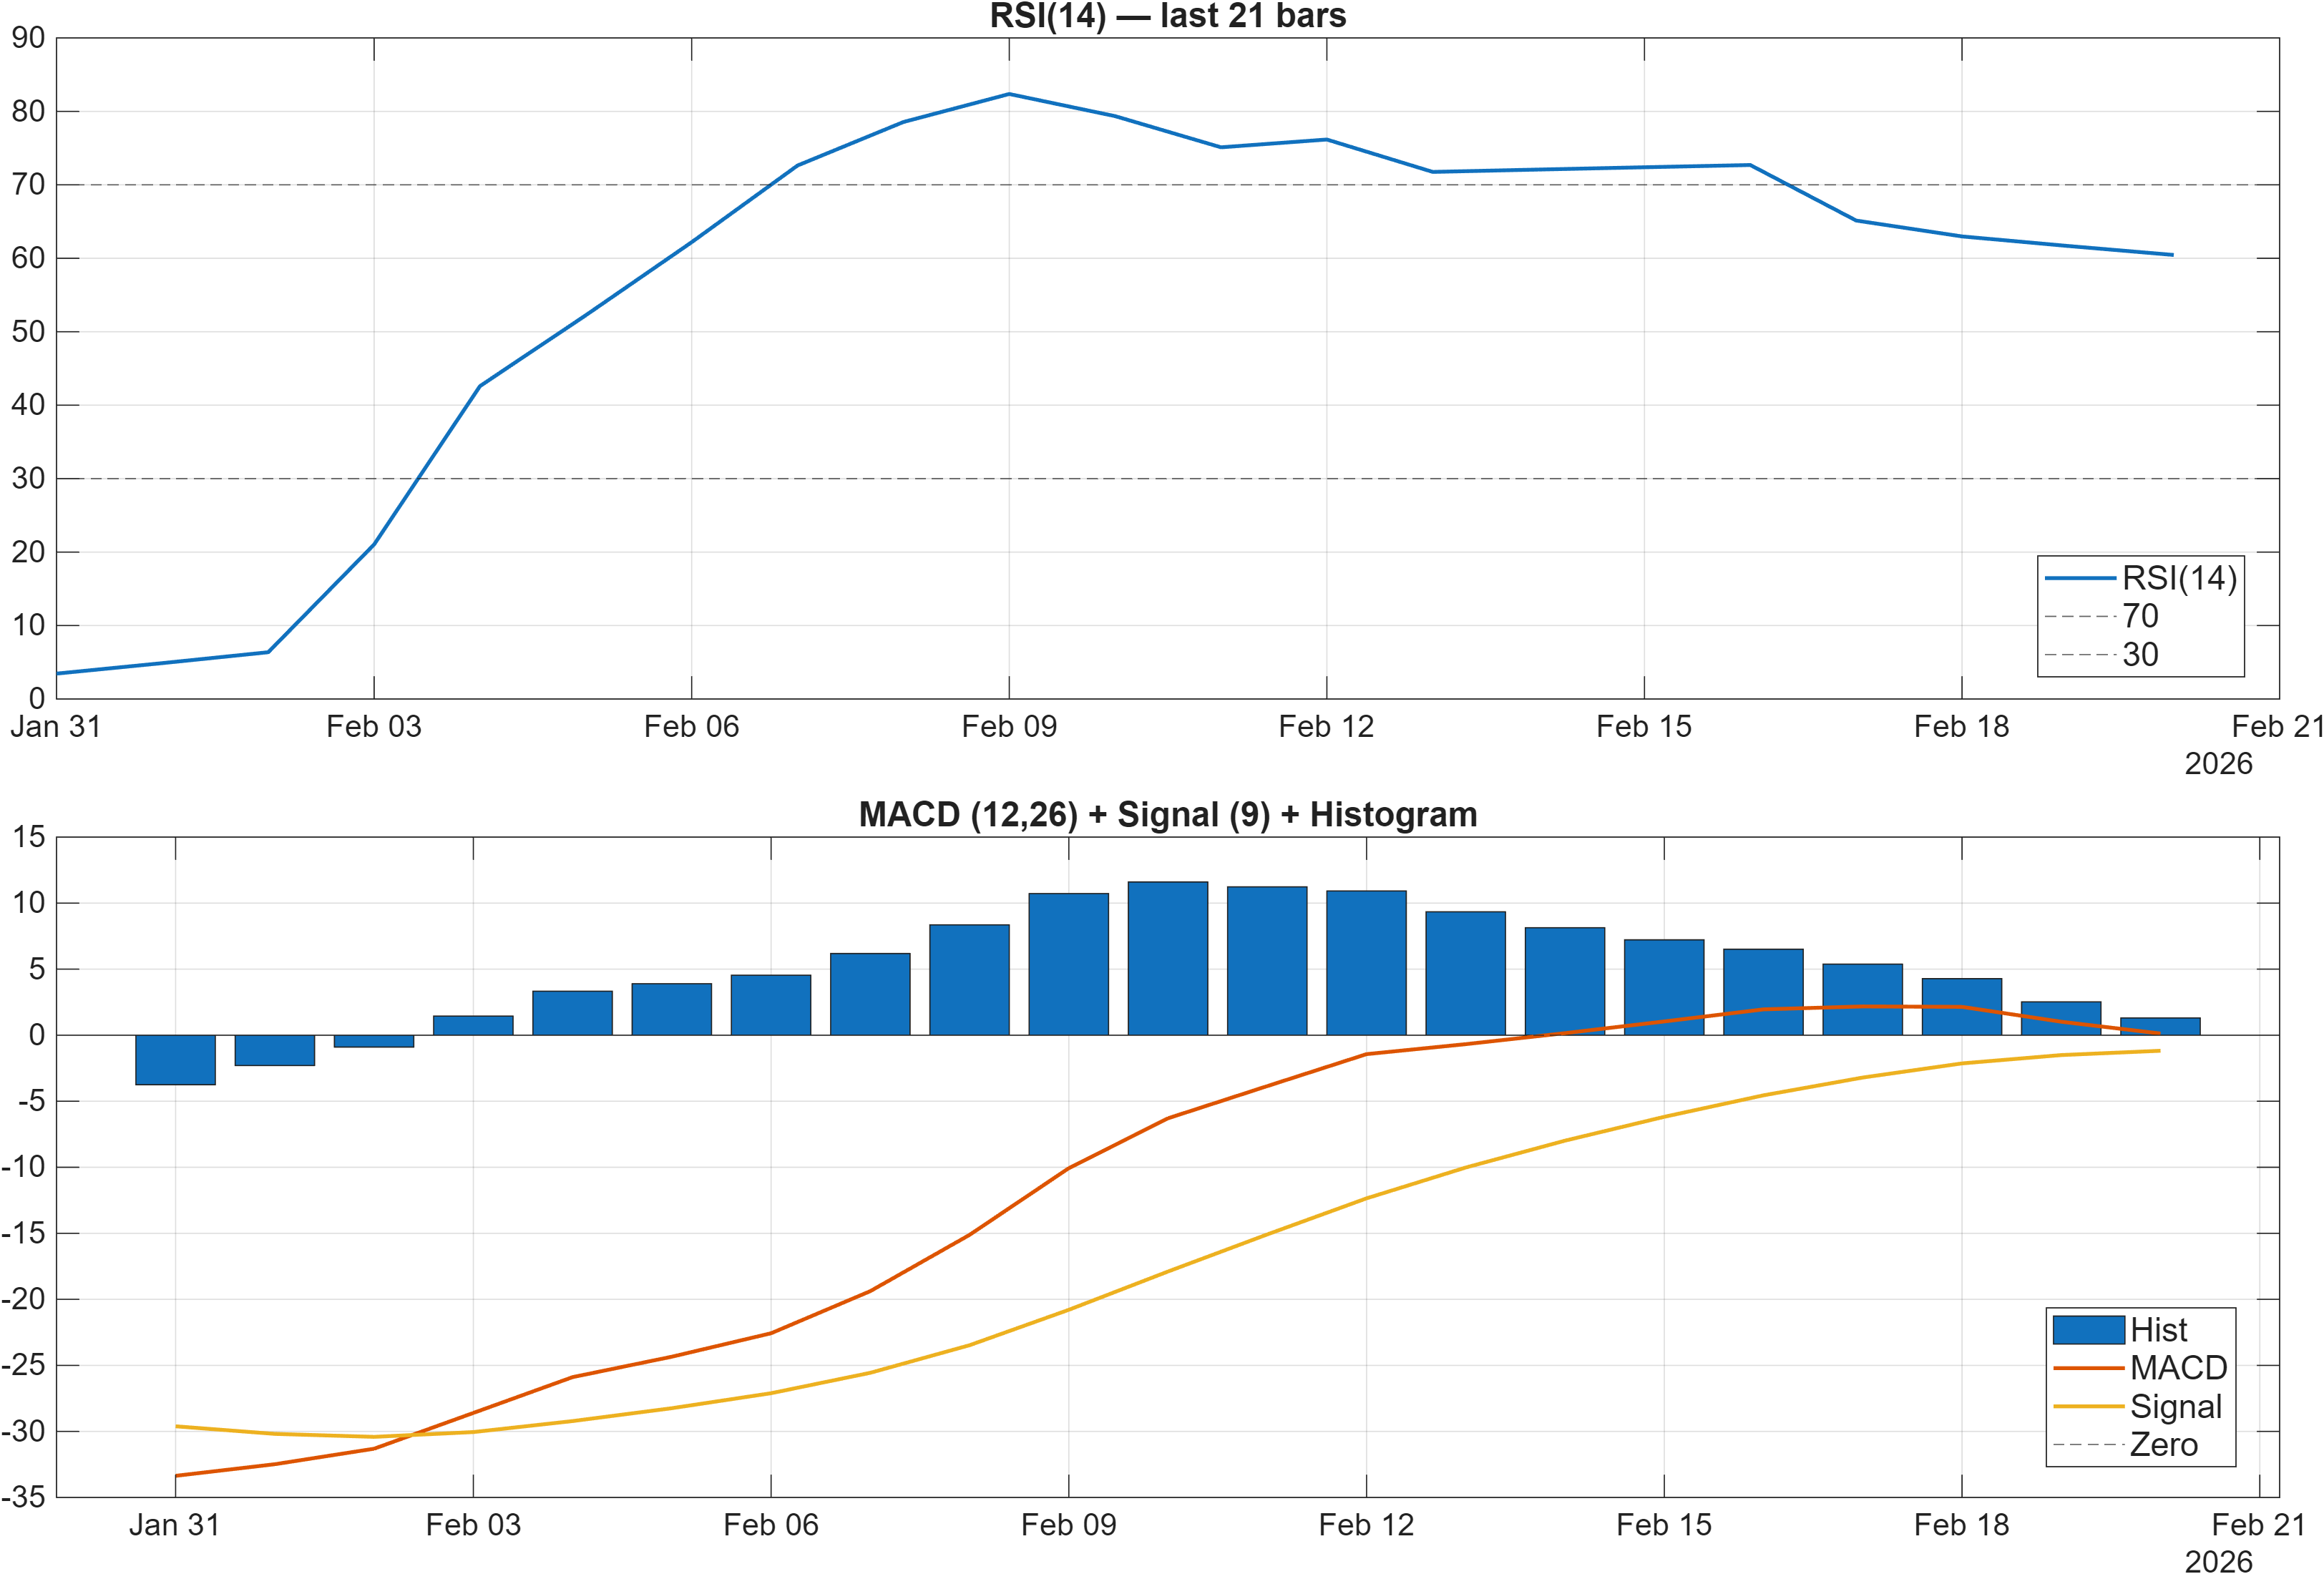
Momentum signals skew constructive, but not extreme. The dashboard states RSI bias = Bullish with RSI(14) = 60.45, a level typically associated with positive momentum while still leaving room before common overbought thresholds. At the same time, the MACD complex remains supportive: the MACD hist = 1.3043 (and table value 1.304) is positive, consistent with an upswing that has not yet fully decayed.
The tension appears in the microstructure of participation: several volume/accumulation slopes are bearish in the signal table (e.g., OBV slope(10) is negative; AD Line slope(10) is negative). When price momentum is improving but accumulation measures soften, rallies can become more sensitive to resistance zones and headline-driven volatility. This is one reason the blended technical outcome is not fully bullish despite a bullish confluence score.
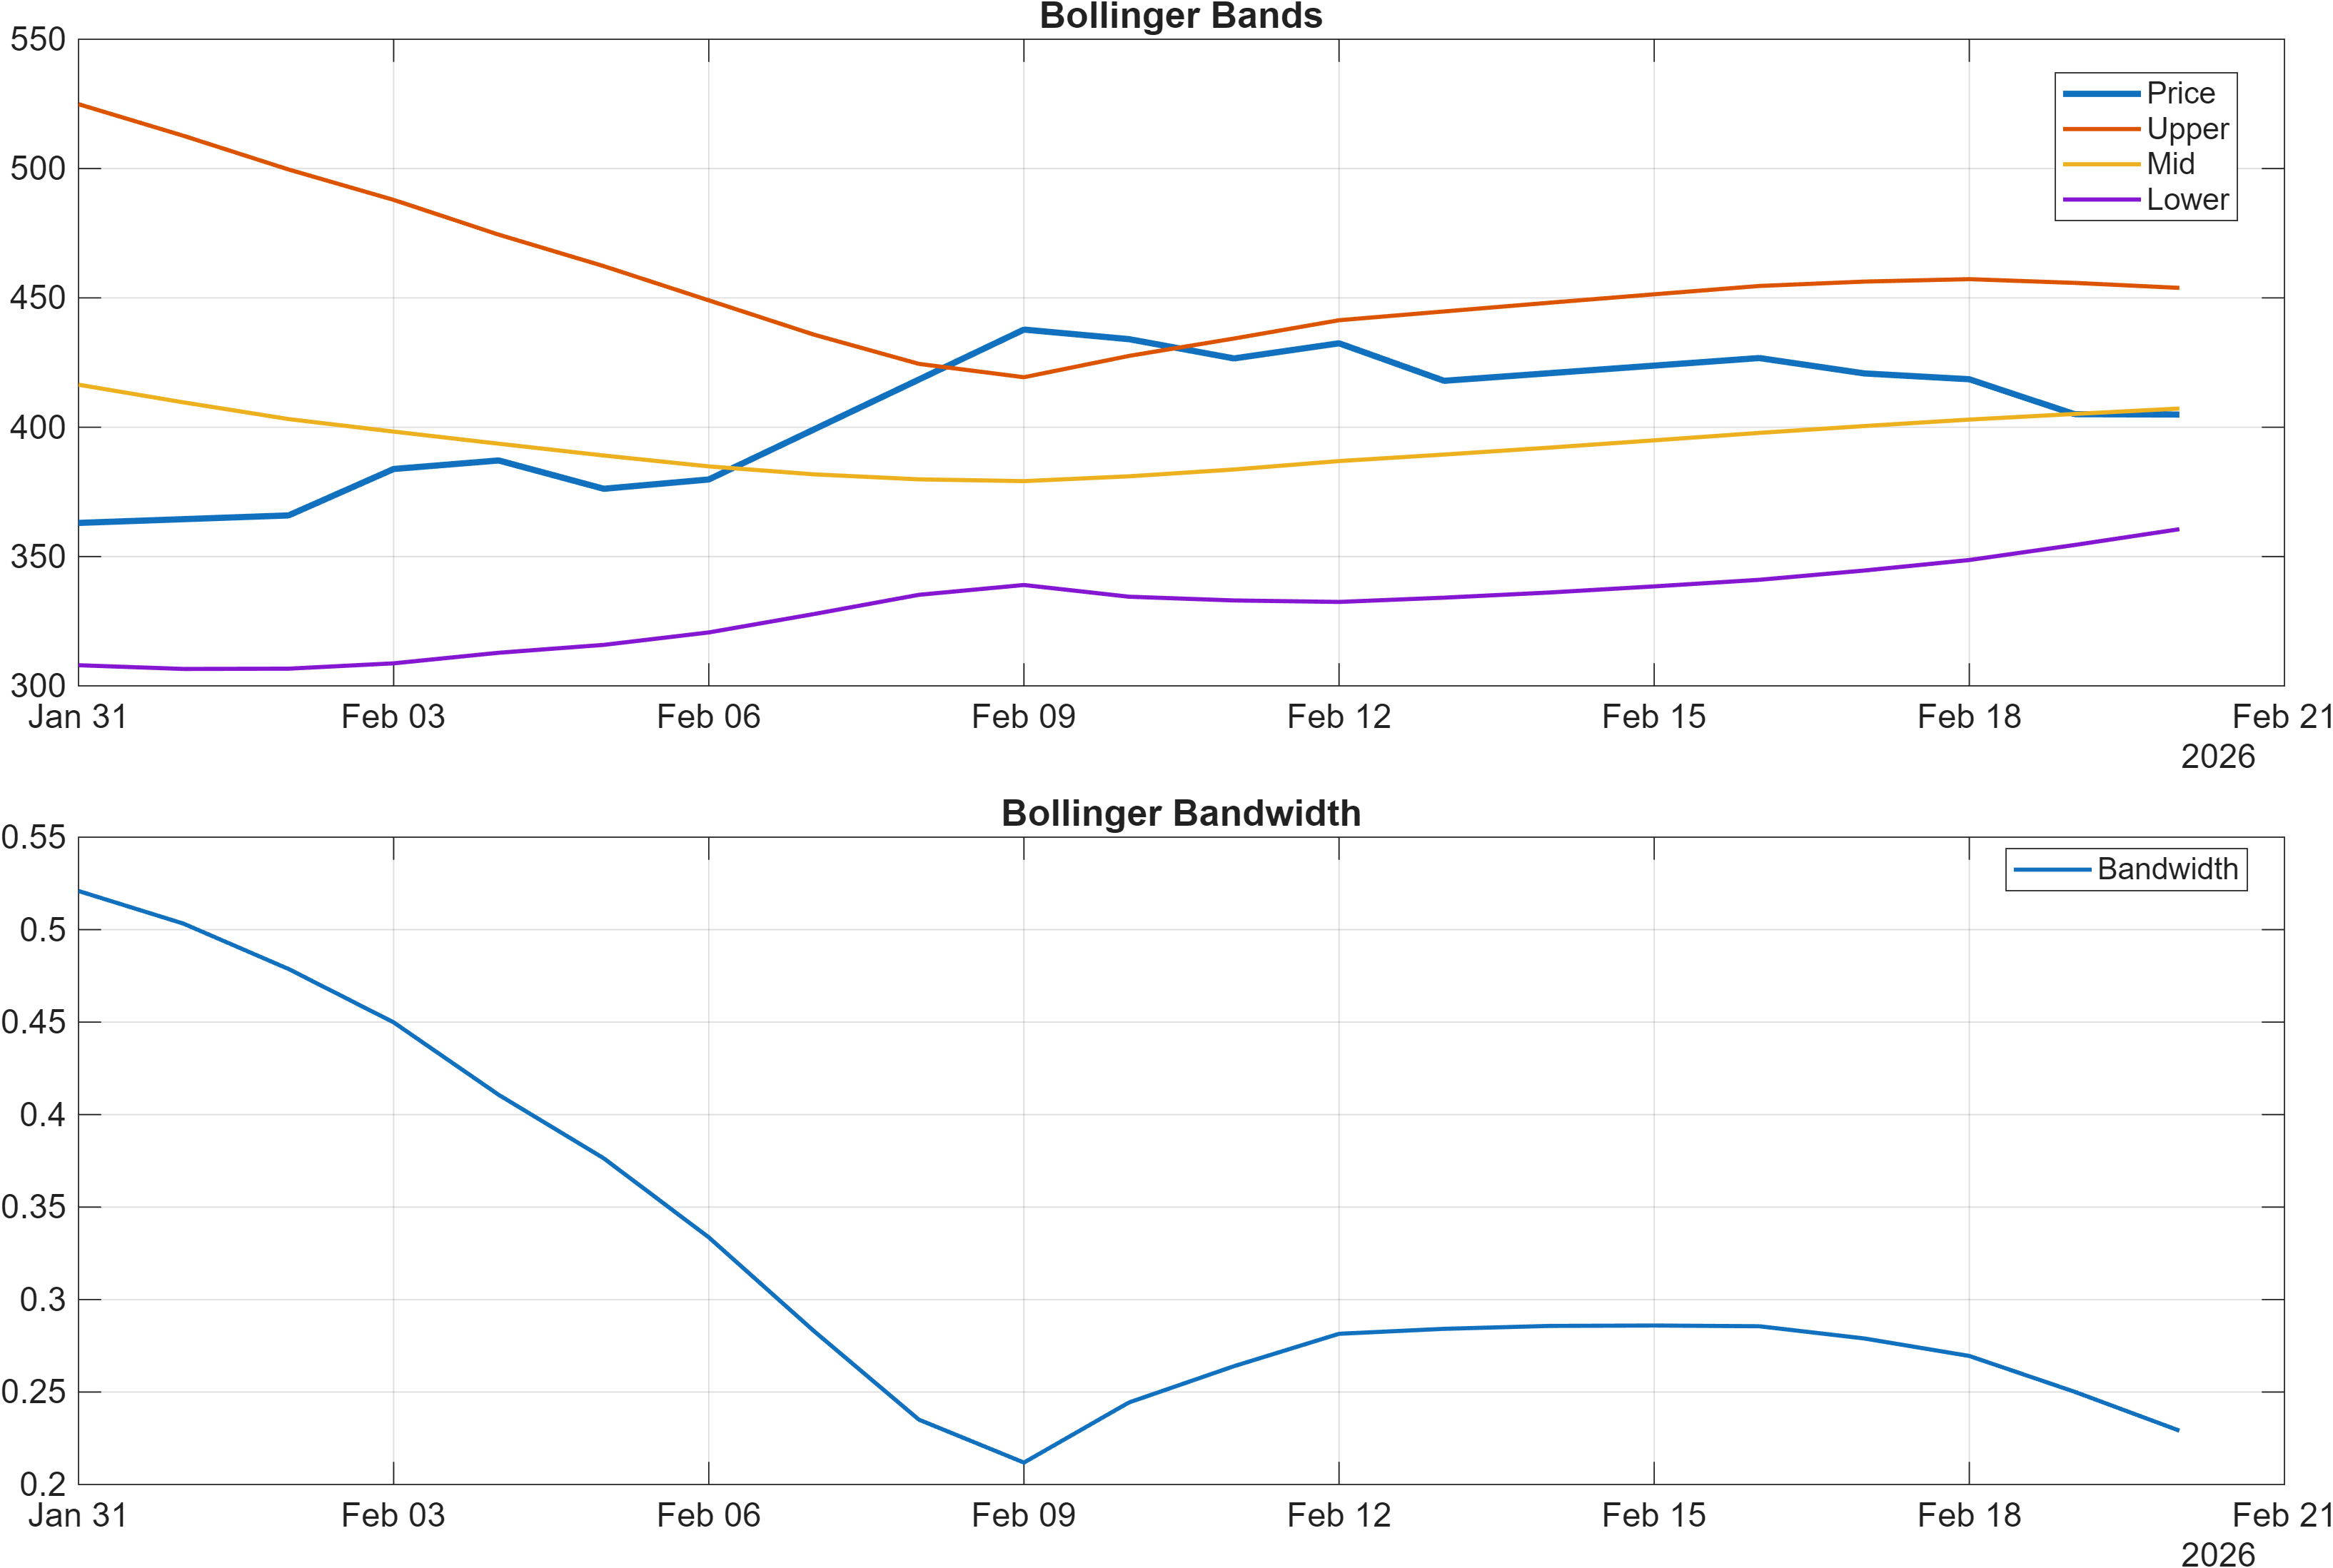
Volatility sits in a defined regime rather than a clear compression: Bandwidth latest = 0.2291. With BB Width flagged Neutral, the data supports a market that can still move, but is not signaling an obvious “squeeze” trigger by itself. In this environment, confirmation tends to rely on price behavior around 361.5500 and 506.7000, and whether momentum indicators remain aligned.
Interpretation: RSI bias = Bullish, MACD hist = 1.3043.
Interpretation: Bandwidth (volatility regime) latest = 0.2291.
4) Support / Resistance zones
Support ~ 361.5500 | Resistance ~ 506.7000
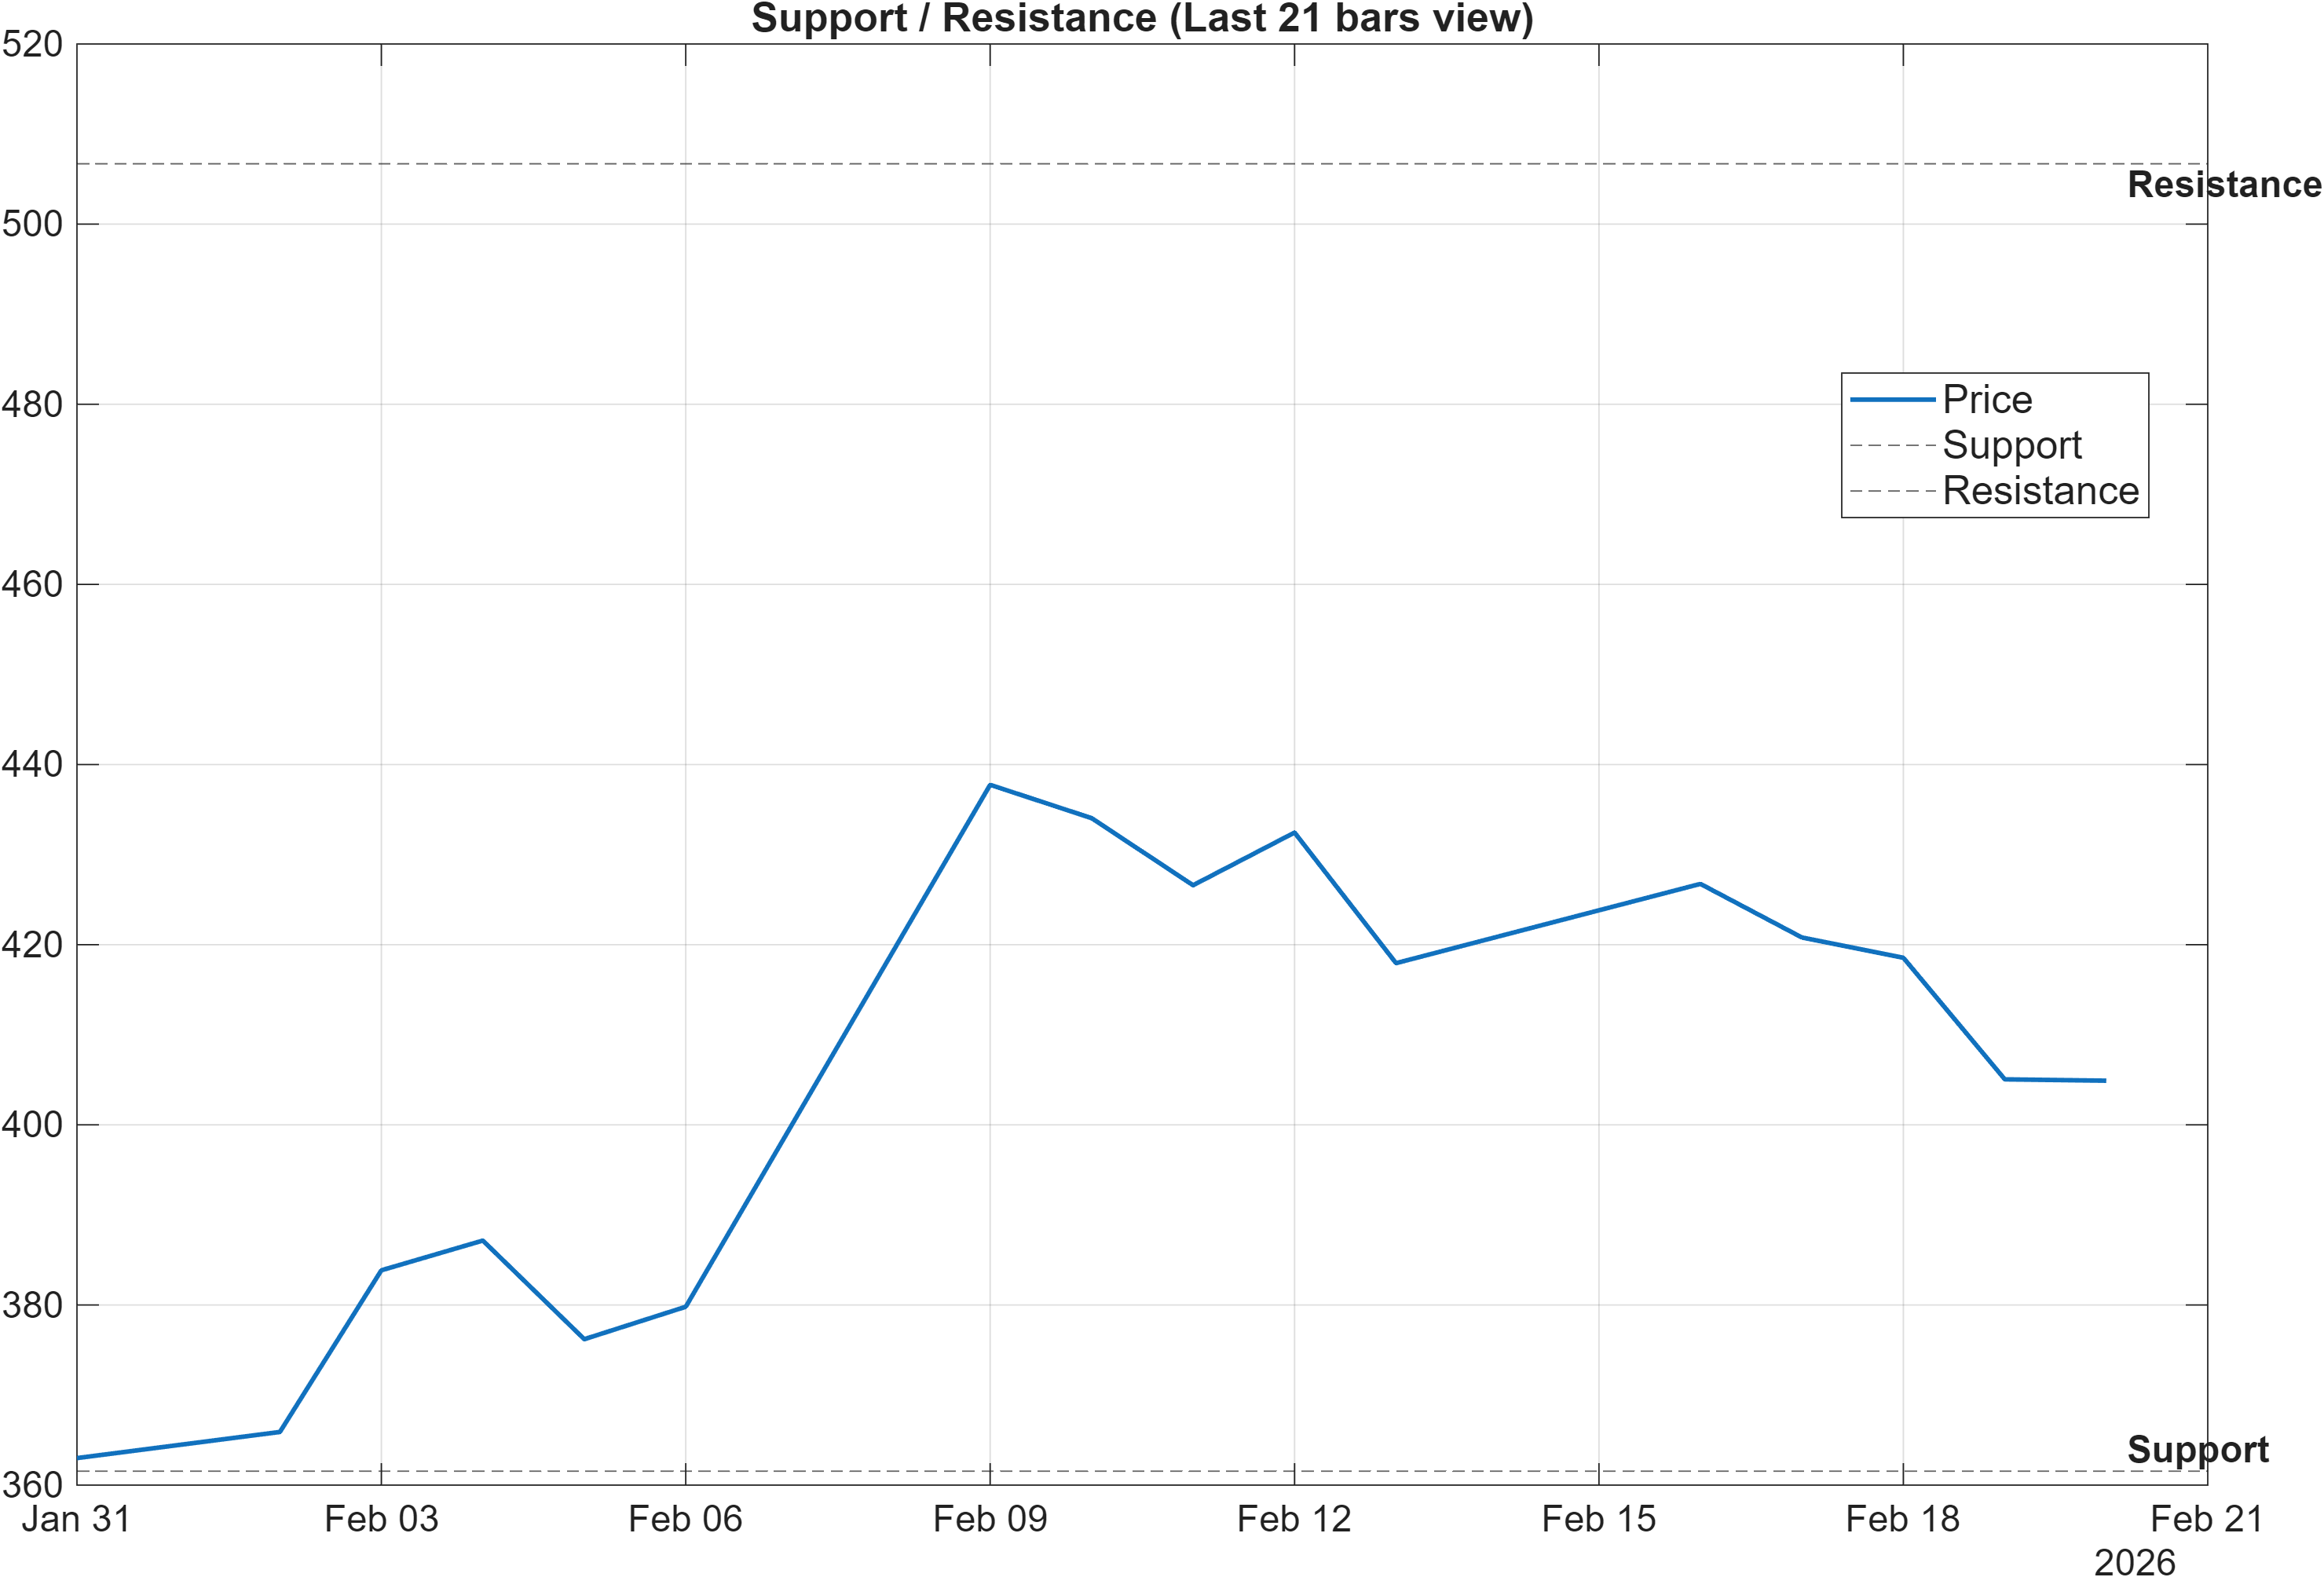
The level structure is wide enough to matter for both swing and position management. 361.5500 functions as the nearest defined support zone; the scenario guidance is explicit that a close below support raises deterioration risk. Given the mixed rank picture (Weekly #78 versus Monthly #949), that downside condition is especially relevant: a break of support would align the price structure with the weaker longer-horizon rank and could reduce the credibility of the weekly strength.
Overhead, 506.7000 is the primary resistance reference. A break above resistance with volume is framed as a continuation signal, which would also help resolve the current divergence between the bullish indicator confluence (0.333) and the neutral blended technical score (0.274). Because MA50 vs MA200 is labeled bearish, resistance behavior can be more “sticky,” often requiring repeated tests or a clear volume expansion before the level is absorbed.
The indicator table adds texture to these zones: HHIGH(20) = 444.8 and LLOW(20) = 356 are neutral signals, suggesting the market’s recent 20-period extremes are not being flagged as strong trend breakouts yet. Meanwhile, MedPx vs Support = 50.38 is bullish, consistent with price holding above the support reference. The cleanest operational read is to treat 361.5500 as a risk boundary and 506.7000 as the primary validation level for a more durable trend transition.
Scenario view: Break above resistance with volume → continuation. Close below support → signal deterioration risk.
5) Quant Technical Dashboard (18 Signals)
KGNAI AI Technical Analysis Score (Deep Reinforcement Learning): Rank #524 out of 1214 (Rank 1 represents the strongest technical positioning and a higher probability of favorable price behavior. As ranks increase toward the maximum, the probability of favorable outcomes weakens and bearish positioning becomes more dominant.) | Label: Neutral | Score: 0.137
18-Signal Technical Confluence Score: 0.333 (Bullish)
Overall Technical Score (18-signal confluence + DRL rank blend): 0.274 (Neutral)
Note: The blended score reflects signal strength weighted against broader AI technical ranking, which may temporarily diverge.
Blended technical score breakdown: 0.274 (Neutral | Bull 10 / Bear 4 / Neutral 4)
The dashboard’s central message is bullish breadth with capped conviction. On one hand, the 18-signal system records Bull 10 / Bear 4 / Neutral 4 and a confluence score of 0.333 (Bullish), consistent with improving momentum (e.g., RSI(14) 60.45, MACD Hist 1.304) and supportive rate-of-change inputs (ROC(20) 11.1). On the other hand, the separate DRL technical layer is only Rank #524 out of 1214 with a score of 0.137, keeping the Overall Technical Score at 0.274 (Neutral).
This divergence is analytically useful: it implies the indicator set is detecting near-term improvement, while the broader technical state (as modeled across the universe) remains closer to the middle of the distribution. In such cases, the market often demands cleaner confirmation—usually through structure (breaking 506.7000) and participation—before the “neutral blend” shifts.
The bear signals are concentrated in accumulation/participation slopes (OBV, PVT, AD Line, Williams A/D), which can matter most near resistance. If price advances while these stay negative, breakouts can be more failure-prone; if they stabilize, the bullish majority gains credibility. The BB Width 0.2291 sitting neutral reinforces that the move is not purely a volatility expansion story, but a test of whether trend + participation can align.
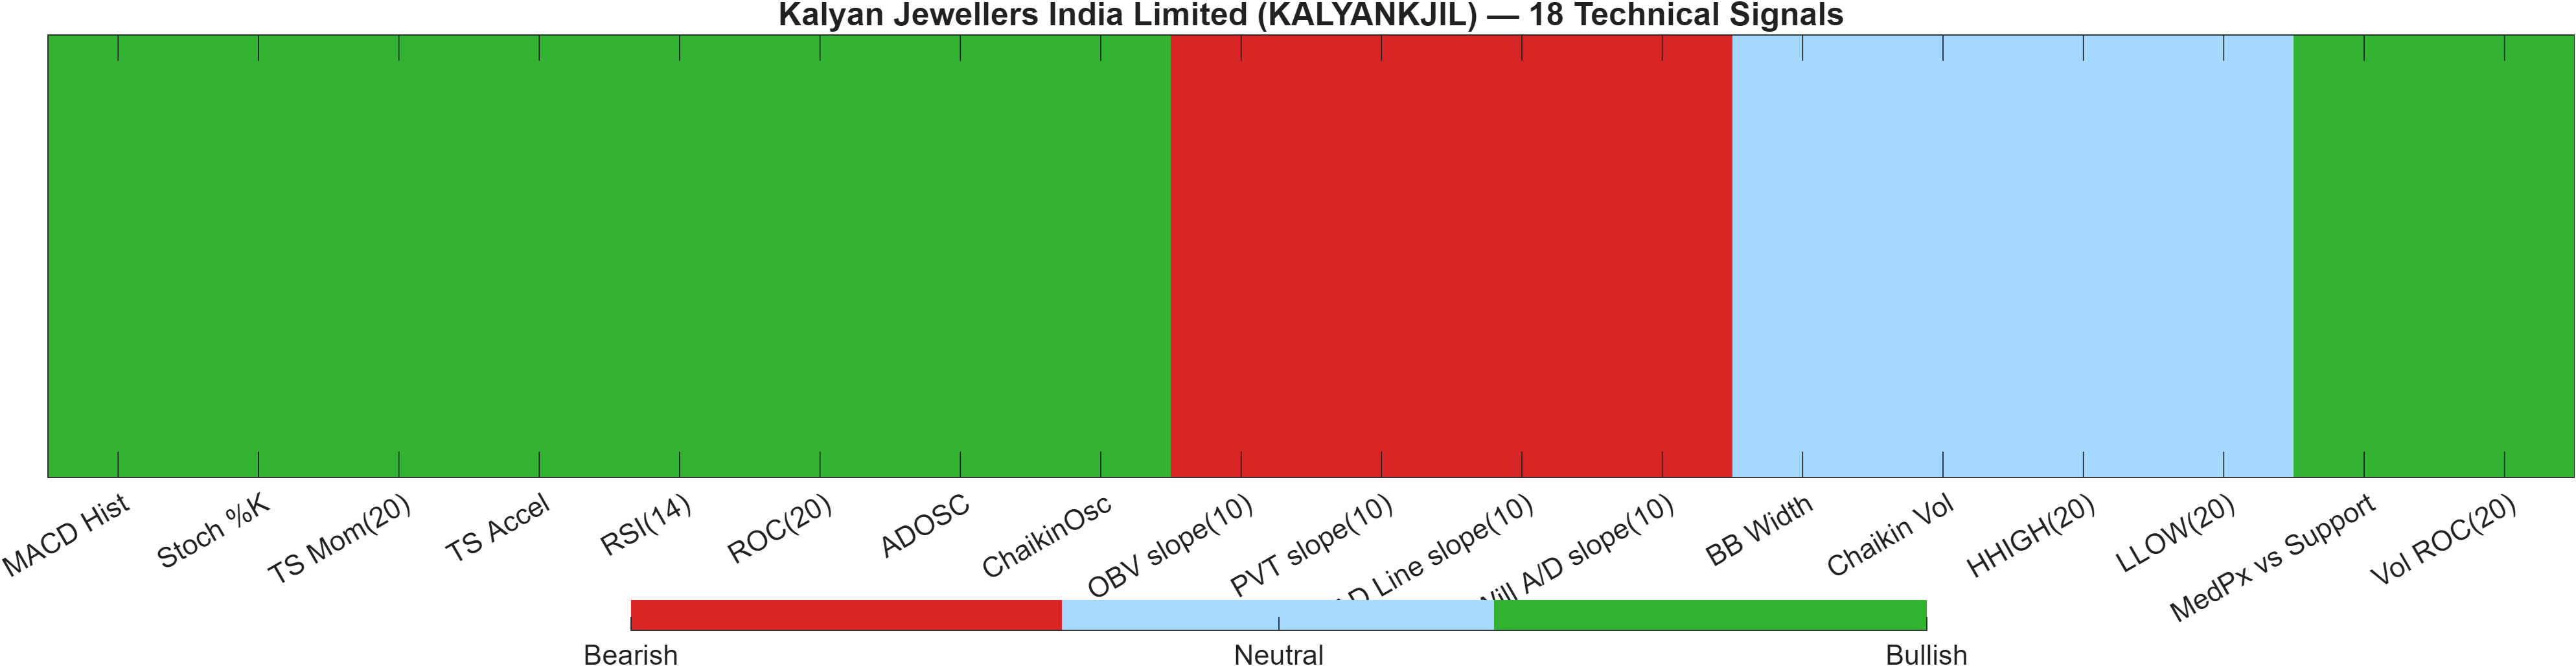
Signal table (Bull/Bear/Neutral)
| Indicator | Value | Signal |
|---|---|---|
| MACD Hist | 1.304 | Bullish |
| Stoch %K | 6.406 | Bullish |
| TS Mom(20) | 40.6 | Bullish |
| TS Accel | 171.2 | Bullish |
| RSI(14) | 60.45 | Bullish |
| ROC(20) | 11.1 | Bullish |
| ADOSC | 11.76 | Bullish |
| ChaikinOsc | 2.737e+05 | Bullish |
| OBV slope(10) | -1.01e+06 | Bearish |
| PVT slope(10) | -3.686e+04 | Bearish |
| AD Line slope(10) | -9.857e+05 | Bearish |
| Will A/D slope(10) | -14.8 | Bearish |
| BB Width | 0.2291 | Neutral |
| Chaikin Vol | -24.56 | Neutral |
| HHIGH(20) | 444.8 | Neutral |
| LLOW(20) | 356 | Neutral |
| MedPx vs Support | 50.38 | Bullish |
| Vol ROC(20) | 42.14 | Bullish |
Interpretation: Indicator-level signals form the base confluence, which is then adjusted using a separate AI-driven technical ranking model. The final technical score summarizes this combined view.
6) News sentiment + extractive gist
Note: Instrument-specific news matches were not found, so the digest includes broader market/sector headlines. Links are provided for verification.
Sentiment score (avg): 0.044 | Positive: 25% | Neutral: 63% | Negative: 12%
KGNAI AI News Sentiment Score (normalized -1 to +1): Not available (as of —) | Label: Not available | Overall news score: 0.04
Positive Developments
Recent coverage across major financial outlets indicates a constructive tone around segments tied to discretionary demand, with commentary highlighting resilience in consumption pockets and improved margin narratives driven by cost management. For jewelry-adjacent themes, the messaging is generally supportive: analysts and guests have emphasized category-level drivers and relative preference for branded, organized players, which can contribute to steadier sentiment even when price action is choppy. In parallel, ongoing capital-markets activity (including IPO-related discussion) has been framed as a sign of risk appetite persisting despite intermittent volatility. Against KALYANKJIL’s technical backdrop—where the 18-signal confluence is 0.333 (Bullish) and RSI is 60.45—this constructive tone can act as a light tailwind, though it does not substitute for price confirmation near 506.7000.
Neutral / Mixed Developments
The neutral skew in the dataset (63% of items) matches a market narrative that is more about rotation and positioning than a single dominant macro catalyst. Broader index commentary has described mixed sessions with leadership changing intraday, consistent with an environment where technical levels matter more than headlines. Policy and administrative topics have appeared in the background, contributing to a “wait-and-see” posture rather than a directional impulse. For KALYANKJIL, this neutrality aligns with the blended technical reading—Overall Technical Score 0.274 (Neutral) and DRL Rank #524—suggesting that while momentum indicators are supportive, conviction still depends on whether price can convert the weekly strength (#78) into more persistent trend structure.
Negative / Risk Signals
Risk-oriented coverage has included rate and bond-market sensitivity, which can influence discount rates, liquidity expectations, and near-term risk appetite—particularly when narratives around cuts or growth inflect quickly. Even without instrument-specific items, these macro swings can amplify volatility around technical boundaries. For KALYANKJIL, that matters because the setup is not one-way: price is bullish versus MA50, yet MA50 versus MA200 is bearish, and several participation slopes in the signal table are Bearish. In that context, a macro-driven risk-off impulse can accelerate “failed breakout” behavior near 506.7000 or increase the probability of a breakdown test toward 361.5500, which is explicitly flagged as a deterioration risk if lost on a closing basis.
- Acceptance above 506.7000 alongside improving participation signals (OBV/AD slopes stabilizing).
- Any closing weakness toward 361.5500, which would align with the weaker Monthly rank (#949).
- Whether momentum remains constructive (RSI holding near 60.45, MACD histogram staying positive around 1.3043).
Sources referenced: Reuters, Bloomberg, Yahoo Finance, MarketWatch, Investing.com
Snapshot: AI Rank (Short–Mid–Long): Neutral (Neutral–Neutral–Not available) · Technical Confluence: Bullish · Key Levels: Support ~361.55 | Resistance ~506.70 · News Sentiment: Neutral
7) Sources
Not available in the provided data.
You may also like: How KGNAI AI ranks instruments across global markets
Disclaimer: KGNAI provides AI-generated analytics and educational market commentary only. This is not financial advice. Markets involve risk. Always do your own research.