
PNBHOUSING (PNB Housing Finance Ltd) — 18-Feb-2026 Technical Strength vs Mixed-to-Bearish Ranks
PNB Housing Finance Ltd (PNBHOUSING) shows a notable split between model-based relative ranks and indicator-level technical posture as of 18-Feb-2026. Across a 1214-instrument India universe, short-horizon ranks remain Neutral (Daily rank #731; Weekly rank #772), while the medium-to-long windows lean weaker (Monthly rank #1065; Yearly rank #974), placing the stock in the lower portion of the distribution on those horizons. At the same time, the technical stack is constructive: the Deep Reinforcement Learning technical rank is #199 and the 18-signal confluence is Bullish (0.556), producing an Overall Technical Score of 0.591 with 12 Bull signals versus 2 Bear. Structurally, attention centers on the decision band between support ~809.8750 and resistance ~1008.6750, with momentum readings (RSI(14) 57.79; MACD histogram 5.5786) suggesting demand is present but still needs confirmation through level-based follow-through.
- Rank stance: Short-term Neutral (Daily #731; Weekly #772) | Mid-term Bearish (Monthly #1065) | Long-term Bearish (Yearly #974)
- Technical confluence: Bullish (18-signal score 0.556; Overall Technical Score 0.591; DRL technical rank #199)
- Key levels: Support 809.8750 | Resistance 1008.6750
- News sentiment bias: Distribution reads Neutral (Neutral 100%); normalized news sentiment shows Bullish (0.81) with overall news score 0.67
- Confirmation / invalidation: A break above 1008.6750 with volume supports continuation; a close below 809.8750 increases deterioration risk
What KGNAI Measures
KGNAI evaluates instruments by relative positioning across large universes and by how consistently multiple signals align over time. The ranks and technical scores are designed to reflect probabilistic behavior patterns observed across many instruments rather than single-point conclusions. Support/resistance and indicator clusters are treated as decision zones that can validate or contradict the rank regime.
How to Read This Report
- Ranks are comparative within the 1214-instrument universe, not absolute measures
- Confluence scores summarize signal agreement across indicators (RSI, MACD, Bollinger Bands, volume/flow proxies)
- Support/resistance levels are structure references, not price targets
- Sentiment adds contextual bias and can diverge from price-based evidence
1) KGNAI AI Analysis
Region: INDIA
Total universe size: 1214 ranked instruments
- Daily rank: #731 out of 1214 — Neutral
- Weekly rank: #772 out of 1214 — Neutral
- Monthly rank: #1065 out of 1214 — Bearish
- 3-Monthly rank: #941 out of 1214 — Neutral
- 6-Monthly rank: #625 out of 1214 — Neutral
- Yearly rank: #974 out of 1214 — Bearish
The rank stack implies near-term stabilization but not a clean regime upgrade across longer horizons. Daily (#731) and weekly (#772) ranks sit in a broadly Neutral zone, while monthly (#1065) and yearly (#974) ranks fall into the weaker tail of the 1214-name distribution. This pattern often appears when price is improving or compressing after a prior downcycle, but the longer-window statistical tests still reflect residual drag (trend memory, distributional skew, or drawdown persistence).
The 3-month rank (#941) remains Neutral, and the 6-month rank (#625) is also Neutral, suggesting the mid-horizon has not fully capitulated despite the monthly and yearly Bearish labels. In practice, that mix raises the bar for confirmation: it typically takes either sustained follow-through (so the monthly window improves from #1065) or a clear breakdown that forces shorter windows to deteriorate from their current Neutral stance.
The term view provided is consistent with the rank profile: Short-term Neutral, Mid-term Bearish, Long-term Bearish. For readers integrating ranks with technicals, the central question becomes whether the currently Bullish technical profile can persist long enough to pull up the monthly and yearly ranks—or whether the longer-horizon weakness eventually pulls down the shorter horizons.
2) Price & trend overview
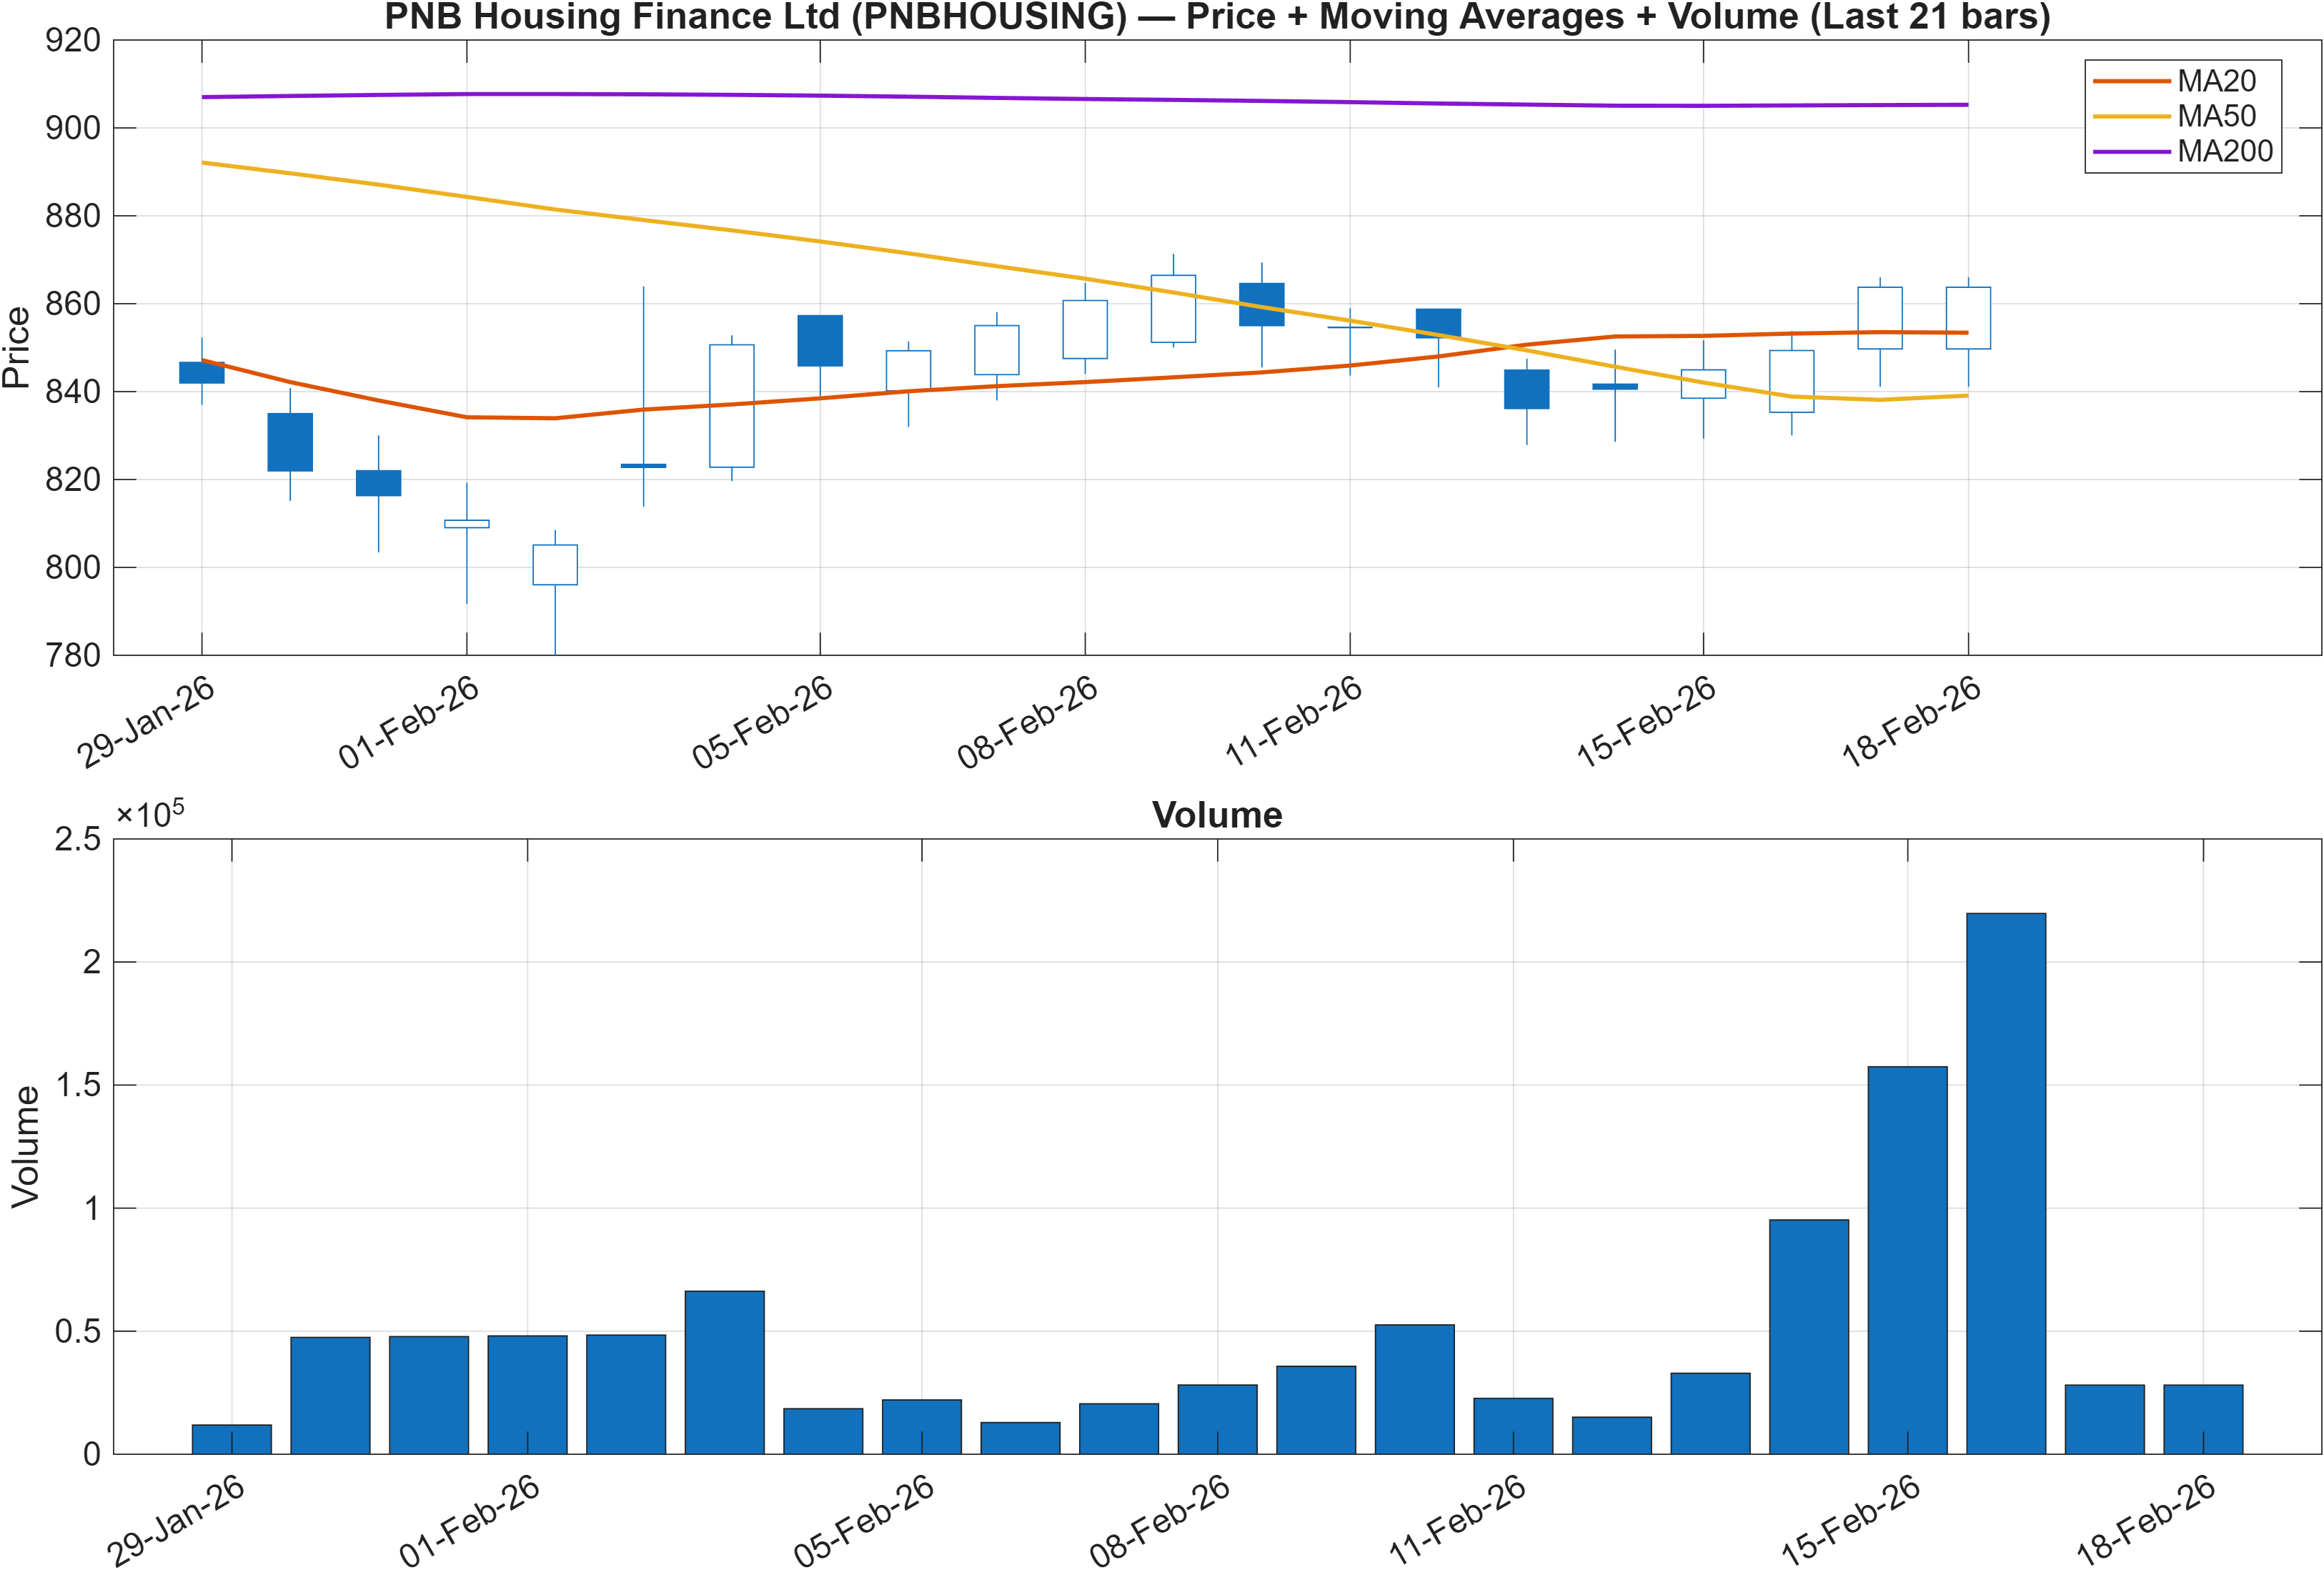
The trend read is explicitly framed through two moving-average relationships: Close vs MA50 = Bullish, while MA50 vs MA200 = Bearish. That combination typically characterizes an instrument attempting to improve tactically while still operating under a longer-horizon trend constraint. In other words, the shorter moving-average relationship supports a constructive near-term tone, but the slower MA structure suggests the broader trend regime has not fully rotated.
This split aligns with the rank ladder: Daily rank #731 and Weekly rank #772 are Neutral rather than Bearish, while the Monthly rank #1065 and Yearly rank #974 remain Bearish. When price is above or improving versus MA50 yet MA50 remains below MA200, the market often behaves in range-to-recovery fashion—where rallies can develop, but they tend to be more sensitive to key structure zones and volume confirmation.
From a market-structure perspective, the key is whether price can sustain strength without mean-reverting back through shorter averages, especially as it approaches the defined resistance area at 1008.6750. The closer price is to a major decision level, the more relevant volume and breadth-style measures become; this is consistent with the later technical dashboard where multiple accumulation/flow proxies print Bullish.
The takeaway is a two-speed trend profile: tactical improvement (Close vs MA50 Bullish) against a still-repairing longer baseline (MA50 vs MA200 Bearish). That tends to favor a more conditional framework: strength is respected while level-based invalidation (notably 809.8750) remains the controlling risk reference.
3) Momentum & volatility dashboard
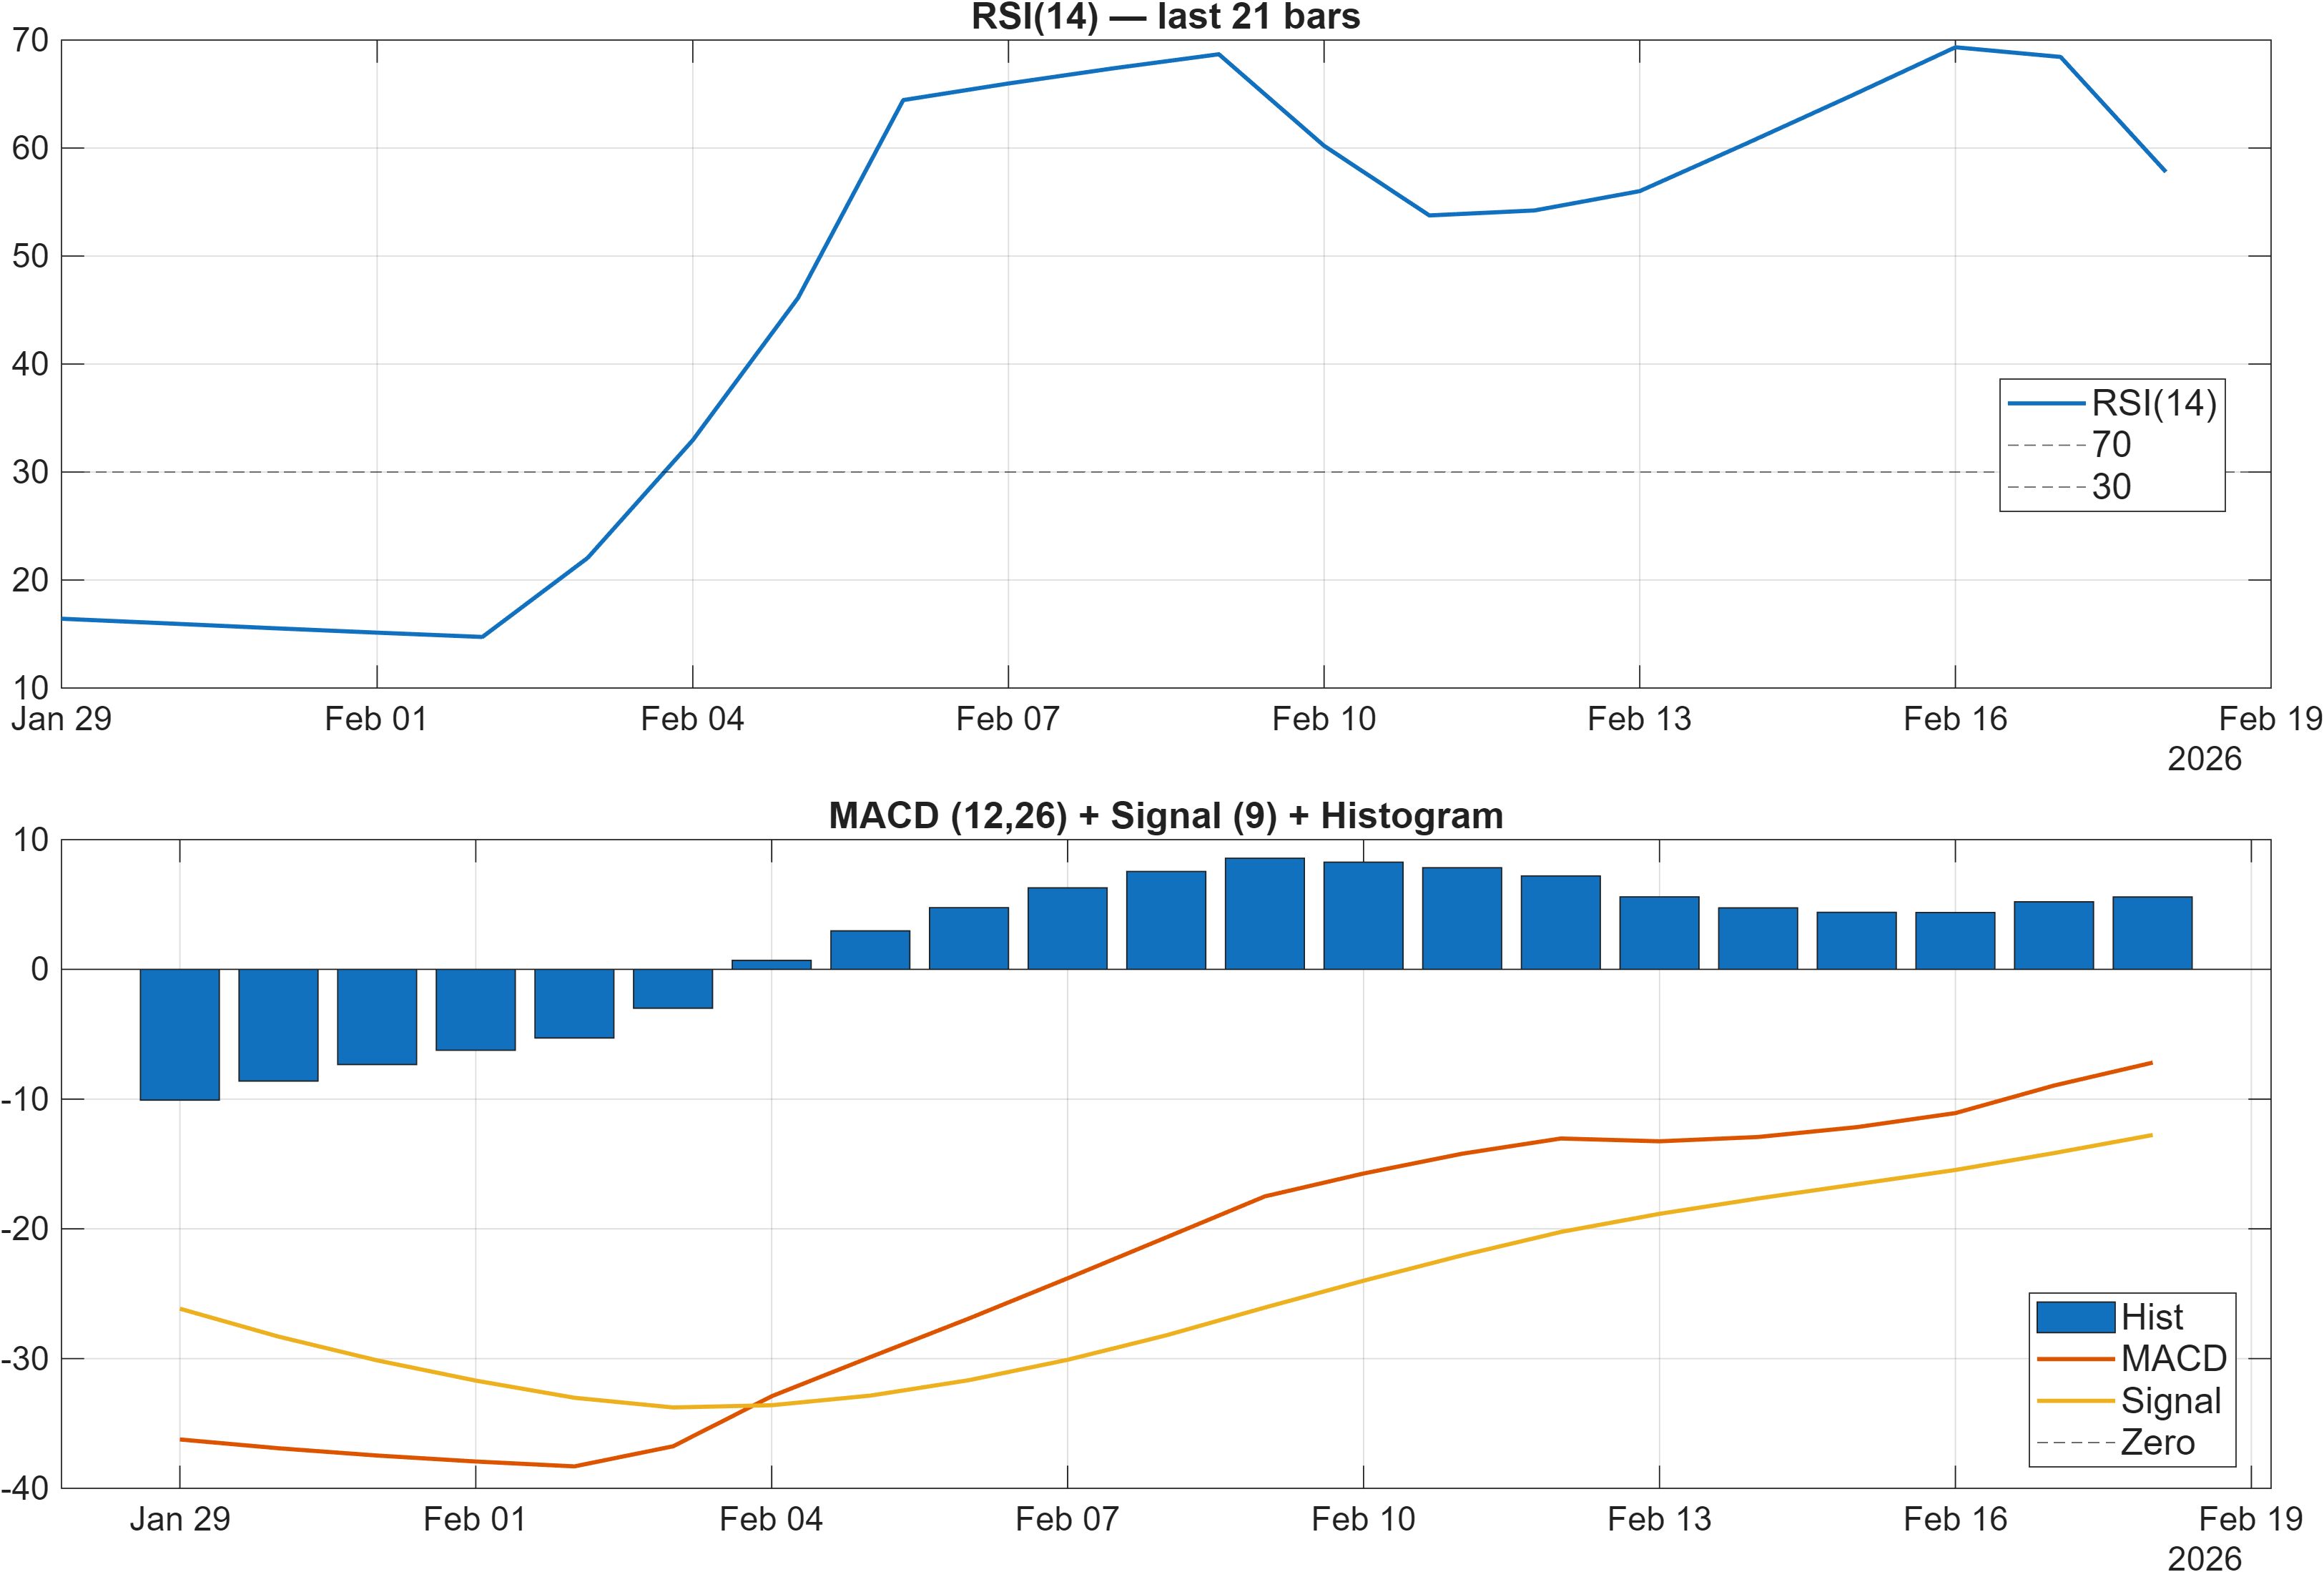
Momentum signals are constructive but not extreme. RSI bias is stated as Neutral, and the signal table shows RSI(14) at 57.79 with a Bullish designation—consistent with a market that has moved away from oversold conditions but is not in a stretched regime. In parallel, the MACD histogram is positive (5.5786 in the interpretation; 5.579 in the table), supporting the view that upside momentum currently dominates on the measured horizon.
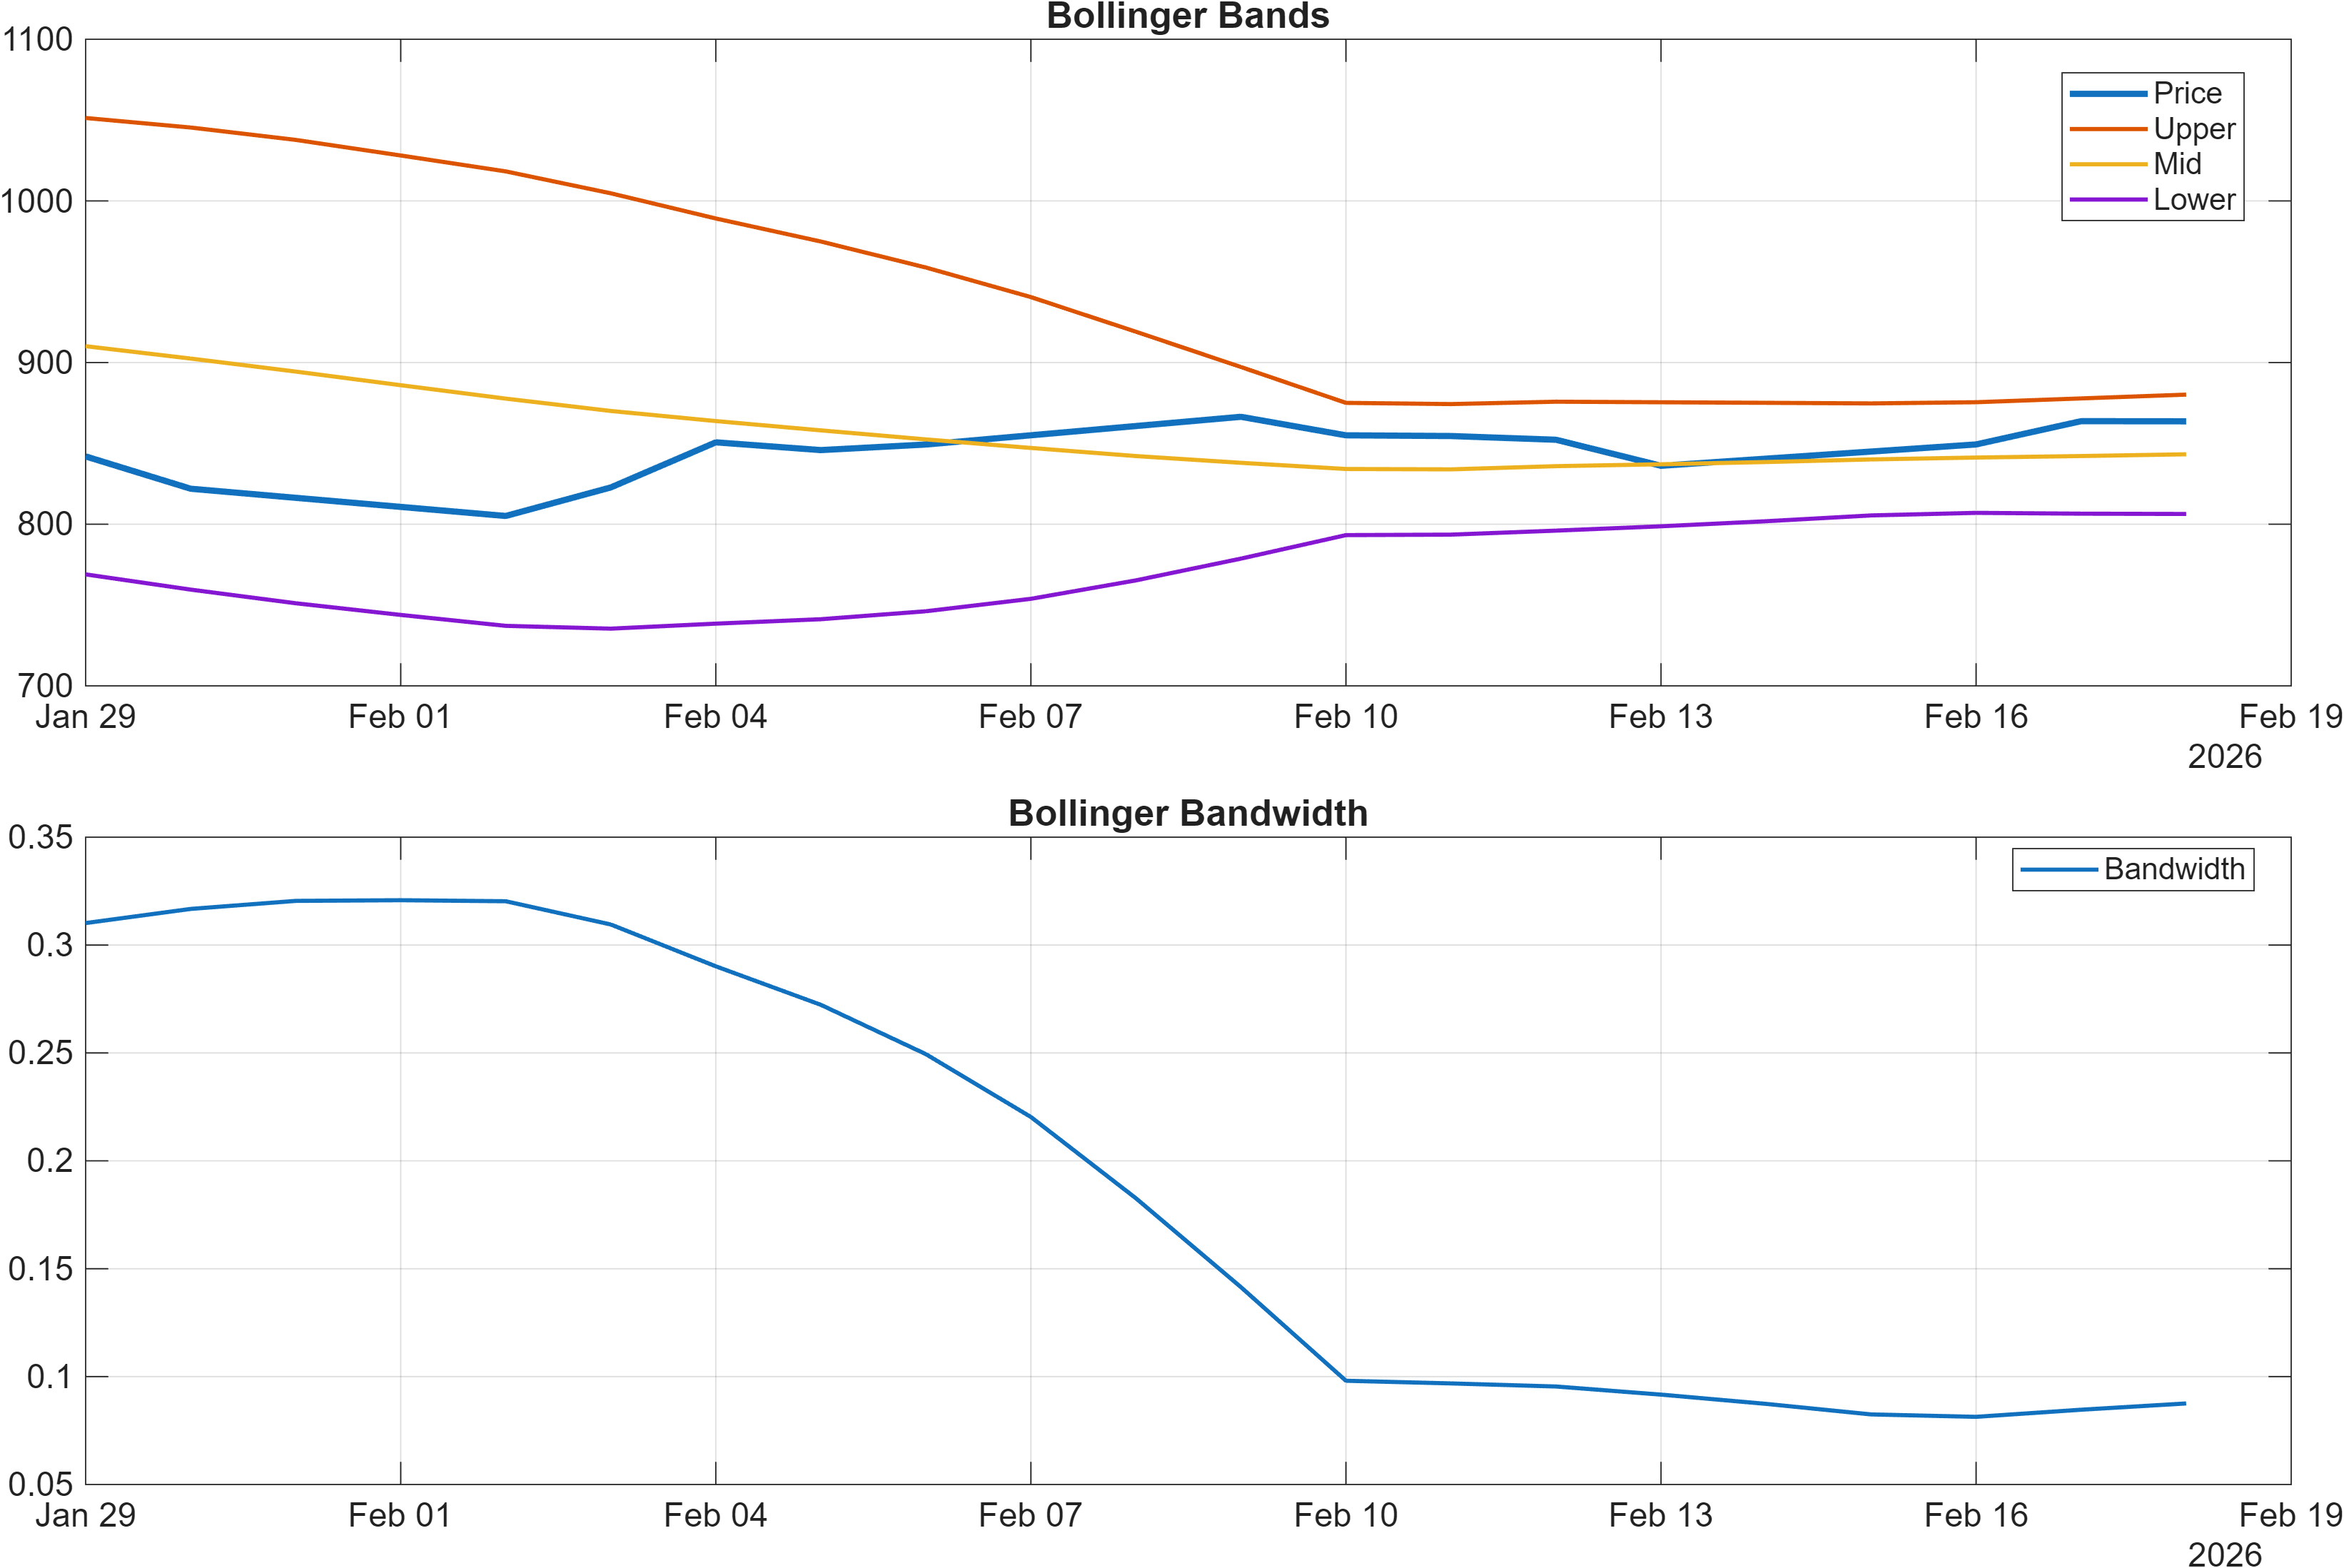
Volatility conditions appear contained. Bollinger Bandwidth (volatility regime) is 0.0876 (and BB Width is 0.08756 in the signal table), marked Neutral. A neutral bandwidth reading often indicates neither a breakout volatility expansion nor a high-compression squeeze is dominant at present, which can lead price action to respect established structure levels more cleanly.
A nuanced point is the combination of positive momentum with non-expanding volatility: momentum can persist in a controlled volatility regime, but transitions can be abrupt when volatility starts to expand—especially near large resistance zones such as 1008.6750. This makes the next volatility impulse (expansion vs continued containment) a practical confirmation layer on top of the momentum signals.
4) Support / Resistance zones
Support ~ 809.8750 | Resistance ~ 1008.6750
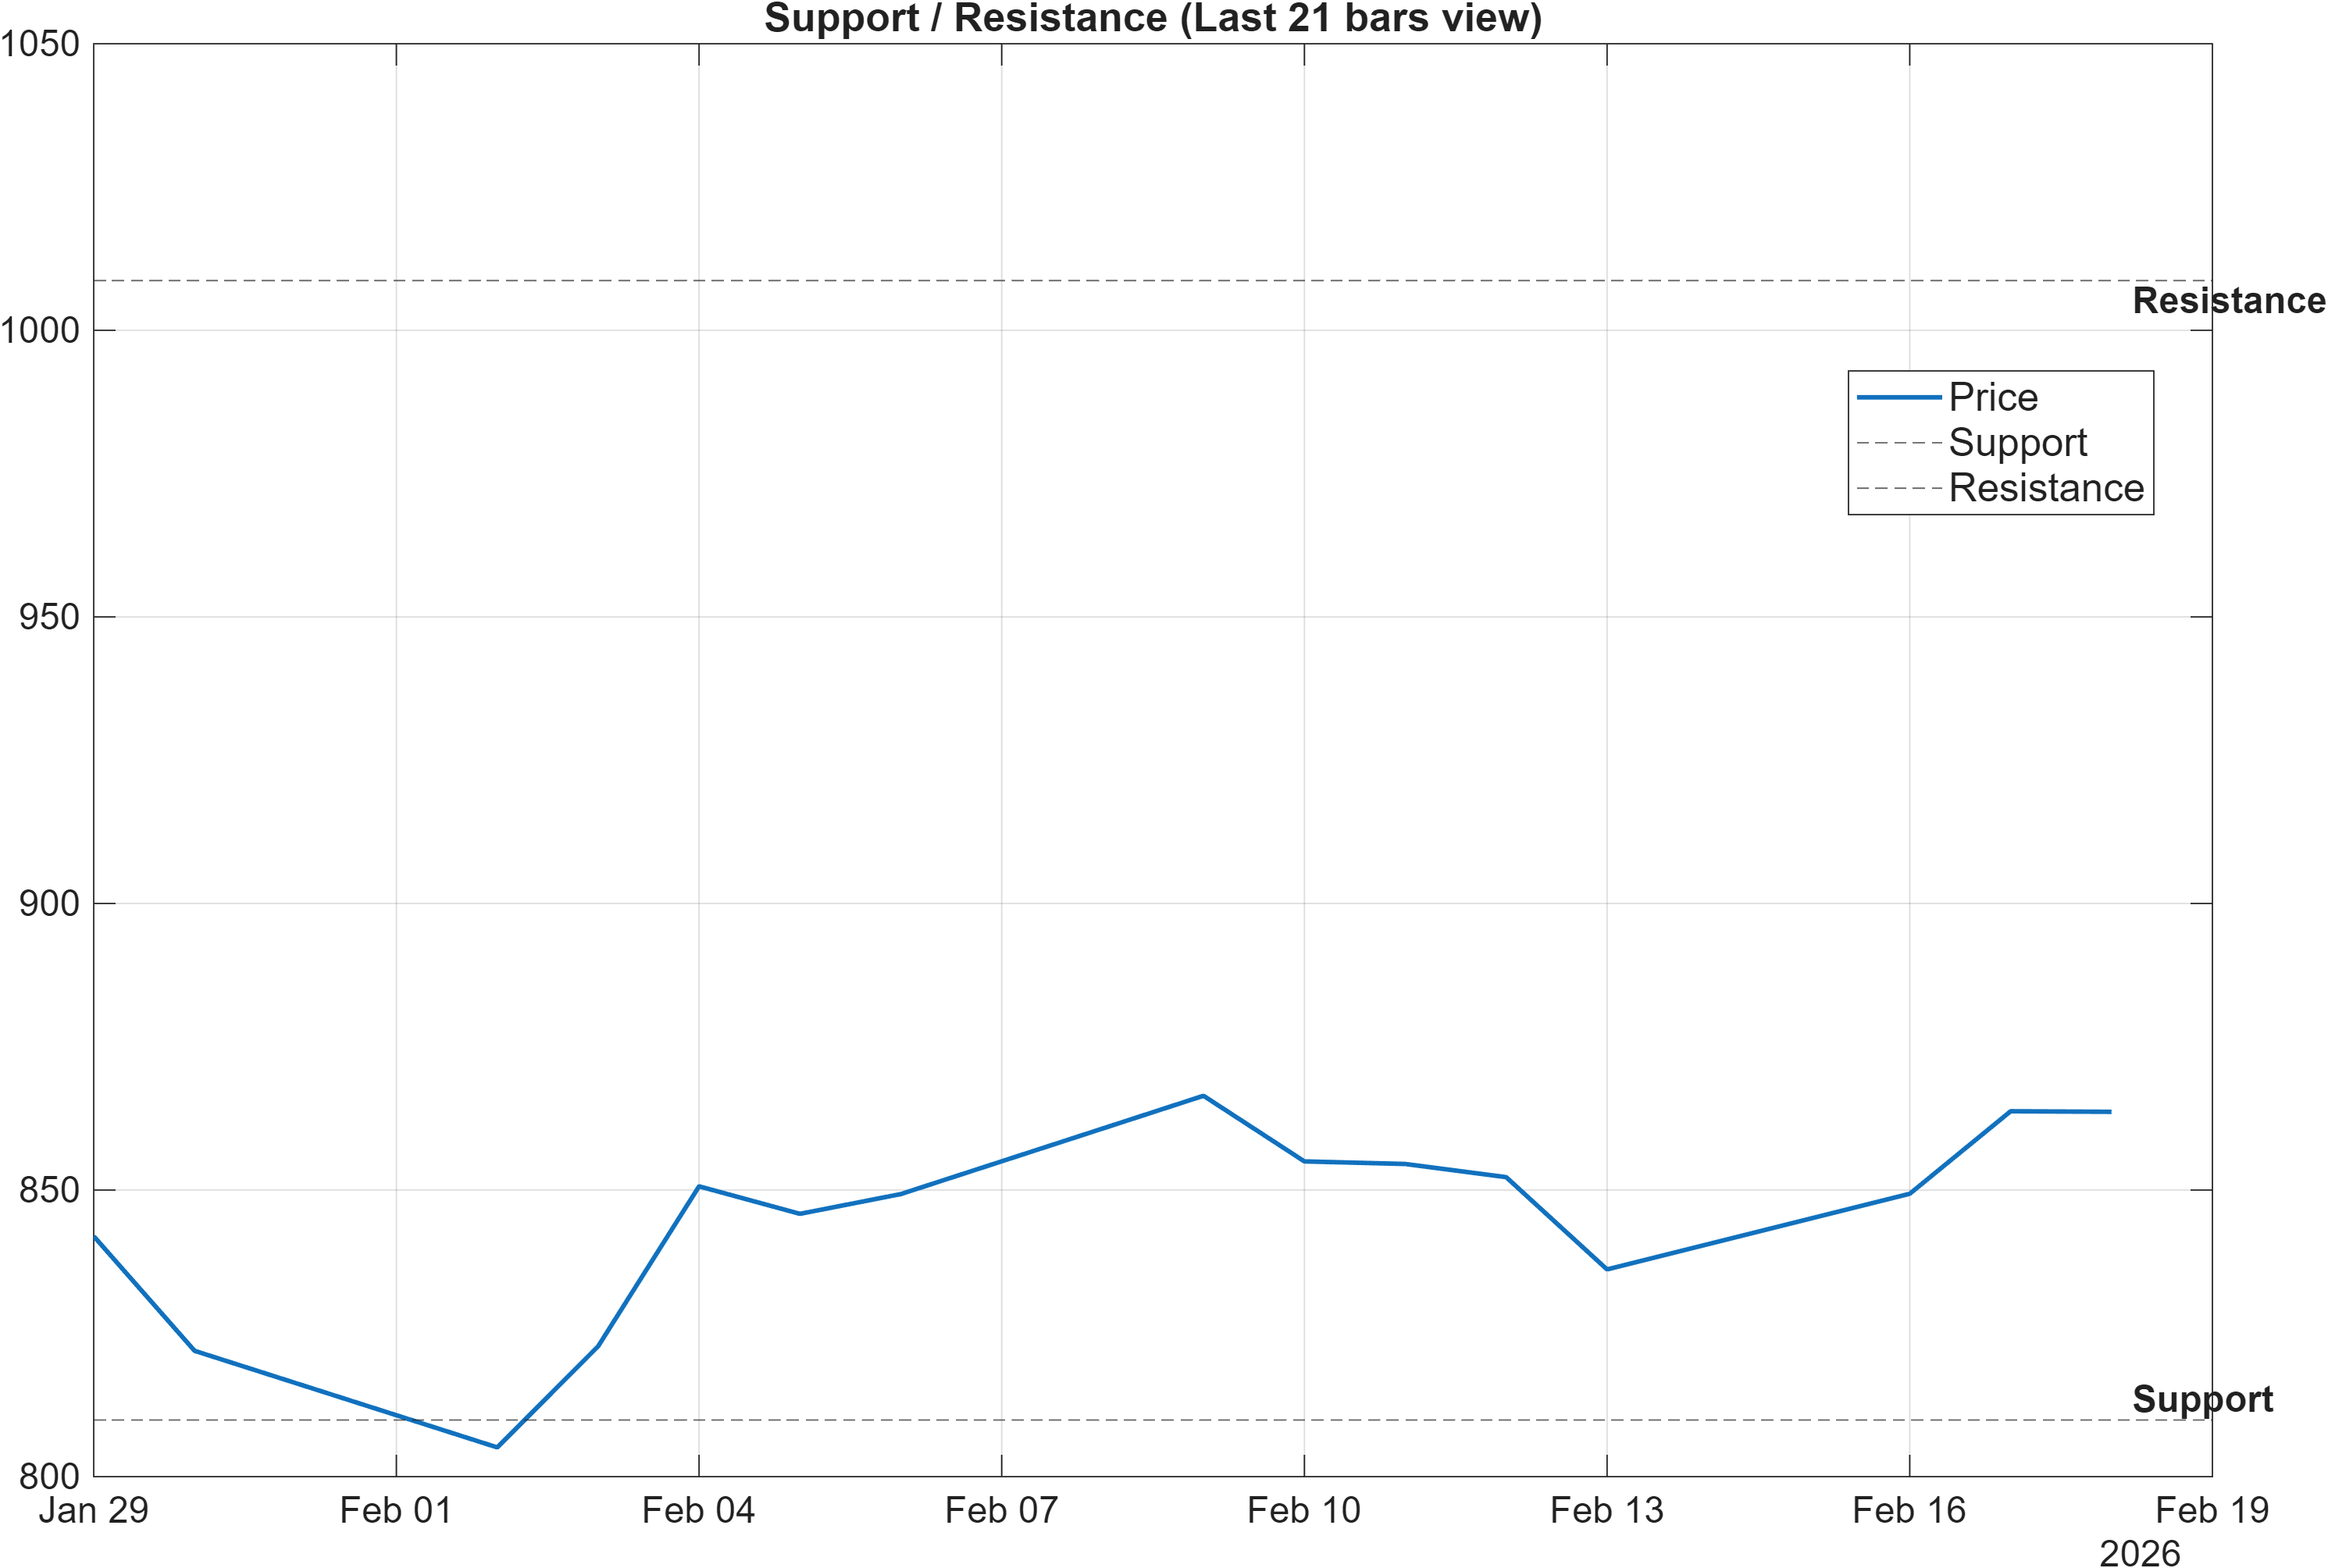
The chart-defined structure places PNBHOUSING inside a clear decision corridor: 809.8750 as the primary downside reference and 1008.6750 as the primary upside constraint. With the moving-average state split (Close vs MA50 Bullish; MA50 vs MA200 Bearish), these horizontal zones become more important than trend extrapolation—price acceptance or rejection around them can decide whether the tactical trend improvement translates into a broader regime change.
The scenario language is explicit: break above resistance with volume → continuation; close below support → signal deterioration risk. This maps well to the technical dashboard, which shows multiple participation/flow measures as Bullish (e.g., ADOSC 78.21, OBV slope(10) 4.13e+05, AD Line slope(10) 2.766e+05). If price tests resistance, strength in those flow measures can help distinguish a simple test from a more durable acceptance.
Conversely, a breakdown below 809.8750 would not just violate a level; it would challenge the current Bullish technical blend (Overall Technical Score 0.591) and could reinforce the already Bearish longer-window ranks (Monthly #1065; Yearly #974). In that outcome, the “mixed” rank stack would likely resolve to the downside through rank deterioration in the daily/weekly windows.
Structurally, the cleanest read comes from how price behaves around these two numbers, particularly if volatility (Bandwidth 0.0876) begins to expand: volatility expansion through resistance typically carries different implications than expansion through support.
5) Quant Technical Dashboard (18 Signals)
KGNAI AI Technical Analysis Score (Deep Reinforcement Learning): Rank #199 out of 1214 (Rank 1 represents the strongest technical positioning and a higher probability of favorable price behavior. As ranks increase toward the maximum, the probability of favorable outcomes weakens and bearish positioning becomes more dominant.) | Label: Bullish | Score: 0.672
18-Signal Technical Confluence Score: 0.556 (Bullish)
Overall Technical Score (18-signal confluence + DRL rank blend): 0.591 (Bullish)
Note: The blended score reflects signal strength weighted against broader AI technical ranking, which may temporarily diverge.
Blended technical score breakdown: 0.591 (Bullish | Bull 12 / Bear 2 / Neutral 4)
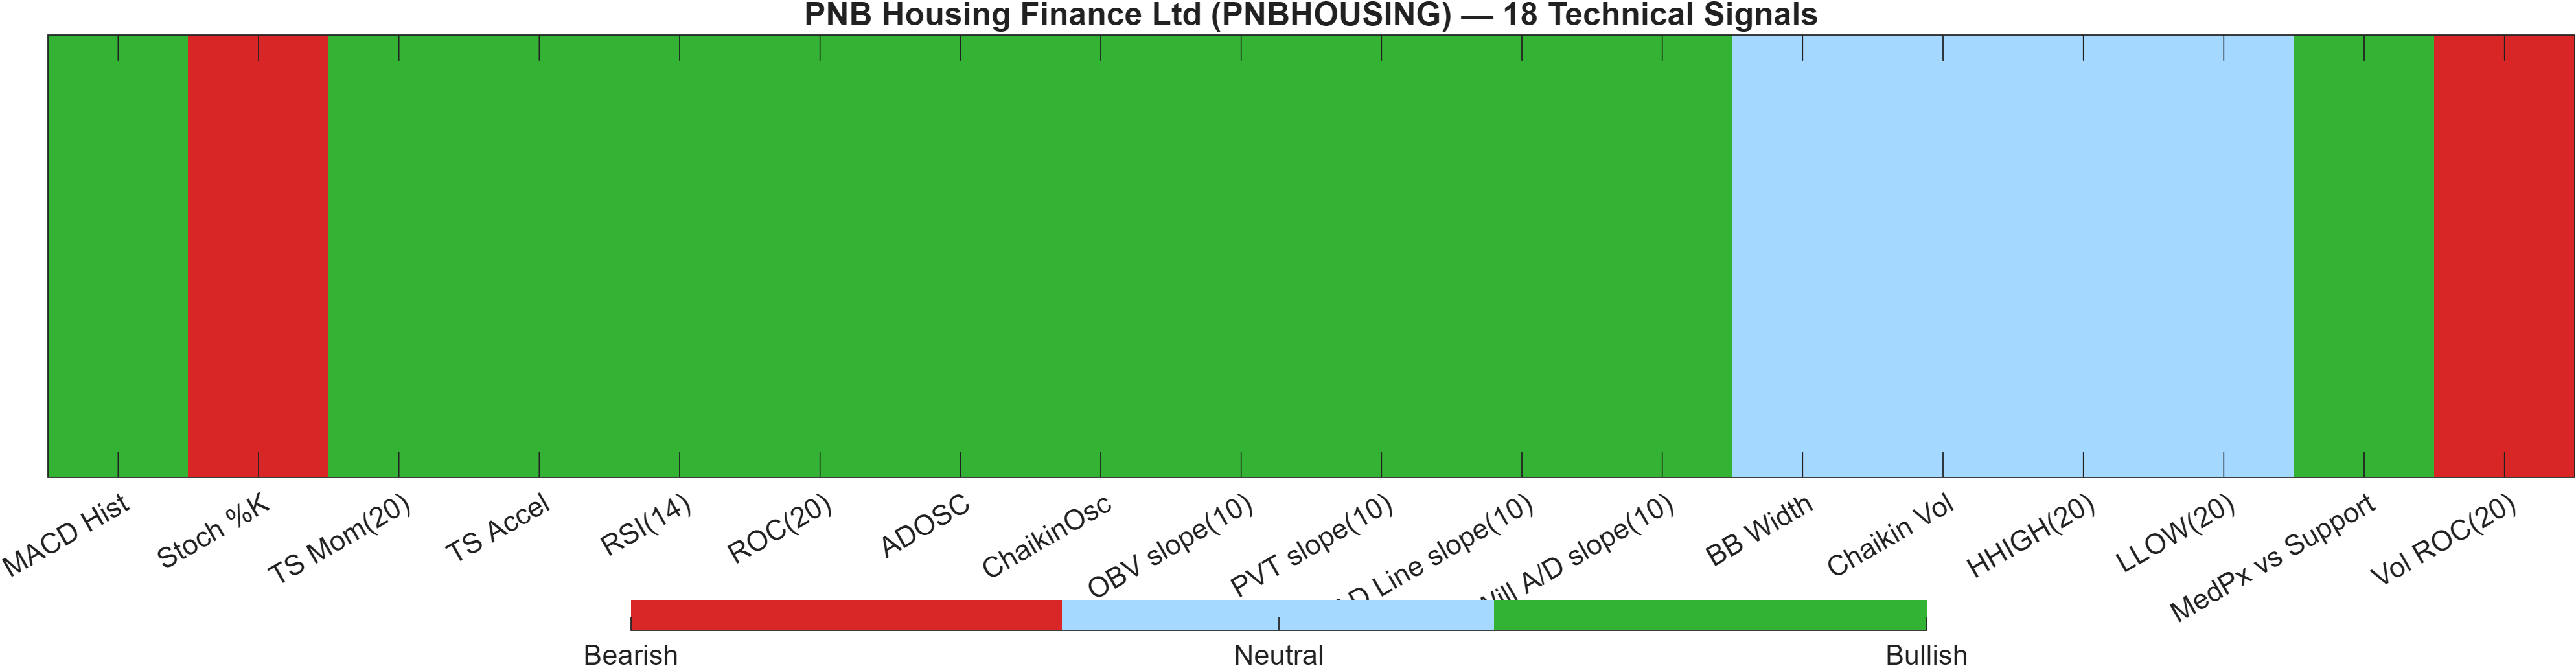
The quantitative technical layer is unambiguously constructive on the provided scoring framework. The Deep Reinforcement Learning technical rank is #199 (score 0.672), and the 18-signal confluence registers 0.556 (Bullish), producing an Overall Technical Score of 0.591 (Bullish). The internal breadth is favorable: Bull 12 / Bear 2 / Neutral 4, indicating that the Bullish label is not dependent on a single indicator.
The signal-level detail suggests a momentum-and-participation tilt. MACD histogram is Bullish (5.579), RSI(14) is Bullish (57.79), and rate-of-change is positive (ROC(20) 5.073). Flow/volume-adjacent measures are also largely Bullish, including ADOSC (78.21) and PVT slope(10) (1814), which is consistent with the title-level framing that demand is currently outweighing supply pressure.
The main internal caution flag is not widespread bearishness but selective tension in fast oscillators and volume change: Stoch %K is Bearish at 82.53 and Vol ROC(20) is Bearish at -40.83. That combination can occur when price momentum is firm but incremental participation is not accelerating in step—often relevant when approaching large resistance such as 1008.6750.
Overall, the technical complex reads like a market with positive momentum and supportive participation metrics, while still needing level-based confirmation to overcome the longer-horizon constraints embedded in the Monthly (#1065) and Yearly (#974) ranks.
Signal table (Bull/Bear/Neutral)
| Indicator | Value | Signal |
|---|---|---|
| MACD Hist | 5.579 | Bullish |
| Stoch %K | 82.53 | Bearish |
| TS Mom(20) | 41.8 | Bullish |
| TS Accel | 197.1 | Bullish |
| RSI(14) | 57.79 | Bullish |
| ROC(20) | 5.073 | Bullish |
| ADOSC | 78.21 | Bullish |
| ChaikinOsc | 1.082e+05 | Bullish |
| OBV slope(10) | 4.13e+05 | Bullish |
| PVT slope(10) | 1814 | Bullish |
| AD Line slope(10) | 2.766e+05 | Bullish |
| Will A/D slope(10) | 44.55 | Bullish |
| BB Width | 0.08756 | Neutral |
| Chaikin Vol | -6.668 | Neutral |
| HHIGH(20) | 871.4 | Neutral |
| LLOW(20) | 780 | Neutral |
| MedPx vs Support | 43.67 | Bullish |
| Vol ROC(20) | -40.83 | Bearish |
Interpretation: Indicator-level signals form the base confluence, which is then adjusted using a separate AI-driven technical ranking model. The final technical score summarizes this combined view.
6) News sentiment + extractive gist
Sentiment score (avg): 0.000 | Positive: 0% | Neutral: 100% | Negative: 0%
KGNAI AI News Sentiment Score (normalized -1 to +1): 0.81 (as of 2026-02-10) | Label: Bullish | Overall news score: 0.67
Positive Developments
Recent coverage across major financial outlets is largely informational, but the scoring framework still flags a constructive tilt via the normalized sentiment reading of 0.81 (Bullish) and an overall news score of 0.67. In the provided items, the dominant theme is corporate communication around an analysts/institutional investor meet schedule, which can function as a transparency and engagement signal rather than a catalyst by itself. This tone tends to be supportive when technical conditions are already improving—such as the Bullish technical blend (Overall Technical Score 0.591) and the DRL technical rank at #199—because it reduces the probability of narrative shocks. With the sentiment distribution showing 0% Negative and 100% Neutral, the “positive” framing here is less about excitement and more about a lack of adverse narrative pressure while the chart works through resistance formation near 1008.6750.
Neutral / Mixed Developments
The sentiment distribution is explicitly Neutral-heavy: average sentiment score 0.000, with Neutral: 100%. That mix points to a market narrative that is not currently pushing investors toward either aggressive risk-on positioning or risk-off de-risking based on news flow alone. In this context, price structure and indicator behavior usually take precedence—particularly the level map (809.8750 support; 1008.6750 resistance) and the momentum/volatility regime (MACD histogram 5.5786; Bandwidth 0.0876). Neutral news conditions often coincide with more technical, level-driven trading where confirmation is drawn from volume behavior and follow-through rather than from discrete headlines.
Negative / Risk Signals
No explicitly negative items are reflected in the distribution (Negative 0%), but risk management still matters because the longer-horizon rank regime remains soft (Monthly rank #1065; Yearly rank #974). When the macro narrative is quiet and sentiment is neutral, downside risk can emerge more from technical invalidations than from news shocks. The primary risk signal to respect is structural: a close below 809.8750 would challenge the current Bullish technical posture and can reinforce the existing Bearish longer-window ranks. Secondary risk is a momentum fade into resistance—especially if participation does not confirm, consistent with the Bearish Vol ROC(20) -40.83 reading in the signal set.
- Price behavior and volume response on approaches to 1008.6750 resistance
- Whether volatility remains contained (Bandwidth 0.0876) or starts to expand around key levels
- Any sustained shift in rank posture, especially the Monthly rank currently at #1065
Sources referenced: Reuters, Bloomberg, Yahoo Finance, MarketWatch, Investing.com
Snapshot: AI Rank (Short–Mid–Long): Mixed (Bearish tilt) (Neutral–Bearish–Bearish) · Technical Confluence: Bullish · Key Levels: Support ~809.88 | Resistance ~1008.67 · News Sentiment: Neutral
7) Sources
- PNB Housing Finance Limited — https://nsearchives.nseindia.com/corporate/PNBHOUSING_18022026164534_PNB_Housing_Intimation_on_meeting_with_Investors.pdf
You may also like: How KGNAI AI ranks instruments across global markets
Disclaimer: KGNAI provides AI-generated analytics and educational market commentary only. This is not financial advice. Markets involve risk. Always do your own research.