
ROTO (ROTO PUMPS LTD.) — 22-Feb-2026 Quant Signal Review with a Neutral Near-Term Stance
ROTO PUMPS LTD. (ROTO) screens as a mixed-profile setup in the KGNAI framework as of 22-Feb-2026: longer-horizon ranks remain constructive while near-term positioning looks constrained by trend structure and breadth-style volume measures. Across 1213 ranked instruments in India, the 6-Monthly rank (#26) and Yearly rank (#132) sit in stronger relative territory, yet the Daily rank (#920) and Weekly rank (#769) point to weaker short-run probability characteristics. On the technical layer, the blended view stays Neutral with an Overall Technical Score of -0.227 and a confluence score of -0.111, reflecting a fairly balanced distribution of bull/bear signals rather than a dominant regime. Key decision zones are well-defined at Support ~56.4100 and Resistance ~71.1100, while momentum gauges show neutral-to-soft readings (RSI bias Neutral; MACD histogram -0.3182) and a moderate volatility regime (Bollinger Bandwidth 0.1412).
- Rank stance: Short-term Neutral | Mid-term Neutral | Long-term Bullish
- Technical confluence: Neutral (Overall Technical Score -0.227)
- Key levels: Support 56.4100 | Resistance 71.1100
- News sentiment bias: Slightly positive-to-neutral (avg 0.121; Neutral 56%)
- Confirmation / invalidation: A break above 71.1100 with volume would support continuation, while a close below 56.4100 increases deterioration risk.
KGNAI evaluates assets using large cross-sectional datasets built from millions of structured data points. Inputs incorporate fundamental metrics, technical structures, and systematically processed news sentiment. Statistical models, machine learning, and AI frameworks are used to assess relative positioning, signal alignment, and probabilistic behavior across broad universes.
- Ranks are comparative across the tracked universe, not absolute price targets.
- Confluence reflects alignment among independent signal groups.
- Support/resistance levels are probabilistic decision zones, not guarantees.
- Sentiment provides contextual bias within the broader analytical framework.
1) KGNAI AI Analysis
Region: INDIA
Total universe size: 1213 ranked instruments
- Daily rank: #920 out of 1213 — Neutral
- Weekly rank: #769 out of 1213 — Neutral
- Monthly rank: #375 out of 1213 — Neutral
- 3-Monthly rank: #502 out of 1213 — Neutral
- 6-Monthly rank: #26 out of 1213 — Bullish
- Yearly rank: #132 out of 1213 — Bullish
Cross-horizon positioning: long-term strength vs short-term drag
The ranking stack shows a regime split: ROTO’s longer windows screen in stronger relative cohorts while the shorter windows lag. The 6-Monthly rank (#26) places it in the top tier of the 1213-instrument universe, and the Yearly rank (#132) remains within an upper range consistent with longer-horizon support. By contrast, the Daily rank (#920) and Weekly rank (#769) sit in the weaker half of the distribution, suggesting short-term probability characteristics are not currently aligned with the stronger long-term backdrop.
This configuration often corresponds to a market that is working through consolidation or mean-reversion pressure after a prior longer-duration move, rather than showing synchronized strength across timeframes. The middle ranks (Monthly #375 and 3-Monthly #502) reinforce that interpretation: they do not confirm a clean directional impulse, but neither do they fully negate the longer-term edge implied by the 6–12 month windows.
Operationally within this framework, the term view is explicitly Short-term: Neutral; Mid-term: Neutral; Long-term: Bullish. That mix argues for emphasizing confirmation from price structure and indicator alignment before treating the longer-horizon ranks as dominant, particularly given that the near-term ranks are comparatively elevated.
2) Price & trend overview
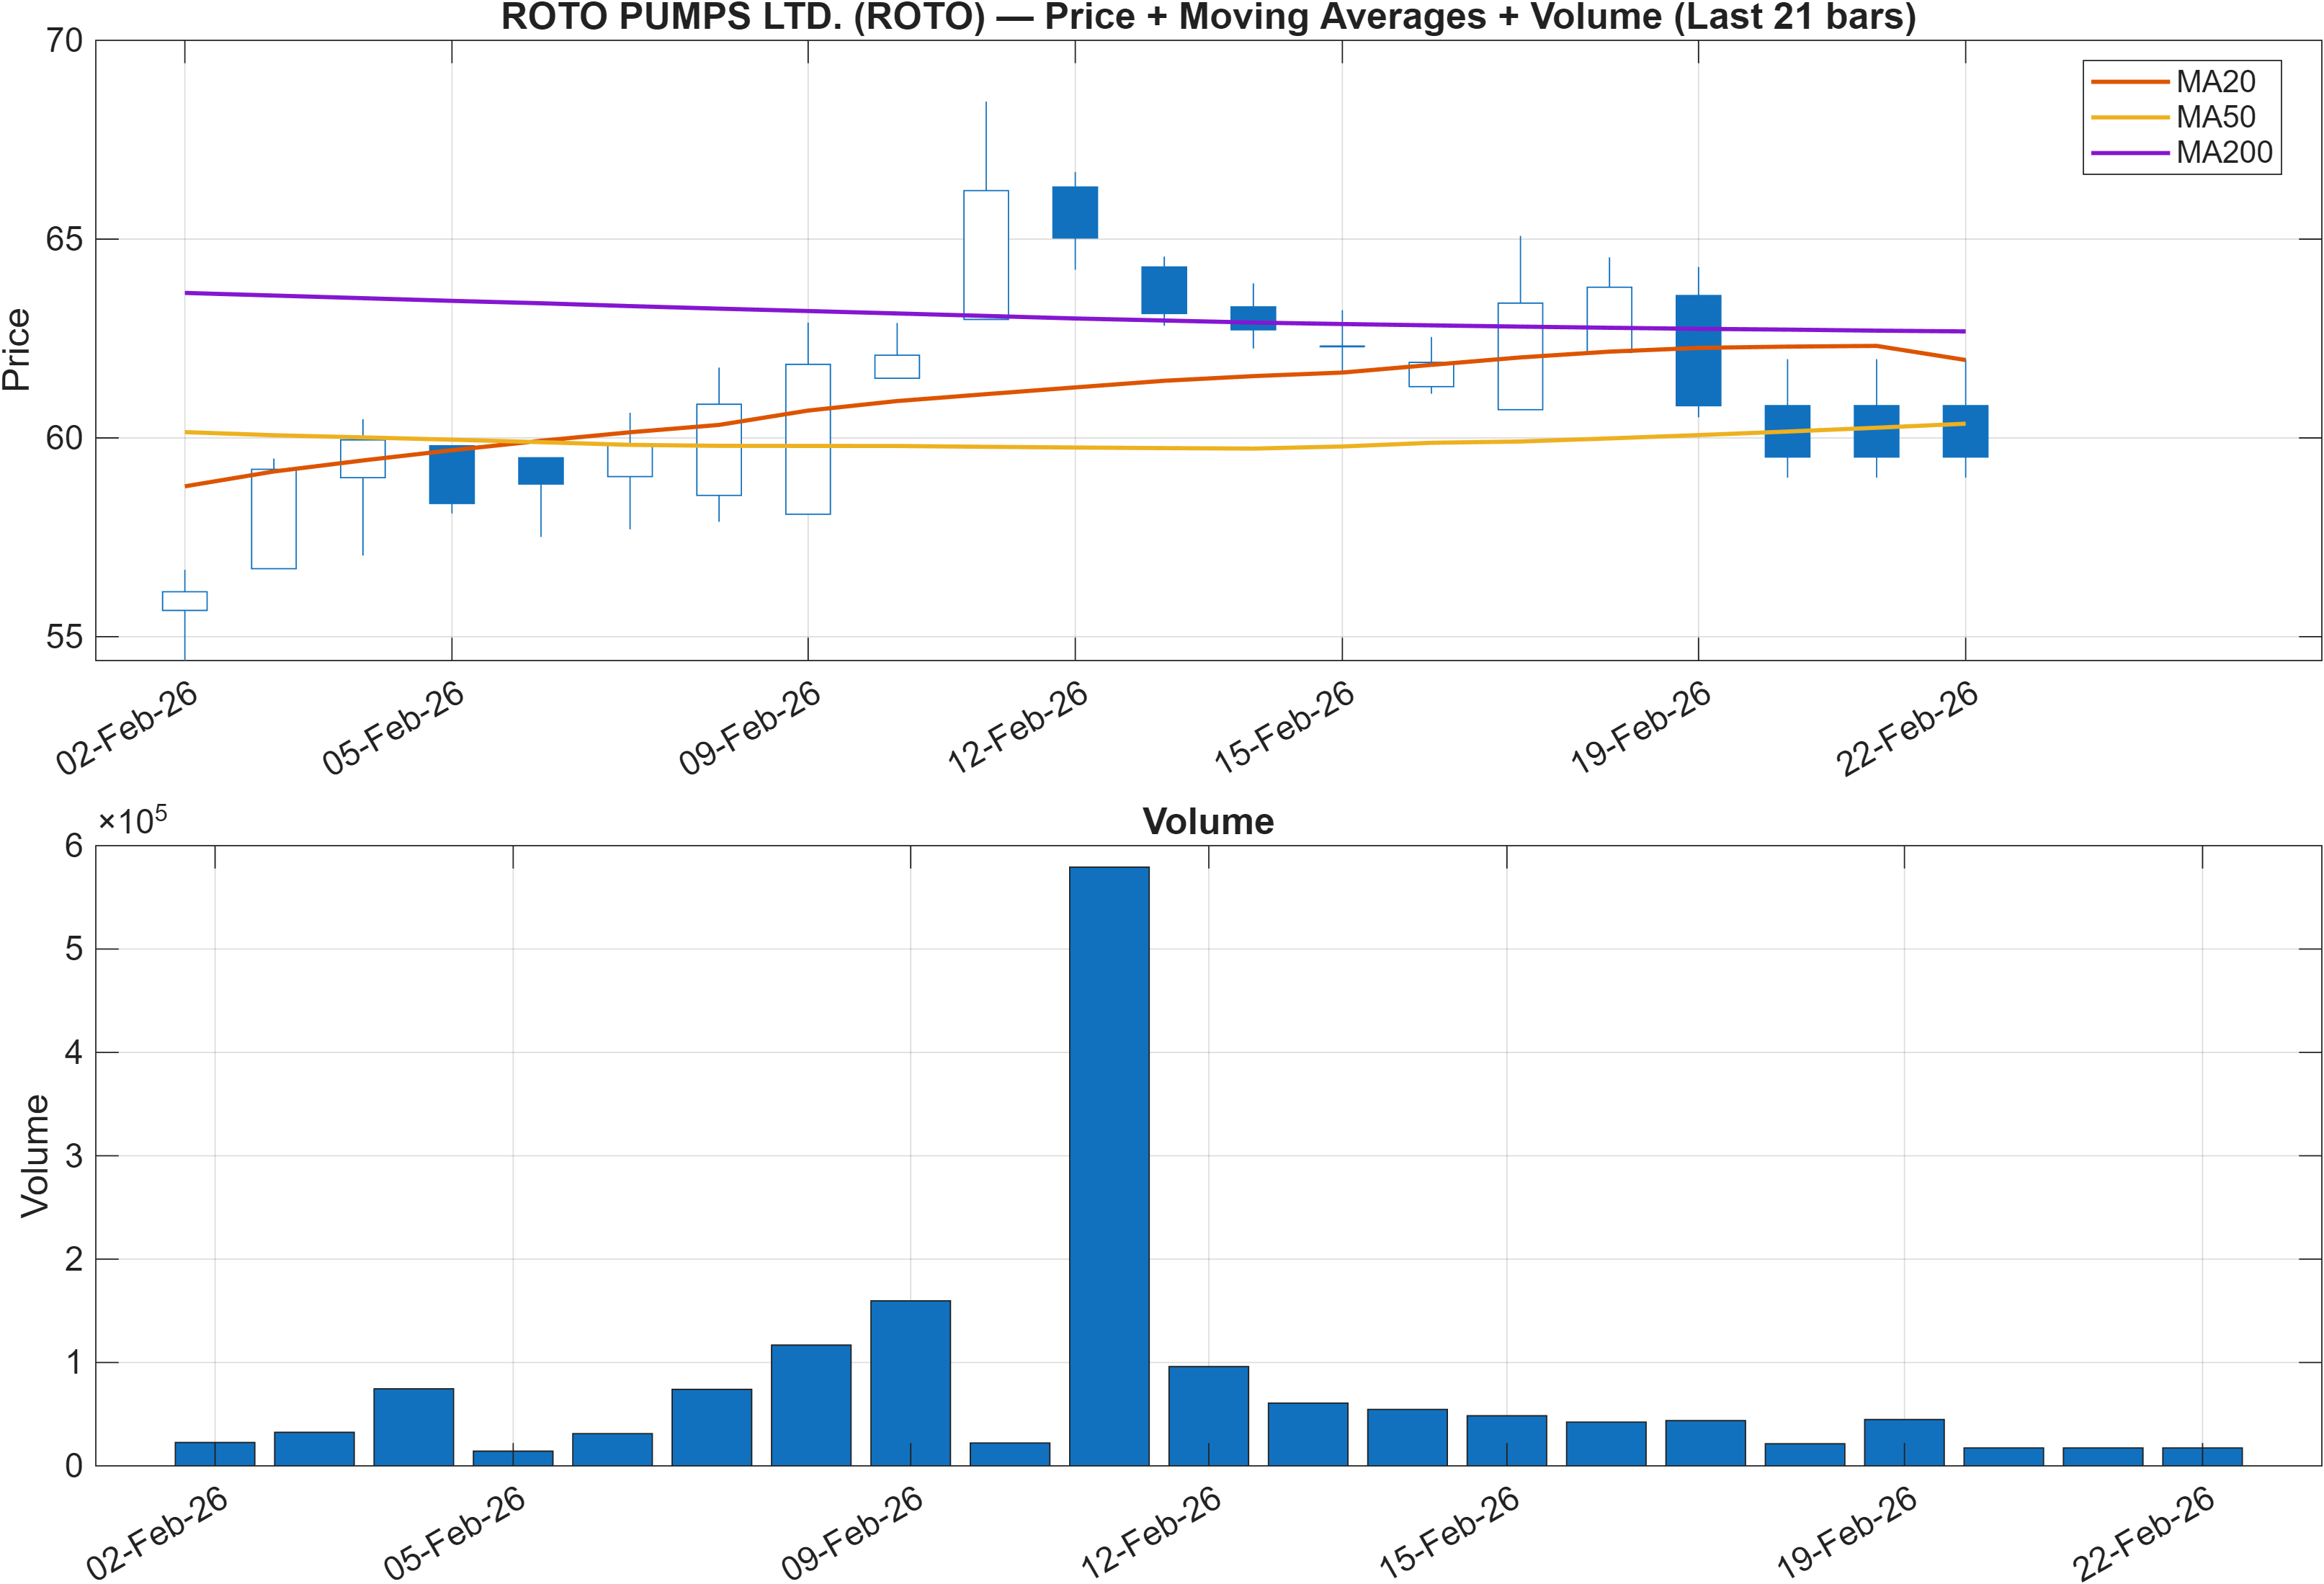
Moving-average structure: trend headwinds remain in place
The trend read is unambiguous at the moving-average layer: Close vs MA50 = Bearish and MA50 vs MA200 = Bearish. This combination typically reflects a market trading below its intermediate trend while the intermediate trend itself is below the longer trend—an arrangement consistent with a downtrend or a prolonged repair phase rather than a fully re-accelerating advance.
The key analytical tension is that this bearish MA structure is occurring alongside longer-horizon KGNAI ranks that are relatively strong (notably the 6-Monthly #26). When ranks and trend structure diverge, the framework treats price as the arbiter: until the market can reclaim and sustain behavior consistent with MA repair, the longer-term ranking advantage can remain latent.
Volume behavior matters here because breaks from moving-average compression tend to be more reliable when accompanied by participation. In this report, that participation question reappears later in the signal table via Vol ROC(20) at -46.59 (Bearish), which is directionally consistent with the idea that near-term trend repair may be occurring without strong volume expansion.
From a pure structure perspective, the nearest actionable boundaries are already defined in the level model: 56.4100 as support and 71.1100 as resistance. How price behaves around those zones provides the most direct check on whether the bearish MA stack is transitioning toward stabilization or persistence.
3) Momentum & volatility dashboard
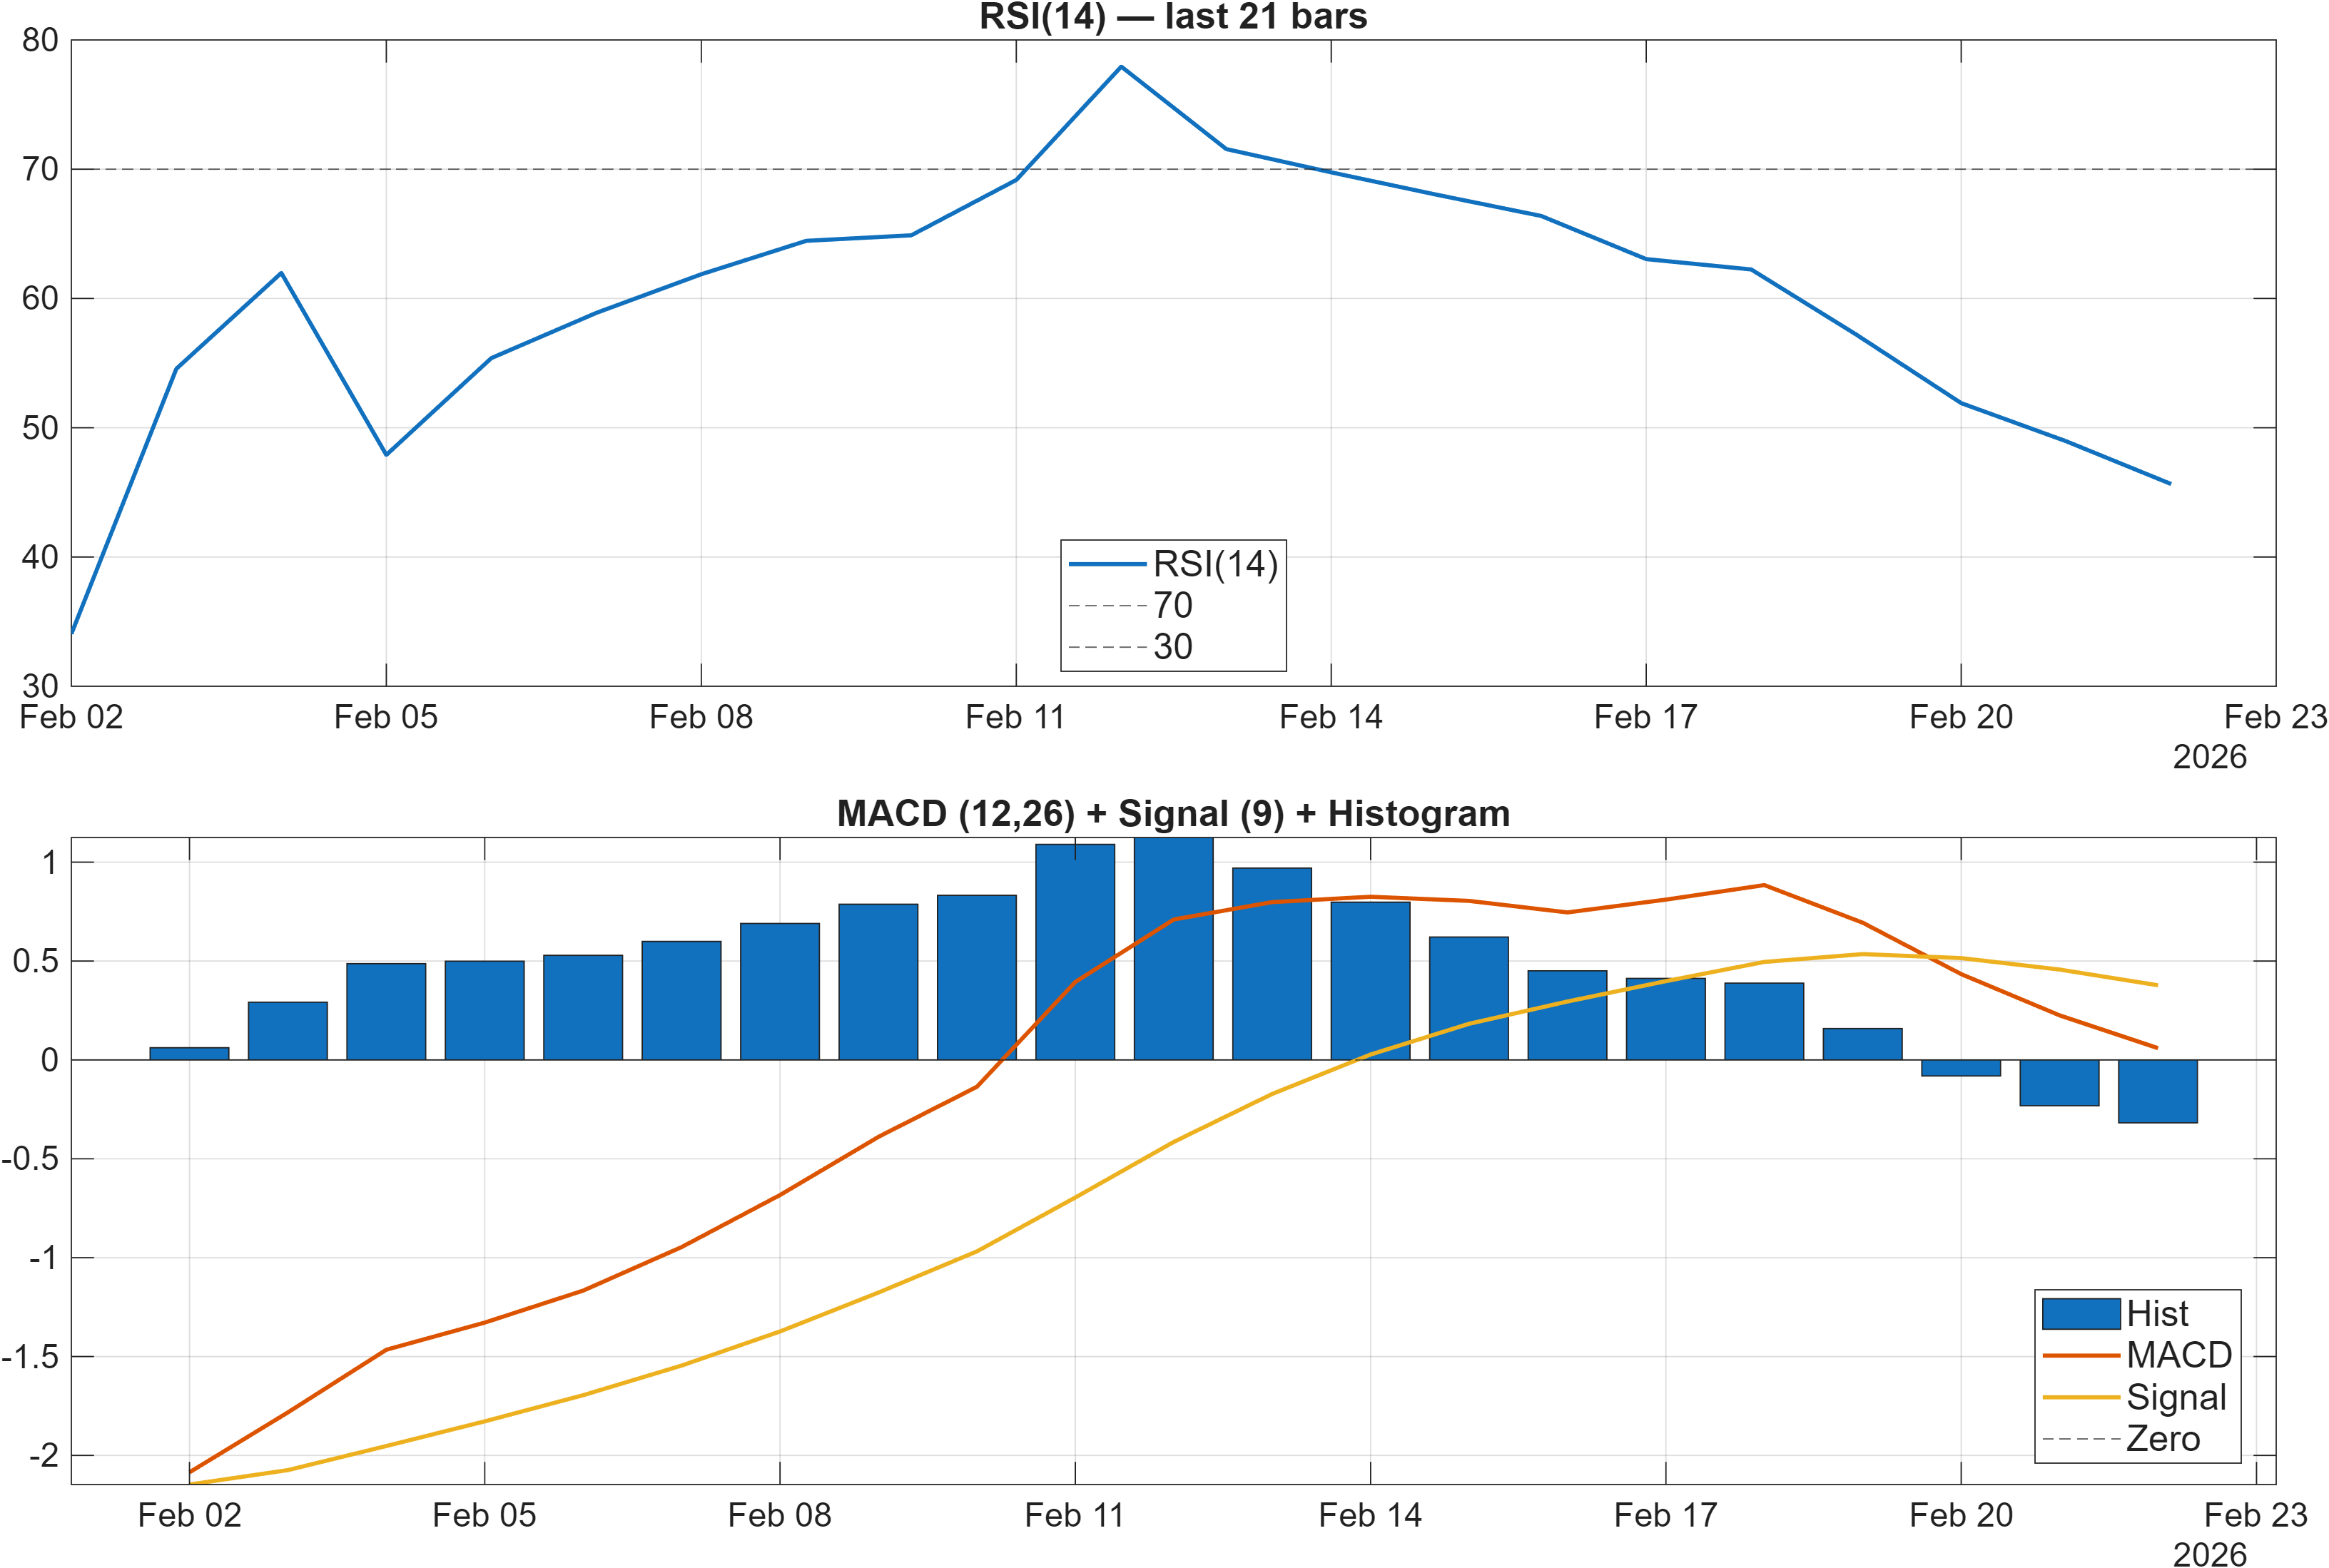
Interpretation: RSI bias = Neutral, MACD hist = -0.3182.
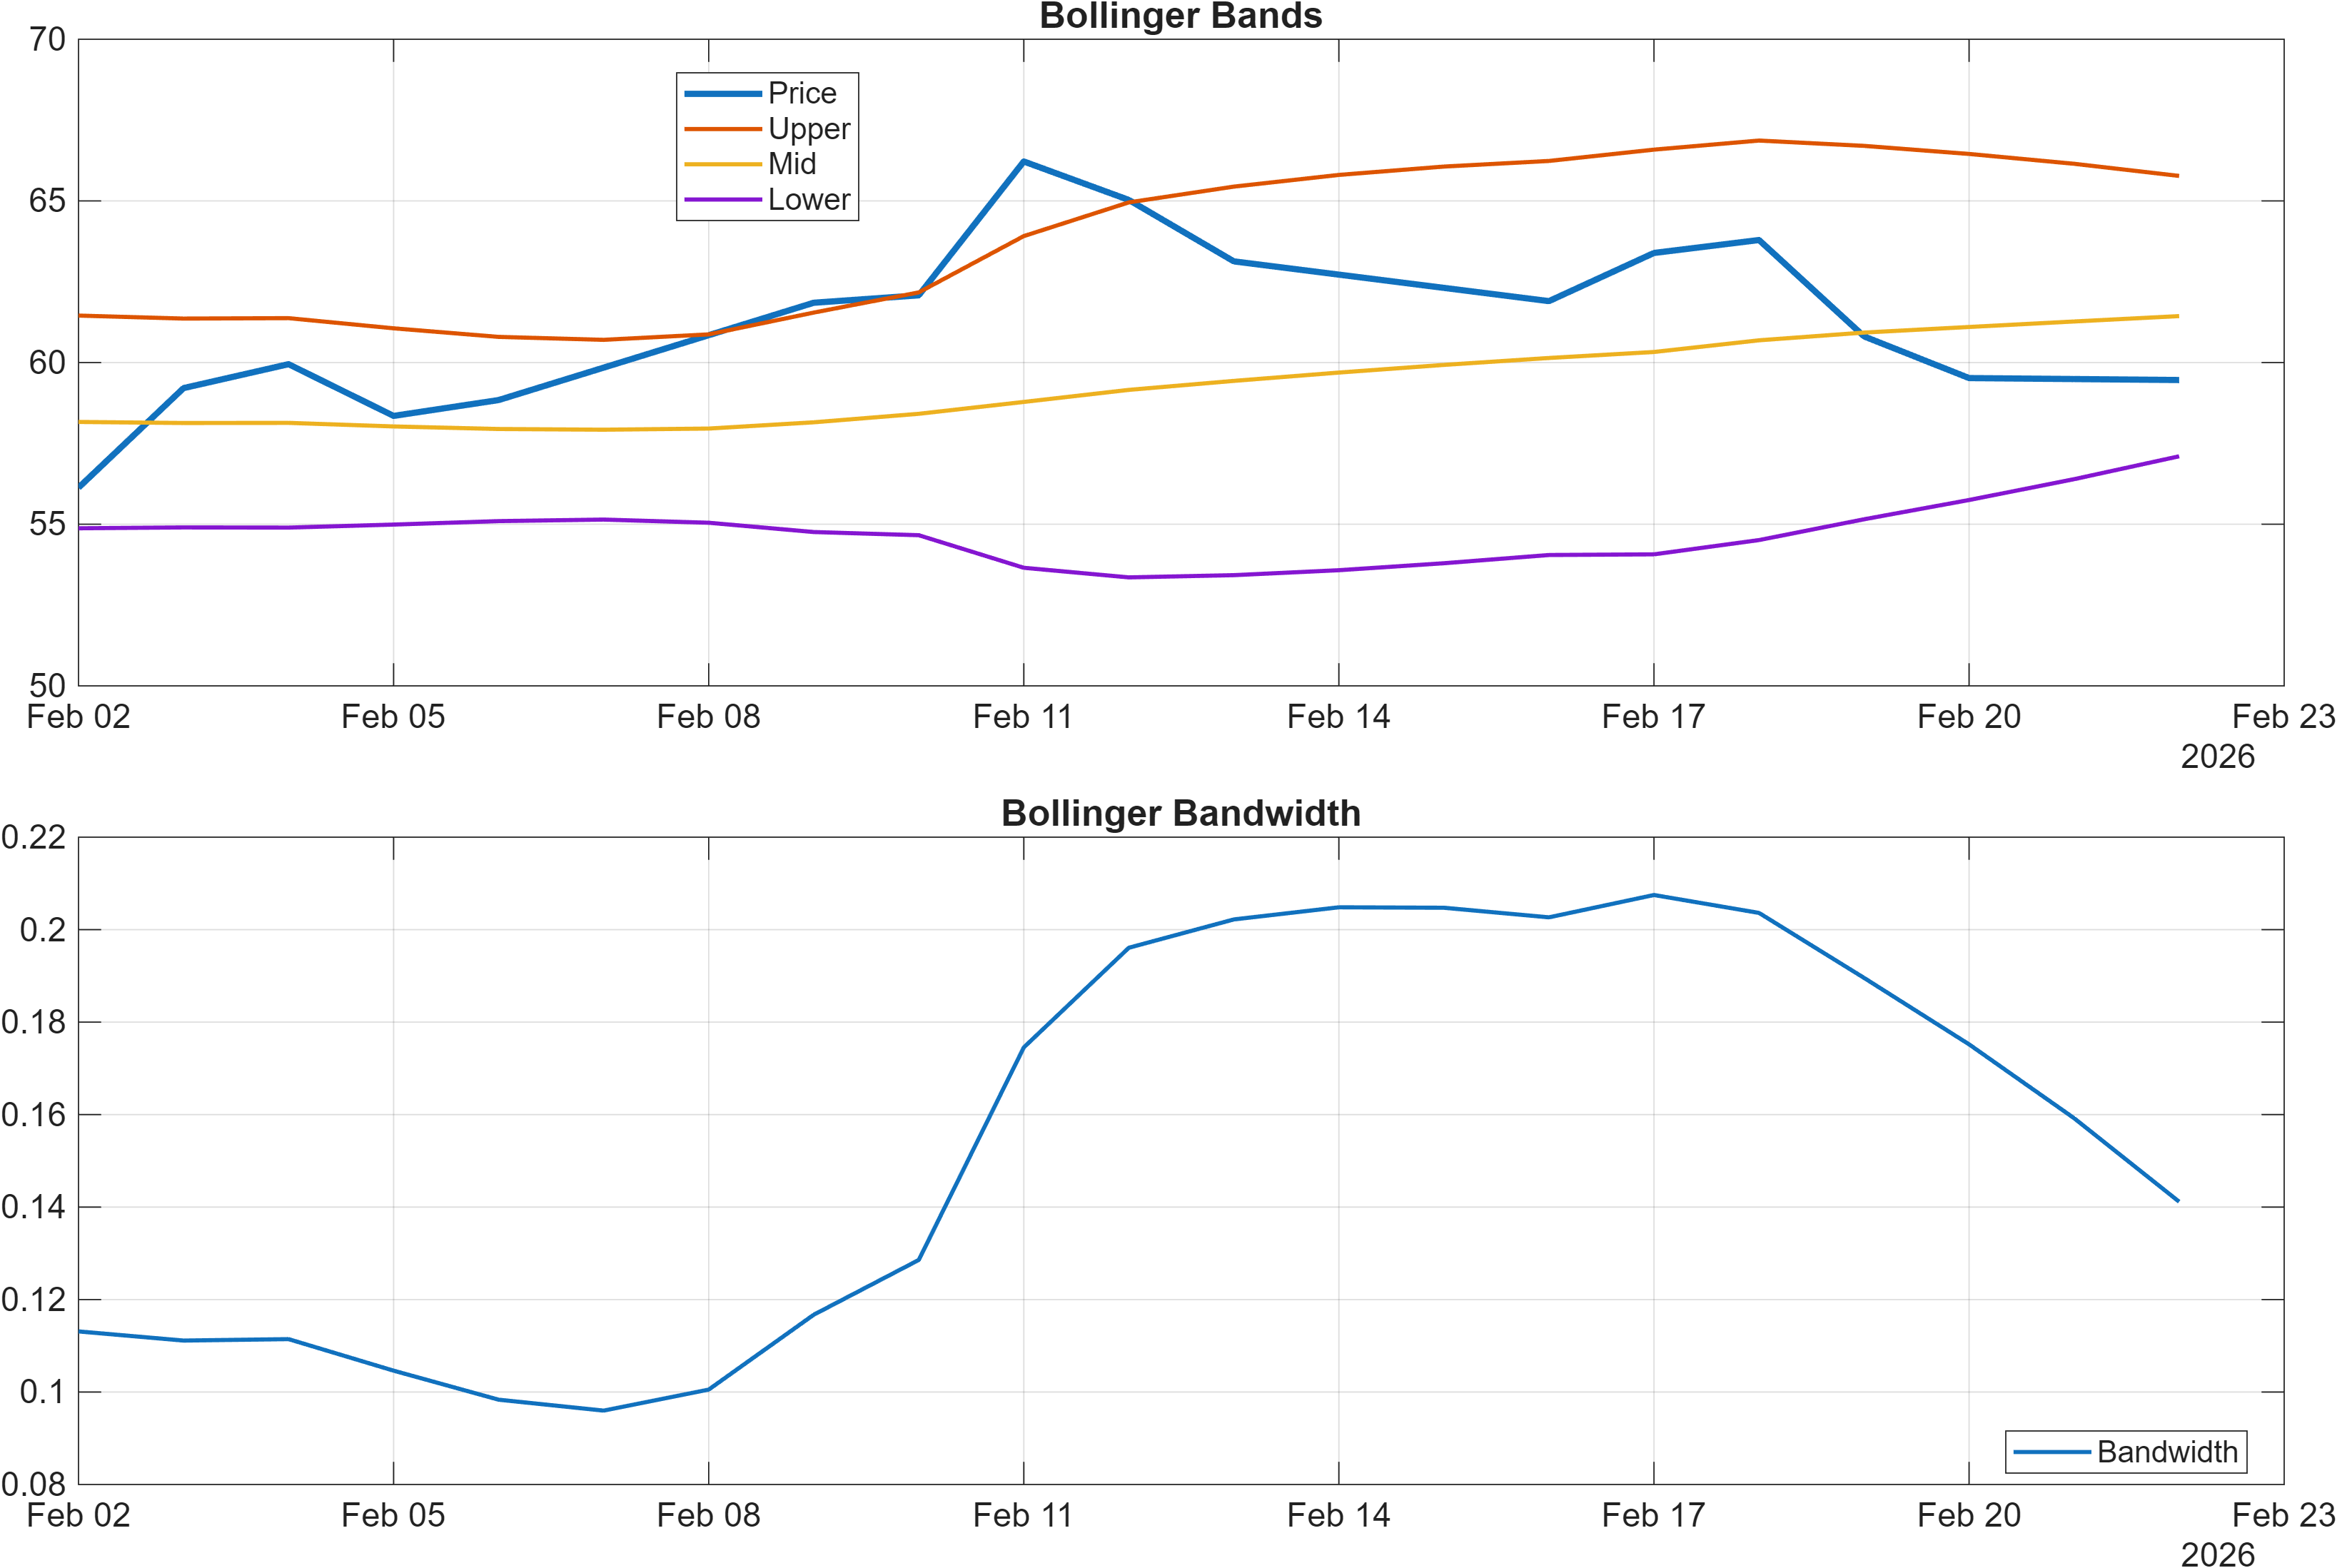
Interpretation: Bandwidth (volatility regime) latest = 0.1412.
Momentum neutrality with a bearish MACD tilt; volatility remains moderate
Momentum indicators are not delivering a uniform directional message. The RSI(14) at 45.64 is explicitly categorized as Neutral, which aligns with the idea of consolidation rather than a strong trending phase. At the same time, the MACD histogram at -0.3182 is a bearish contribution, consistent with lingering downside momentum or a failed recovery attempt within the lookback window.
Volatility conditions provide an additional filter. The Bollinger Bandwidth at 0.1412 is tagged as Neutral, implying the market is not in an extreme volatility expansion regime. When volatility is moderate, trend changes often require clearer confirmation through level breaks (support/resistance) or multiple independent momentum measures shifting together, rather than relying on a single oscillator.
Within the broader 18-signal set, there is evidence of short-horizon bounce dynamics (for example, Stoch %K at 8.553 is Bullish), but that sits alongside distribution-leaning volume/breadth signals (e.g., OBV slope(10) -2.031e+05 Bearish). This combination frequently characterizes markets where price stabilizes before participation returns, or where rallies remain vulnerable to fading due to limited accumulation.
Net: momentum and volatility are not signaling an extreme. The more decision-relevant question becomes whether momentum can improve while participation measures stop deteriorating—an alignment that typically precedes more persistent trend repair.
4) Support / Resistance zones
Support ~ 56.4100 | Resistance ~ 71.1100
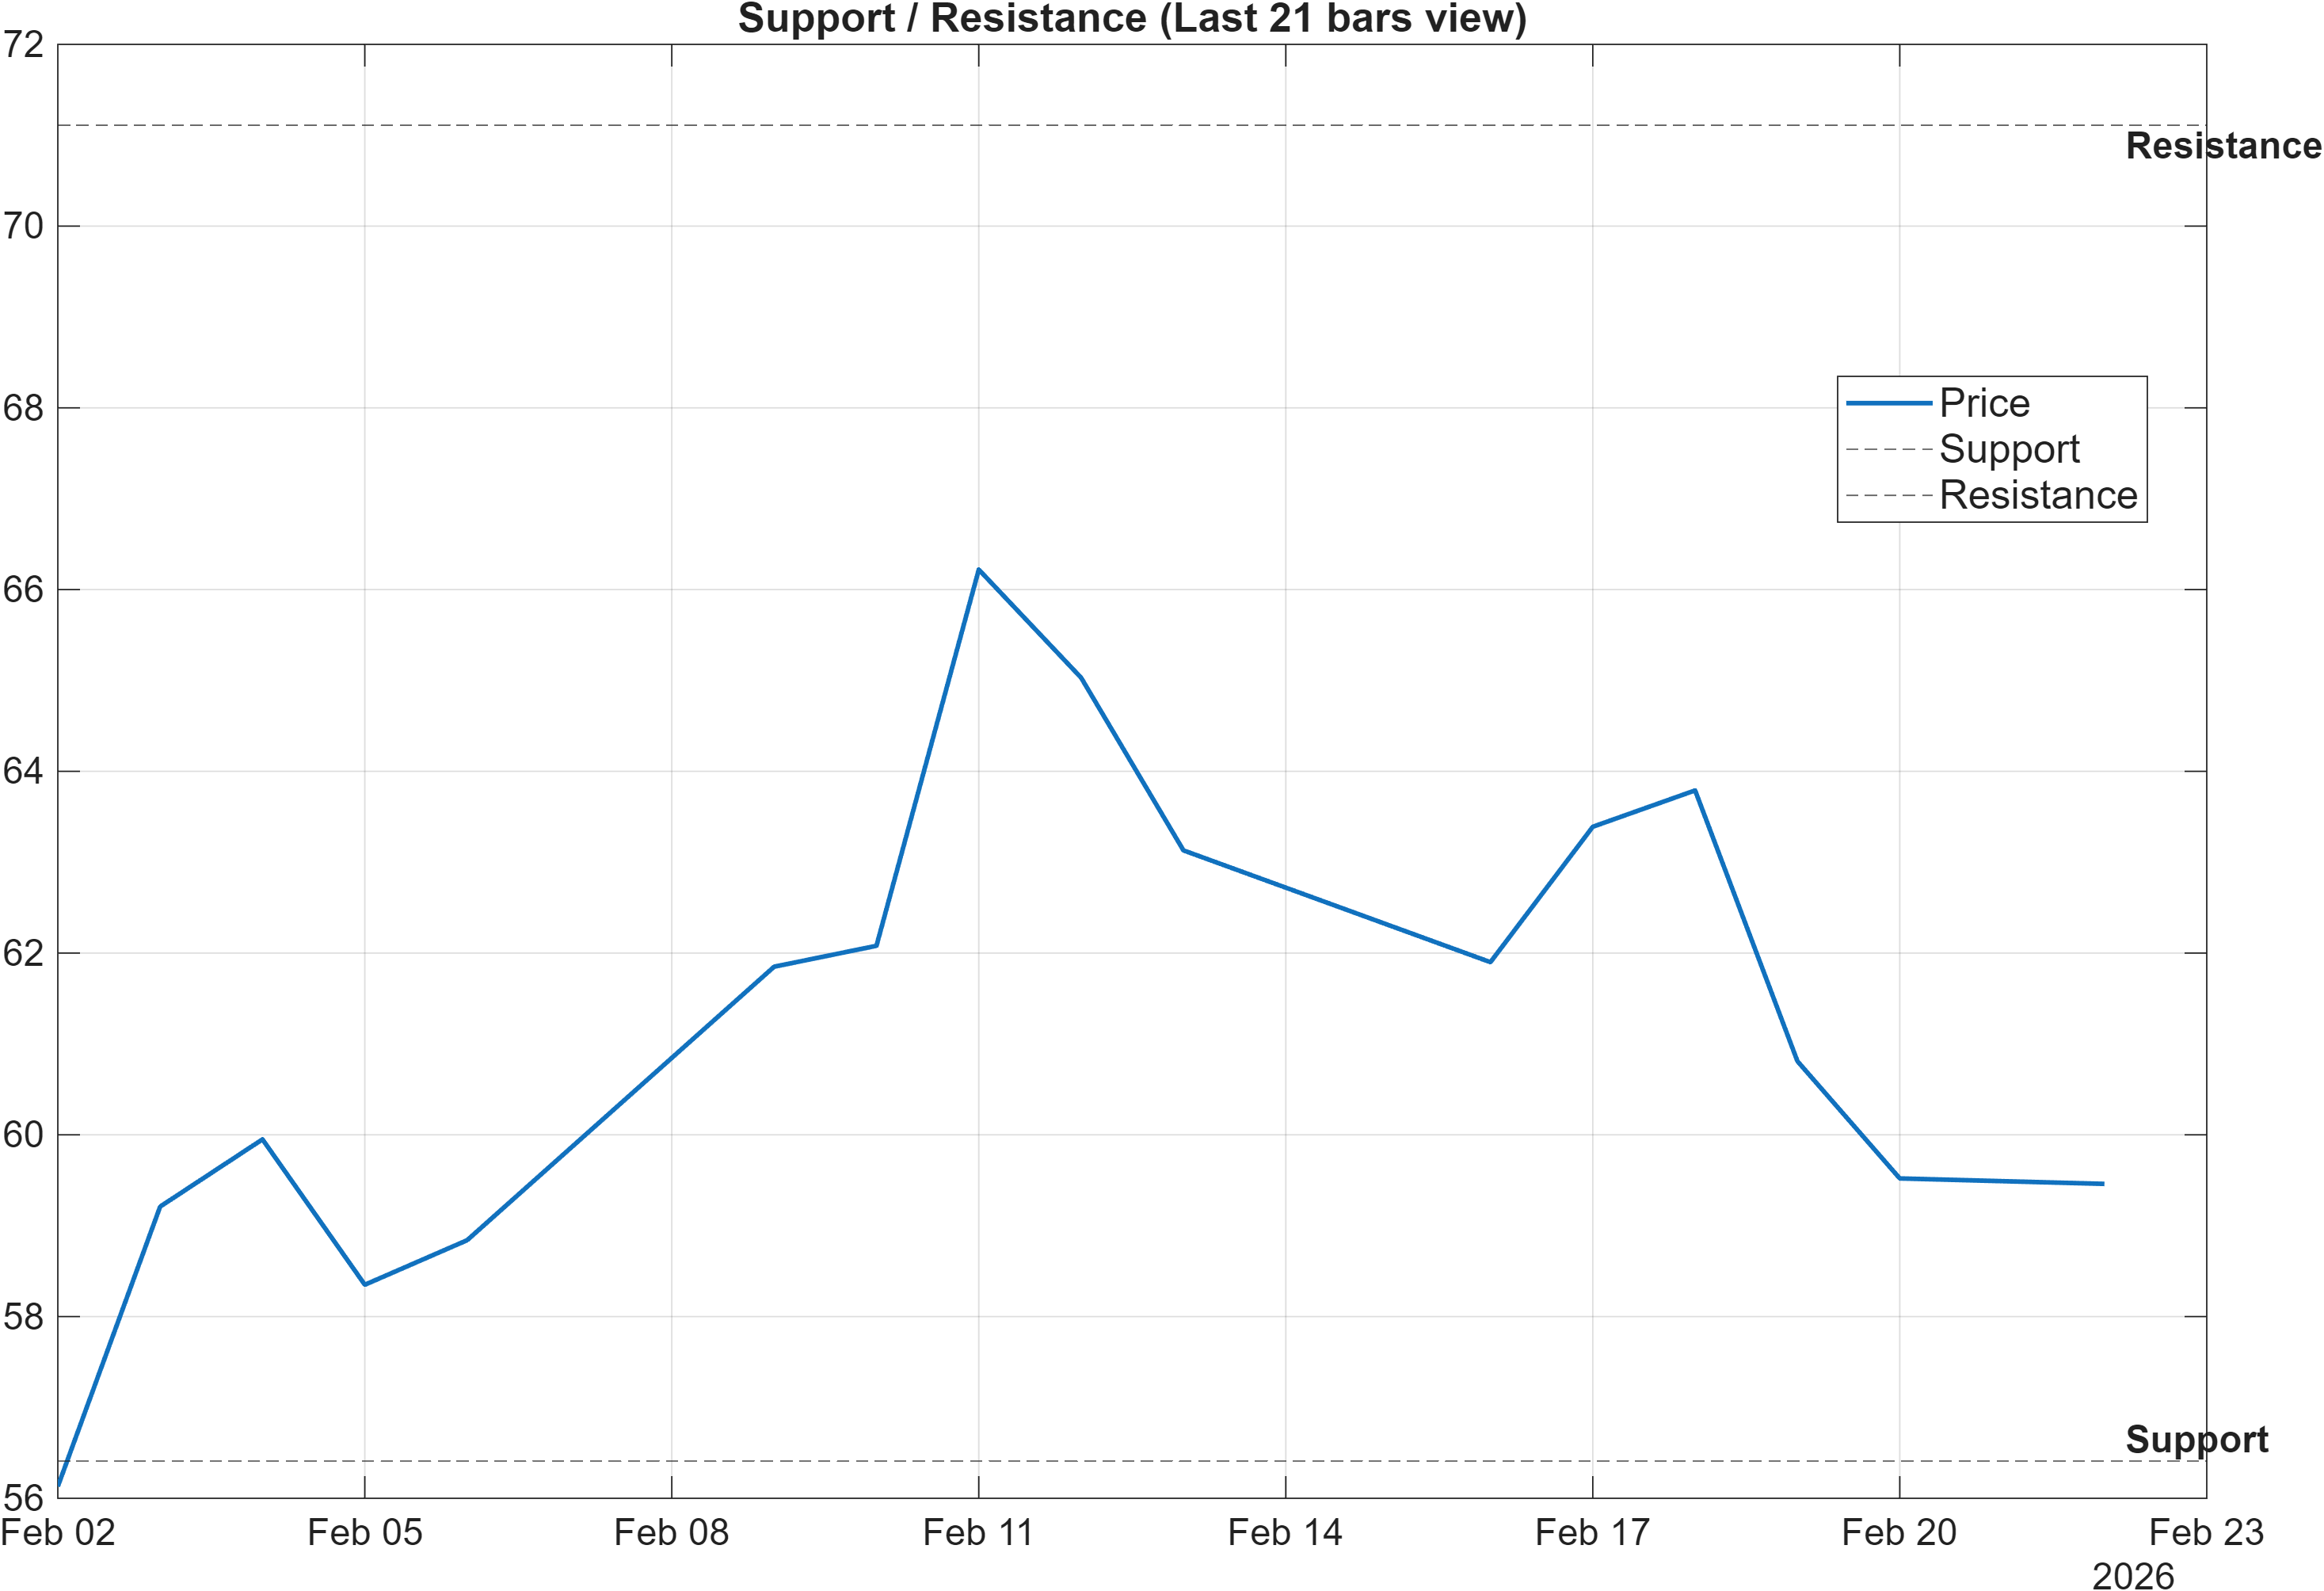
Scenario view: Break above resistance with volume → continuation. Close below support → signal deterioration risk.
Decision zones: where confirmation must occur
The level model frames the market with a clean range: 56.4100 as support and 71.1100 as resistance. In a setup where moving averages remain bearish and confluence is neutral, these zones become the primary probabilistic decision points—useful for distinguishing stabilization from deterioration without overfitting to intraday noise.
The signal table provides context for why these levels matter. The 20-period low proxy LLOW(20) at 56.71 is Neutral and sits close to the stated support region, indicating the market is operating near a recent lower boundary. Meanwhile, HHIGH(20) at 68.46 is also Neutral, suggesting recent upside progress has not converted into a stronger breakout classification within the same framework.
A key supportive detail is MedPx vs Support at 4.08 (Bullish), which implies median price behavior is positioned above the support reference by that measure. However, level-based positives are less durable if participation fails to follow—particularly given the Vol ROC(20) at -46.59 (Bearish). That tension reinforces the scenario guidance already provided: upside continuation is most credible when a resistance break is paired with volume, while a close below support raises the likelihood that the broader bearish MA structure reasserts itself.
In practice, these zones also help reconcile the long-term bullish ranks with the short-term neutral ranks: a range resolution offers the cleanest confirmation of which timeframe is taking control.
5) Quant Technical Dashboard (18 Signals)
KGNAI AI Technical Analysis Score (Deep Reinforcement Learning): Rank #909 out of 1213 (Rank 1 represents the strongest technical positioning and a higher probability of favorable price behavior. As ranks increase toward the maximum, the probability of favorable outcomes weakens and bearish positioning becomes more dominant.) | Label: Neutral | Score: -0.499
18-Signal Technical Confluence Score: -0.111 (Neutral)
Overall Technical Score (18-signal confluence + DRL rank blend): -0.227 (Neutral)
Note: The blended score reflects signal strength weighted against broader AI technical ranking, which may temporarily diverge.
Blended technical score breakdown: -0.227 (Neutral | Bull 6 / Bear 8 / Neutral 4)
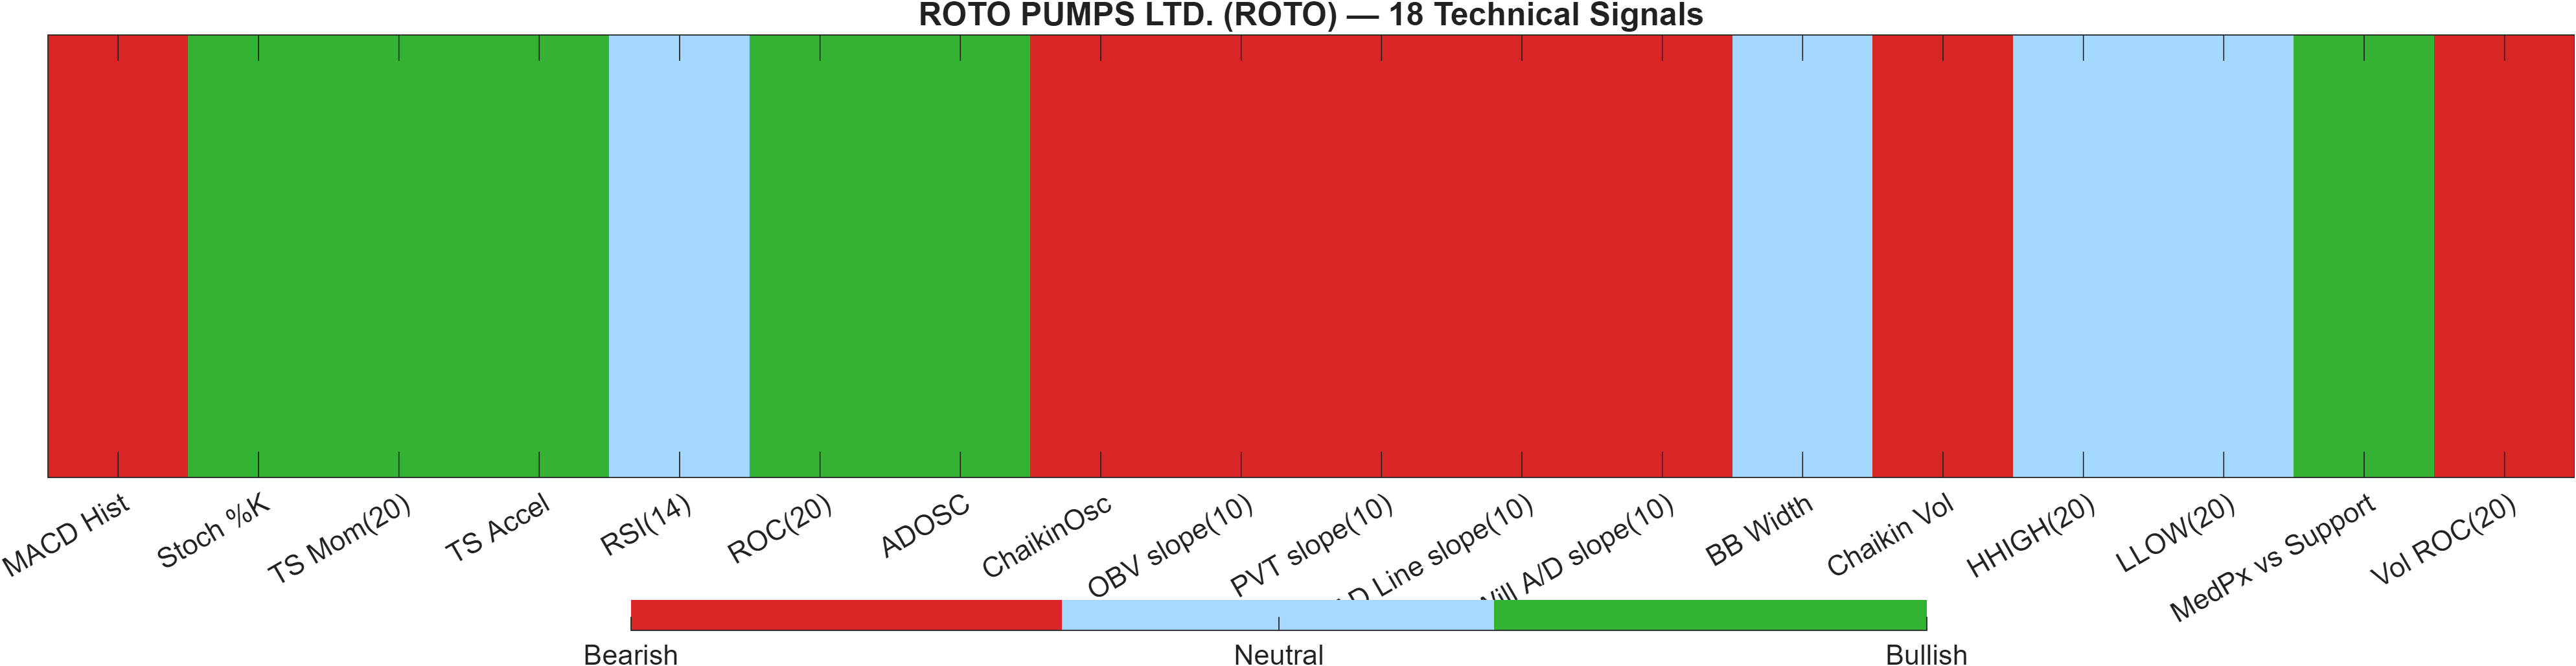
Composite read: neutral score driven by bearish participation signals
The technical stack is Neutral by construction, but the composition is informative. The DRL technical rank (#909 of 1213) with Score -0.499 suggests the broader pattern-recognition layer is not detecting strong favorable technical positioning relative to the universe. Meanwhile, the 18-signal confluence score is only mildly negative (-0.111), producing a blended Overall Technical Score of -0.227.
The internal mix (Bull 6 / Bear 8 / Neutral 4) indicates bears have a numerical edge, but not an overwhelming one—consistent with a market where downside pressure exists yet is not accelerating. The divergence shows up most clearly between momentum/bounce indicators and volume/breadth proxies. For example, short-horizon momentum contributes positives such as TS Accel 0.97 (Bullish) and ROC(20) 0.4222 (Bullish), while participation measures lean negative with OBV slope(10) -2.031e+05, PVT slope(10) -3997, and AD Line slope(10) -1.205e+05 all flagged Bearish.
This split matters because rallies supported primarily by momentum without confirming accumulation often struggle to persist. A cleaner technical improvement would typically involve the bearish set (especially the volume-related signals and Chaikin Vol 1.202 (Bearish)) stabilizing alongside MACD repair from -0.3182 toward less negative territory.
Signal table (Bull/Bear/Neutral)
| Indicator | Value | Signal |
|---|---|---|
| MACD Hist | -0.3182 | Bearish |
| Stoch %K | 8.553 | Bullish |
| TS Mom(20) | 0.31 | Bullish |
| TS Accel | 0.97 | Bullish |
| RSI(14) | 45.64 | Neutral |
| ROC(20) | 0.4222 | Bullish |
| ADOSC | 28.36 | Bullish |
| ChaikinOsc | -1.496e+04 | Bearish |
| OBV slope(10) | -2.031e+05 | Bearish |
| PVT slope(10) | -3997 | Bearish |
| AD Line slope(10) | -1.205e+05 | Bearish |
| Will A/D slope(10) | -6.24 | Bearish |
| BB Width | 0.1412 | Neutral |
| Chaikin Vol | 1.202 | Bearish |
| HHIGH(20) | 68.46 | Neutral |
| LLOW(20) | 56.71 | Neutral |
| MedPx vs Support | 4.08 | Bullish |
| Vol ROC(20) | -46.59 | Bearish |
Interpretation: Indicator-level signals form the base confluence, which is then adjusted using a separate AI-driven technical ranking model. The final technical score summarizes this combined view.
6) News sentiment + extractive gist
Note: Instrument-specific news matches were not found, so the digest includes broader market/sector headlines. Links are provided for verification.
Sentiment score (avg): 0.121 | Positive: 37% | Neutral: 56% | Negative: 6%
KGNAI AI News Sentiment Score (normalized -1 to +1): Not available (as of —) | Label: Not available | Overall news score: 0.12
Positive Developments
Recent coverage across major financial outlets indicates a mildly constructive backdrop for risk appetite, with the news-mix skewing more neutral than negative (Neutral 56%, Negative 6%). The positive slice (37%) is dominated by market-oriented stock-selection and sector rotation commentary rather than ROTO-specific catalysts, which is consistent with the note that instrument-specific matches were not found in the provided dataset. In practical terms for this report, that means sentiment functions as a contextual tailwind rather than a direct driver.
The main supportive implication is that broader equity flows and tactical positioning narratives can help stabilize mid-cap and cyclically exposed names during consolidation phases. With ROTO’s technical state already Neutral (Overall Technical Score -0.227) and levels clearly bracketed at 56.4100 and 71.1100, a mildly constructive tape can assist upside tests—but it does not replace the need for price/volume confirmation.
Neutral / Mixed Developments
The neutral stream largely reflects macro and index-level positioning—markets watching for breakouts, mixed sector leadership, and incremental shifts in institutional flows. For ROTO, this maps well to the timeframe split in KGNAI ranks: strong longer-horizon placement (6-Monthly #26) against weaker short-term ranks (Daily #920). In a mixed news environment, the market often prioritizes near-term technical structure over longer-cycle narratives, making range behavior around support 56.4100 and resistance 71.1100 especially informative.
Since the normalized KGNAI AI News Sentiment Score is Not available in the provided data, the report relies on the aggregated sentiment mix and the technical framework to interpret how narrative conditions may—or may not—interact with price behavior.
Negative / Risk Signals
The negative/risk slice is less about company-specific deterioration and more about elevated uncertainty conditions: volatility discussions, global cue sensitivity, and the risk that short-term consolidation resolves lower. This matters because several participation-oriented technical inputs are already bearish, including Vol ROC(20) at -46.59 and the bearish set of breadth/flow slopes (e.g., OBV slope(10) -2.031e+05). In other words, even with only 6% of items categorized as negative, the technical layer is still signaling that confirmation quality is the primary risk variable.
The most direct risk control remains structural: a close below 56.4100 would align the level model with the bearish moving-average configuration and could intensify the already-soft short-term ranking profile (Weekly #769, Daily #920).
- Whether price can clear 71.1100 with improving participation (watch Vol ROC(20) and OBV/PVT slopes).
- Whether MACD histogram (-0.3182) improves while RSI remains stable (currently 45.64 Neutral).
- Whether the market continues to defend 56.4100 during any broader index volatility spikes.
Sources referenced: Reuters, Bloomberg, Yahoo Finance, MarketWatch, Investing.com
Snapshot: AI Rank (Short–Mid–Long): Mixed (Neutral–Neutral–Bullish) · Technical Confluence: Neutral · Key Levels: Support ~56.41 | Resistance ~71.11 · News Sentiment: Neutral
7) Sources
Not available in the provided data.
You may also like: How KGNAI AI ranks instruments across global markets
Disclaimer: KGNAI provides AI-generated analytics and educational market commentary only. This is not financial advice. Markets involve risk. Always do your own research.