
NEOGEN (Neogen Chemicals Ltd) — 10-May-2026 Technical Confluence Leads, But Cross-Horizon Ranks Diverge
NEOGEN presents a clear case of signal divergence across time horizons. Longer-horizon positioning remains constructive, with the Yearly rank #29 and 3-Monthly rank #73 implying upper-decile relative strength within a 1222-instrument universe. In contrast, the near-term profile is less supportive, with the Weekly rank #1041 and Daily rank #873 pointing to weaker short-run behavior. Technically, the evidence set is currently tilted bullish: price alignment versus moving averages is positive (Close vs MA50 bullish; MA50 vs MA200 bullish), momentum indicators show upside bias (RSI bias bullish; MACD histogram 1.1292), and the blended technical read is constructive (Overall Technical Score 0.473, bullish). Volatility is not yet in an extreme regime, with Bollinger Bandwidth 0.1447, keeping the focus on confirmation around the key decision levels: support 1144.7646 and resistance 1719.2250.
- Rank stance: Short-term Bearish (weekly #1041), Mid-term Neutral (monthly #623), Long-term Neutral with strong pockets (yearly #29, 3-month #73).
- Technical confluence: Bullish (Overall Technical Score 0.473; DRL technical rank #203).
- Key levels: Support 1144.7646 | Resistance 1719.2250.
- News sentiment bias: Neutral-to-positive on averages (sentiment avg 0.150; positive 50%; negative 6%), while normalized score shows 1.00 (Bullish) as of 2025-11-28.
- Confirmation / invalidation: Continuation risk-on improves on a break above 1719.2250 with volume; deterioration risk increases on a close below 1144.7646.
What KGNAI Measures
KGNAI evaluates assets using large cross-sectional datasets built from millions of structured data points. Inputs incorporate fundamental metrics, technical structures, and systematically processed news sentiment. Statistical models, machine learning, and AI frameworks are used to assess relative positioning, signal alignment, and probabilistic behavior across broad universes.
How to Read This Report
- Ranks are comparative across the tracked universe, not absolute price targets.
- Confluence reflects alignment among independent signal groups.
- Support/resistance levels are probabilistic decision zones, not guarantees.
- Sentiment provides contextual bias within the broader analytical framework.
1) KGNAI AI Analysis
Region: INDIA
Total universe size: 1222 ranked instruments
- Daily rank: #873 out of 1222 — Neutral
- Weekly rank: #1041 out of 1222 — Bearish
- Monthly rank: #623 out of 1222 — Neutral
- 3-Monthly rank: #73 out of 1222 — Bullish
- 6-Monthly rank: #264 out of 1222 — Neutral
- Yearly rank: #29 out of 1222 — Bullish
NEOGEN’s rank stack is best understood as a regime split rather than a single directional verdict. On one side, the yearly (#29) and 3-month (#73) placements sit in the upper decile of the 1222-instrument universe, which typically corresponds to stronger relative behavior across broader lookbacks. On the other side, the weekly (#1041) and daily (#873) readings sit in the weaker portion of the distribution, consistent with short-run fragility or a digestion phase after prior strength.
This divergence matters because it changes what “risk” looks like. When long-horizon ranks stay strong while short-horizon ranks deteriorate, the market is often debating whether the move is consolidating or reversing. Here, the monthly rank (#623) and 6-month rank (#264) occupy more neutral territory, acting as an intermediate “tie-breaker” that currently does not decisively confirm the bullish longer-horizon cluster.
The provided term view captures that mix: Short-term Bearish, Mid-term Neutral, and Long-term Neutral. Within KGNAI’s framework, the practical read is to emphasize confirmation from price structure and volume before treating the stronger long-horizon ranks as dominant, particularly while the weekly rank remains in the lower-quality zone.
Rank labeling: Bullish Bearish Neutral
2) Price & trend overview
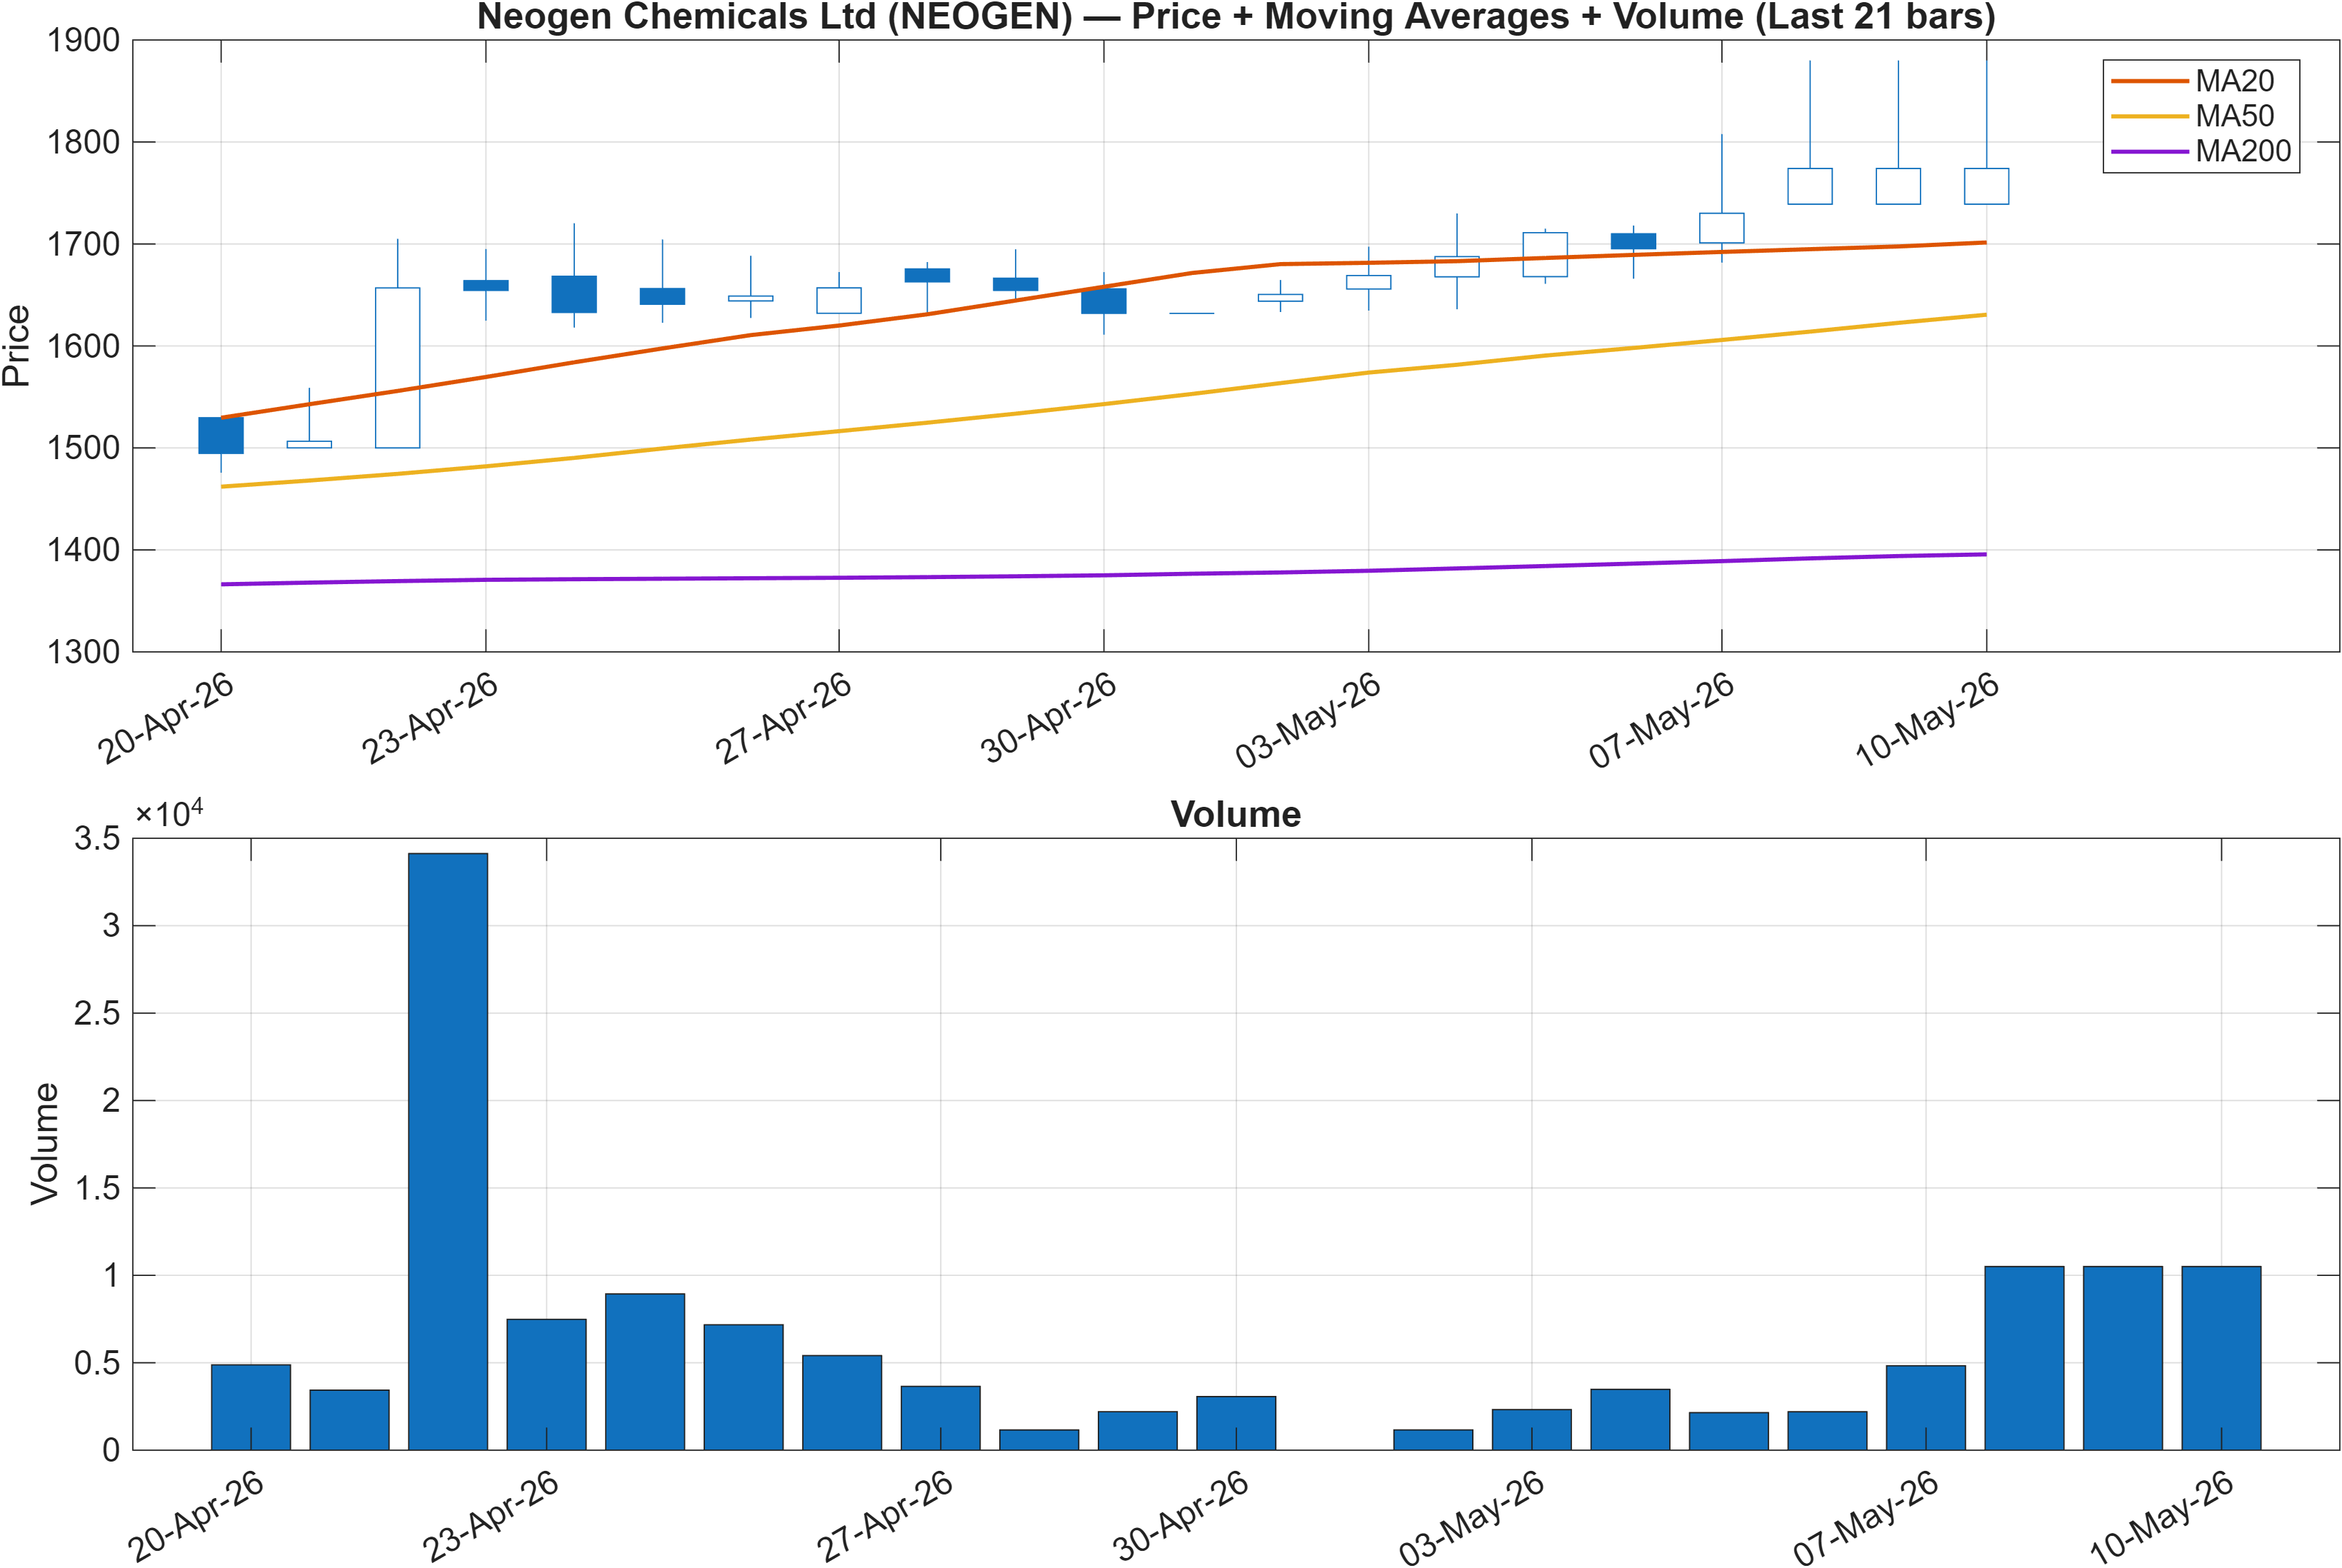
The trend read is currently defined by a constructive moving-average configuration while ranks warn about near-term quality. The chart interpretation indicates Close vs MA50 = Bullish and MA50 vs MA200 = Bullish, a combination that typically aligns with an established uptrend rather than a purely tactical bounce. This “trend-on” condition is consistent with the longer-horizon strength signaled by the 3-Monthly rank #73 and Yearly rank #29.
The tension comes from the short horizon: the Weekly rank #1041 implies that, despite the favorable trend scaffold, recent price behavior has been comparatively weaker versus the broader universe. In institutional terms, this can show up as a higher sensitivity to pullbacks, more frequent failed breakouts, or reduced persistence of daily advances—even while the longer trend remains intact.
With the market still respecting bullish trend definitions, the analytical priority shifts to trend durability: whether demand continues to support price on dips and whether participation strengthens on advances. The subsequent technical dashboard and the resistance 1719.2250 level become the key arbiters—trend continuation is typically higher quality when breakouts occur with supportive breadth/volume, whereas trend deterioration often becomes visible before the averages fully roll over.
Trend state (from provided signals): Bullish
3) Momentum & volatility dashboard
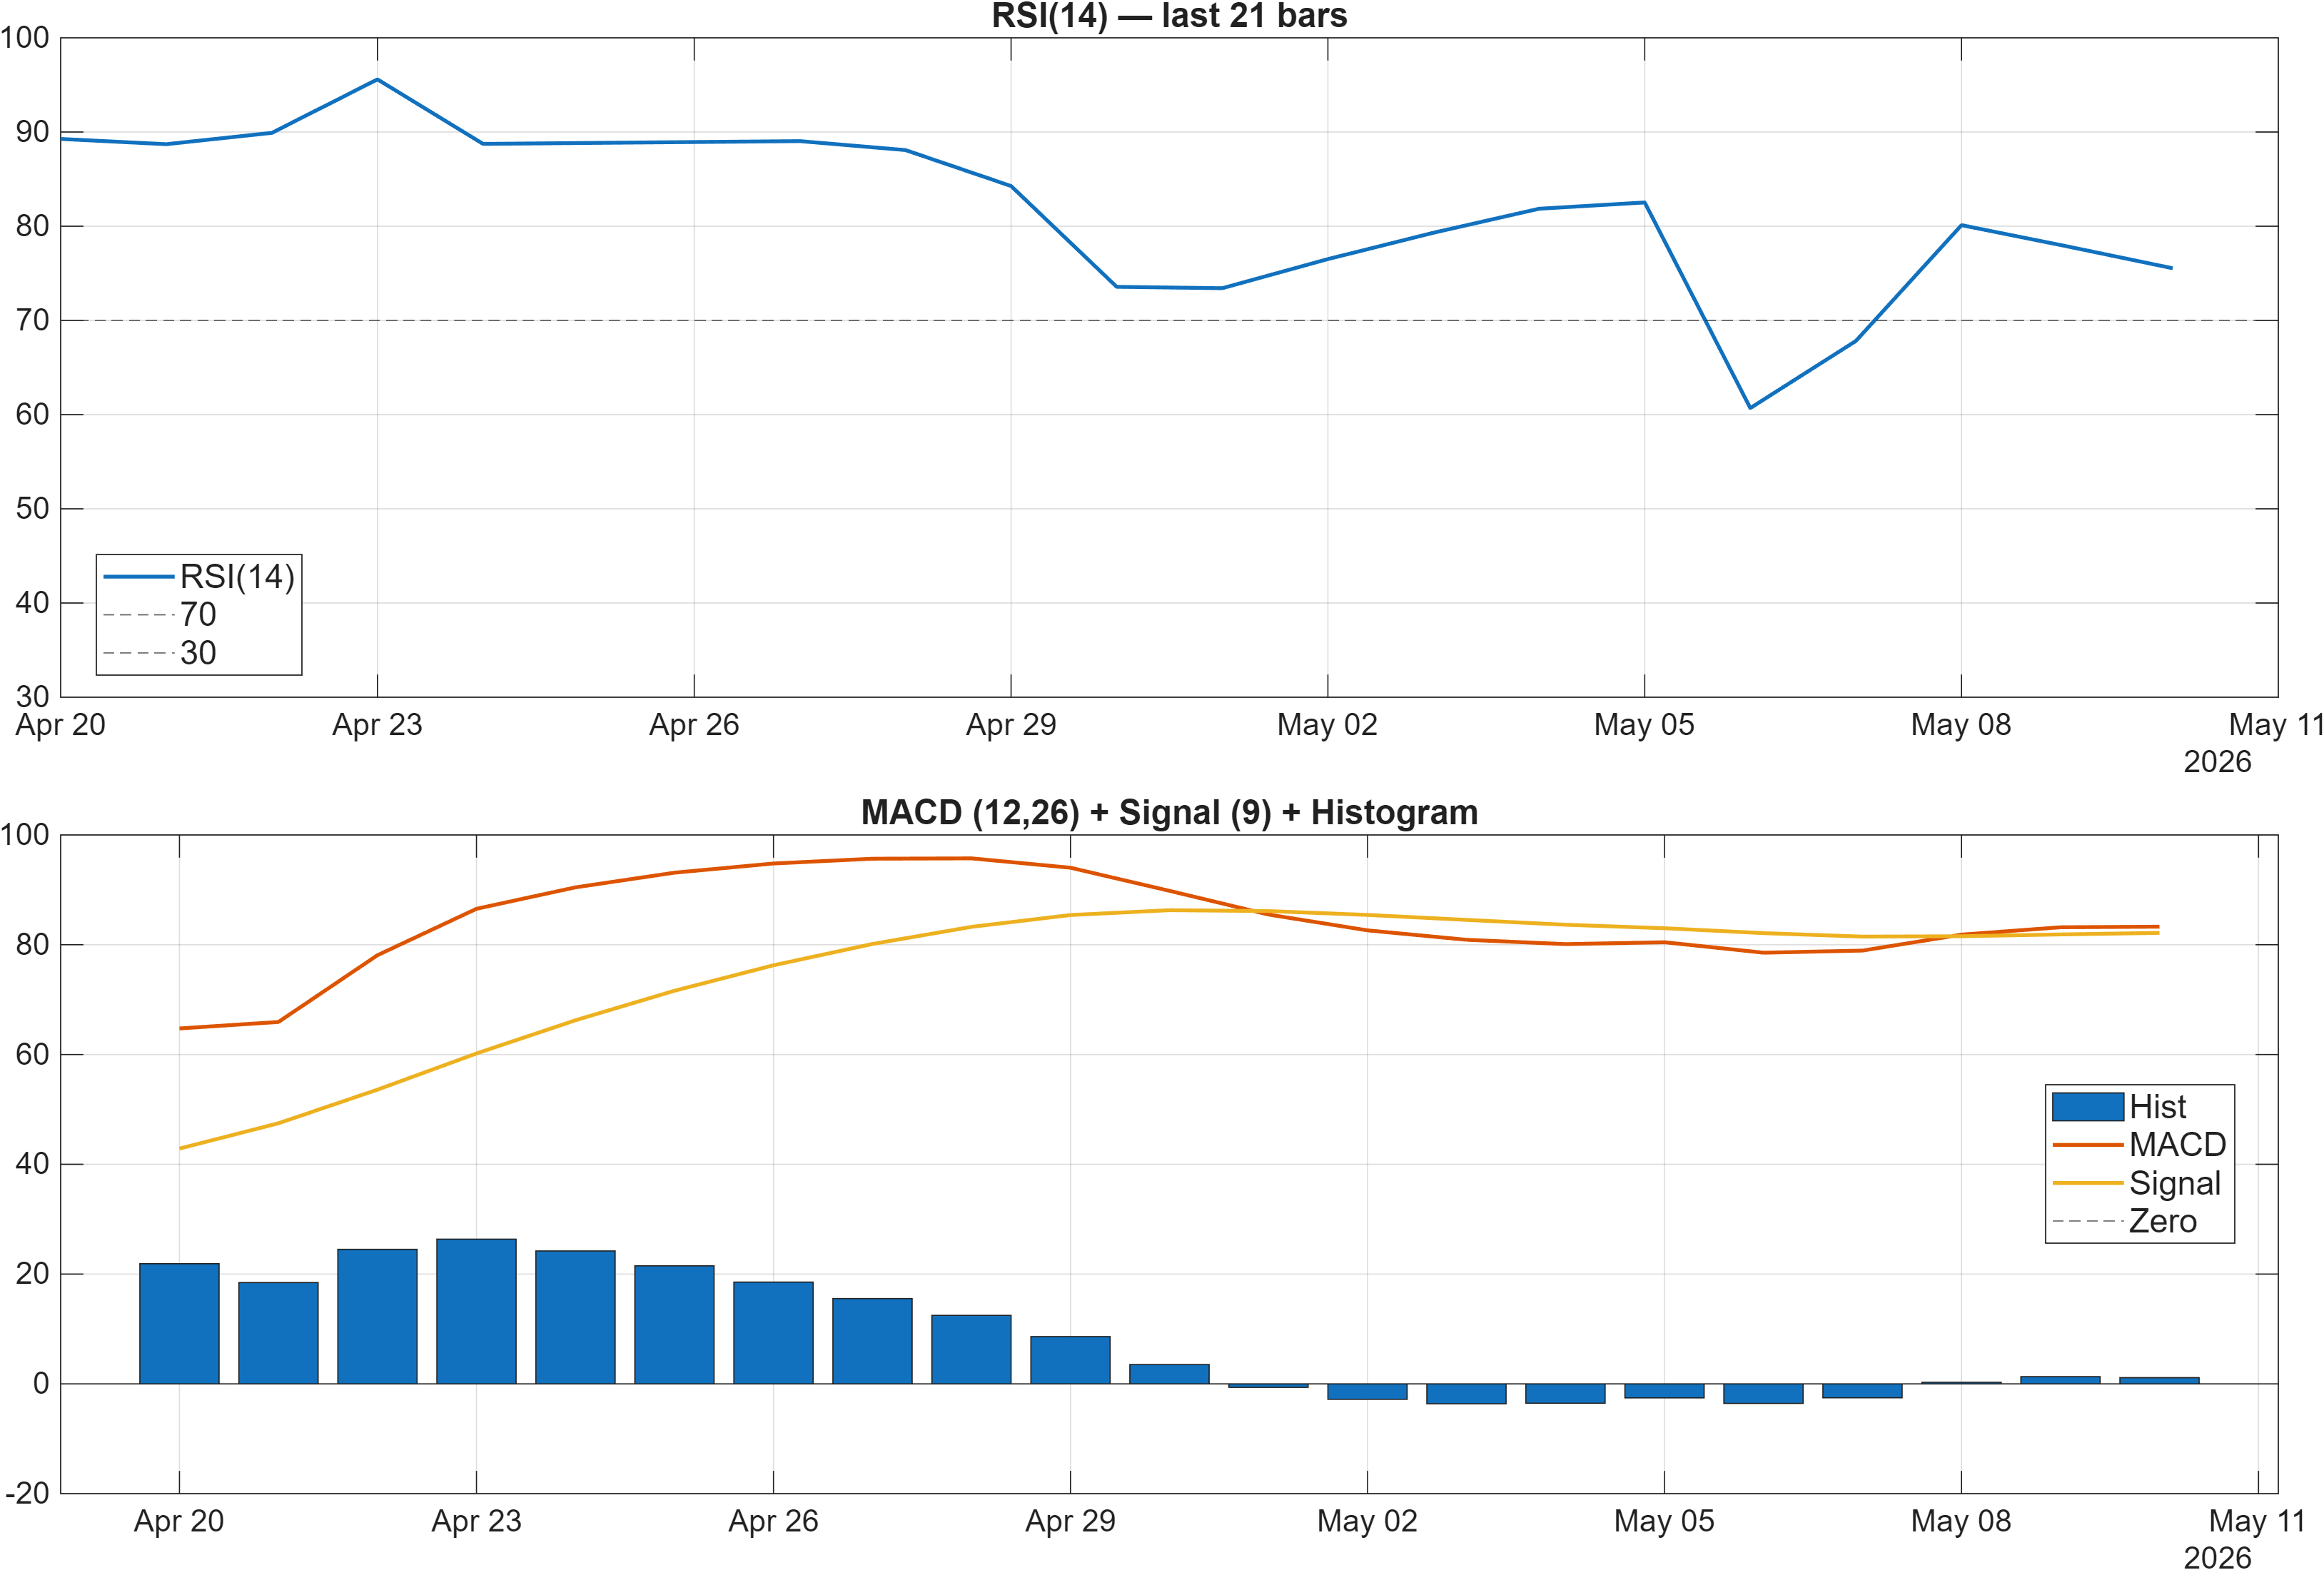
Momentum currently leans positive, but it is not “unconditional.” The dashboard states RSI bias = Bullish and shows a positive MACD histogram of 1.1292, a configuration more consistent with trend-following participation than with a fully exhausted move. However, RSI is also elevated in the signal table (RSI(14) 75.54), which can coincide with strong momentum but also increases the odds that follow-through becomes more selective unless price continues to confirm.
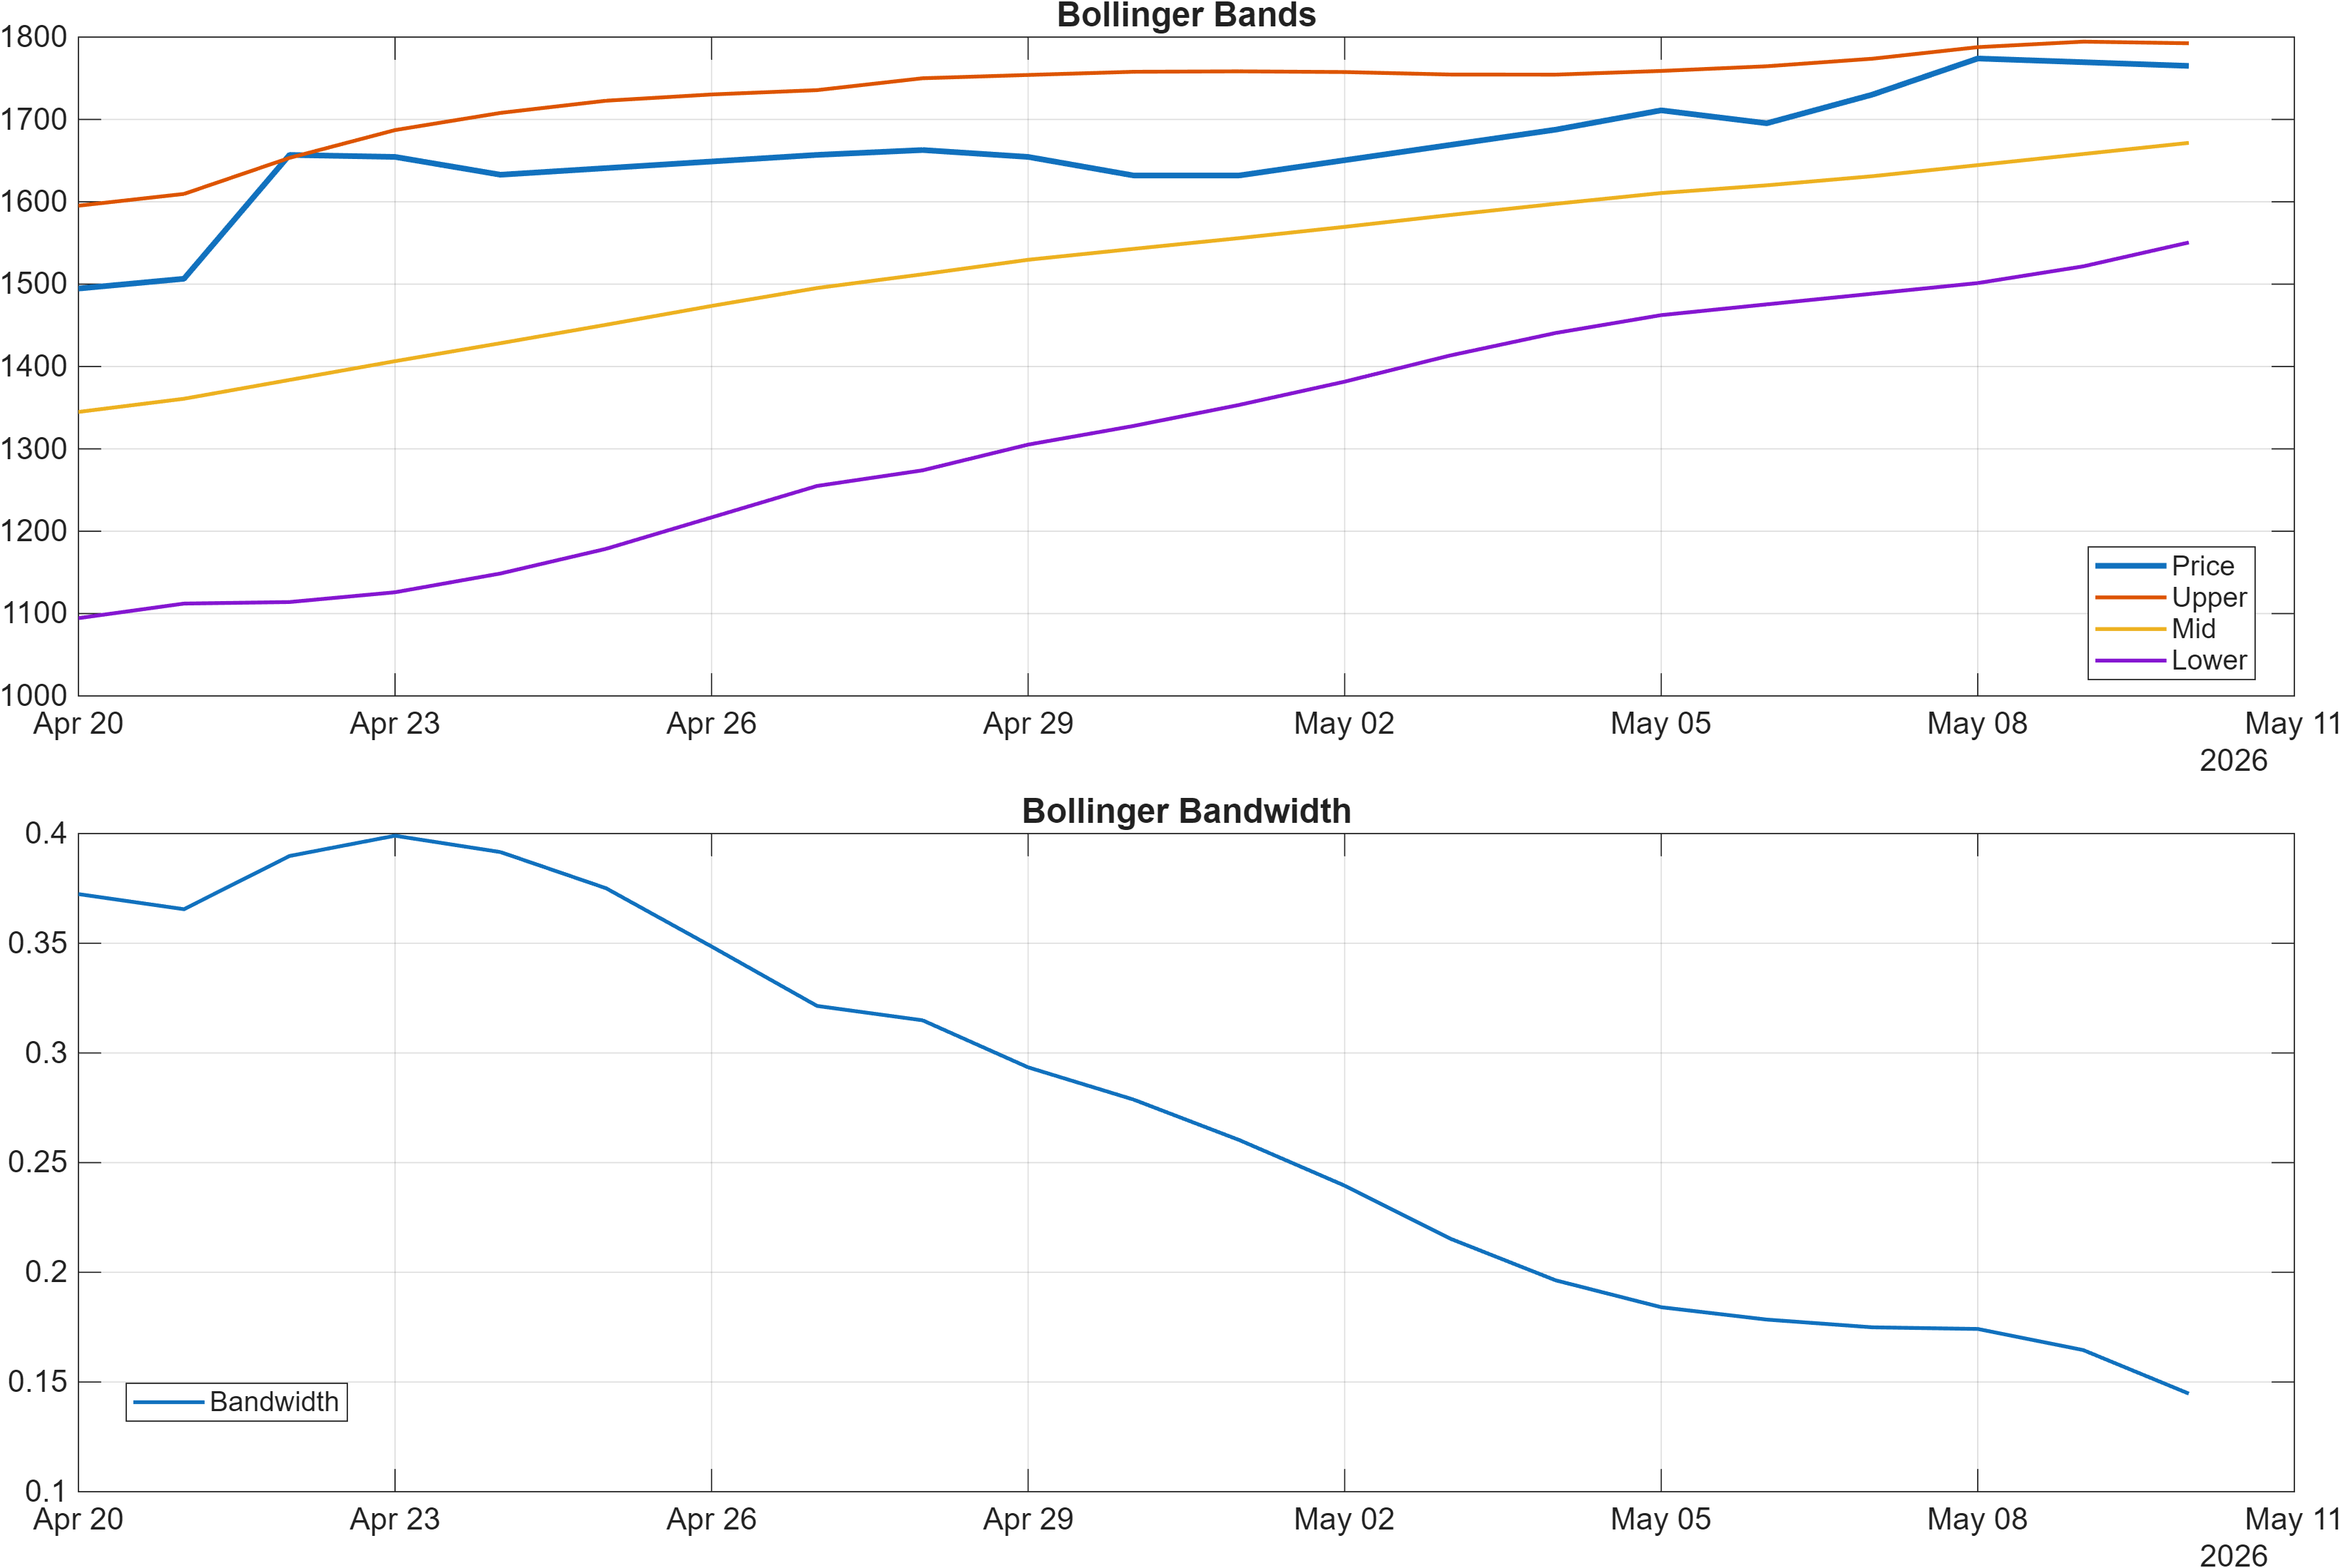
Volatility adds an important qualifier. Bollinger Bandwidth 0.1447 points to a regime that is not at an obvious extreme in the provided read. When bandwidth is moderate, markets often transition through compression-to-expansion phases where direction is determined by where price resolves relative to key levels and whether momentum stays supported. In this case, a positive MACD histogram and bullish RSI bias are constructive inputs—but the near-term rank weakness (weekly #1041) argues for requiring cleaner confirmation rather than extrapolating from momentum alone.
The momentum/volatility mix therefore suggests a market that can still behave “trend-like,” yet may be vulnerable to failed impulses if volatility expands against the position. Practically, momentum confirmation becomes higher quality when it coincides with breaks through structural levels (notably 1719.2250) and does not immediately mean-revert back into prior ranges.
Momentum state (from provided signals): Bullish Volatility: Neutral
4) Support / Resistance zones
Support ~ 1144.7646 | Resistance ~ 1719.2250
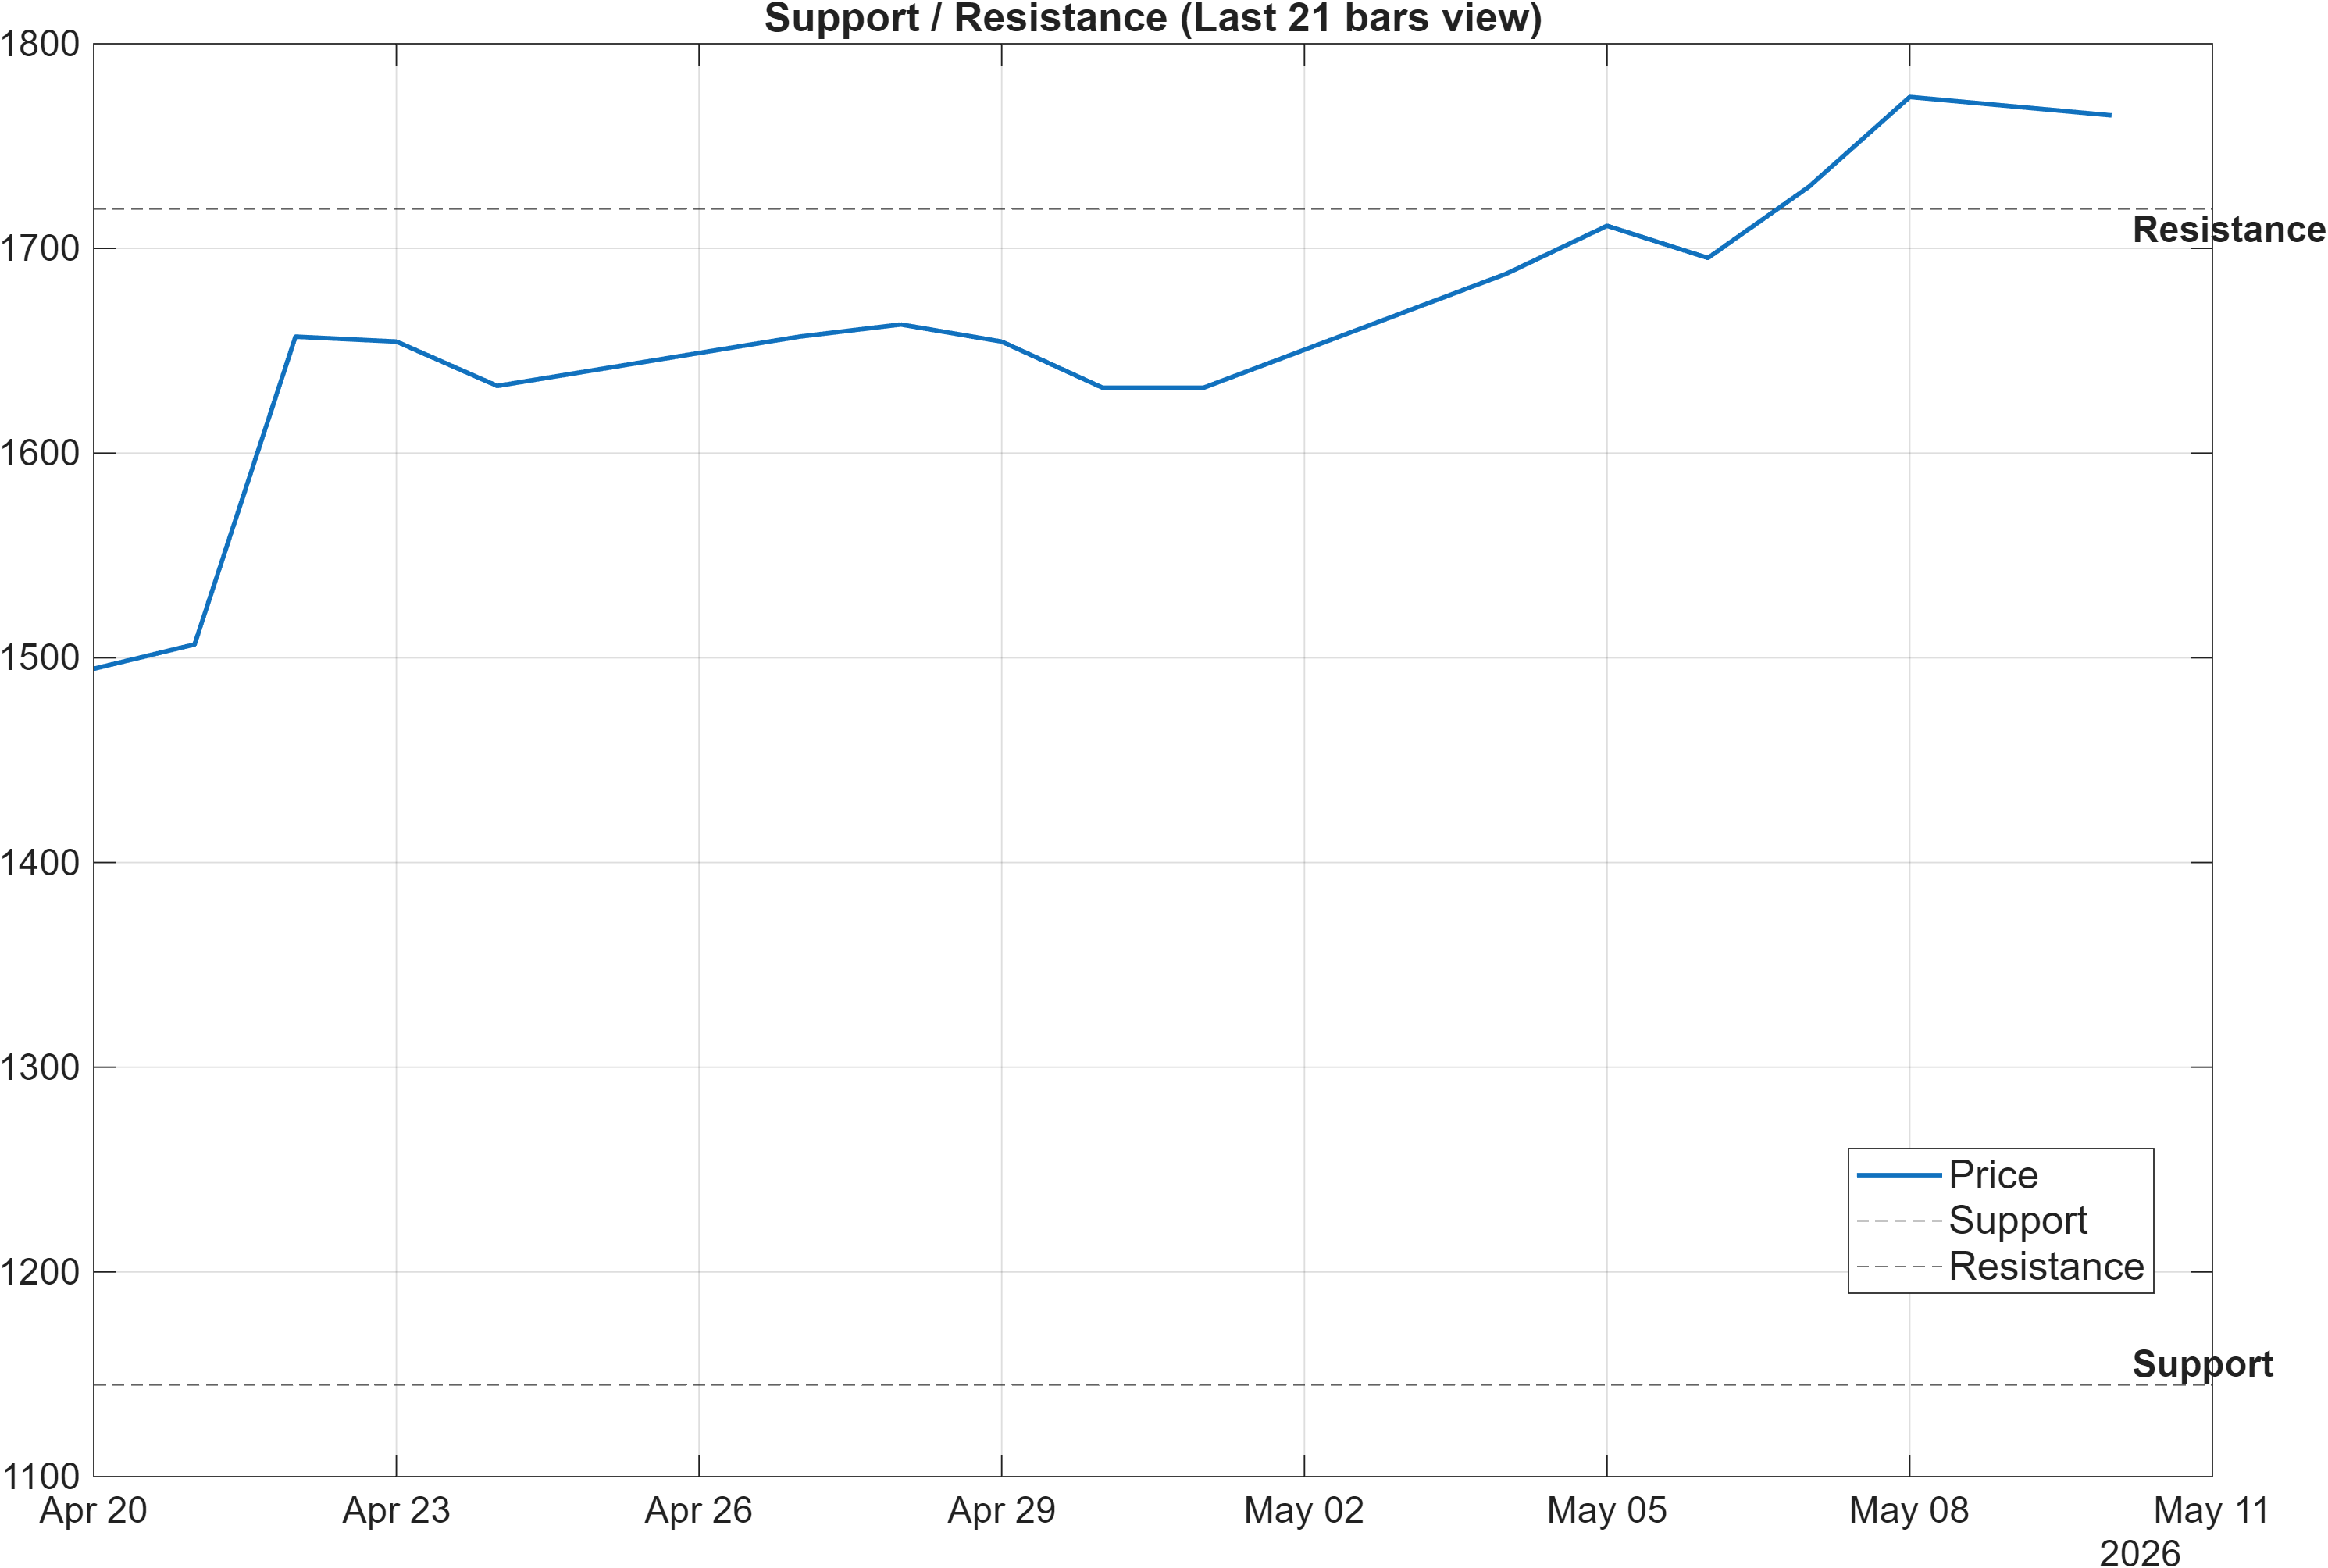
The level map frames a two-sided decision structure. With trend signals constructive (Close vs MA50 bullish; MA50 vs MA200 bullish) and momentum supportive (MACD histogram 1.1292), the resistance band at 1719.2250 becomes the primary validation zone for continuation. A clean break is only treated as higher quality under the report’s stated condition—break above resistance with volume—because volume-confirmed breaks tend to reduce the probability of immediate retracement.
On the downside, 1144.7646 is the key risk boundary. The scenario guidance is explicit: close below support raises deterioration risk. That condition is especially relevant given the weak short-horizon ranks (daily #873 and weekly #1041), which can precede sharper air-pockets even when the longer-horizon ranks remain favorable. In other words, the support line is not only a chart level; it is the dividing line between “pullback within a constructive structure” and “structure breaking down.”
Between these levels, the market is effectively in a confirmation corridor. That aligns with the volatility read (Bandwidth 0.1447): if volatility expands, it often does so around such boundaries. For positioning discipline, the most informative outcomes are (1) a breakout above 1719.2250 that holds, versus (2) a loss of 1144.7646 that persists into subsequent sessions.
5) Quant Technical Dashboard (18 Signals)
KGNAI AI Technical Analysis Score (Deep Reinforcement Learning): Rank #203 out of 1222 (Rank 1 represents the strongest technical positioning and a higher probability of favorable price behavior. As ranks increase toward the maximum, the probability of favorable outcomes weakens and bearish positioning becomes more dominant.) | Label: Bullish | Score: 0.668
18-Signal Technical Confluence Score: 0.389 (Bullish)
Overall Technical Score (18-signal confluence + DRL rank blend): 0.473 (Bullish)
Note: The blended score reflects signal strength weighted against broader AI technical ranking, which may temporarily diverge.
Blended technical score breakdown: 0.473 (Bullish | Bull 11 / Bear 4 / Neutral 3)
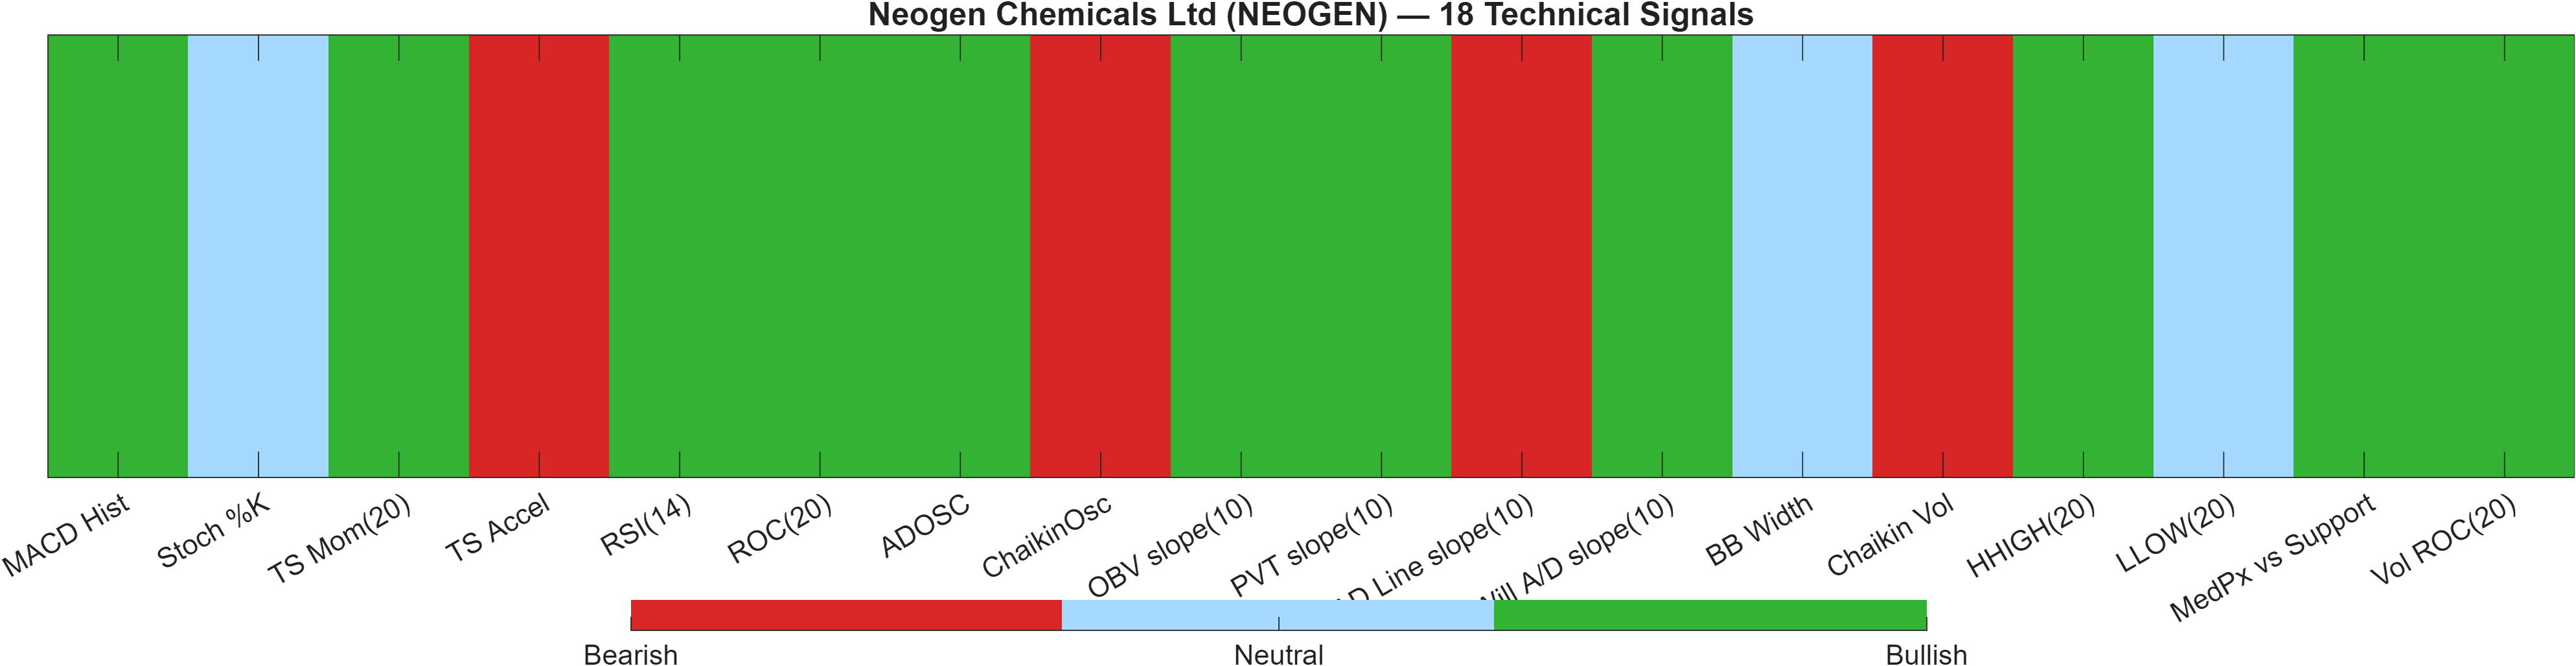
The quant dashboard is notable for breadth of bullish agreement despite the short-term rank drag. The blended view is bullish via two independent aggregations: the DRL technical rank #203 (score 0.668) and the confluence blend (Overall Technical Score 0.473). The distribution (Bull 11 / Bear 4 / Neutral 3) implies that the bullish case is not reliant on a single indicator family.
Where the dashboard adds nuance is in the internal conflicts. Momentum and trend proxies contribute positively (e.g., MACD Hist 1.129 bullish; ROC(20) 17.16 bullish), while a smaller set of indicators point to caution in participation/flow and acceleration (e.g., TS Accel -38.45 bearish; ChaikinOsc -6326 bearish). This combination can occur when trend remains intact but the incremental “push” is moderating—an environment where breakouts require cleaner confirmation and where pullbacks can be sharper than expected.
Volatility/structure signals are not flashing extremes: BB Width 0.1447 is neutral, and oscillators such as Stoch %K 57.27 are neutral, which fits a market that can still move without being fully stretched across all lenses. Overall, the dashboard supports a bullish technical baseline, but the mixed sub-signals argue for anchoring decisions to the key structural levels (1144.7646 / 1719.2250) rather than treating confluence as unconditional.
Signal table (Bull/Bear/Neutral)
| Indicator | Value | Signal |
|---|---|---|
| MACD Hist | 1.129 | Bullish |
| Stoch %K | 57.27 | Neutral |
| TS Mom(20) | 267.5 | Bullish |
| TS Accel | -38.45 | Bearish |
| RSI(14) | 75.54 | Bullish |
| ROC(20) | 17.16 | Bullish |
| ADOSC | 62.41 | Bullish |
| ChaikinOsc | -6326 | Bearish |
| OBV slope(10) | 2.224e+04 | Bullish |
| PVT slope(10) | 453.1 | Bullish |
| AD Line slope(10) | -1.419e+04 | Bearish |
| Will A/D slope(10) | 224.2 | Bullish |
| BB Width | 0.1447 | Neutral |
| Chaikin Vol | 87.35 | Bearish |
| HHIGH(20) | 1880 | Bullish |
| LLOW(20) | 1500 | Neutral |
| MedPx vs Support | 664.7 | Bullish |
| Vol ROC(20) | 205.9 | Bullish |
Technical label summary: Bullish
6) News sentiment + extractive gist
Note: Instrument-specific news matches were not found, so the digest includes broader market/sector headlines. Links are provided for verification.
Sentiment score (avg): 0.150 | Positive: 50% | Neutral: 44% | Negative: 6%
KGNAI AI News Sentiment Score (normalized -1 to +1): 1.00 (as of 2025-11-28) | Label: Bullish | Overall news score: 1.00
Positive Developments
Recent coverage across major financial outlets indicates a broadly constructive backdrop driven by risk appetite returning to select segments and attention shifting toward earnings quality and balance-sheet durability. The aggregate distribution supports that tone, with 50% positive and only 6% negative items in the sample, producing an average sentiment of 0.150. While the digest is not instrument-specific, the common thread is that markets have been differentiating outcomes: post-results narratives highlight profit growth and the market’s focus on forward operating quality rather than headline numbers. In parallel, broader-market commentary suggests intermittent volatility and profit booking, yet with underlying participation in broader indices and active stock selection. For NEOGEN, this backdrop acts more as contextual tailwind than a direct catalyst, meaning price confirmation around 1719.2250 matters more than sentiment alone.
Neutral / Mixed Developments
A meaningful portion of the flow is informational and macro/market-structure oriented, consistent with the 44% neutral split. Coverage points to cross-currents including commodity and ETF flow updates, derivatives positioning commentary, and day-to-day shifts in broader indices. This type of news tends to influence volatility regimes rather than directional conviction, aligning with the technically moderate volatility reading (Bollinger Bandwidth 0.1447). In such an environment, the market often becomes more sensitive to levels and confirmation than to narrative. For NEOGEN, neutral news tone would typically keep attention anchored on whether momentum readings (e.g., MACD histogram 1.1292) translate into sustained price acceptance above resistance.
Negative / Risk Signals
Risk-oriented coverage clusters around policy or framework changes and macro uncertainty that can tighten financial conditions or alter market leadership—factors that can matter even when company-specific headlines are absent. Although the negative share is low at 6%, the presence of risk flags is relevant given NEOGEN’s short-horizon rank weakness (weekly #1041), which can coincide with more fragile tape action during market drawdowns. In practice, the key risk transmission channel is sentiment-to-volatility: if broader risk-off episodes intensify, breakouts can fail and support tests become more frequent. The report’s structural invalidation condition remains central—a close below 1144.7646 would be consistent with deterioration regardless of whether the longer-horizon ranks remain favorable.
What to monitor next
- Whether price can clear 1719.2250 with volume (continuation confirmation).
- Whether volatility expands meaningfully from the 0.1447 bandwidth regime and in which direction.
- Whether short-horizon ranks stabilize (watch the weekly/daily drift against the longer-horizon strength).
Sources referenced: Reuters, Bloomberg, Yahoo Finance, MarketWatch, Investing.com
Snapshot: AI Rank (Short–Mid–Long): Mixed (Bearish–Neutral–Neutral) · Technical Confluence: Bullish · Key Levels: Support ~1144.76 | Resistance ~1719.22 · News Sentiment: Neutral
7) Sources
- Birla Corporation Q4 results: Cons PAT jumps 14% despite marginal revenue uptick; Rs 12.50/share dividend announced — https://economictimes.indiatimes.com/markets/stocks/earnings/birla-corporation-q4-results-cons-pat-jumps-14-despite-marginal-revenue-uptick-rs-12-50/share-dividend-announced/articleshow/130977031.cms
- Ignore market noise, India’s long-term story intact, say D-Street bulls Ramesh Damani and Sunil Singhania — https://economictimes.indiatimes.com/markets/stocks/news/ignore-market-noise-indias-long-term-story-intact-say-d-street-bulls-ramesh-damani-and-sunil-singhania/articleshow/130976742.cms
- Global gold ETF demand rebounds USD 6.6 billion in April; India extends inflow streak to 11 months: World Gold Council — https://economictimes.indiatimes.com/markets/commodities/news/global-gold-etf-demand-rebounds-usd-6-6-billion-in-april-india-extends-inflow-streak-to-11-months-world-gold-council/articleshow/130974858.cms
- F&O Talk: Nifty bulls indecisive but opportunities in broader markets. Sudeep Shah's strategy on Voltas, Tejas and 4 more stocks — https://economictimes.indiatimes.com/markets/expert-view/fo-talk-nifty-bulls-indecisive-but-opportunities-in-broader-markets-sudeep-shahs-strategy-on-voltas-tejas-and-4-more-stocks/articleshow/130974841.cms
- FIIs sell over Rs 2 lakh crore worth of Indian equities in 2026. What lies ahead? — https://economictimes.indiatimes.com/markets/stocks/news/fiis-sell-over-rs-2-lakh-crore-worth-of-indian-equities-in-2026-what-lies-ahead/articleshow/130974794.cms
- Zerodha’s Nithin Kamath flags ULIP, endowment traps; says health policies remain complex — https://economictimes.indiatimes.com/markets/stocks/news/zerodhas-nithin-kamath-flags-ulip-endowment-traps-says-health-policies-remain-complex/articleshow/130972937.cms
- Bitcoin holds near $80,000 after rejection at $82,500; ETF outflows trigger cautious sentiment — https://economictimes.indiatimes.com/markets/cryptocurrency/bitcoin-holds-near-80000-after-rejection-at-82500-etf-outflows-trigger-cautious-sentiment/articleshow/130972440.cms
- 2,00,000% rally! 10 penny stocks that graduated into mid and smallcaps multibaggers — https://economictimes.indiatimes.com/markets/stocks/news/200000-rally-10-penny-stocks-that-graduated-into-mid-and-smallcaps-multibaggers/slideshow/130972119.cms
You may also like: How KGNAI AI ranks instruments across global markets
Disclaimer: KGNAI provides AI-generated analytics and educational market commentary only. This is not financial advice. Markets involve risk. Always do your own research.