
LTIM (LTIMindtree Ltd) — 13-Mar-2026 Technical Confluence Neutral with Bullish Cross-Horizon Ranks
LTIMindtree Ltd (LTIM) screens as structurally strong on KGNAI’s cross-horizon ranking while near-term chart conditions remain more conflicted. Across a 1222-instrument India universe, LTIM holds Bullish rank labels from daily through yearly horizons, including a notably strong Yearly rank of #7, which places it in the top tier of the tracked universe. However, the price/trend layer flags a more cautious backdrop: Close vs MA50 = Bearish and MA50 vs MA200 = Bearish, implying the trend stack is not yet confirming the longer-horizon strength. Momentum adds nuance rather than clarity, with RSI(14) at 28.3 (Bearish) while MACD histogram at 38.7702 points to improving impulse. Volatility is moderate, with Bollinger bandwidth at 0.1493, often consistent with a market waiting for direction. Key decision zones remain defined by support ~4255.8500 and resistance ~6260.3376, which frame confirmation/invalidation for both risk control and regime assessment.
- Rank stance: Short-term Bullish (Daily #142; Weekly #122); Mid-term Bullish (Monthly #72; 3-Monthly #144); Long-term Bullish (6-Monthly #53; Yearly #7).
- Technical confluence: Neutral (18-signal confluence -0.056; Overall Technical Score 0.024; DRL technical rank #482/1222).
- Key levels: Support 4255.8500 | Resistance 6260.3376.
- News sentiment bias: Mixed-to-neutral distribution (-0.011 avg; 19% positive / 63% neutral / 19% negative) alongside a Bullish normalized sentiment read (1.00, as of 2026-02-05).
- Confirmation / invalidation: A break above 6260.3376 with volume supports continuation; a close below 4255.8500 increases deterioration risk per the scenario framework.
KGNAI evaluates assets using large cross-sectional datasets built from millions of structured data points. Inputs incorporate fundamental metrics, technical structures, and systematically processed news sentiment. Statistical models, machine learning, and AI frameworks are used to assess relative positioning, signal alignment, and probabilistic behavior across broad universes.
- Ranks are comparative across the tracked universe, not absolute price targets.
- Confluence reflects alignment among independent signal groups.
- Support/resistance levels are probabilistic decision zones, not guarantees.
- Sentiment provides contextual bias within the broader analytical framework.
1) KGNAI AI Analysis
Region: INDIA
Total universe size: 1222 ranked instruments
- Daily rank: #142 out of 1222 — Bullish
- Weekly rank: #122 out of 1222 — Bullish
- Monthly rank: #72 out of 1222 — Bullish
- 3-Monthly rank: #144 out of 1222 — Bullish
- 6-Monthly rank: #53 out of 1222 — Bullish
- Yearly rank: #7 out of 1222 — Bullish
LTIM’s ranking profile is unusually consistent: each horizon is labeled Bullish, yet the specific ranks reveal different strengths across time. The Yearly rank (#7) places LTIM in the top tier of the full 1222-instrument universe, suggesting durable relative positioning when the model emphasizes longer-memory behaviors. The 6-Monthly rank (#53) sits in the upper tranche as well, indicating the longer-term edge is not purely historical—it remains present in intermediate data.
By contrast, the shorter horizons are strong but less dominant: Daily #142 and Weekly #122 imply upper-quartile style strength rather than outright leadership. The Monthly rank (#72) is stronger than the daily/weekly readings, while the 3-Monthly rank (#144) softens again—an internal pattern consistent with a name that has retained long-horizon quality but is still negotiating shorter-cycle positioning.
This is a classic alignment-with-friction setup: long-horizon rank leadership (Yearly #7) exists alongside less forceful near-term ranks (Daily/3-Monthly around the low- to mid-100s). In practice, that combination tends to reward discipline around confirmation—using technical confluence, trend structure, and level behavior to determine whether short-horizon weakness is resolving or persisting.
KGNAI ranks each instrument across large universes using multiple proprietary AI tests and statistical models (millions of data points). Lower ranks generally indicate stronger probability of favorable performance behavior, while higher ranks indicate weaker probability and more bearish positioning.
Term view: Short-term: Bullish. Mid-term: Bullish. Long-term: Bullish.
Want the full universe and complete rank tables? Unlock full access on KGNAI: https://www.kgnai.com/pricing
2) Price & trend overview
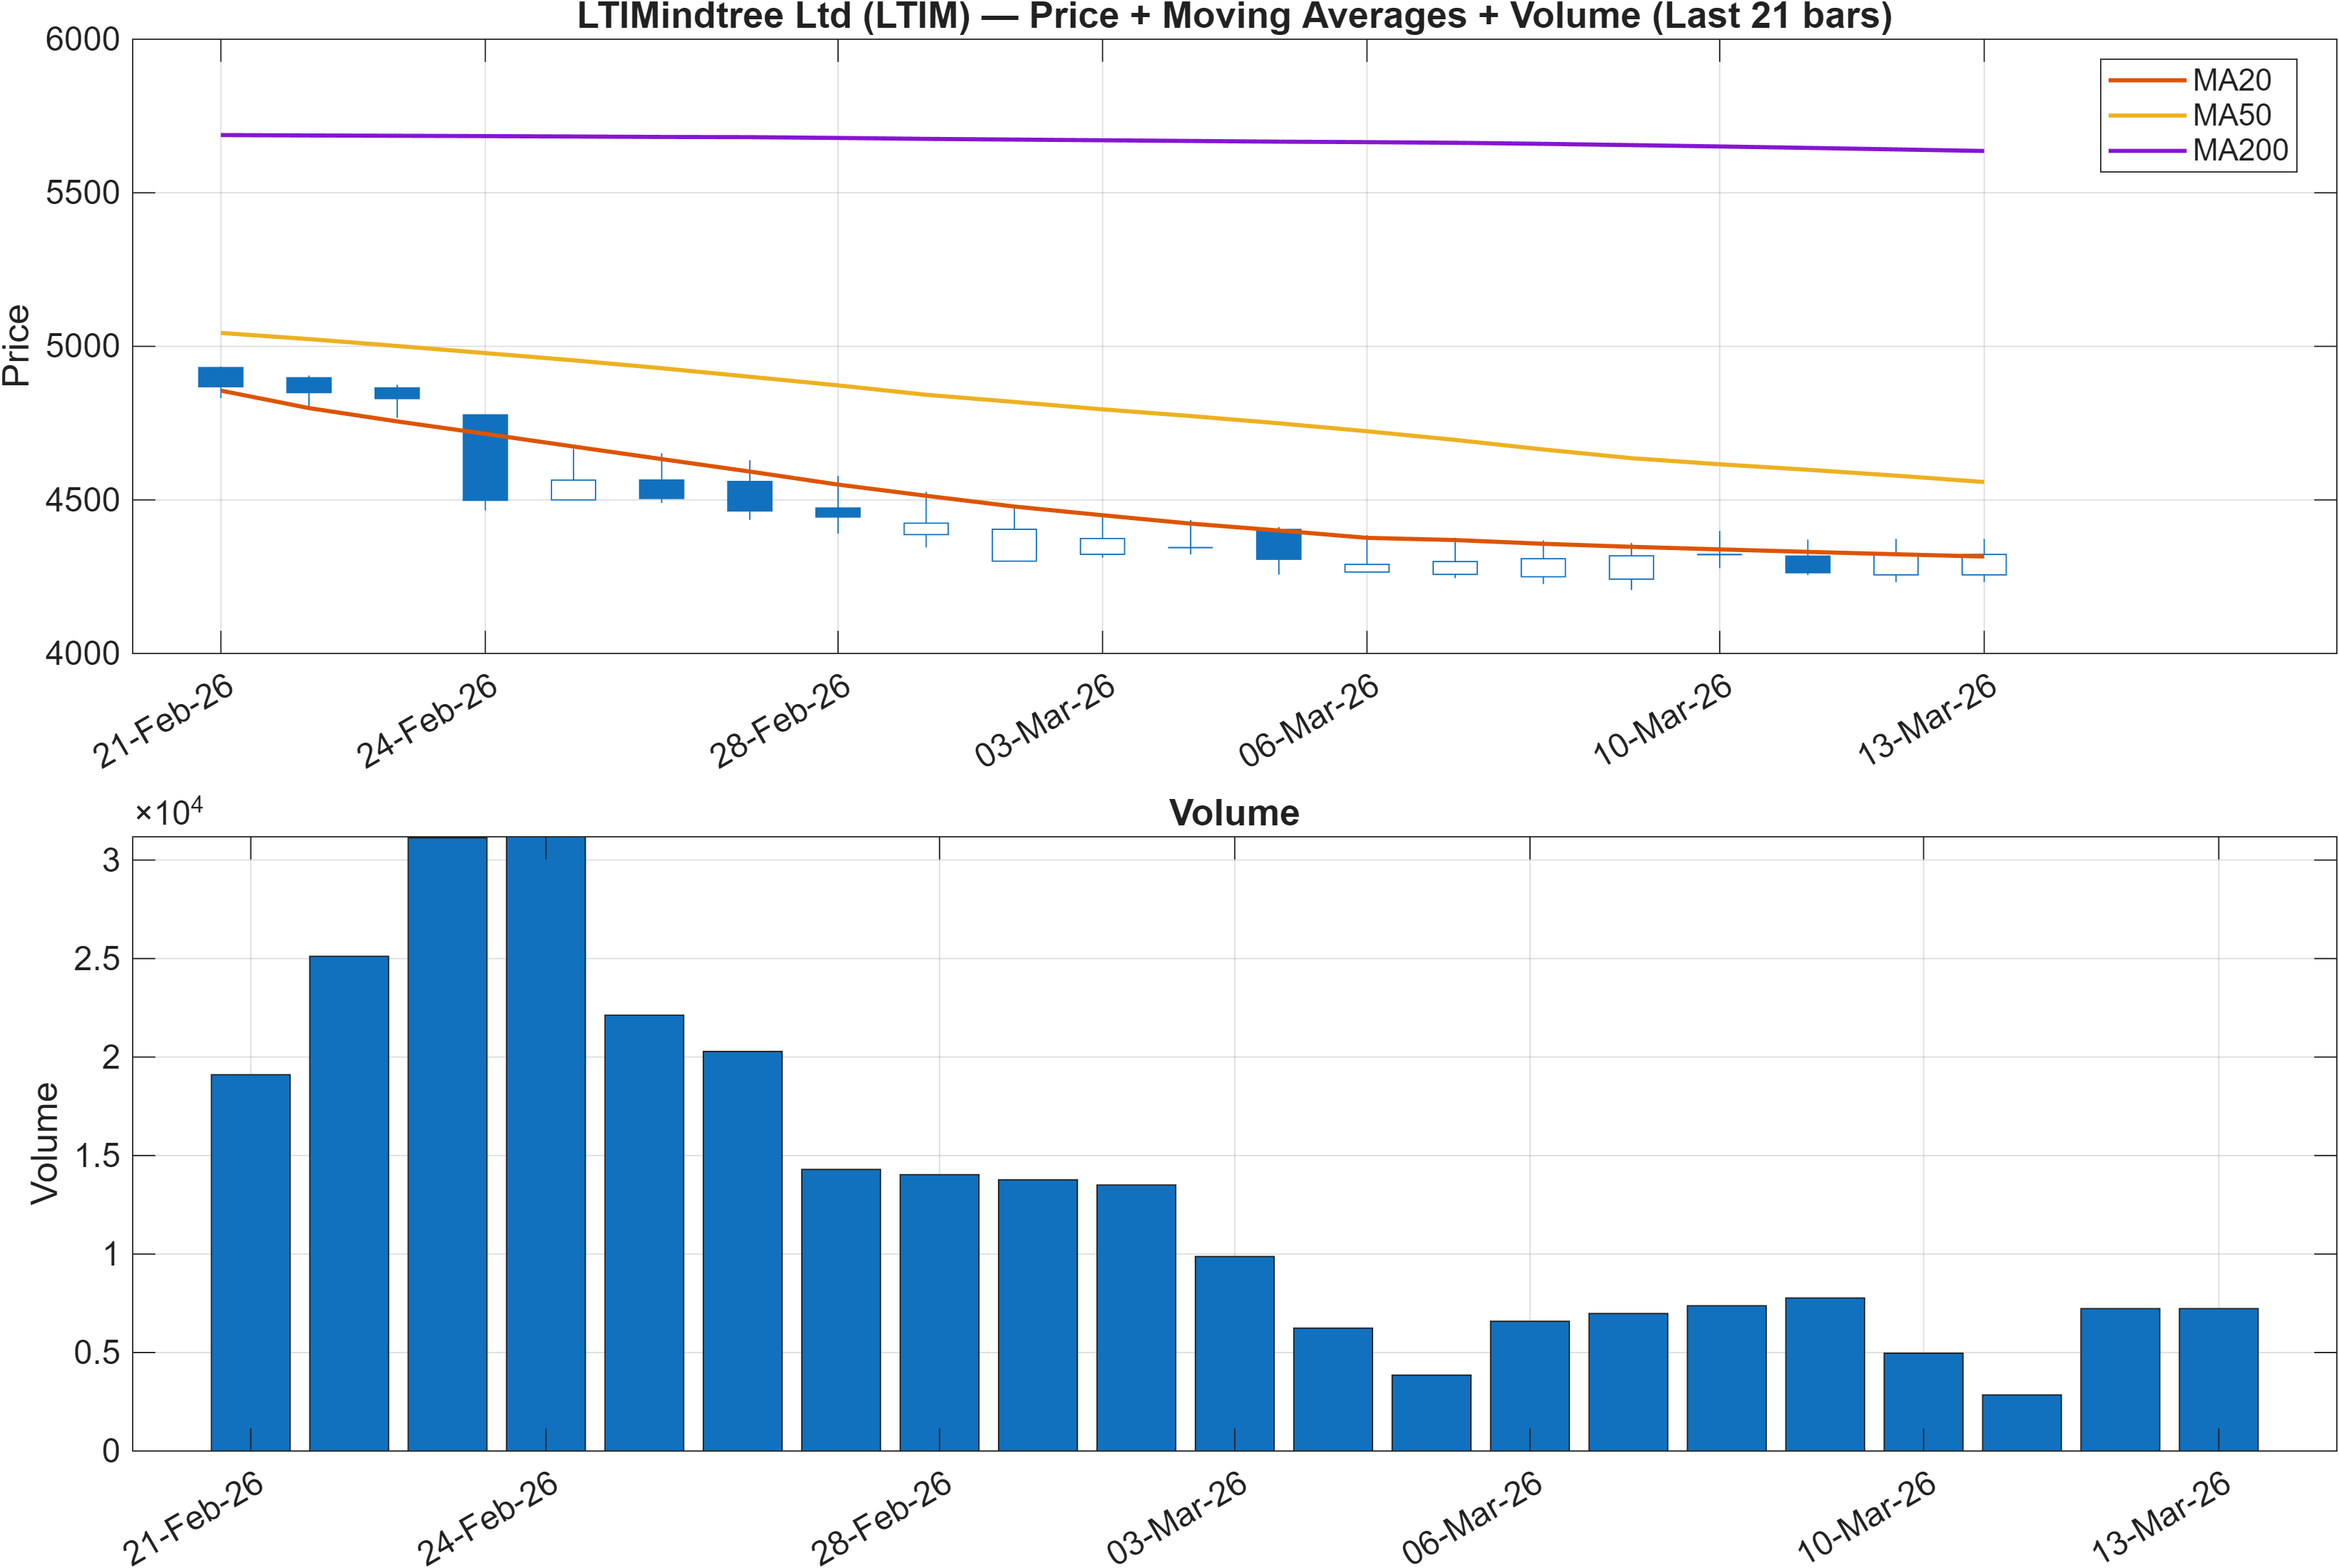
Interpretation: Close vs MA50 = Bearish, MA50 vs MA200 = Bearish.
Trend structure vs rank strength
The trend layer is a clear point of tension versus the rank stack. With Close vs MA50 = Bearish and MA50 vs MA200 = Bearish, the moving-average structure indicates the market is not yet in a clean trend-confirmation regime. This matters because the rank profile is broadly bullish—including the Yearly rank of #7—but the price regime is still behaving like a corrective or rebuilding phase.
When both the shorter average relationship (close vs MA50) and the longer relationship (MA50 vs MA200) are bearish at the same time, the common failure mode is false starts: rallies can occur but struggle to persist until the trend stack improves. That is consistent with the platform’s emphasis on confirmation zones rather than point forecasts, and it increases the analytical importance of the nearby decision levels (support ~4255.8500 and resistance ~6260.3376).
Volume is included in the visual framework, and the scenario language explicitly ties continuation to a break above resistance with volume. In a bearish MA structure, a high-quality resolution tends to require evidence that participation is expanding, not merely that price is bouncing. The near-term ranks (for example, Daily #142 and Weekly #122) being bullish but not top-tier fits a market that is improving internally but has not yet converted that improvement into a clean trend signal.
3) Momentum & volatility dashboard
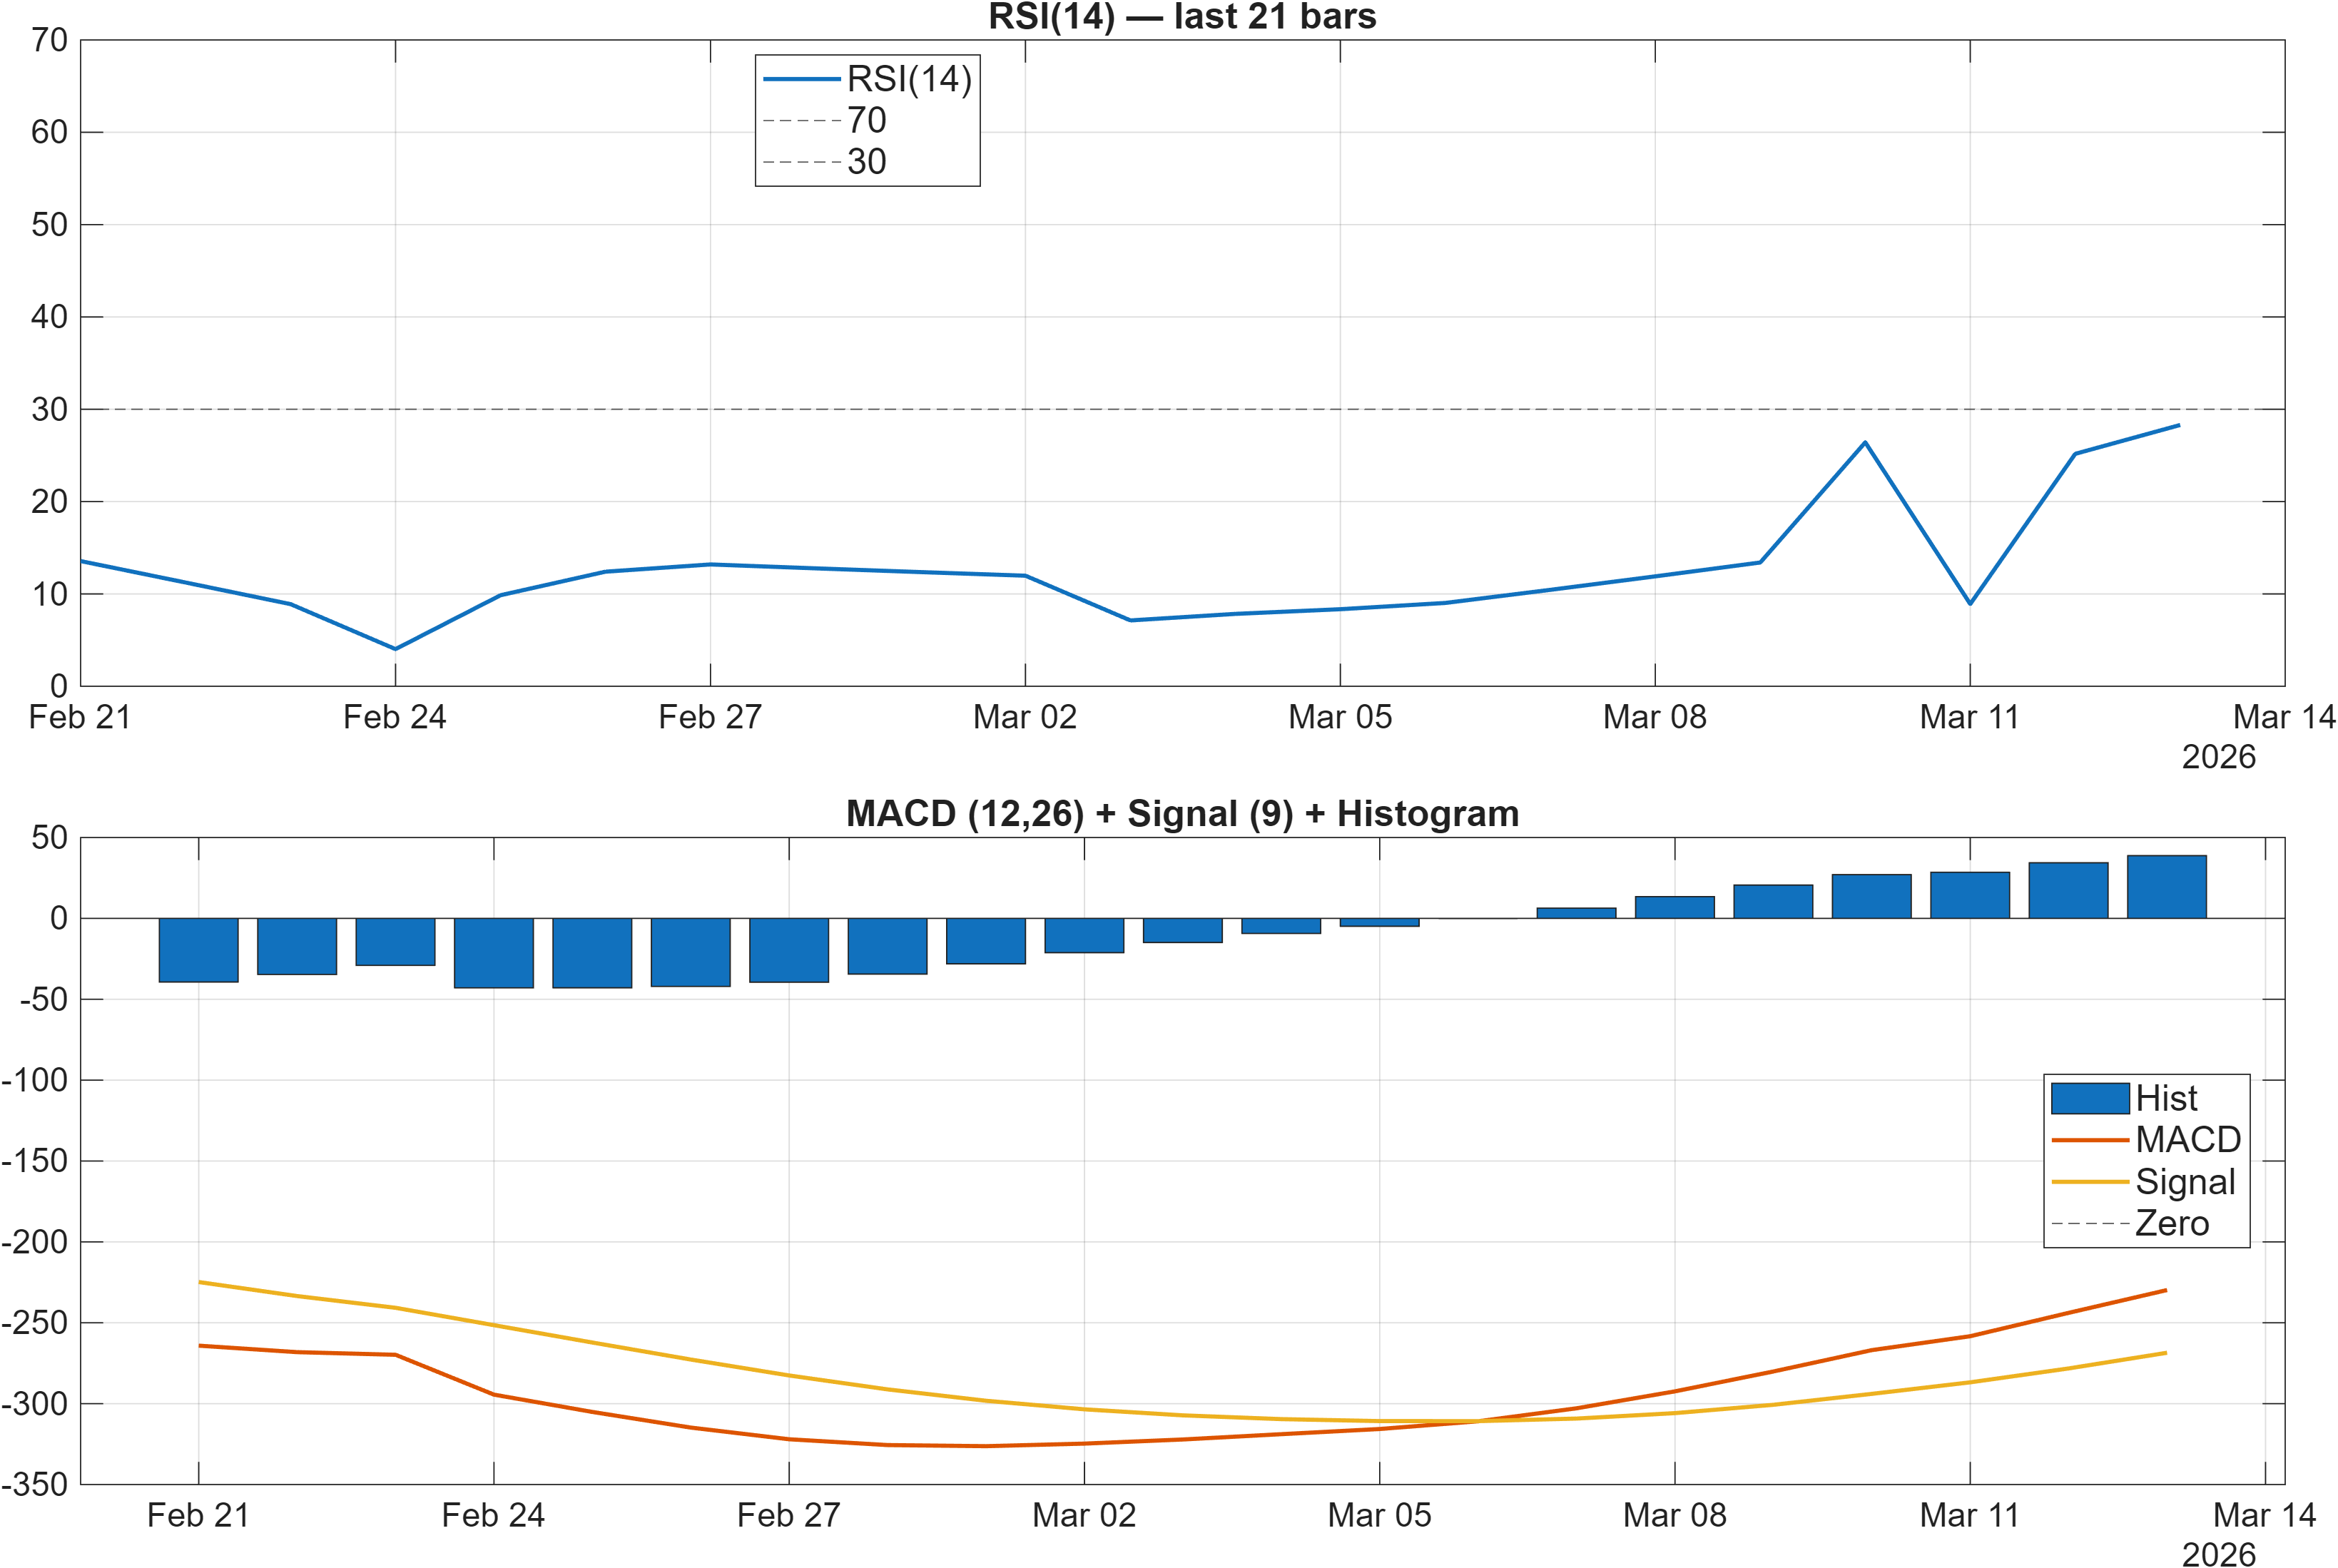
Interpretation: RSI bias = Bearish, MACD hist = 38.7702.
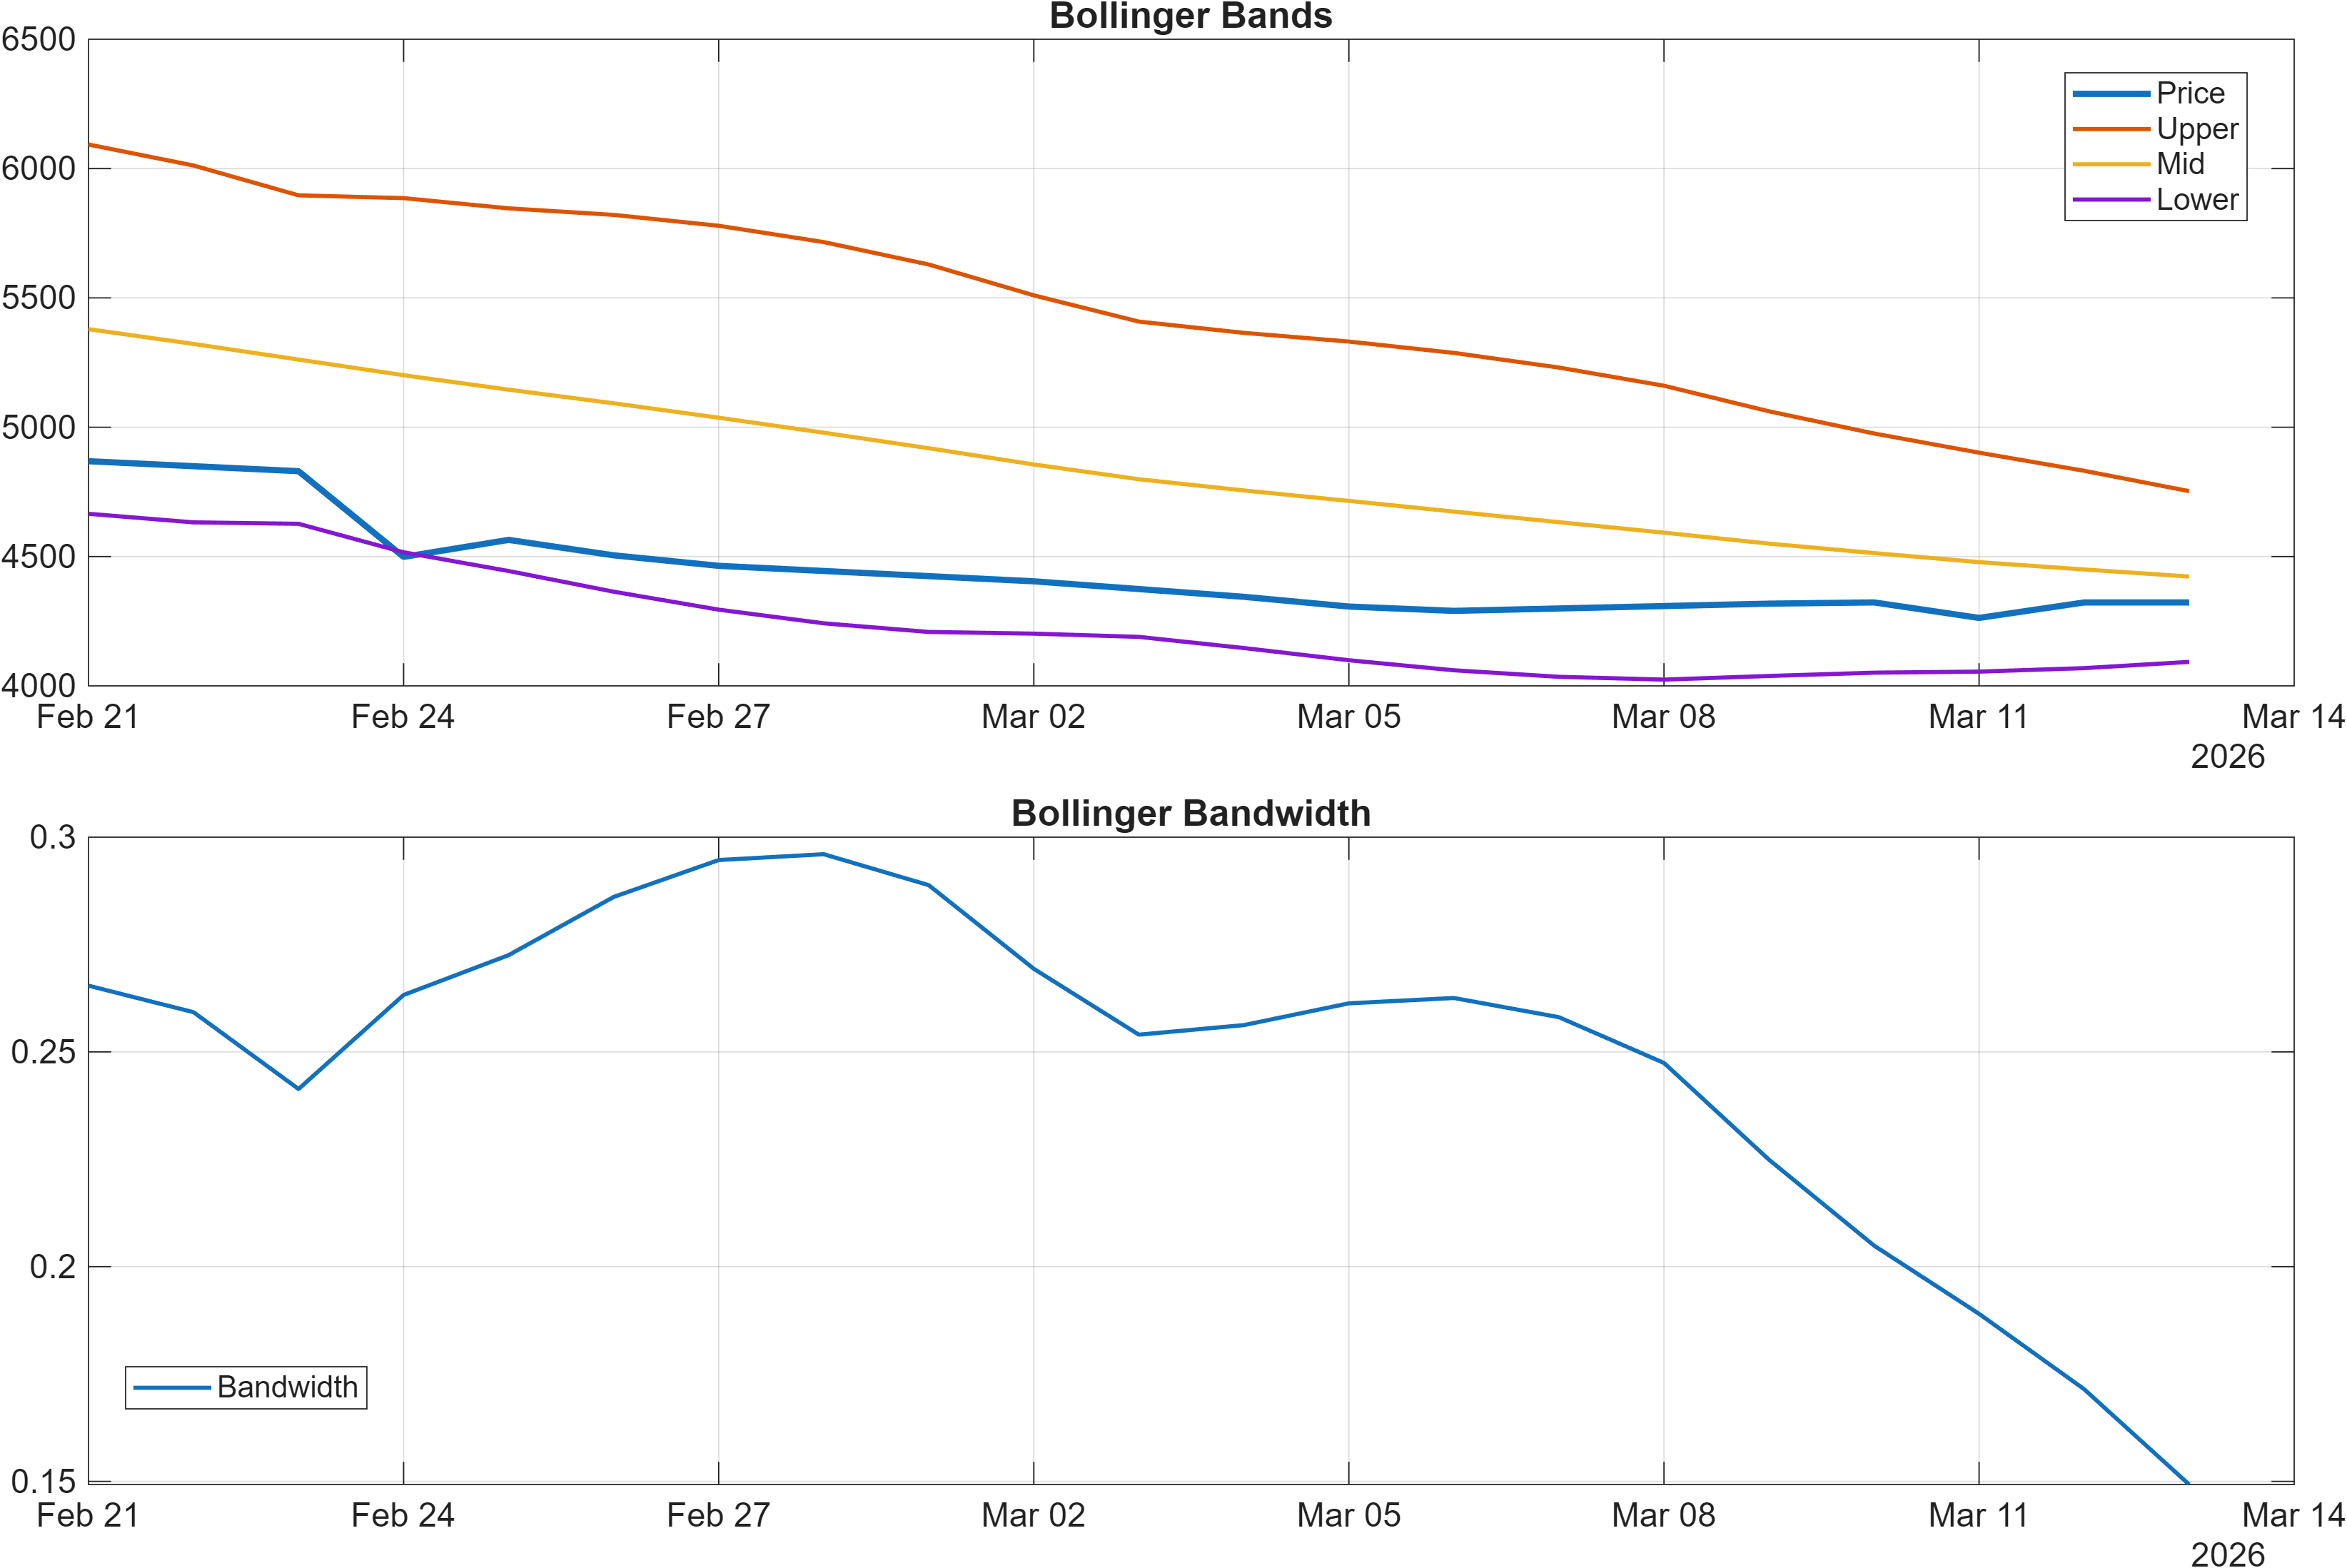
Interpretation: Bandwidth (volatility regime) latest = 0.1493.
Momentum divergence and regime pressure
Momentum signals are split in a way that frequently precedes regime transition attempts rather than immediate follow-through. On one hand, RSI(14) is 28.3 with a Bearish bias, which is consistent with downside pressure and weak near-term trend health. On the other hand, the MACD histogram is 38.7702, which points to improving impulse versus prior periods and can be compatible with stabilization—especially when viewed alongside bullish longer-horizon ranks (notably Yearly #7).
This RSI/MACD split is best treated as divergence rather than confirmation. RSI at 28.3 indicates the market has been pushed into a weak momentum state; if price action remains below the MA50 (as flagged in Section 2), RSI weakness can persist longer than expected. The MACD histogram being positive does not negate that weakness; instead, it suggests downside momentum may be decelerating even if trend remains unhealed.
Volatility is not extreme: Bollinger bandwidth at 0.1493 signals a moderate regime rather than a high-stress expansion. Moderate bandwidth often reduces the probability that a single session “solves” the trend problem; instead, it tends to produce more level-to-level trading where support/resistance outcomes matter. In this context, momentum improvement would be more convincing if it coincides with a level break (resistance) or a durable defense (support), rather than standing alone as indicator noise.
4) Support / Resistance zones
Support ~ 4255.8500 | Resistance ~ 6260.3376
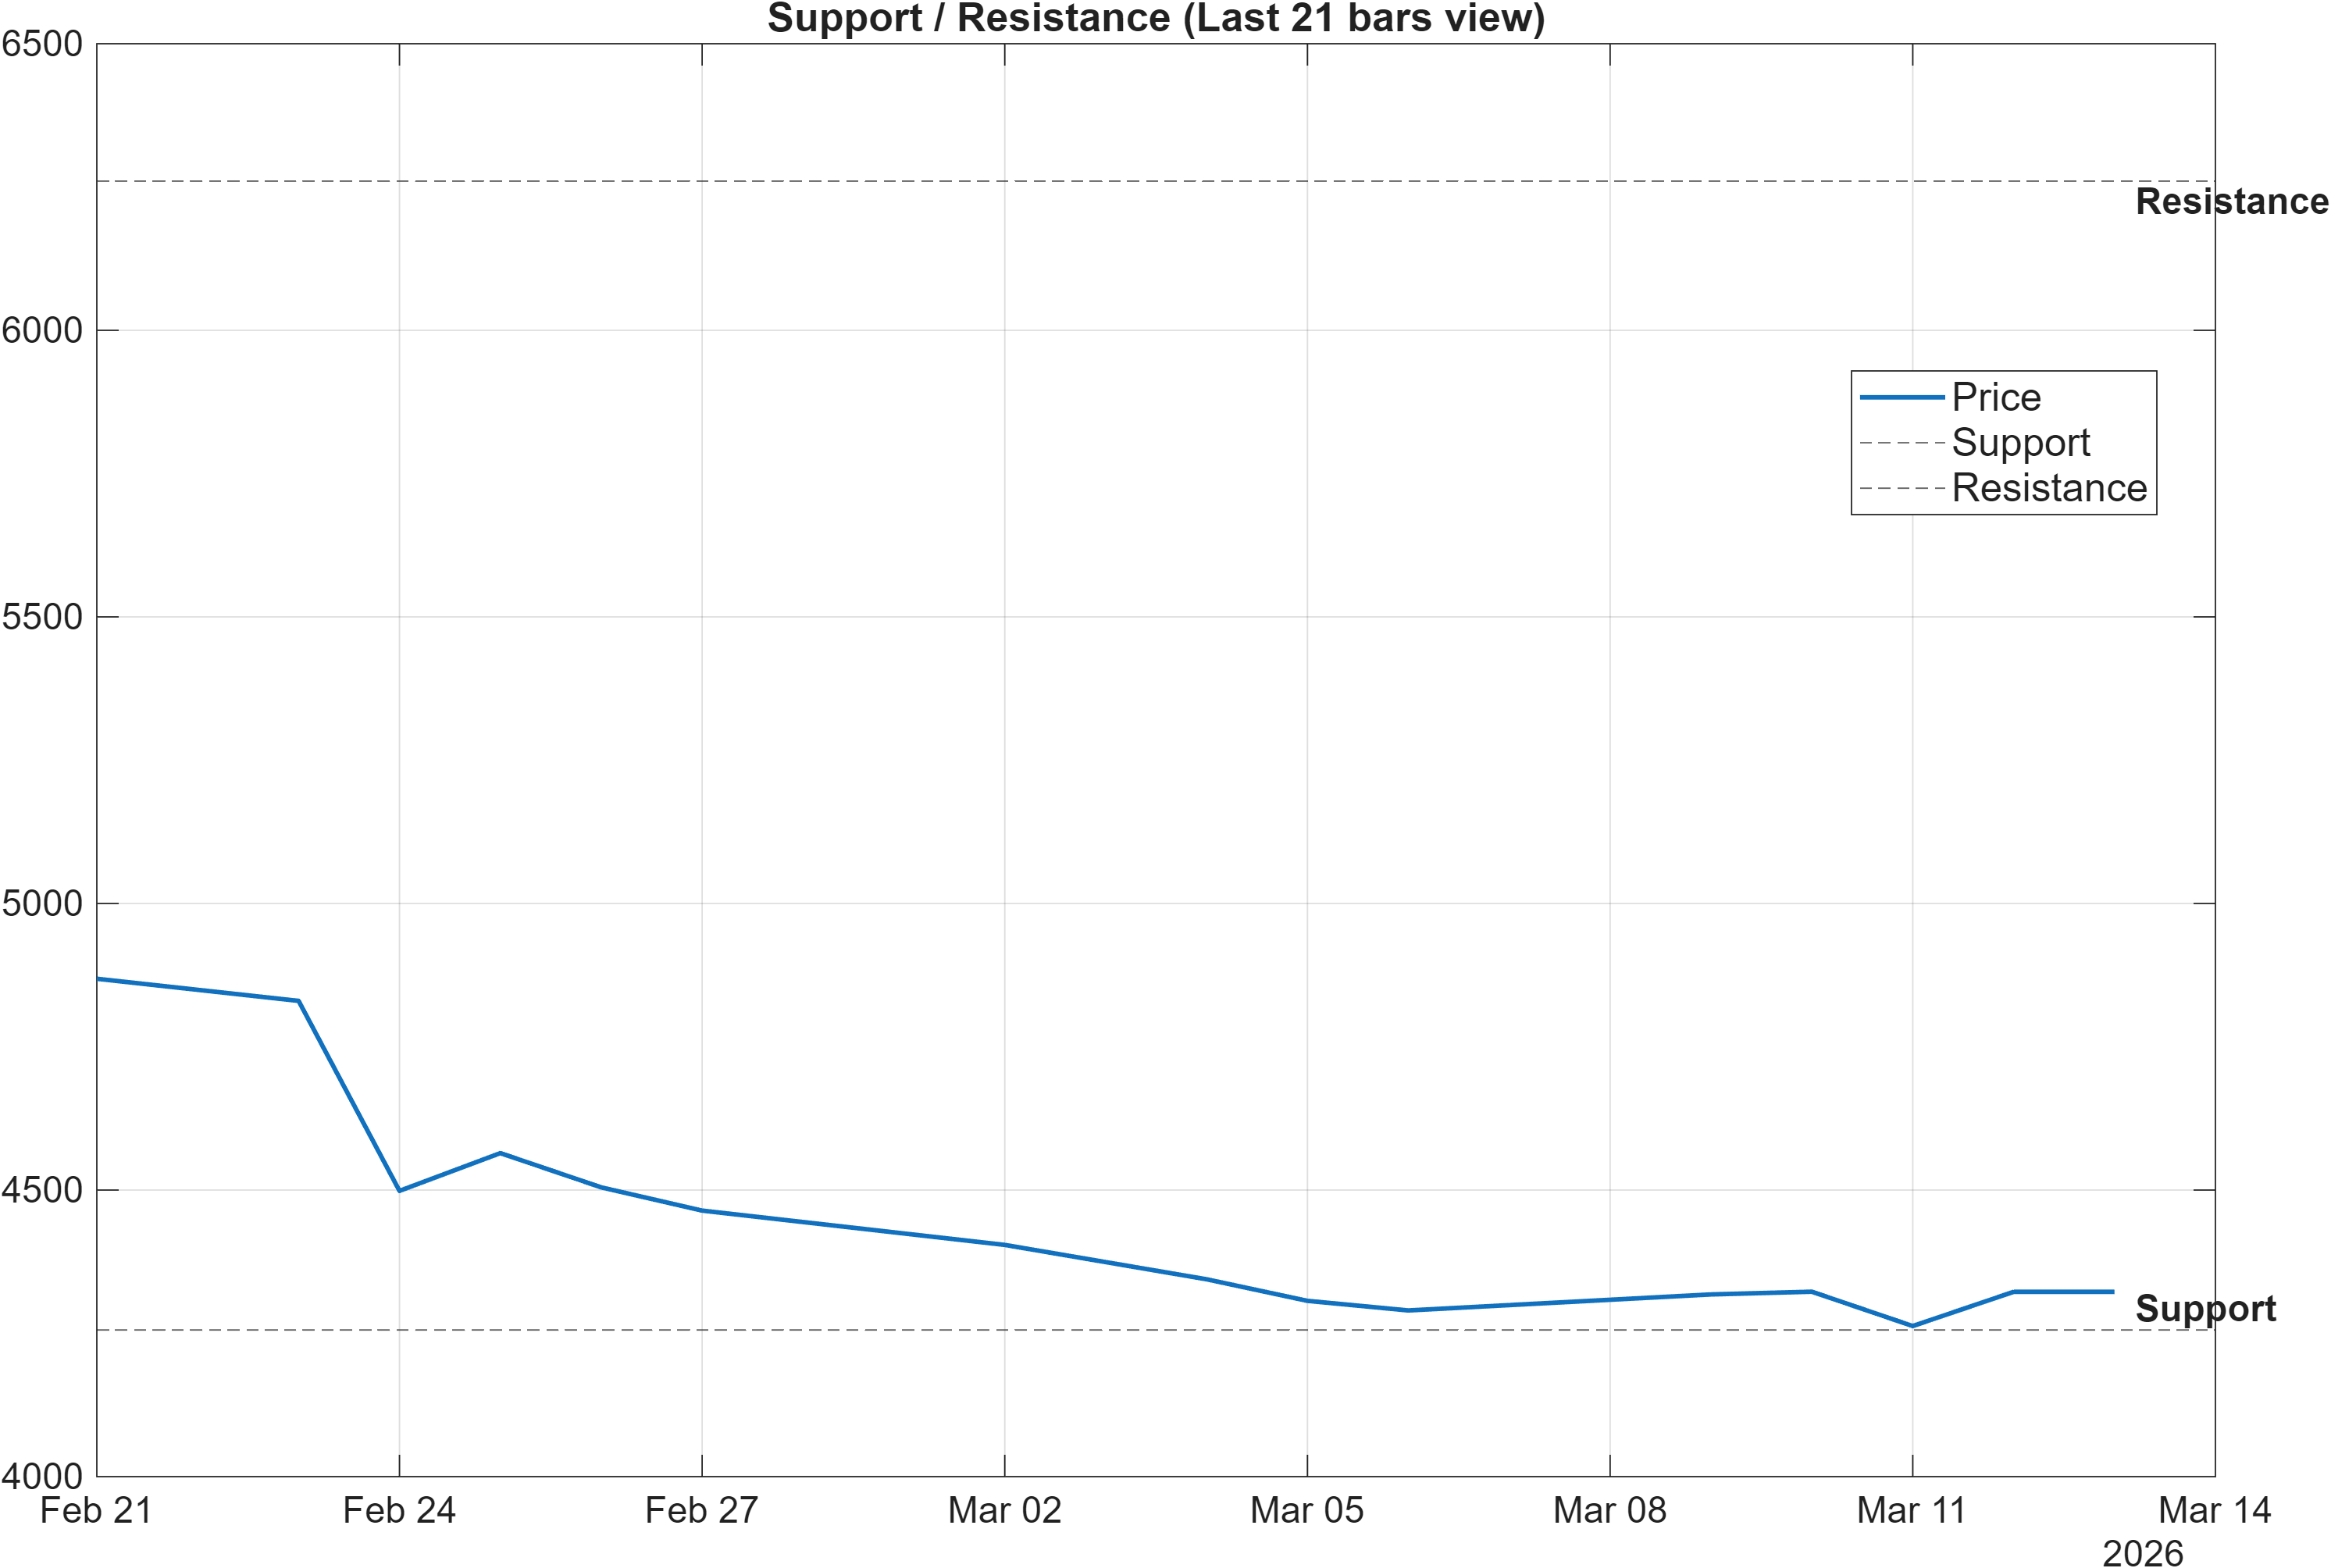
Scenario view: Break above resistance with volume → continuation. Close below support → signal deterioration risk.
Probabilistic decision zones: confirmation vs invalidation
The level framework is the cleanest way to reconcile LTIM’s bullish rank stack with its currently bearish trend structure. The market is given a wide but explicit range: support ~4255.8500 and resistance ~6260.3376. Rather than implying a forecast, these zones act as decision points for whether improvement is becoming durable or whether weakness is reasserting itself.
The scenario language is asymmetric in a useful way. A break above 6260.3376 with volume is framed as continuation—importantly, it requires both price and participation. That is consistent with the earlier bearish MA stack (Close vs MA50 bearish; MA50 vs MA200 bearish): without volume confirmation, upside attempts can remain mean-reversion moves inside a larger repair process. Conversely, a close below 4255.8500 is explicitly tagged as deterioration risk, which aligns with the weak momentum state visible in RSI(14) at 28.3.
The wide separation between support and resistance also reinforces that this is not a “micro-level” setup. It is more consistent with a market navigating a broader re-pricing or re-accumulation process, where long-horizon relative strength (e.g., Yearly rank #7) can coexist with short-horizon fragility. In such conditions, the highest-quality signals tend to be level-driven: either the market proves it can reclaim control above resistance, or it fails by losing support and extending the bearish regime.
5) Quant Technical Dashboard (18 Signals)
KGNAI AI Technical Analysis Score (Deep Reinforcement Learning): Rank #482 out of 1222 (Rank 1 represents the strongest technical positioning and a higher probability of favorable price behavior. As ranks increase toward the maximum, the probability of favorable outcomes weakens and bearish positioning becomes more dominant.) | Label: Neutral | Score: 0.211
18-Signal Technical Confluence Score: -0.056 (Neutral)
Overall Technical Score (18-signal confluence + DRL rank blend): 0.024 (Neutral)
Note: The blended score reflects signal strength weighted against broader AI technical ranking, which may temporarily diverge.
Blended technical score breakdown: 0.024 (Neutral | Bull 6 / Bear 7 / Neutral 5)
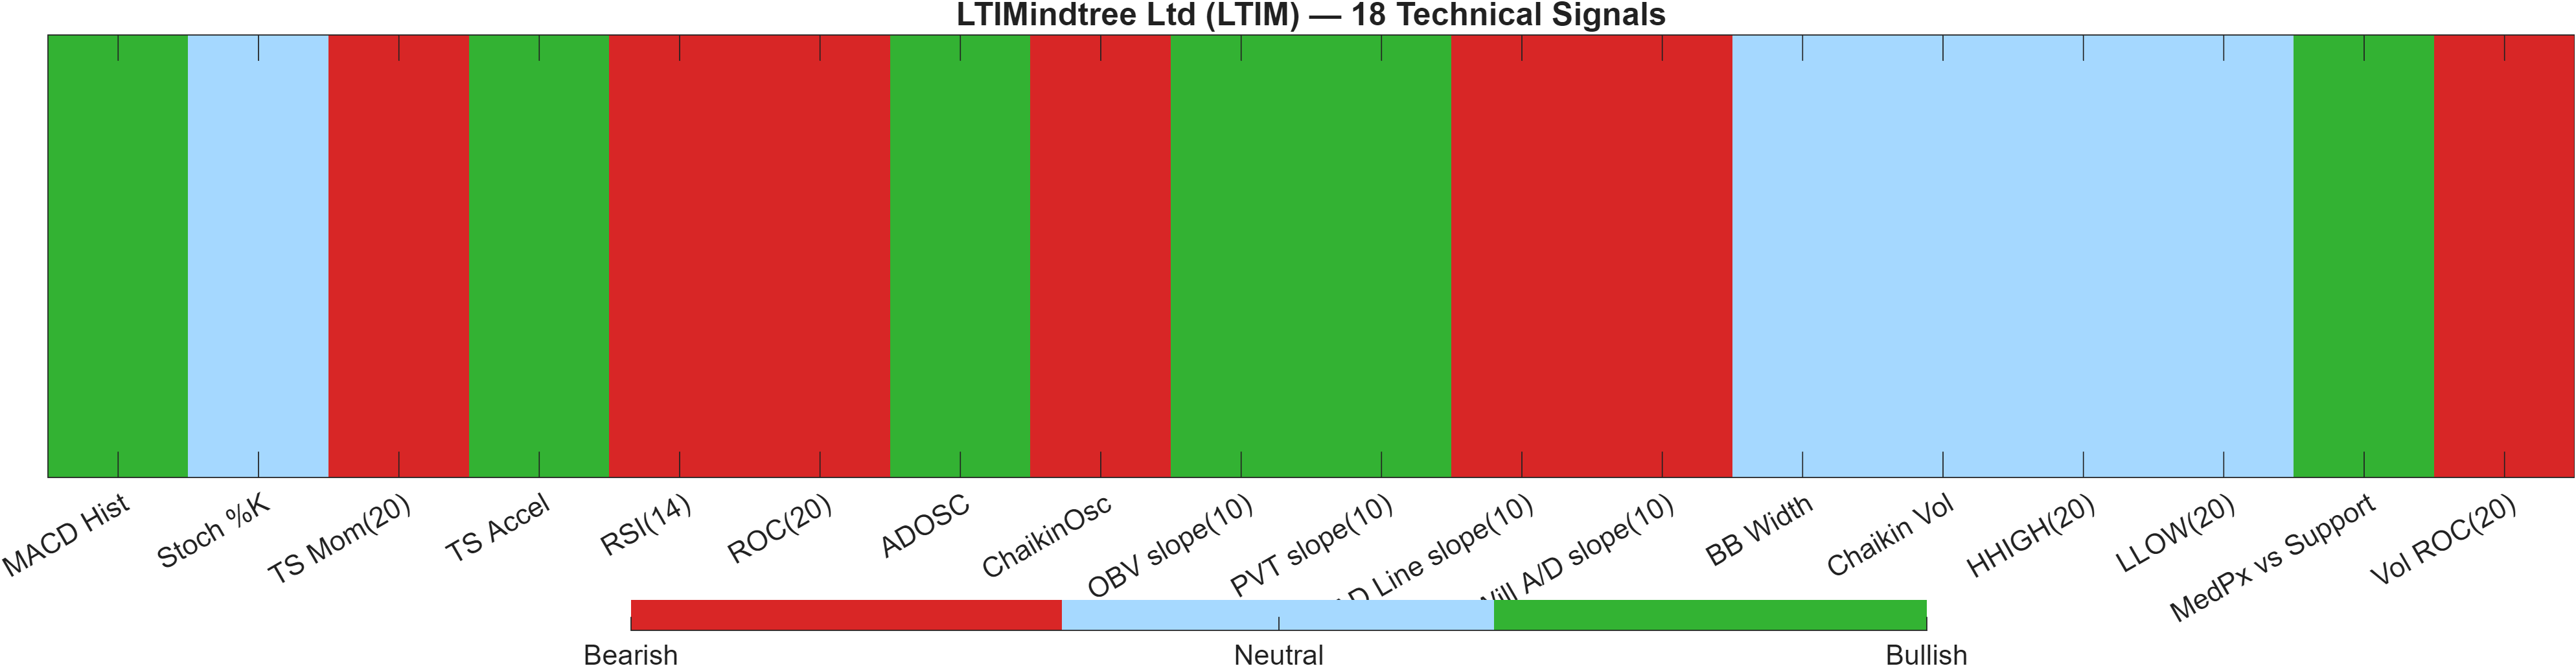
Signal-level balance: why “Neutral” is analytically meaningful here
| Indicator | Value | Signal |
|---|---|---|
| MACD Hist | 38.77 | Bullish |
| Stoch %K | 50.89 | Neutral |
| TS Mom(20) | -526.9 | Bearish |
| TS Accel | 662.9 | Bullish |
| RSI(14) | 28.3 | Bearish |
| ROC(20) | -10.87 | Bearish |
| ADOSC | 73.62 | Bullish |
| ChaikinOsc | -2637 | Bearish |
| OBV slope(10) | 1.48e+04 | Bullish |
| PVT slope(10) | 13.51 | Bullish |
| AD Line slope(10) | -5190 | Bearish |
| Will A/D slope(10) | -15.05 | Bearish |
| BB Width | 0.1493 | Neutral |
| Chaikin Vol | -12.63 | Neutral |
| HHIGH(20) | 4905 | Neutral |
| LLOW(20) | 4206 | Neutral |
| MedPx vs Support | 46.72 | Bullish |
| Vol ROC(20) | -71.21 | Bearish |
Interpretation: Indicator-level signals form the base confluence, which is then adjusted using a separate AI-driven technical ranking model. The final technical score summarizes this combined view.
The technical dashboard is best summarized as signal compression: there is no dominant technical impulse even though several components are active. The composite reads 18-Signal Technical Confluence Score of -0.056 (Neutral) and Overall Technical Score of 0.024 (Neutral), while the AI technical model places LTIM at DRL rank #482/1222 (Neutral, score 0.211). That combination typically reflects a market where directional conviction is not broadly synchronized across indicator families.
Internally, the breakdown (Bull 6 / Bear 7 / Neutral 5) highlights why trend confirmation (Section 2) and levels (Section 4) are likely to do more analytical work than any single oscillator. For example, MACD Hist 38.77 (Bullish) supports the idea of improving impulse, but it is counterweighted by weakness in classic momentum and rate-of-change measures such as RSI(14) 28.3 (Bearish) and ROC(20) -10.87 (Bearish). Volume dynamics are also mixed: OBV slope(10) 1.48e+04 (Bullish) contrasts with Vol ROC(20) -71.21 (Bearish), suggesting participation quality may not be uniformly improving.
With volatility sitting near BB Width 0.1493 (Neutral), the most robust interpretation is that the tape is in a selection phase. Until the score migrates away from neutral or the market resolves through support/resistance, the technical layer argues for tighter confirmation standards despite LTIM’s favorable cross-horizon ranks.
6) News sentiment + extractive gist
Note: Instrument-specific news matches were not found, so the digest includes broader market/sector headlines. Links are provided for verification.
Sentiment score (avg): -0.011 | Positive: 19% | Neutral: 63% | Negative: 19%
KGNAI AI News Sentiment Score (normalized -1 to +1): 1.00 (as of 2026-02-05) | Label: Bullish | Overall news score: 0.97
Positive Developments
Recent coverage across major financial outlets indicates a modest constructive undertone around risk assets and market structure themes, even if the digest is not LTIM-specific. Parts of the flow highlight continued institutional activity and transactions in listed equities, which can be interpreted as evidence that liquidity remains present despite choppy tape. In parallel, discussions about potential adjustments to reporting conventions and capital rules point to an environment where policy and market microstructure are under active review—often supportive of participation when uncertainty is managed rather than ignored. Within KGNAI’s framework, this backdrop is consistent with why the normalized news input can read Bullish (1.00) even while the average sentiment distribution remains close to flat. For LTIM, the practical implication is that a supportive macro-news tone may help sustain higher-level demand if technical confirmation improves, especially near the resistance zone at 6260.3376.
Neutral / Mixed Developments
The dominant signal in the news distribution is neutrality: 63% neutral with the average sentiment at -0.011 suggests information flow is not consistently directional. Several items read as informational rather than catalytic—emphasizing patience during volatility and incremental policy tweaks rather than discrete shocks. For a chart already showing mixed technical signals (e.g., Neutral confluence at -0.056 and a Neutral overall score of 0.024), a neutral news regime tends to reinforce range-based behavior where support/resistance outcomes dominate. This aligns with the moderate volatility condition implied by Bollinger bandwidth 0.1493, where the market can digest information without forced repricing.
Negative / Risk Signals
Risk framing across the broader digest centers on geopolitics, energy/inflation sensitivity, and the possibility of renewed volatility around policy expectations. Such themes can raise the market’s discount rate for duration-like equities and contribute to tactical de-risking—conditions that can keep shorter-horizon momentum pressured even when longer-horizon ranks remain favorable. The sentiment split shows 19% negative, which is not dominant but meaningful in a market where trend confirmation is already lacking (Close vs MA50 = Bearish; MA50 vs MA200 = Bearish). For LTIM, the key risk is not the existence of negative headlines but whether they coincide with technical fragility—most importantly, any close below 4255.8500, which the scenario framework explicitly flags as deterioration risk.
- Whether price action can reclaim trend structure (bearish MA stack) while approaching 6260.3376.
- Any volatility expansion from 0.1493 that shifts conditions from compression to directional movement.
- Whether sentiment remains mixed/neutral or turns risk-off as macro uncertainty evolves.
Sources referenced: Reuters, Bloomberg, Yahoo Finance, MarketWatch, Investing.com
Snapshot: AI Rank (Short–Mid–Long): Bullish (Bullish–Bullish–Bullish) · Technical Confluence: Neutral · Key Levels: Support ~4255.85 | Resistance ~6260.34 · News Sentiment: Neutral
7) Sources
- Global stocks: Canada's top exchange pushes to end quarterly reporting for all firms — https://economictimes.indiatimes.com/markets/us-stocks/news/global-stocks-canadas-top-exchange-pushes-to-end-quarterly-reporting-for-all-firms/articleshow/129517330.cms
- US Stocks: Big bank capital requirements to fall "small amount" under new plan, says Fed — https://economictimes.indiatimes.com/markets/us-stocks/news/us-stocks-big-bank-capital-requirements-to-fall-small-amount-under-new-plan-says-fed/articleshow/129515393.cms
- Innovision extends IPO till March 17 after failing to reach full subscription, lowers price band — https://economictimes.indiatimes.com/markets/ipos/fpos/innovision-extends-ipo-till-march-17-after-failing-to-reach-full-subscription-lowers-price-band/articleshow/129515327.cms
- US Stocks: When stock markets get shaken, it can pay for investors to be patient — https://economictimes.indiatimes.com/markets/us-stocks/news/us-stocks-when-stock-markets-get-shaken-it-can-pay-for-investors-to-be-patient/articleshow/129514510.cms
- Ahead of Market: 10 things that will decide stock market action on Friday — https://economictimes.indiatimes.com/markets/stocks/news/ahead-of-market-10-things-that-will-decide-stock-market-action-on-friday/articleshow/129514362.cms
- BofA Securities enters Kaynes Technologies via Rs 42 crore block deal; stock down 48% in six months — https://economictimes.indiatimes.com/markets/stocks/news/bofa-securities-enters-kaynes-technologies-via-rs-42-crore-block-deal-stock-down-48-in-six-months/articleshow/129514218.cms
- Market Trading Guide: Buy NALCO and Tata Power on Friday for gains up to 15% — https://economictimes.indiatimes.com/markets/stocks/news/market-trading-guide-buy-nalco-and-tata-power-on-friday-for-gains-up-to-15/articleshow/129513438.cms
- US Stocks: US Fed to cut rates in June, economists say, despite war inflation risks — https://economictimes.indiatimes.com/markets/us-stocks/news/us-stocks-us-fed-to-cut-rates-in-june-economists-say-despite-war-inflation-risks/articleshow/129512949.cms
You may also like: How KGNAI AI ranks instruments across global markets
Disclaimer: KGNAI provides AI-generated analytics and educational market commentary only. This is not financial advice. Markets involve risk. Always do your own research.