
MUFTI — Credo Brands Marketing Limited | 11-Mar-2026 — Bearish rank alignment with weak technical positioning
Credo Brands Marketing Limited (MUFTI) enters 11-Mar-2026 with consistently weak cross-sectional positioning across KGNAI’s ranked INDIA universe (1223 instruments), while price structure remains below key moving-average references. Daily (#1162), weekly (#1173), and monthly (#1144) ranks sit in the lower tail of the universe, reinforcing a bearish probability bias in the short-to-mid horizon rather than a single-day anomaly. Momentum diagnostics also lean negative: RSI(14) at 31.03 reflects persistent downside pressure, and the MACD histogram at -0.1401 indicates trend-following momentum remains unfriendly. Volatility conditions are not signaling an obvious reset, with Bollinger Bandwidth at 0.1187 suggesting neither extreme compression nor an expanded capitulation regime. The nearest decision zones remain clearly defined at support ~80.5450 and resistance ~99.9950. News sentiment is modestly positive in aggregate (0.088) but lacks instrument-specific matches, so it functions as contextual backdrop rather than a catalyst signal.
- Rank stance (Short / Mid / Long): Bearish / Bearish / Not available (daily #1162, weekly #1173, monthly #1144 out of 1223)
- Technical confluence label: 18-signal confluence Neutral (-0.222) with blended technical score Bearish (-0.432)
- Key levels: Support ~80.5450; Resistance ~99.9950
- News sentiment bias: Slightly positive/neutral (avg 0.088; 37% positive, 56% neutral, 6% negative) with instrument-specific matches not found
- Confirmation / invalidation condition: A sustained break above 99.9950 with volume would improve continuation odds; a close below 80.5450 increases deterioration risk
KGNAI evaluates assets using large cross-sectional datasets built from millions of structured data points. Inputs incorporate fundamental metrics, technical structures, and systematically processed news sentiment. Statistical models, machine learning, and AI frameworks are used to assess relative positioning, signal alignment, and probabilistic behavior across broad universes.
- Ranks are comparative across the tracked universe, not absolute price targets.
- Confluence reflects alignment among independent signal groups.
- Support/resistance levels are probabilistic decision zones, not guarantees.
- Sentiment provides contextual bias within the broader analytical framework.
1) KGNAI AI Analysis
Region: INDIA
Total universe size: 1223 ranked instruments
- Daily rank: #1162 out of 1223 — Bearish
- Weekly rank: #1173 out of 1223 — Bearish
- Monthly rank: #1144 out of 1223 — Bearish
- 3-Monthly rank: Not available for this horizon — Not available
- 6-Monthly rank: Not available for this horizon — Not available
- Yearly rank: Not available for this horizon — Not available
MUFTI’s rank profile is unusually consistent across time slices: daily (#1162), weekly (#1173), and monthly (#1144) all sit near the bottom decile of the 1223-instrument universe. That alignment matters because it reduces the likelihood that the bearish read is driven by a single window effect (for example, a one-off volatility burst) and instead points to a broader, persistent positioning disadvantage.
The absence of longer-horizon ranks (3-monthly, 6-monthly, yearly: Not available in the provided data.) limits regime attribution beyond the mid-term. Even so, the short-to-mid synchrony raises the bar for a bullish reversal case: improving price behavior would generally need to show up first as a stabilization in the daily rank, and then as follow-through into the weekly/monthly ranks.
The rank message also fits with the technical blend later in the report: the DRL technical rank of #1174 and the blended technical score of -0.432 are consistent with a market state where downside behaviors are statistically more common than favorable outcomes in the cross-section. Within KGNAI’s framework, that does not guarantee direction, but it does imply MUFTI is currently not competing well for relative technical quality versus peers in the same ranked set.
Term view: Short-term: Bearish. Mid-term: Bearish. Long-term: Not available.
Want the full universe and complete rank tables? Unlock full access on KGNAI: https://www.kgnai.com/pricing
2) Price & trend overview
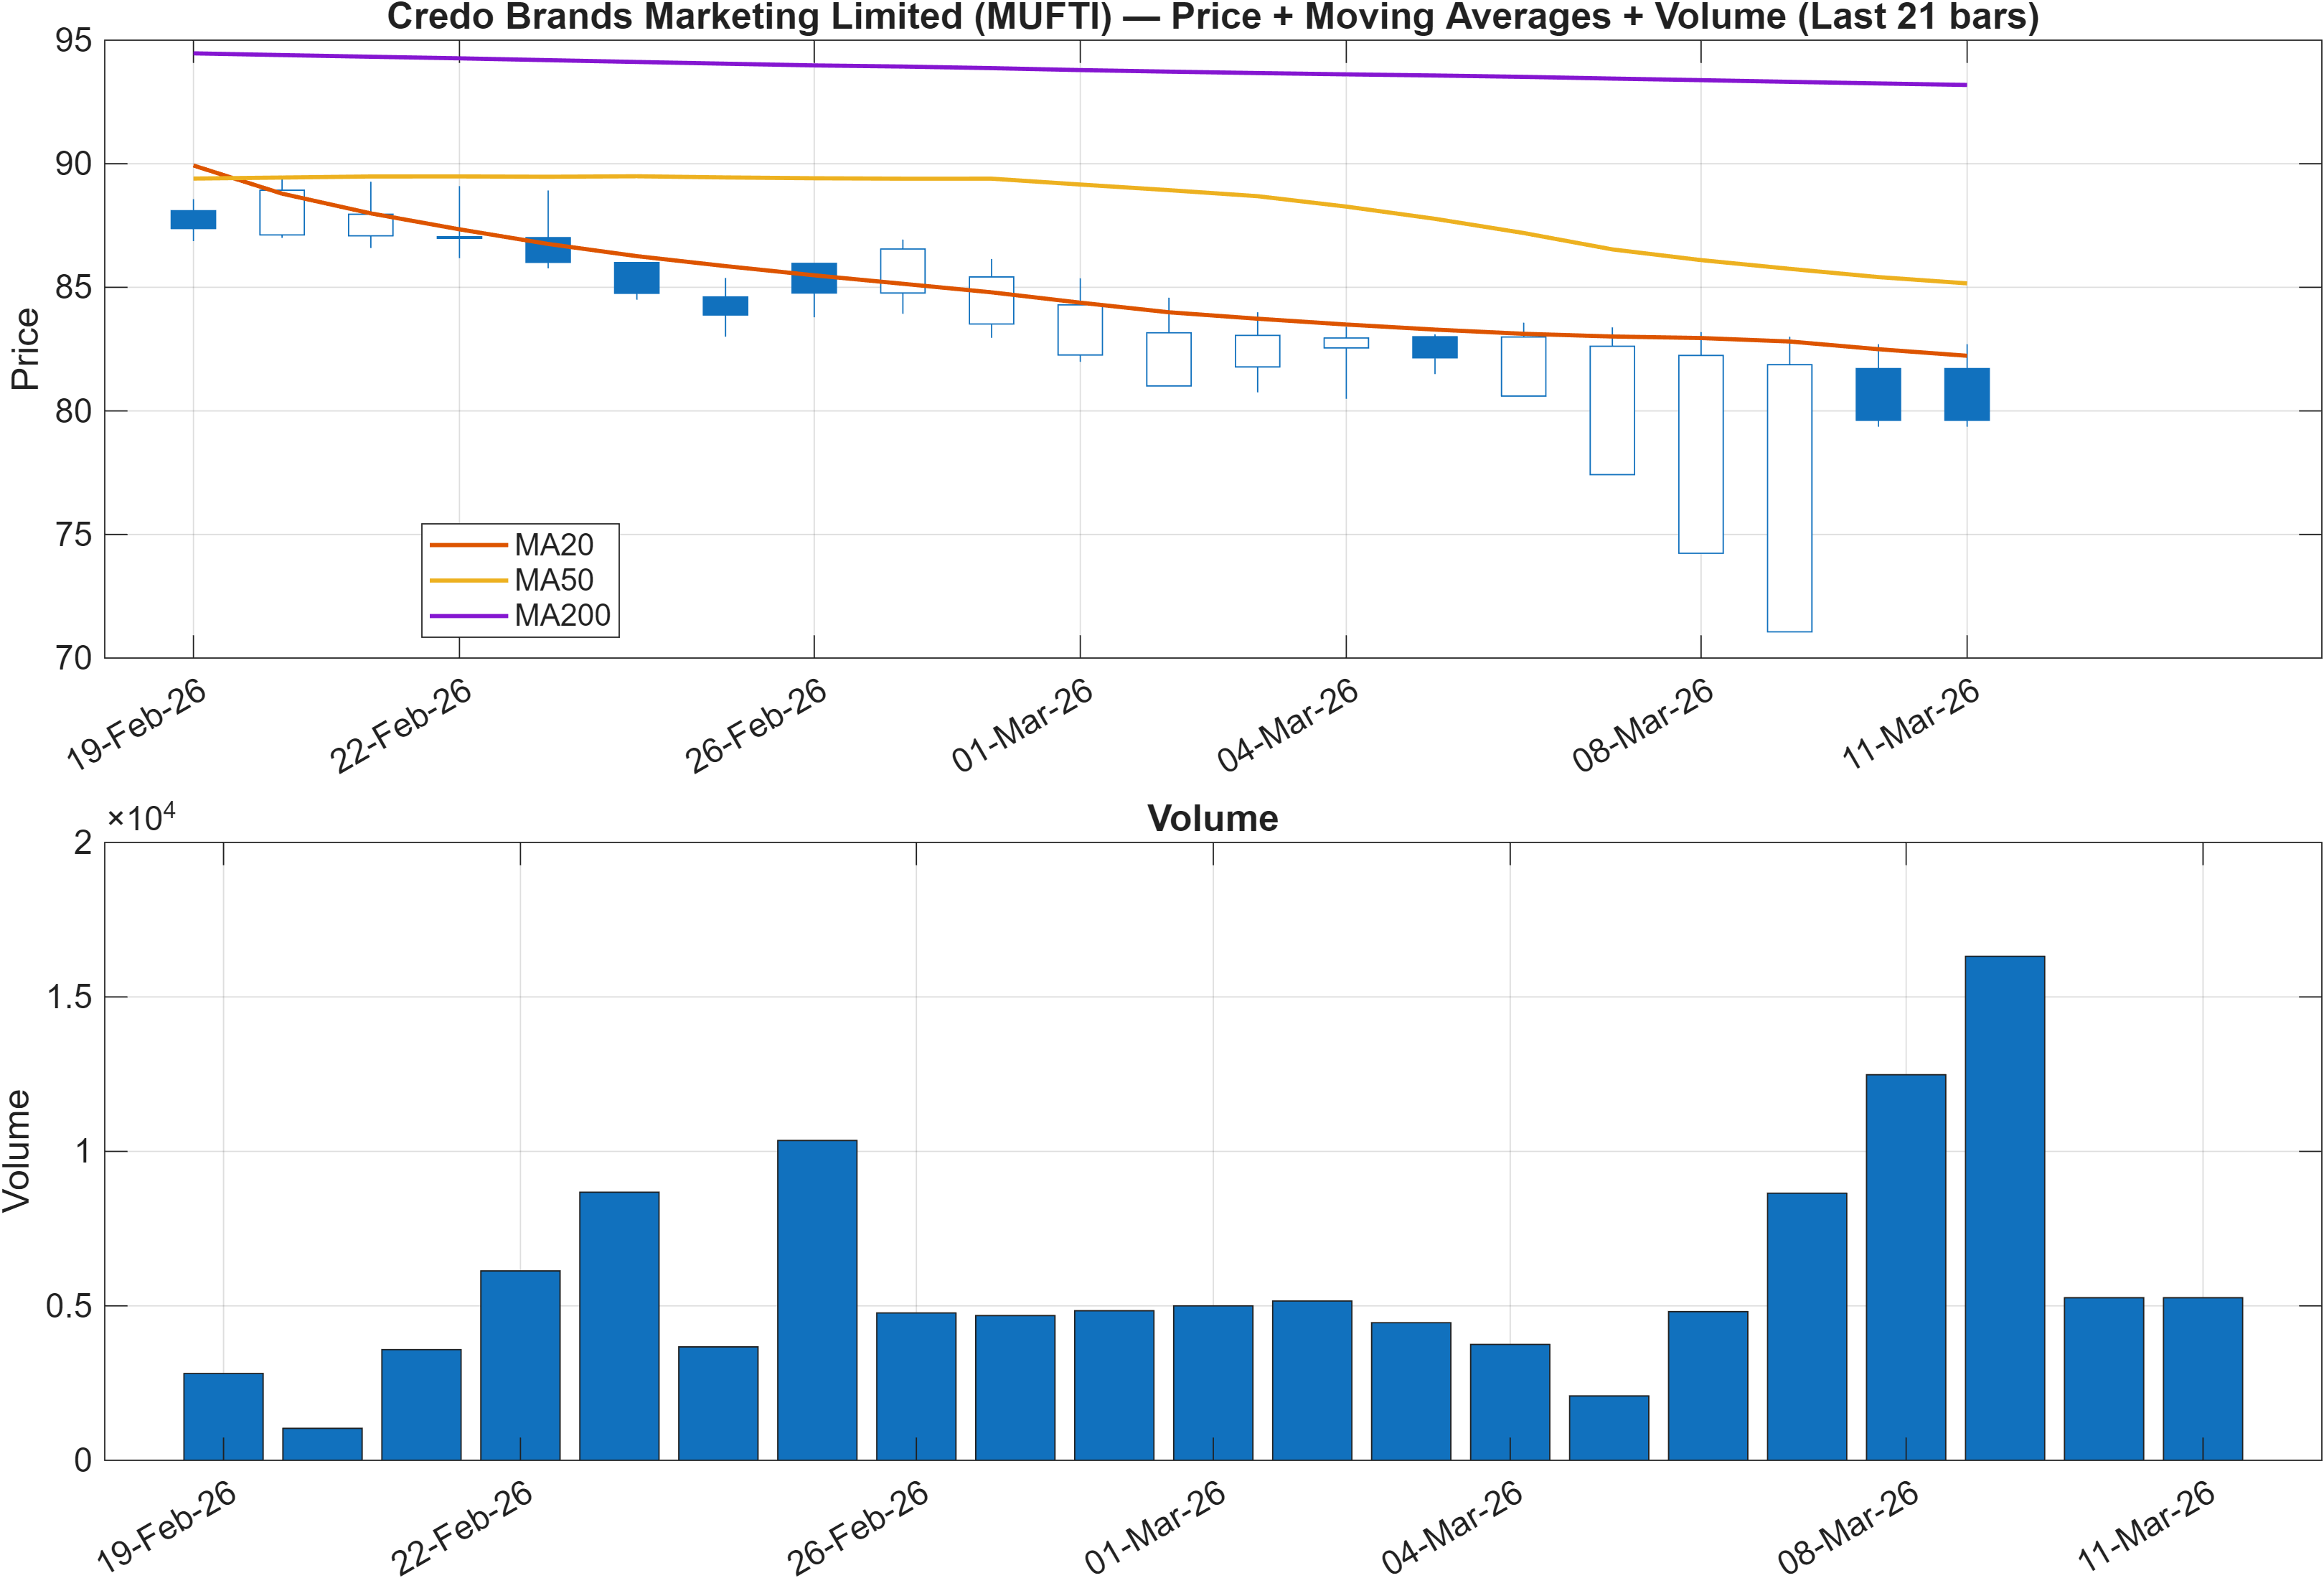
Interpretation: Close vs MA50 = Bearish, MA50 vs MA200 = Bearish.
Trend structure vs mean reversion risk
The trend lens is unambiguous in the provided overlay: price below the MA50 and MA50 below the MA200 signals a market operating under a bearish moving-average stack. In practical market-structure terms, this configuration typically reflects supply dominance across both short and intermediate horizons, where rallies can struggle to convert into sustained trend reversals unless the MA relationships begin to flatten.
What makes the current setup analytically interesting is that downside trend alignment coexists with oversold-adjacent momentum readings elsewhere in the dashboard—RSI(14) at 31.03 is near levels where markets often experience bounce attempts. That combination can produce choppy, mean-reverting rebounds that still fail to repair the larger structure, particularly when resistance remains overhead.
The clearest structural map for evaluating whether price is transitioning or merely retracing is the bracket between support ~80.5450 and resistance ~99.9950. In a bearish MA regime, the first test is usually whether rebounds can approach and stabilize near the upper boundary without immediate rejection. Failure to do so tends to keep the market in a “sell-the-rally” posture, whereas stabilization above resistance (paired with volume) would be the earliest evidence that the MA stack may begin to reconfigure.
The weak cross-sectional ranks—daily #1162 and weekly #1173—suggest the broader universe currently assigns MUFTI a lower quality trend state versus peers, reinforcing the view that any improvement needs to be proven through behavior, not assumed from oversold conditions.
3) Momentum & volatility dashboard
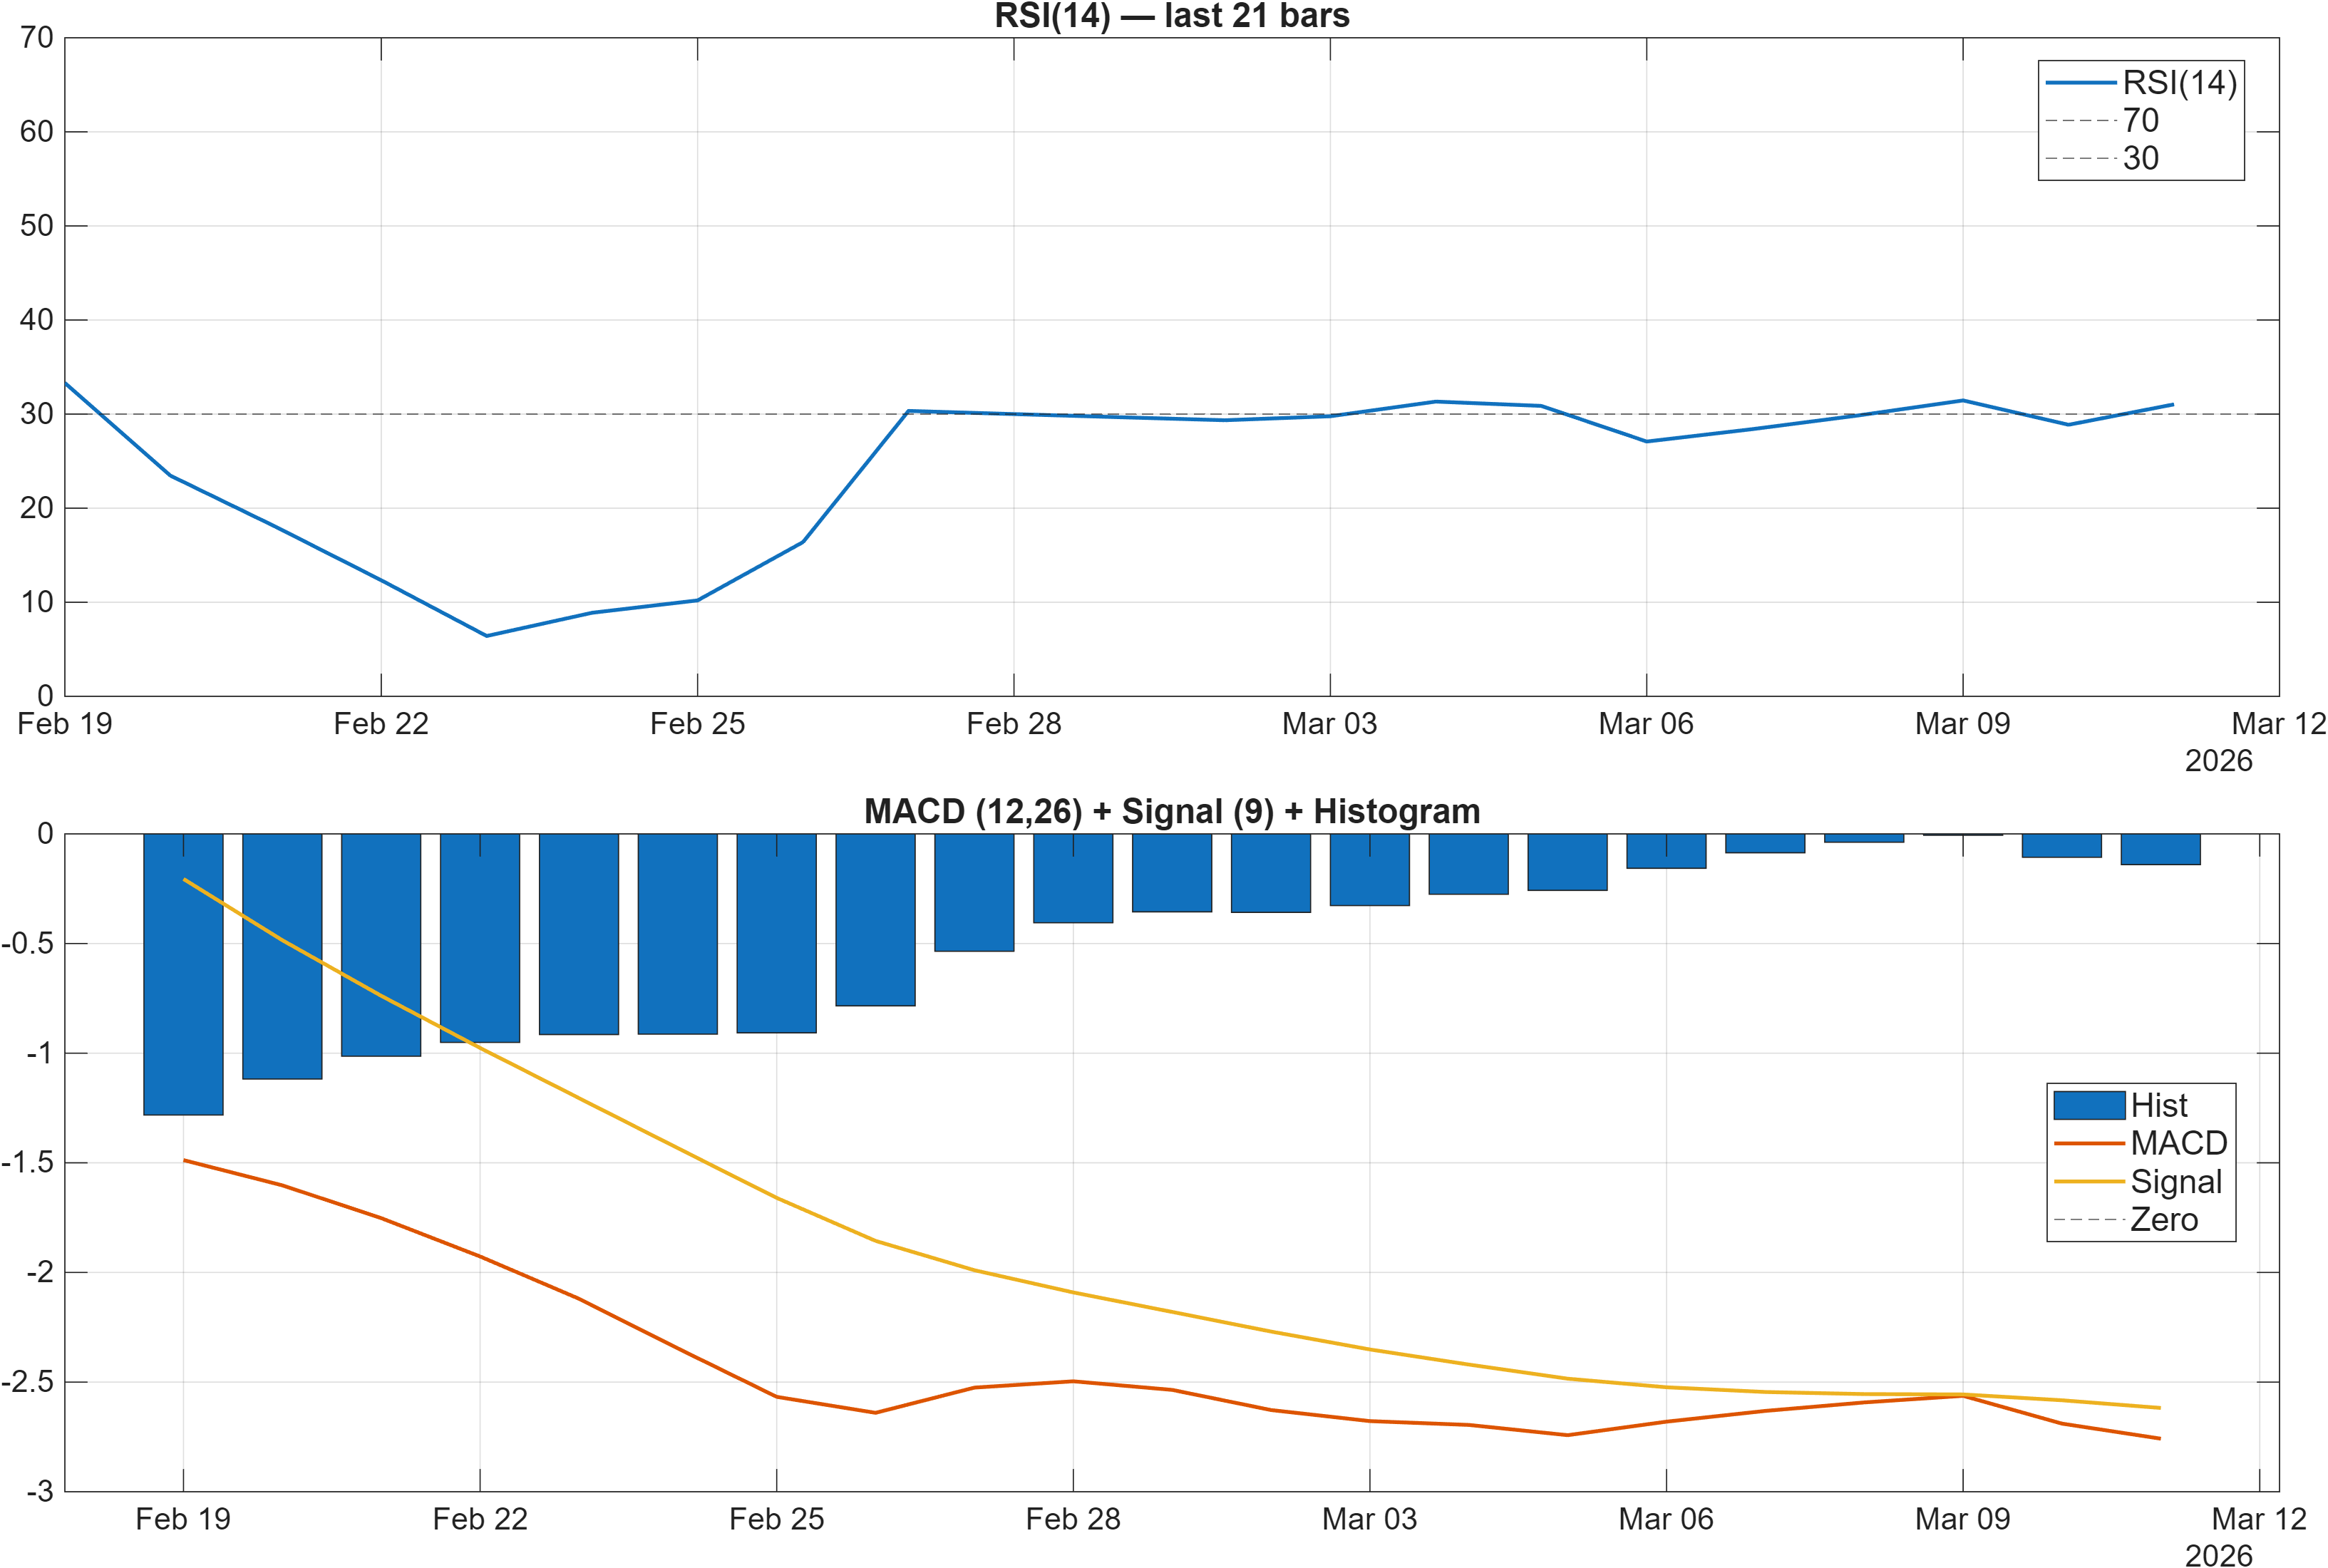
Interpretation: RSI bias = Bearish, MACD hist = -0.1401.
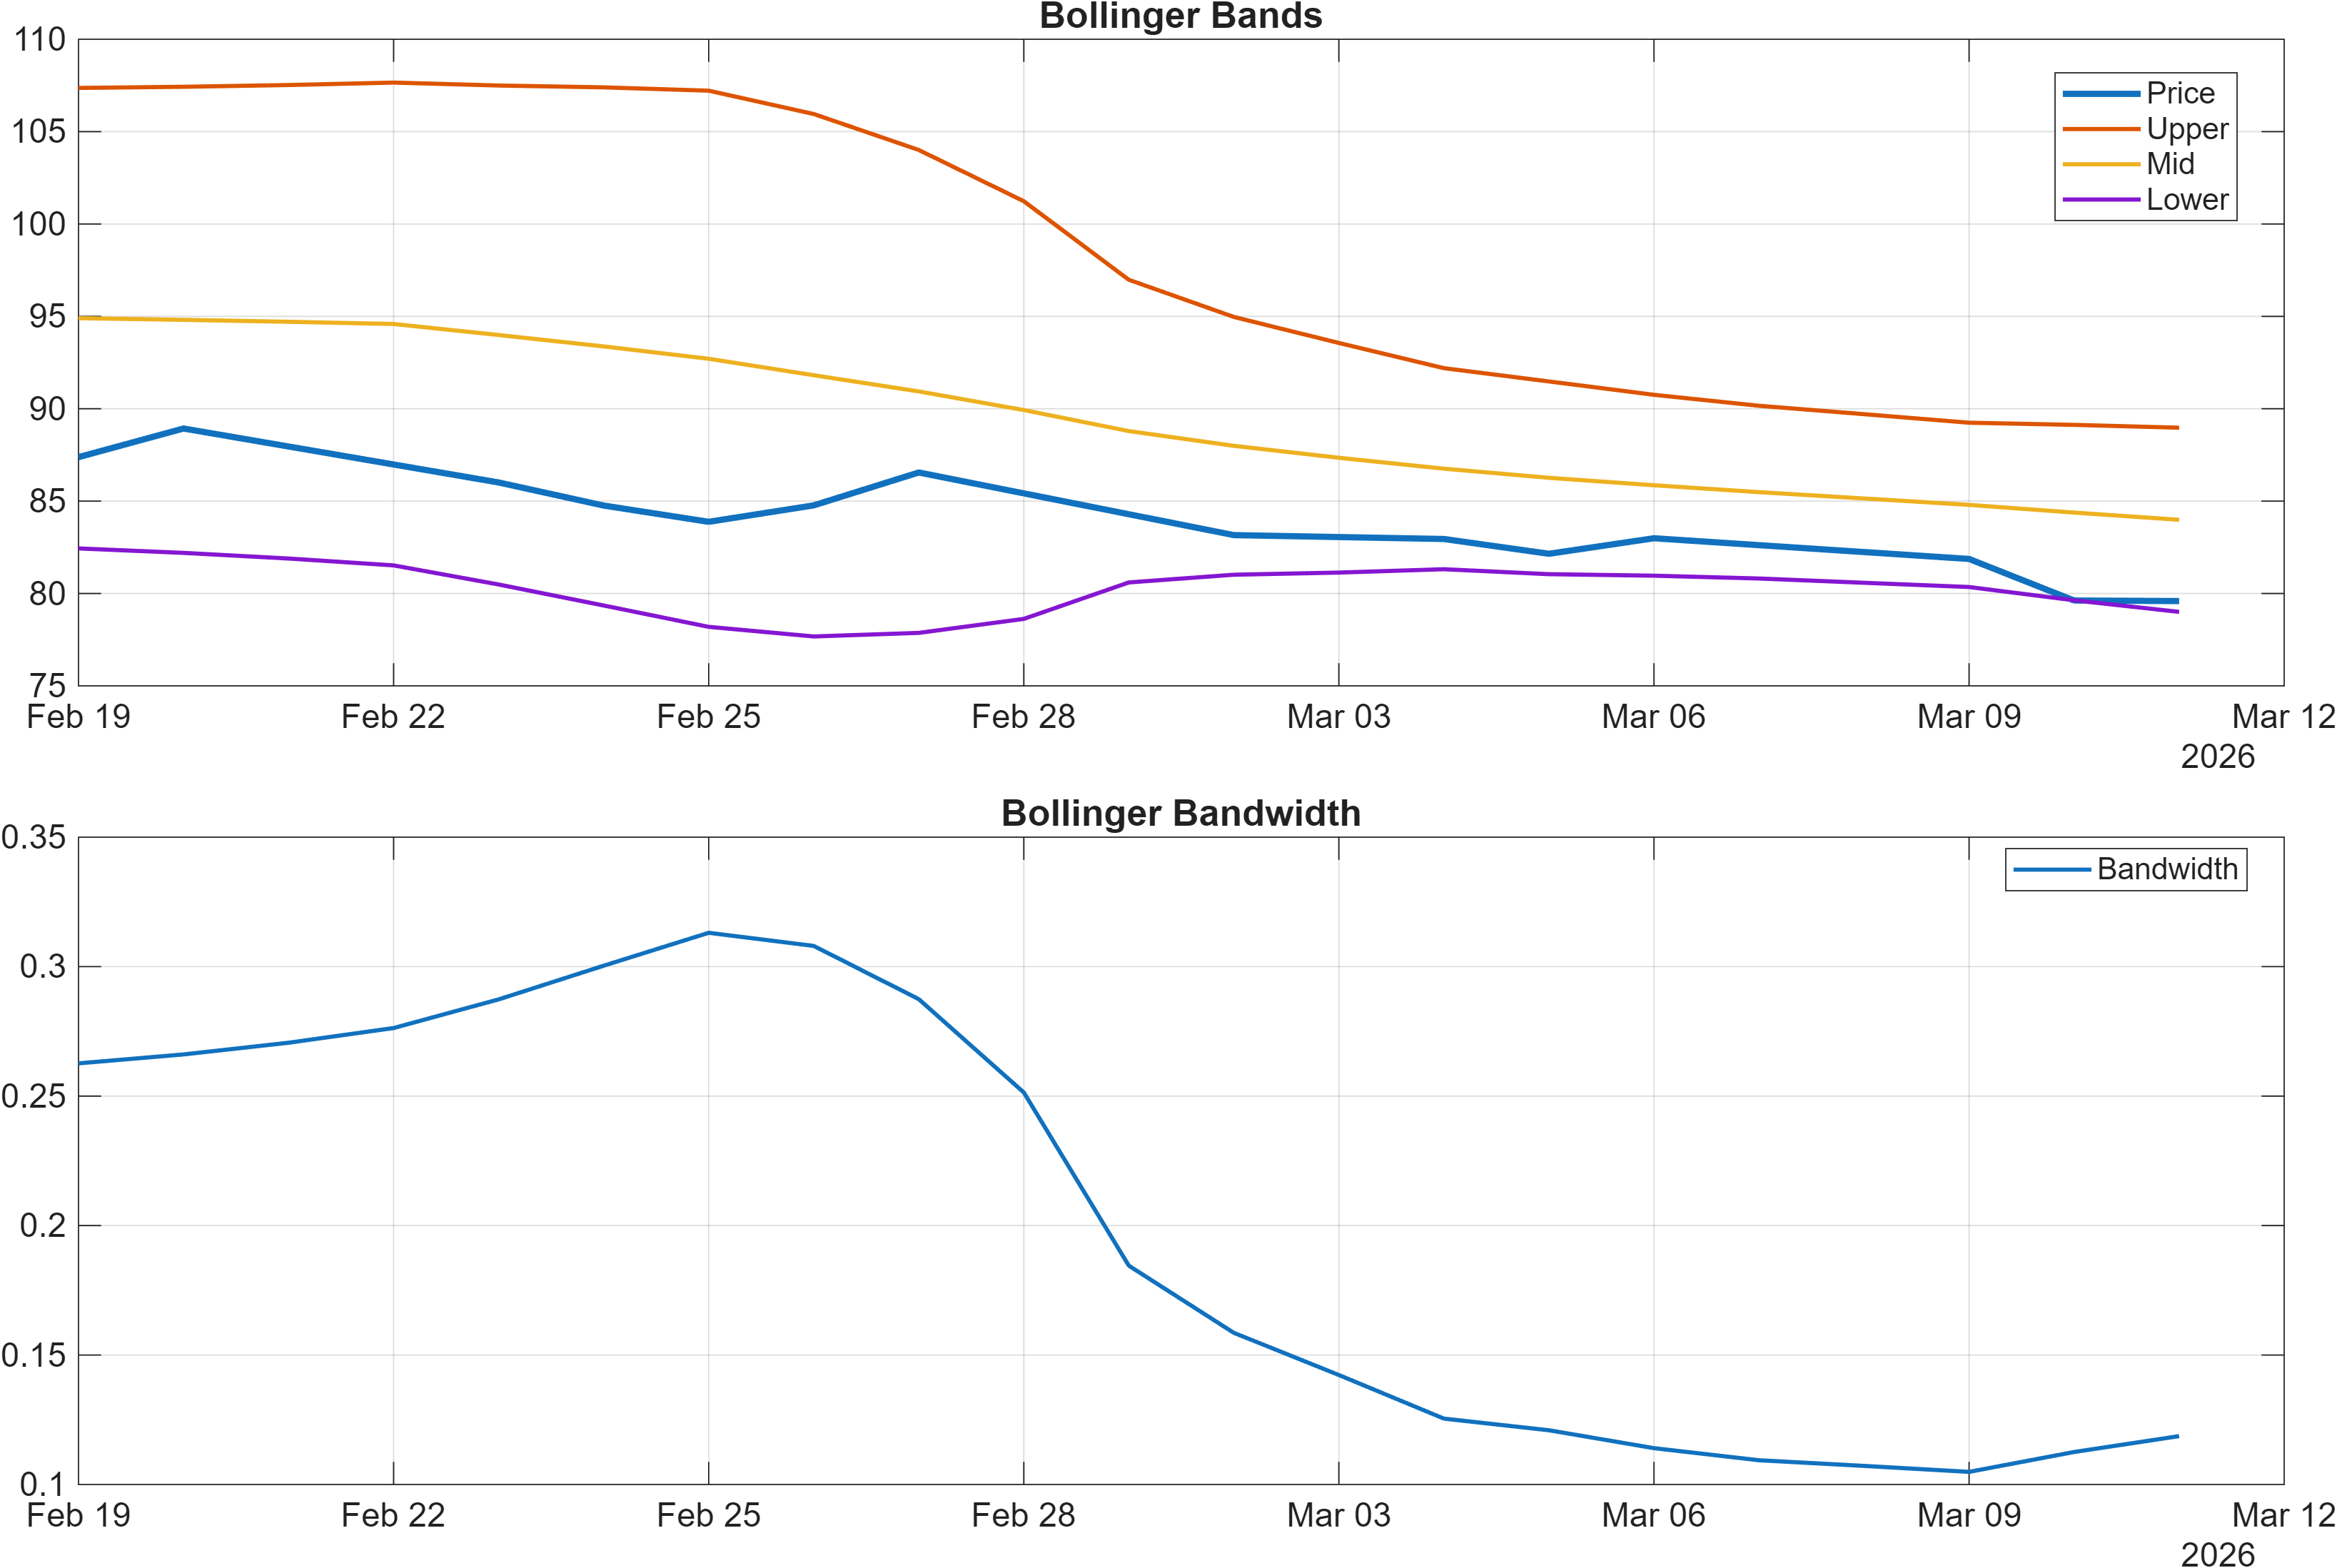
Interpretation: Bandwidth (volatility regime) latest = 0.1187.
Momentum persistence vs early stabilization
Momentum indicators remain biased to the downside. The MACD histogram at -0.1401 implies that the dominant trend impulse is still negative, consistent with a market where rallies have not yet generated sufficient positive momentum to shift the MACD complex. At the same time, RSI(14) at 31.03 sits near a zone often associated with downside fatigue, creating a tension between “persistent trend” and “tactical bounce” narratives.
The internal momentum readings in the signal set reinforce the persistence angle: TS Mom(20) at -9.31 and ROC(20) at -10.5 depict a market that has lost ground over the recent window rather than simply consolidating. That makes any bounce attempt more likely to be evaluated as a retracement until momentum measures begin to normalize.
Volatility conditions look more transitional than extreme. Bollinger Bandwidth at 0.1187 is flagged neutral, suggesting volatility is not clearly in a squeeze state (which can precede expansion) nor in a fully expanded washout regime. In this context, momentum shifts tend to require either (a) a volatility expansion that supports directional follow-through, or (b) a multi-session grind higher that gradually repairs oscillators.
A final nuance is that not all participation metrics are uniformly weak: the dashboard includes bullish readings such as ADOSC at 18.71, which can sometimes appear when accumulation is selective even as trend remains bearish. That divergence is worth monitoring, but by itself it does not outweigh the negative momentum stack and weak MA configuration.
4) Support / Resistance zones
Support ~ 80.5450 | Resistance ~ 99.9950
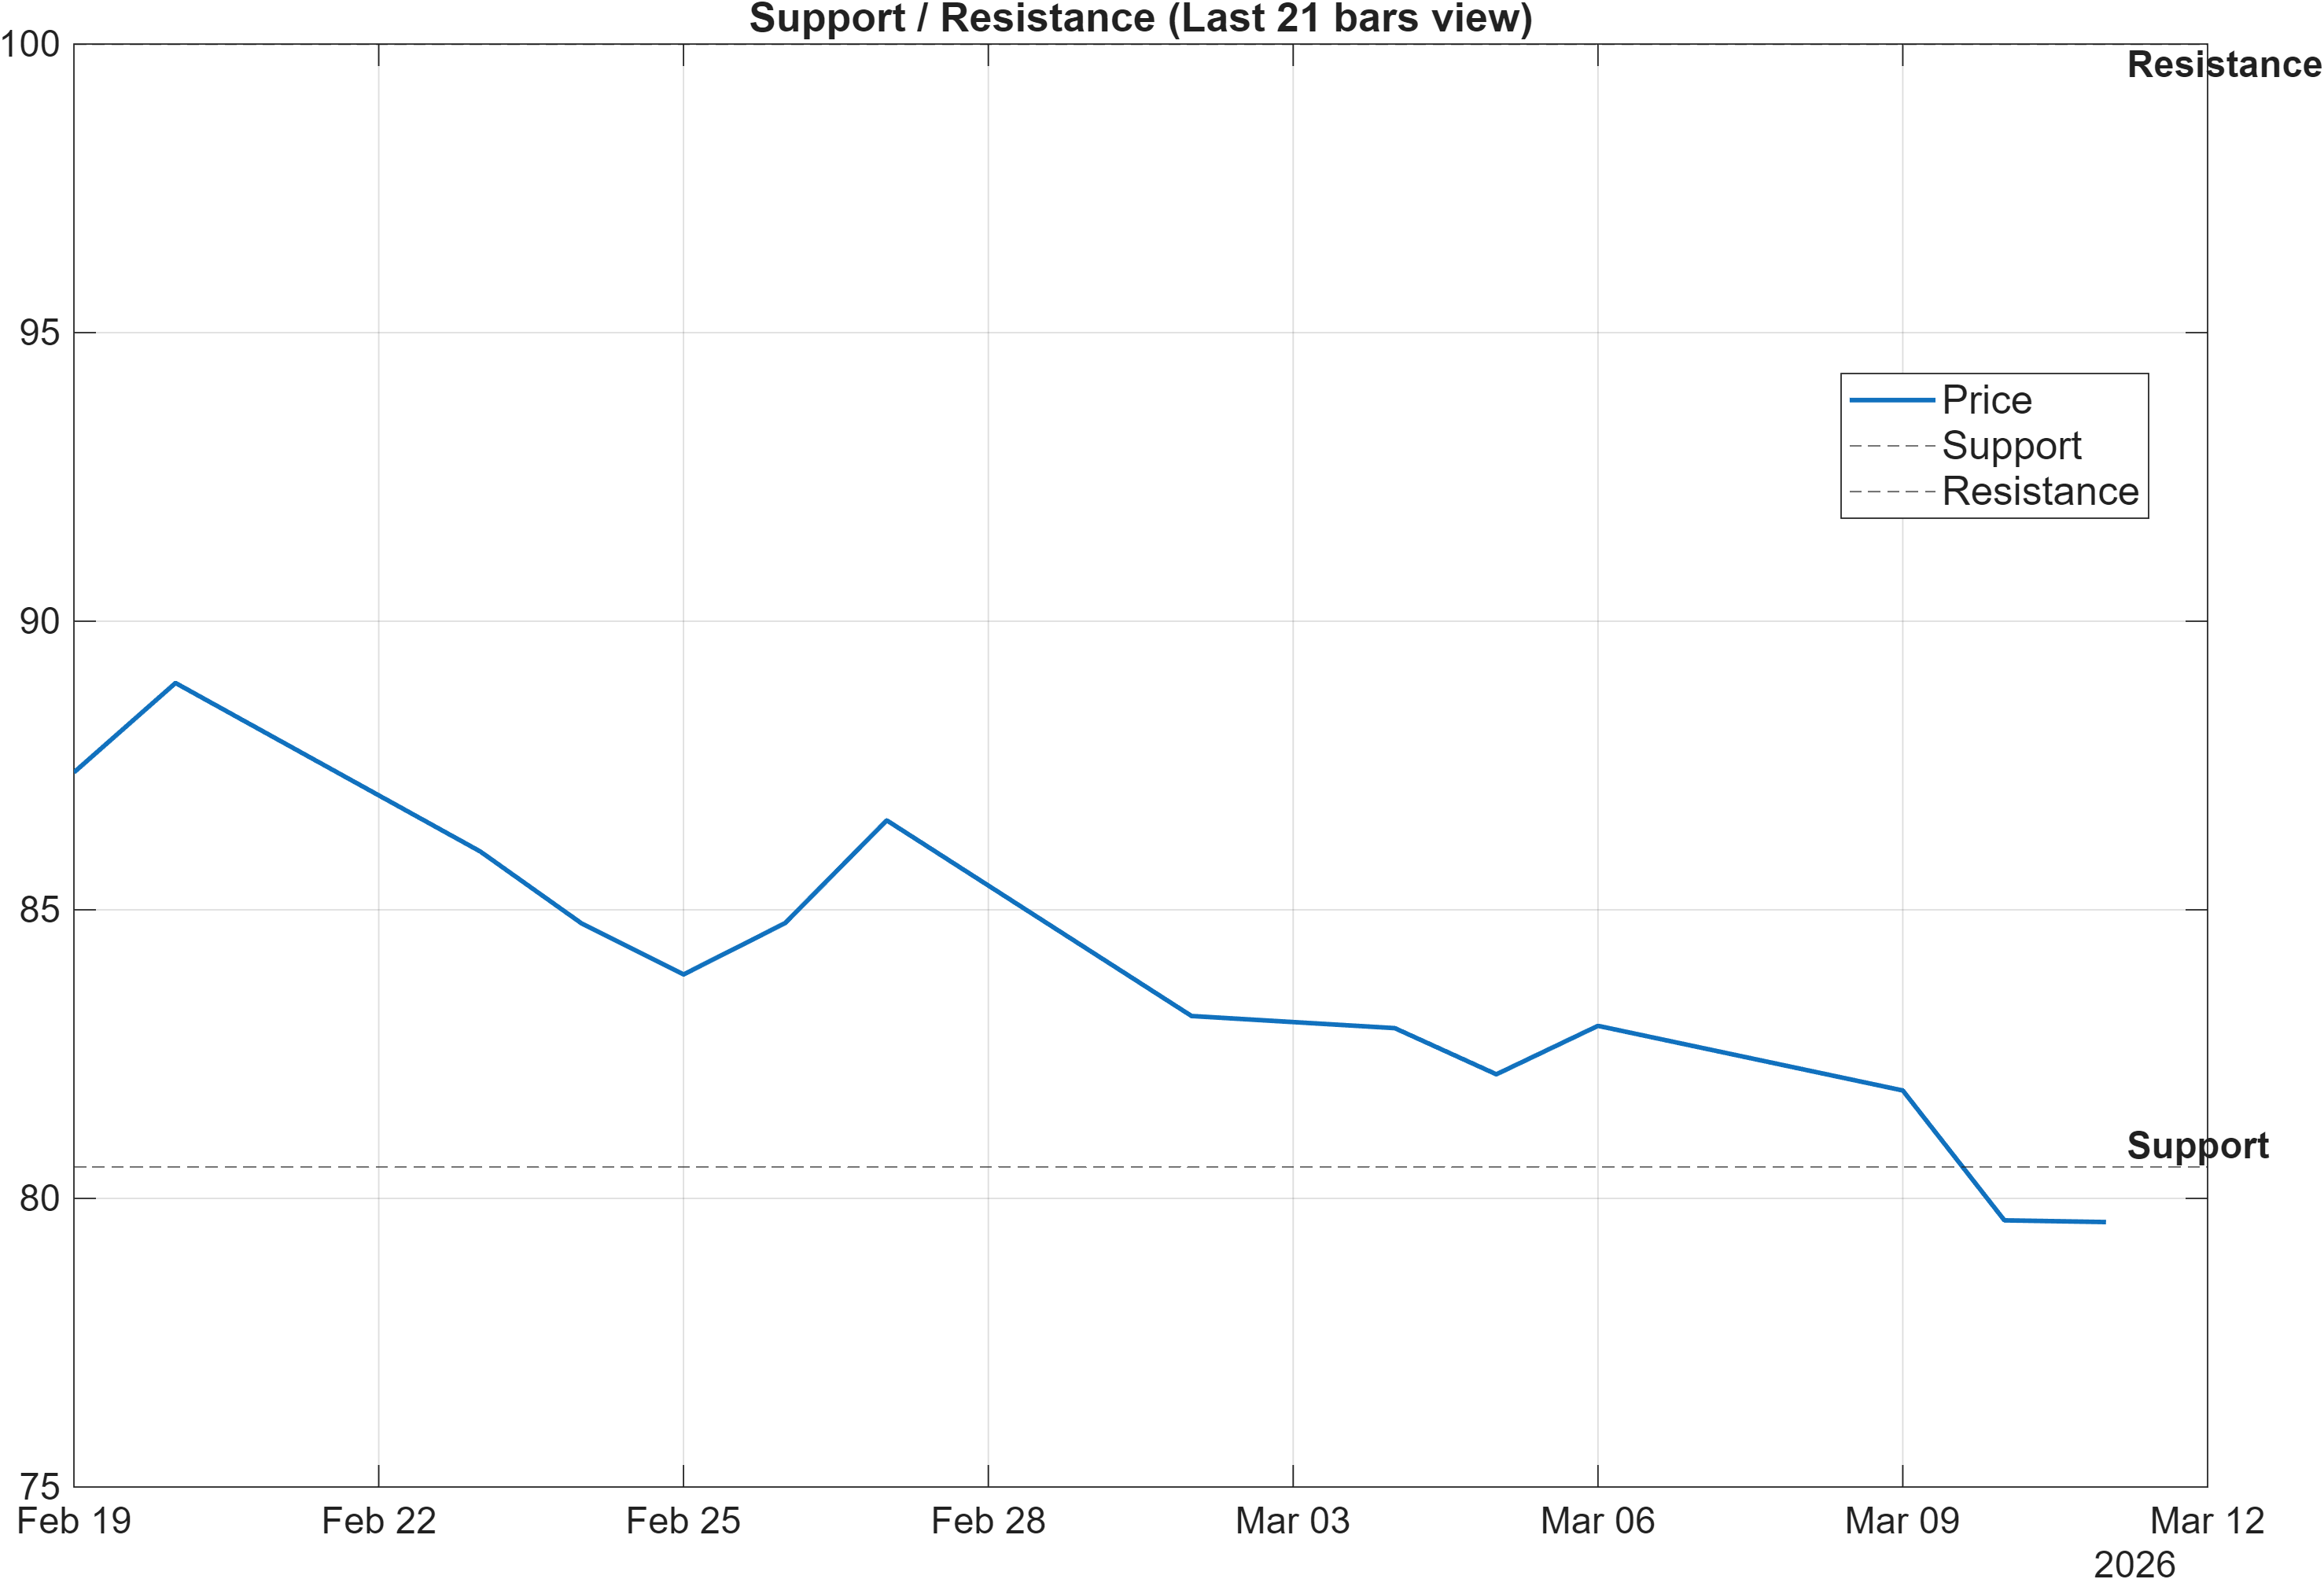
Scenario view: Break above resistance with volume → continuation. Close below support → signal deterioration risk.
Decision zones: validation of recovery vs continuation of weakness
The level framework is tight enough to define risk clearly. The 80.5450 support operates as the nearest downside “acceptance test.” In a bearish rank environment (daily #1162, weekly #1173), a clean loss of that zone would typically be interpreted as confirmation that sellers retain control and that the probability of further deterioration increases.
On the upside, 99.9950 is the key threshold for any near-term repair narrative. With trend structure already bearish (close below MA50; MA50 below MA200) and momentum still negative (MACD hist -0.1401), reaching resistance is not the same as reclaiming it. The analytical distinction is whether price can break and hold above resistance with volume—this would be the earliest behavior consistent with regime transition rather than a standard counter-trend rebound.
The signal table adds a helpful context for level sensitivity: RSI(14) at 31.03 implies the market may be more reactive around support, while volatility remains neutral (BB Width 0.1187), which can lead to sharp but short-lived moves around known decision points. As a result, closes (not intraday probes) tend to be more informative for evaluating whether a level has been accepted or rejected.
Practically, the support/resistance bracket can be treated as a probabilistic “state boundary”: behavior inside the range often reflects negotiation, while acceptance below support or above resistance typically forces a re-pricing of trend expectations. The current higher-timeframe bias remains bearish until resistance is reclaimed with credible follow-through.
5) Quant Technical Dashboard (18 Signals)
KGNAI AI Technical Analysis Score (Deep Reinforcement Learning): Rank #1174 out of 1223 (Rank 1 represents the strongest technical positioning and a higher probability of favorable price behavior. As ranks increase toward the maximum, the probability of favorable outcomes weakens and bearish positioning becomes more dominant.) | Label: Bearish | Score: -0.920
18-Signal Technical Confluence Score: -0.222 (Neutral)
Overall Technical Score (18-signal confluence + DRL rank blend): -0.432 (Bearish)
Note: The blended score reflects signal strength weighted against broader AI technical ranking, which may temporarily diverge.
Blended technical score breakdown: -0.432 (Bearish | Bull 5 / Bear 9 / Neutral 4)
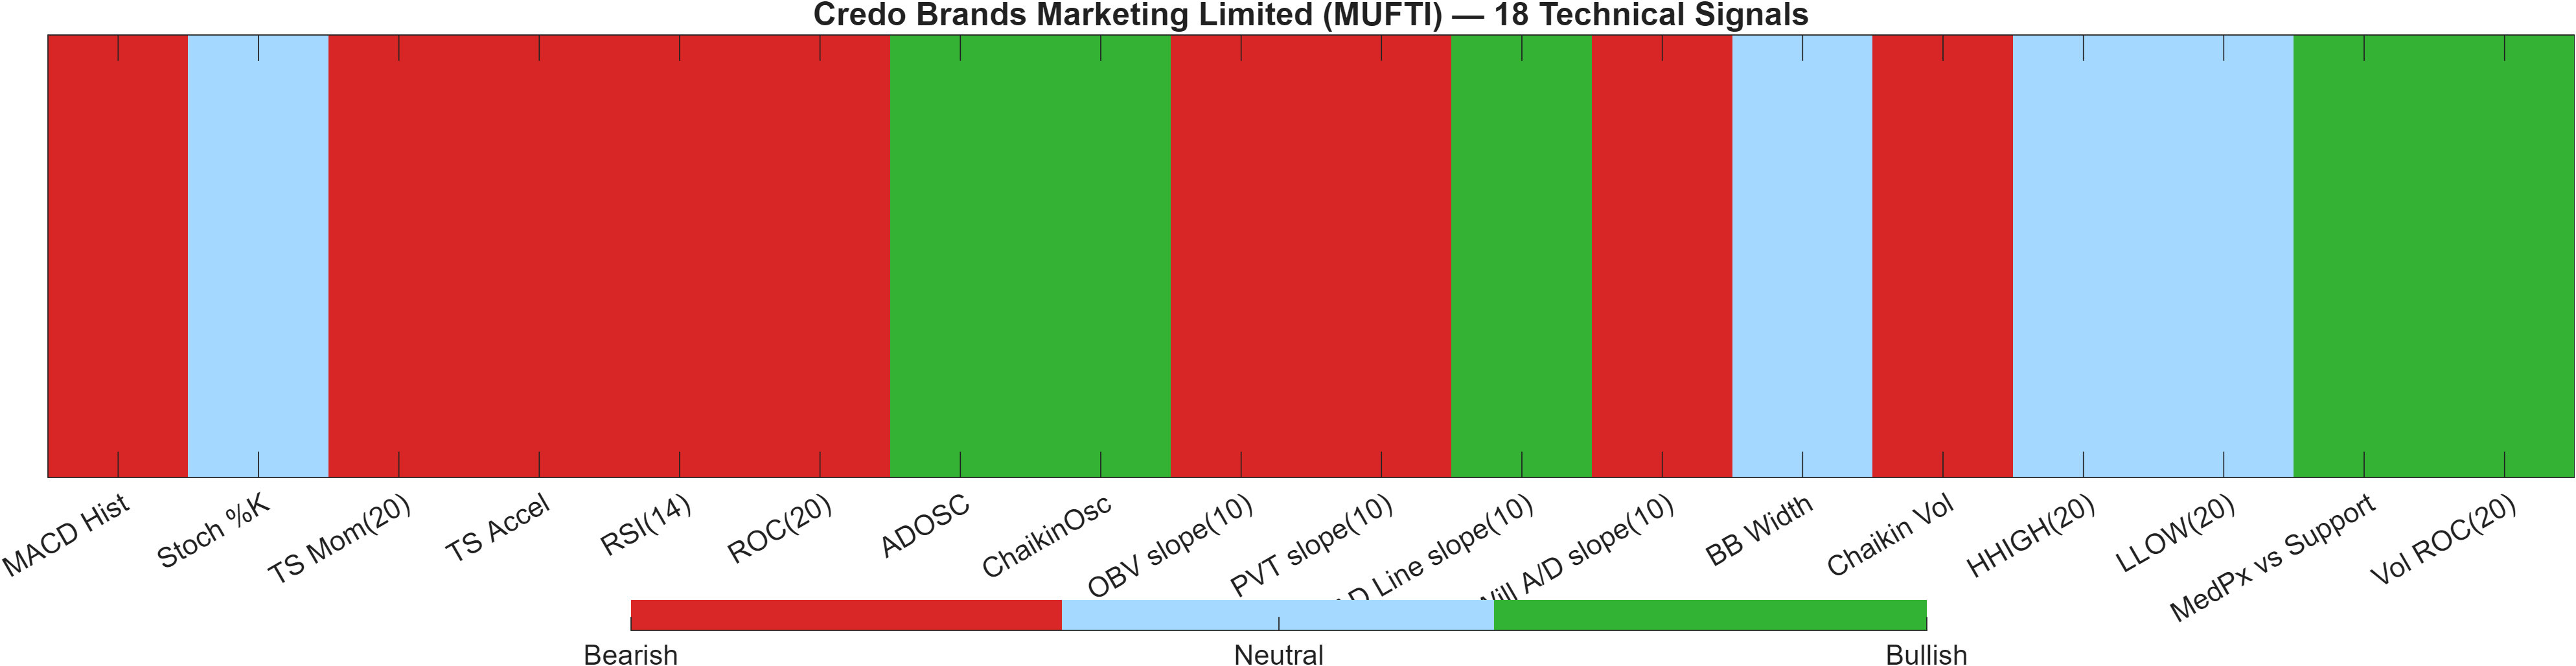
Confluence vs AI-rank overlay (where they agree, where they diverge)
The technical stack is best read as a two-layer verdict. The 18-signal confluence score is -0.222, labeled Neutral, indicating the indicator set is not uniformly bearish—there is still meaningful disagreement among momentum, volume/flow, and volatility components. However, the separate AI overlay is notably weak: the DRL technical rank is #1174 with a -0.920 score, pulling the combined outcome to an overall -0.432 (Bearish).
The distribution of signals supports that blended conclusion: Bear 9 / Bull 5 / Neutral 4. Several core momentum measures are negative, including RSI(14) at 31.03 (bearish) and ROC(20) at -10.5 (bearish). Meanwhile, volatility is not delivering a decisive regime cue—BB Width at 0.1187 is neutral—so momentum signals carry more weight in near-term interpretation.
Where the dashboard shows internal friction is in participation/flow: ADOSC at 18.71 is bullish, and ChaikinOsc at 9880 is also bullish. Yet the price-volume trend measures conflict, as OBV slope(10) at -5.334e+04 and PVT slope(10) at -364.4 are bearish. That combination can appear when buying pressure is intermittent but not sustained enough to shift the broader price/volume trajectory.
Overall, the technical message is not “maximum bearish unanimity,” but rather a market with bearish momentum dominance and selective pockets of supportive flow that have not yet translated into trend repair. Until the blended score improves or key levels are reclaimed, the risk posture remains tilted to caution.
Signal table (Bull/Bear/Neutral)
| Indicator | Value | Signal |
|---|---|---|
| MACD Hist | -0.1401 | Bearish |
| Stoch %K | 63.31 | Neutral |
| TS Mom(20) | -9.31 | Bearish |
| TS Accel | -8.187 | Bearish |
| RSI(14) | 31.03 | Bearish |
| ROC(20) | -10.5 | Bearish |
| ADOSC | 18.71 | Bullish |
| ChaikinOsc | 9880 | Bullish |
| OBV slope(10) | -5.334e+04 | Bearish |
| PVT slope(10) | -364.4 | Bearish |
| AD Line slope(10) | 2.87e+04 | Bullish |
| Will A/D slope(10) | -7.285 | Bearish |
| BB Width | 0.1187 | Neutral |
| Chaikin Vol | 63.89 | Bearish |
| HHIGH(20) | 89.45 | Neutral |
| LLOW(20) | 71.06 | Neutral |
| MedPx vs Support | 0.485 | Bullish |
| Vol ROC(20) | 408.5 | Bullish |
Interpretation: Indicator-level signals form the base confluence, which is then adjusted using a separate AI-driven technical ranking model. The final technical score summarizes this combined view.
6) News sentiment + extractive gist
Note: Instrument-specific news matches were not found, so the digest includes broader market/sector headlines. Links are provided for verification.
Sentiment score (avg): 0.088 | Positive: 37% | Neutral: 56% | Negative: 6%
KGNAI AI News Sentiment Score (normalized -1 to +1): Not available (as of —) | Label: Not available | Overall news score: 0.09
Positive Developments
Recent coverage across major financial outlets indicates a mildly constructive information backdrop, reflected in the sentiment mix with 37% positive items and a modestly positive average score (0.088). The supportive angle is less about MUFTI-specific drivers (not available in the provided data) and more about broader risk appetite and sector-level narratives. Reports highlighting pockets of equity recovery and episodes of commodity-linked strength can be relevant insofar as they shape the marginal buyer’s willingness to add exposure across the market. In parallel, policy-related updates that improve perceived flexibility for well-capitalized financial institutions can influence overall liquidity expectations and risk tolerance, even when the linkage to a single consumer brand is indirect. For MUFTI, the key analytical point is that a slightly constructive news tone can reduce headline-driven downside pressure, but it does not automatically reverse a weak technical regime when ranks remain deep in the lower tail (daily #1162, weekly #1173).
Neutral / Mixed Developments
The dominant share of coverage is neutral (56%), consistent with a market that is processing cross-currents rather than moving in a single narrative direction. Macro and cross-asset items described as mixed—such as shifting expectations for energy prices or valuation discussions following broader market drawdowns—typically translate into range-bound behavior and selective stock dispersion rather than uniform beta rallies. This matters for MUFTI because neutral macro tone often places greater emphasis on technical decision zones: reactions around support ~80.5450 and resistance ~99.9950 may carry more information than the headlines themselves. With volatility conditions not extreme (BB Width 0.1187), markets can oscillate without producing decisive, trend-changing follow-through, keeping short-term sentiment as context rather than a primary signal.
Negative / Risk Signals
Risk-oriented items remain a smaller share of the set (6%), but they still frame the tail risks that can pressure weaker technical structures. Coverage that emphasizes tighter or more complex regulatory conditions for parts of the financial system can contribute to a more cautious risk stance in equities broadly, particularly when combined with geopolitically sensitive energy-market narratives. For MUFTI, the vulnerability is that bearish technical conditions—such as MACD hist -0.1401 and RSI(14) 31.03—often respond asymmetrically to negative market-wide shocks, with downside follow-through more likely than upside extension when the trend stack is already bearish. In that sense, the news set functions less as a direct driver and more as a potential catalyst that can accelerate tests of the 80.5450 support zone.
- Whether sentiment stays near 0.088 or shifts materially as broader market narratives evolve.
- Any change in the positive/neutral split (37% / 56%) that coincides with a break of 99.9950 or 80.5450.
Sources referenced: Reuters, Bloomberg, Yahoo Finance, MarketWatch, Investing.com
7) Sources
- Global Market Today | Oil drops on reserve release report, Asian stocks gain — https://economictimes.indiatimes.com/markets/us-stocks/news/global-market-today-oil-drops-on-reserve-release-report-asian-stocks-gain/articleshow/129428743.cms
- RBI aligns capital rules of banks with global norms — https://economictimes.indiatimes.com/markets/stocks/news/rbi-aligns-capital-rules-of-banks-with-global-norms/articleshow/129428393.cms
- RBI links bank dividends to Common Equity Tier 1 ratio — https://economictimes.indiatimes.com/markets/stocks/news/rbi-links-bank-dividends-to-cet1-ratio/articleshow/129428292.cms
- Aluminium stocks jump up to 10% as global supply disruptions lift prices — https://economictimes.indiatimes.com/markets/stocks/news/aluminium-stocks-jump-up-to-10-as-global-supply-disruptions-lift-prices/articleshow/129428059.cms
- Bitcoin gains as Iran war driven volatility hits oil and stocks — https://economictimes.indiatimes.com/markets/cryptocurrency/bitcoin-gains-as-iran-war-driven-volatility-hits-oil-and-stocks/articleshow/129427625.cms
- Valuations moderate after market fall, but India’s premium limits FII comeback — https://economictimes.indiatimes.com/markets/stocks/news/valuations-moderate-after-market-fall-but-indias-premium-limits-fii-comeback/articleshow/129427252.cms
- HC quashes Rs 1 crore GST seizure, orders return — https://economictimes.indiatimes.com/markets/stocks/news/hc-quashes-1cr-gst-seizure-orders-return/articleshow/129427741.cms
- Jindal Steel wins Thakurani A1 iron ore block in Odisha — https://economictimes.indiatimes.com/markets/stocks/news/jindal-steel-wins-thakurani-a1-iron-ore-block-in-odisha/articleshow/129427801.cms
You may also like: How KGNAI AI ranks instruments across global markets
Disclaimer: KGNAI provides AI-generated analytics and educational market commentary only. This is not financial advice. Markets involve risk. Always do your own research.