
LTTS (L&T Technology Services Ltd) — 08-Mar-2026 Neutral near-term ranks with bearish technical confluence
As of 08-Mar-2026, KGNAI’s cross-universe ranking for LTTS (L&T Technology Services Ltd) shows a Neutral stance in the short to mid horizon, while longer-horizon ranks remain Bullish. This split matters because the 18-signal technical confluence is Bearish (overall technical score -0.380), and trend diagnostics flag Close vs MA50 = Bearish alongside MA50 vs MA200 = Bearish, suggesting near-term pressure against a more constructive longer-cycle backdrop. Momentum indicators also lean defensive, with RSI(14) at 38.27 and MACD histogram at -6.3779, while volatility is not extreme (Bollinger bandwidth 0.1432). Key decision zones remain Support ~ 3276.3250 and Resistance ~ 4352.9502; price behavior around these levels provides the most actionable confirmation/invalidation framework.
- Rank stance: Short-term Neutral · Mid-term Neutral · Long-term Bullish (notably strong 6-Monthly and Yearly positioning).
- Technical confluence: Bearish (overall technical score -0.380).
- Key levels: Support 3276.3250 · Resistance 4352.9502.
- News sentiment bias: Neutral distribution, with a high normalized news sentiment score (0.90) in the dataset.
- Confirmation / invalidation: A break above 4352.9502 with volume supports continuation; a close below 3276.3250 increases deterioration risk.
KGNAI evaluates assets using large cross-sectional datasets built from millions of structured data points. Inputs incorporate fundamental metrics, technical structures, and systematically processed news sentiment. Statistical models, machine learning, and AI frameworks are used to assess relative positioning, signal alignment, and probabilistic behavior across broad universes.
- Ranks are comparative across the tracked universe, not absolute price targets.
- Confluence reflects alignment among independent signal groups.
- Support/resistance levels are probabilistic decision zones, not guarantees.
- Sentiment provides contextual bias within the broader analytical framework.
1) KGNAI AI Analysis
Region: INDIA
Total universe size: 1176 ranked instruments
- Daily rank: #753 out of 1176 — Neutral
- Weekly rank: #645 out of 1176 — Neutral
- Monthly rank: #312 out of 1176 — Neutral
- 3-Monthly rank: #156 out of 1176 — Bullish
- 6-Monthly rank: #14 out of 1176 — Bullish
- Yearly rank: #30 out of 1176 — Bullish
LTTS presents a clear horizon split in KGNAI’s ranking stack. Near-term placement is in the lower third of the universe (Daily #753, Weekly #645), consistent with a market state where short-dated flows and technical pressure can dominate decision-making. The Monthly rank improves to #312 (upper portion of the distribution), implying that weakness may be more concentrated in shorter windows than in the intermediate view.
The longer-cycle ranks are materially stronger: 3-Monthly #156 (Bullish), 6-Monthly #14 (top-decile), and Yearly #30. This configuration often corresponds to a regime where the asset has retained favorable longer-horizon behavior characteristics in the KGNAI universe, while currently experiencing a drawdown, consolidation, or a transitional phase that compresses shorter-term relative strength.
The term label summary aligns with that structure: Short-term Neutral, Mid-term Neutral, Long-term Bullish. From a process standpoint, this is not a “one-number” verdict; it is a probabilistic filter that frames which confirmations matter most. In this case, short-term caution is best treated as a requirement for stronger technical confirmation before the long-horizon rank strength is relied upon.
2) Price & trend overview
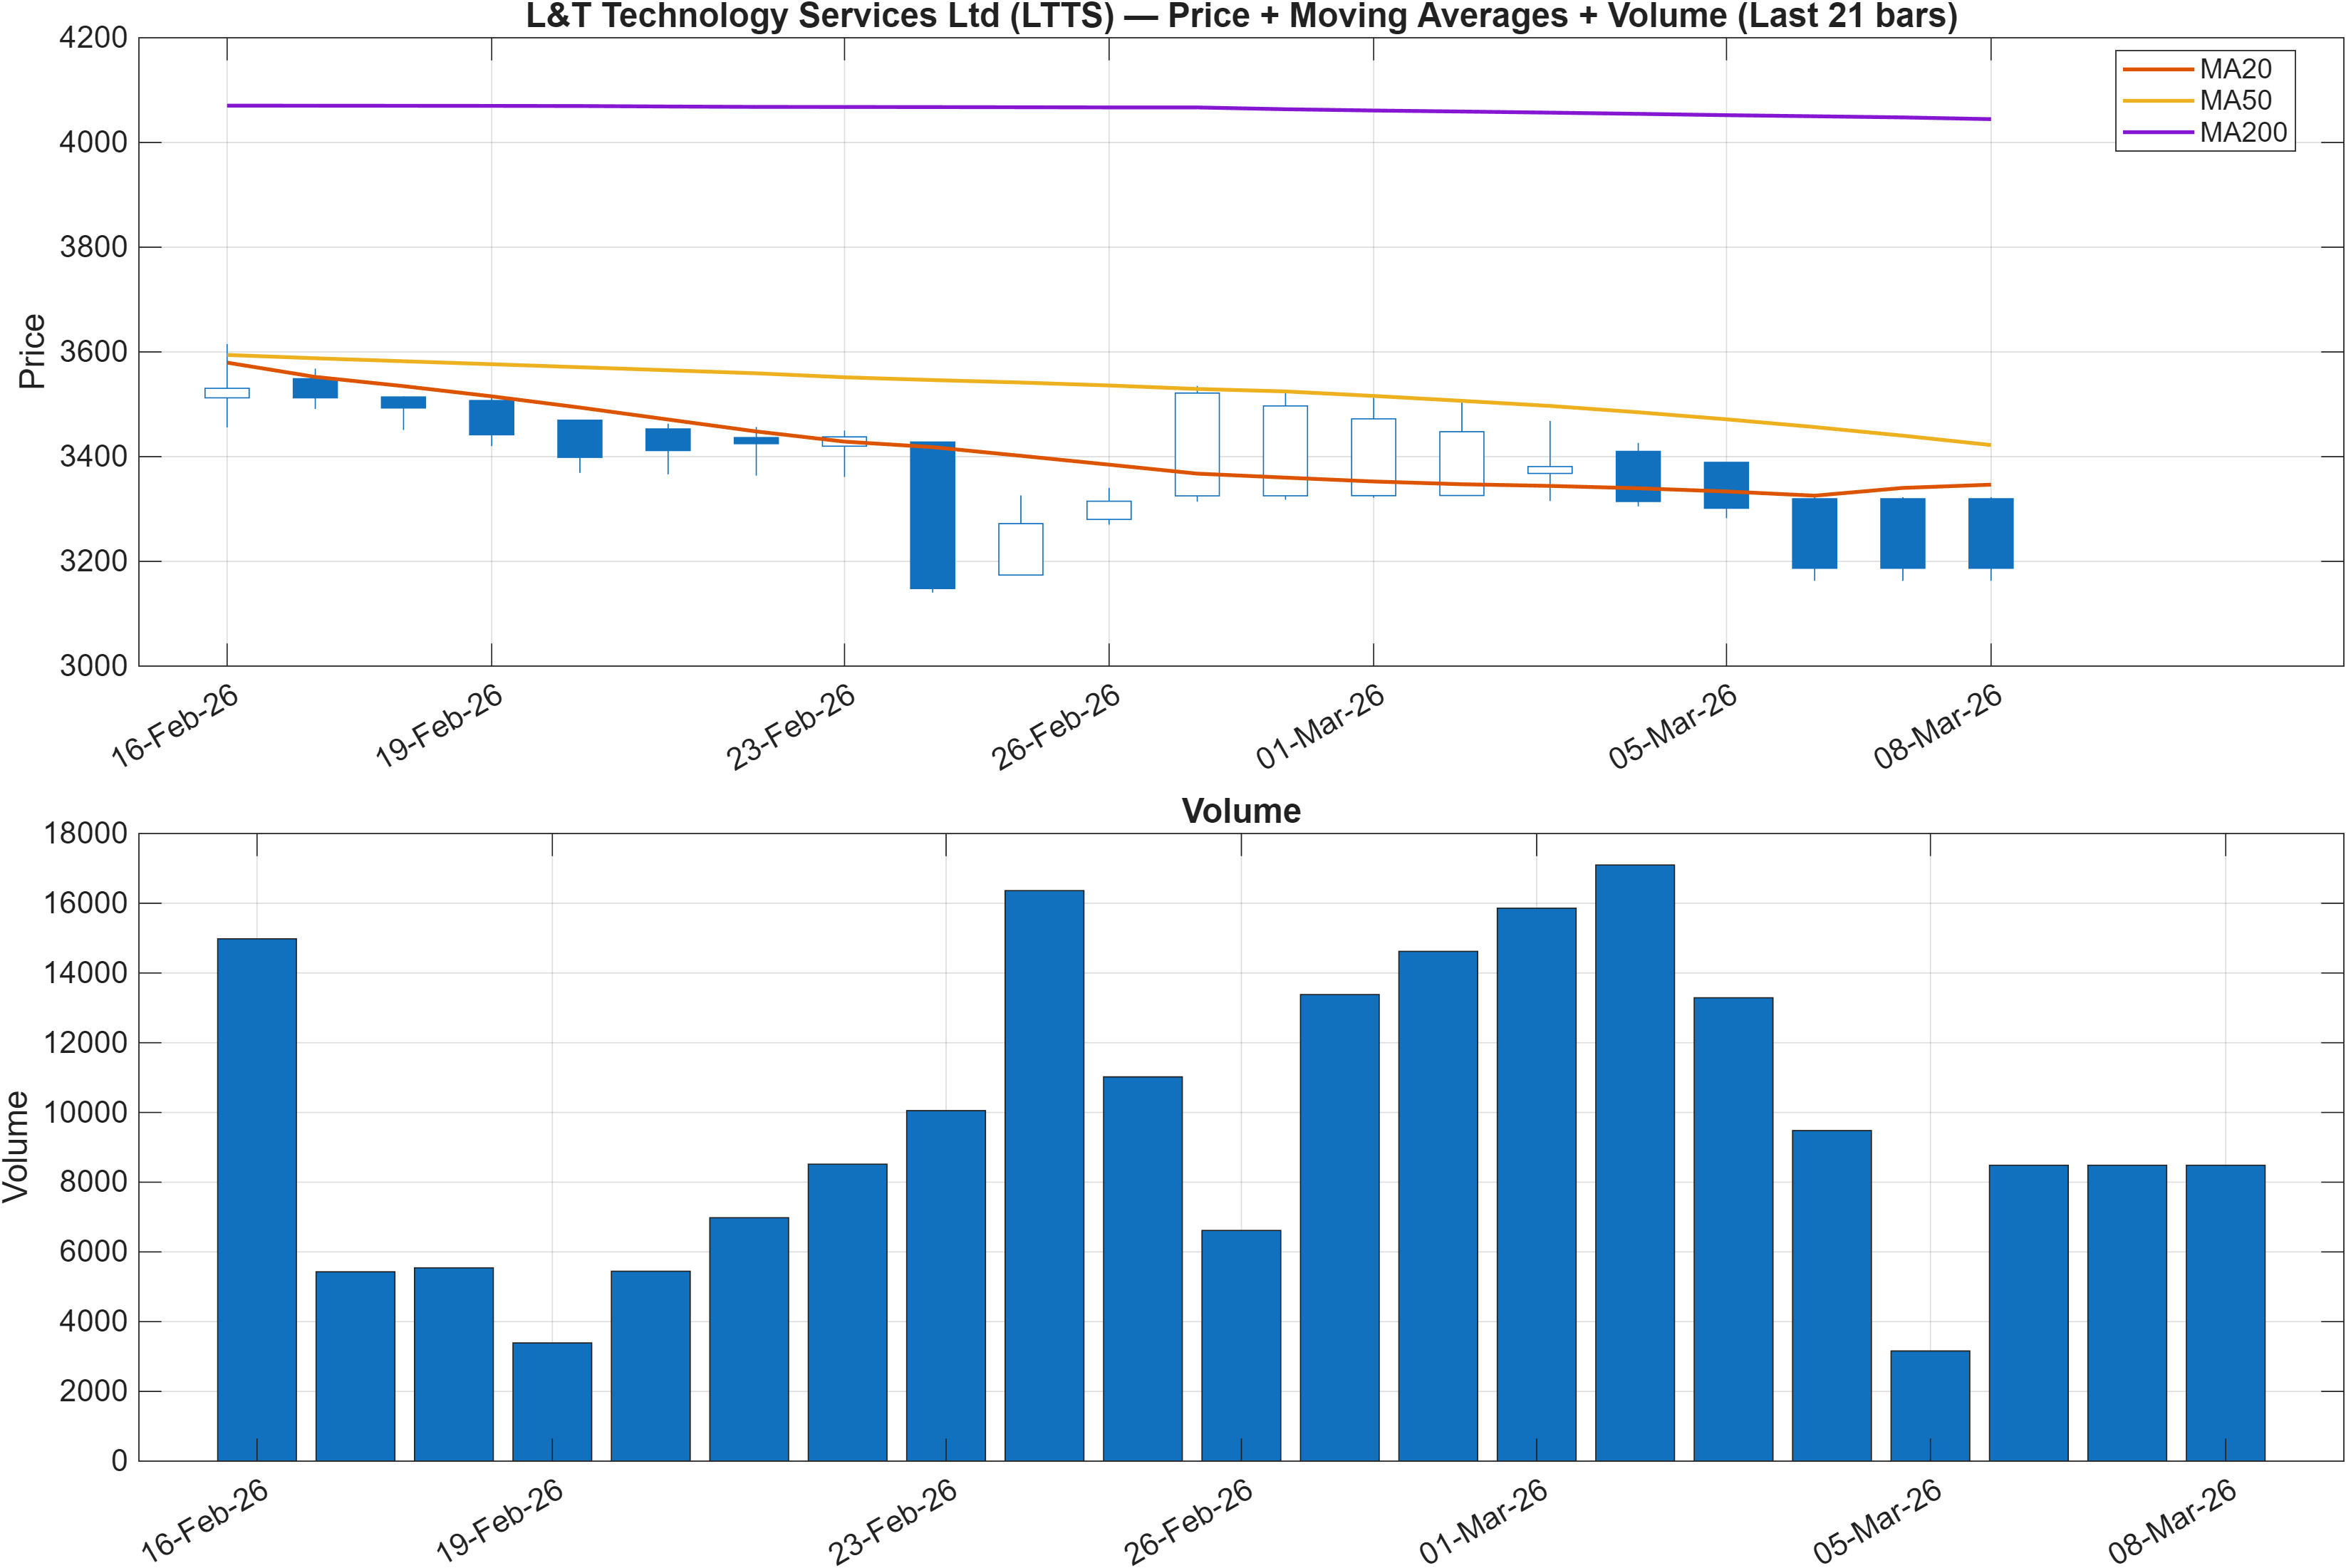
The trend stack is presently defined by a bearish moving-average configuration: Close vs MA50 = Bearish and MA50 vs MA200 = Bearish. This combination typically indicates that (1) price remains below the intermediate trend reference, and (2) the intermediate reference is itself below the long-term reference—conditions associated with constrained rebounds and more selective follow-through.
This is where LTTS’ multi-horizon rank structure becomes analytically useful. A strong longer-horizon rank (such as 6-Monthly #14 and Yearly #30) alongside bearish trend posture can reflect a regime transition: longer-cycle strength exists in the data, but the market’s current path still requires repair. In practice, trend repair is often seen as stabilization above intermediate references, then eventual improvement in the MA50/MA200 relationship—none of which is asserted here, but it frames what “confirmation” would look like.
The key is to avoid treating this as a binary signal. The same asset can hold structurally strong longer-horizon characteristics while being technically heavy in the present. With support identified at 3276.3250 and resistance at 4352.9502, the trend read suggests that upside attempts may be evaluated more skeptically until price action demonstrates acceptance above key overhead supply zones, while downside tests carry higher sensitivity near the cited support.
3) Momentum & volatility dashboard
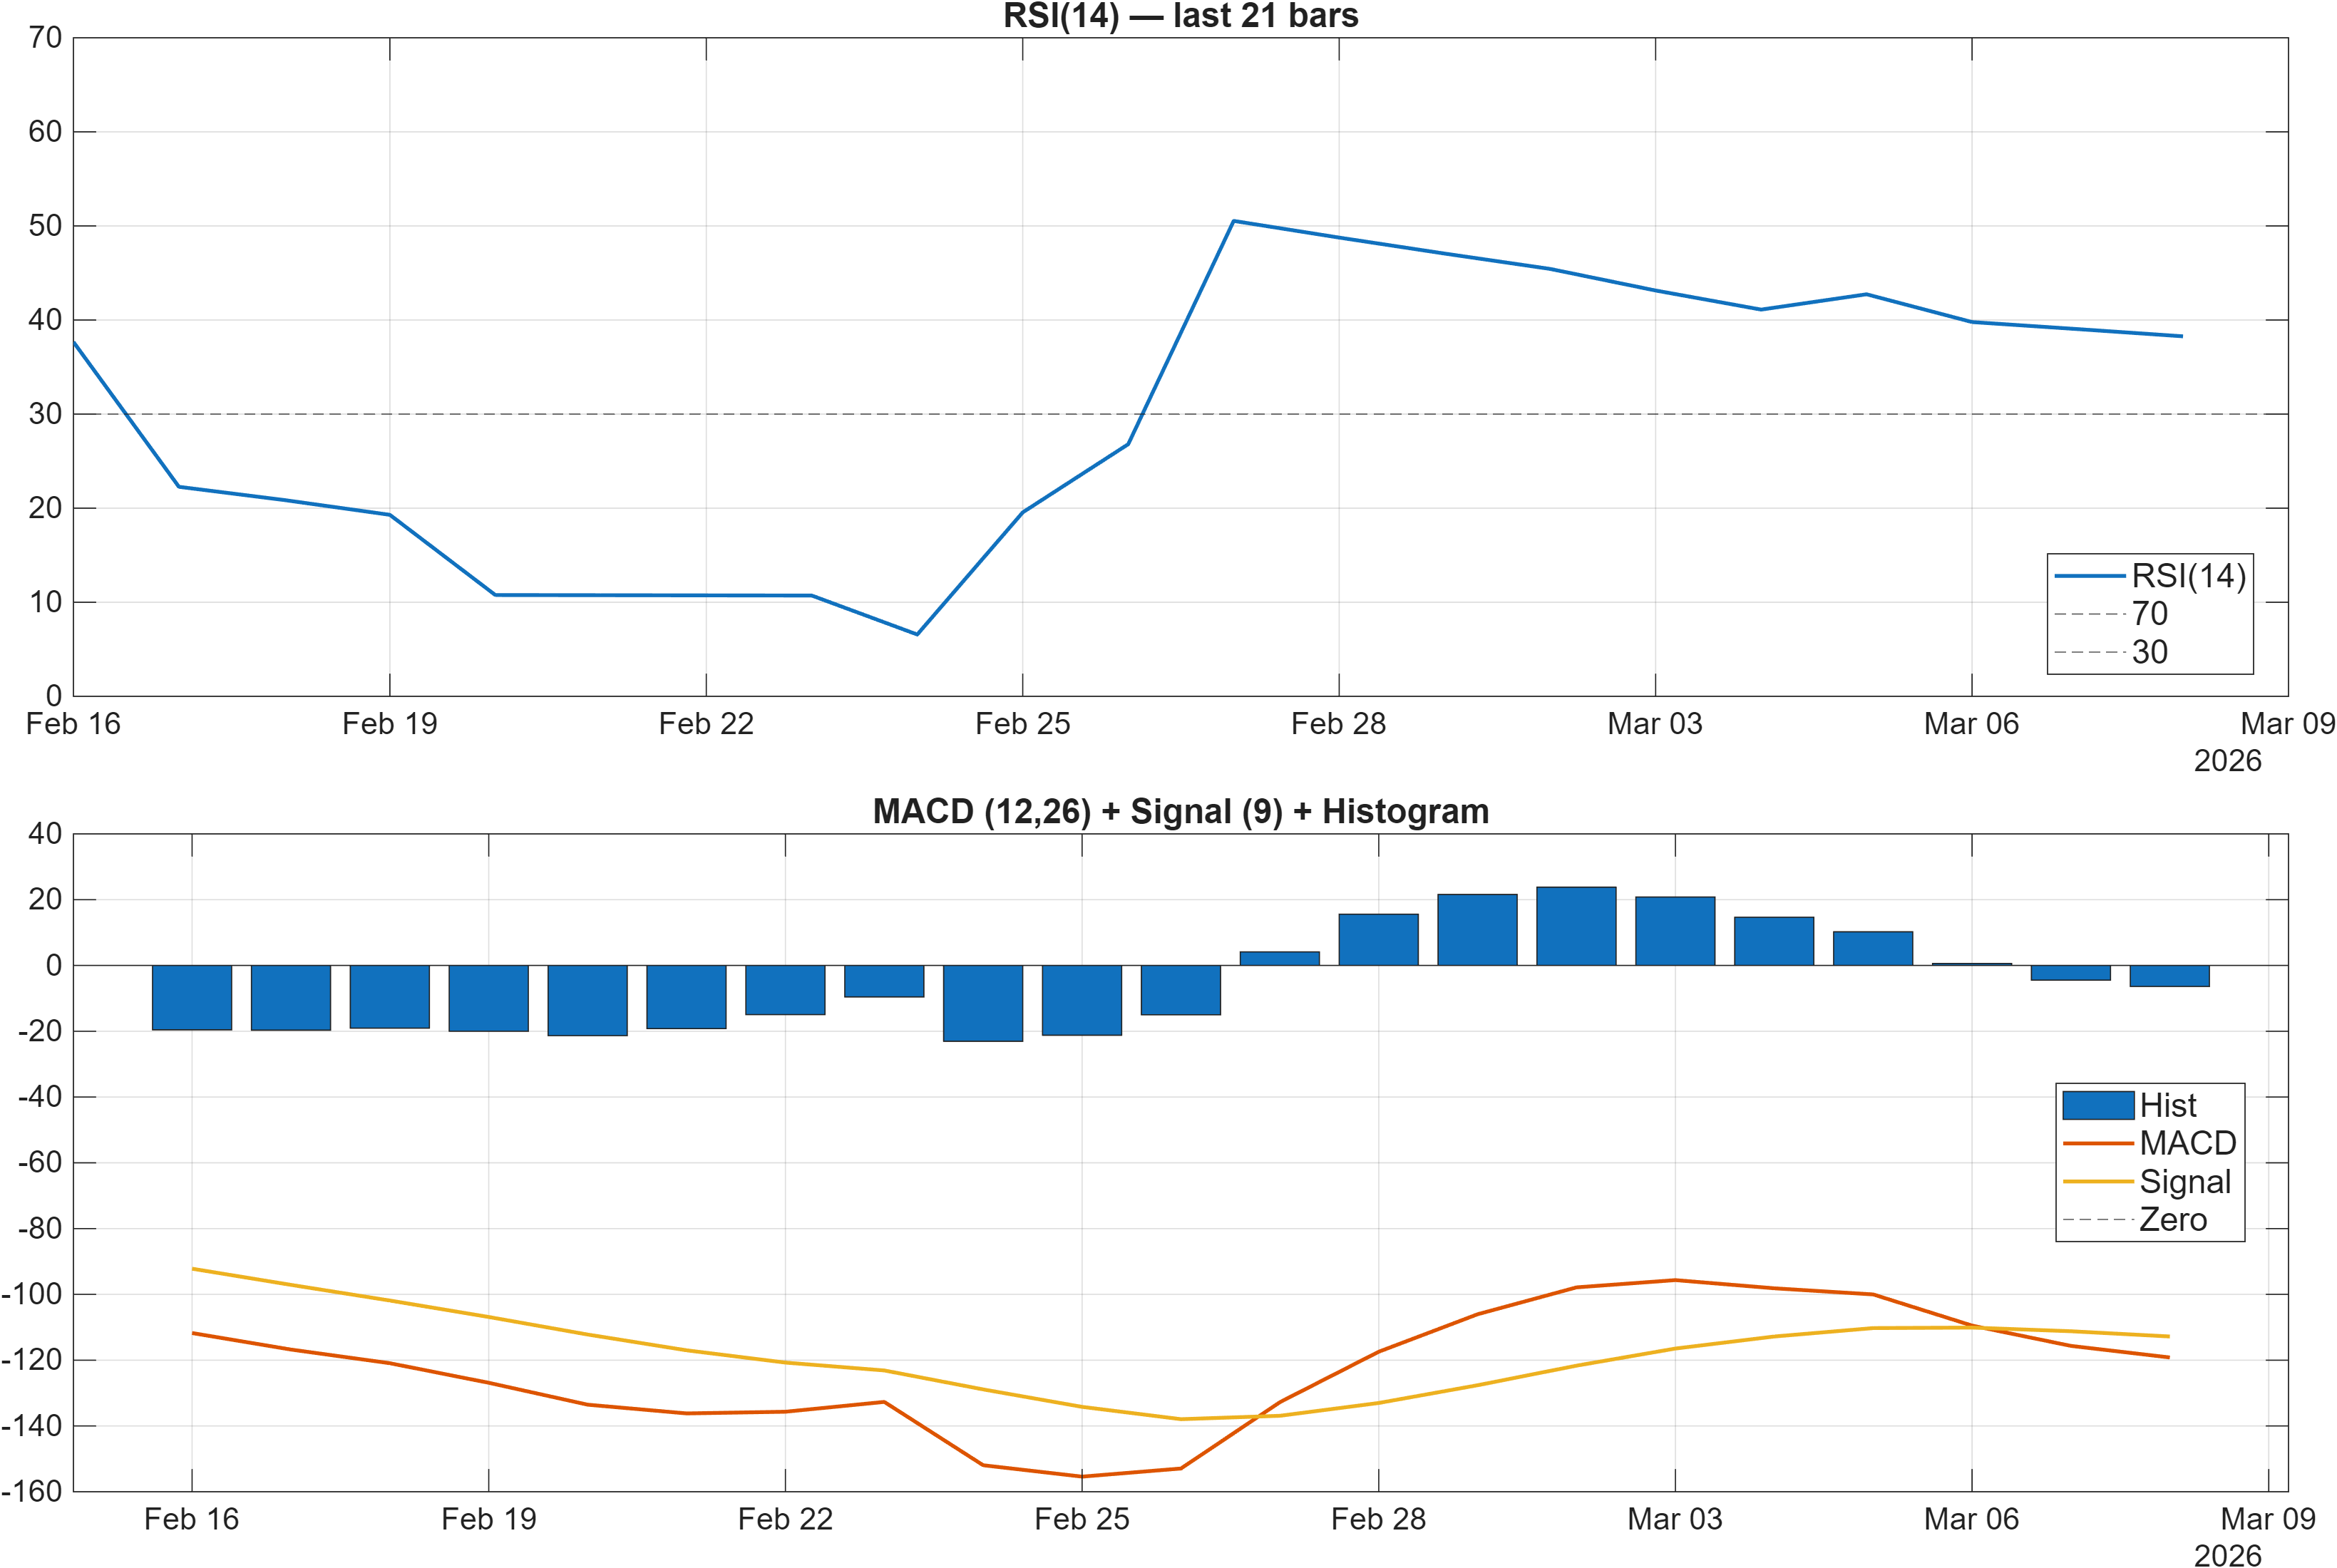
Momentum signals are skewed defensive. The dashboard interpretation flags RSI bias = Bearish, and the signal table confirms RSI(14) at 38.27, a level that commonly aligns with weak swing demand rather than sustained accumulation. Consistent with that, the MACD histogram is -6.3779 (signal table: -6.378, Bearish), indicating negative momentum persistence rather than a completed turn.
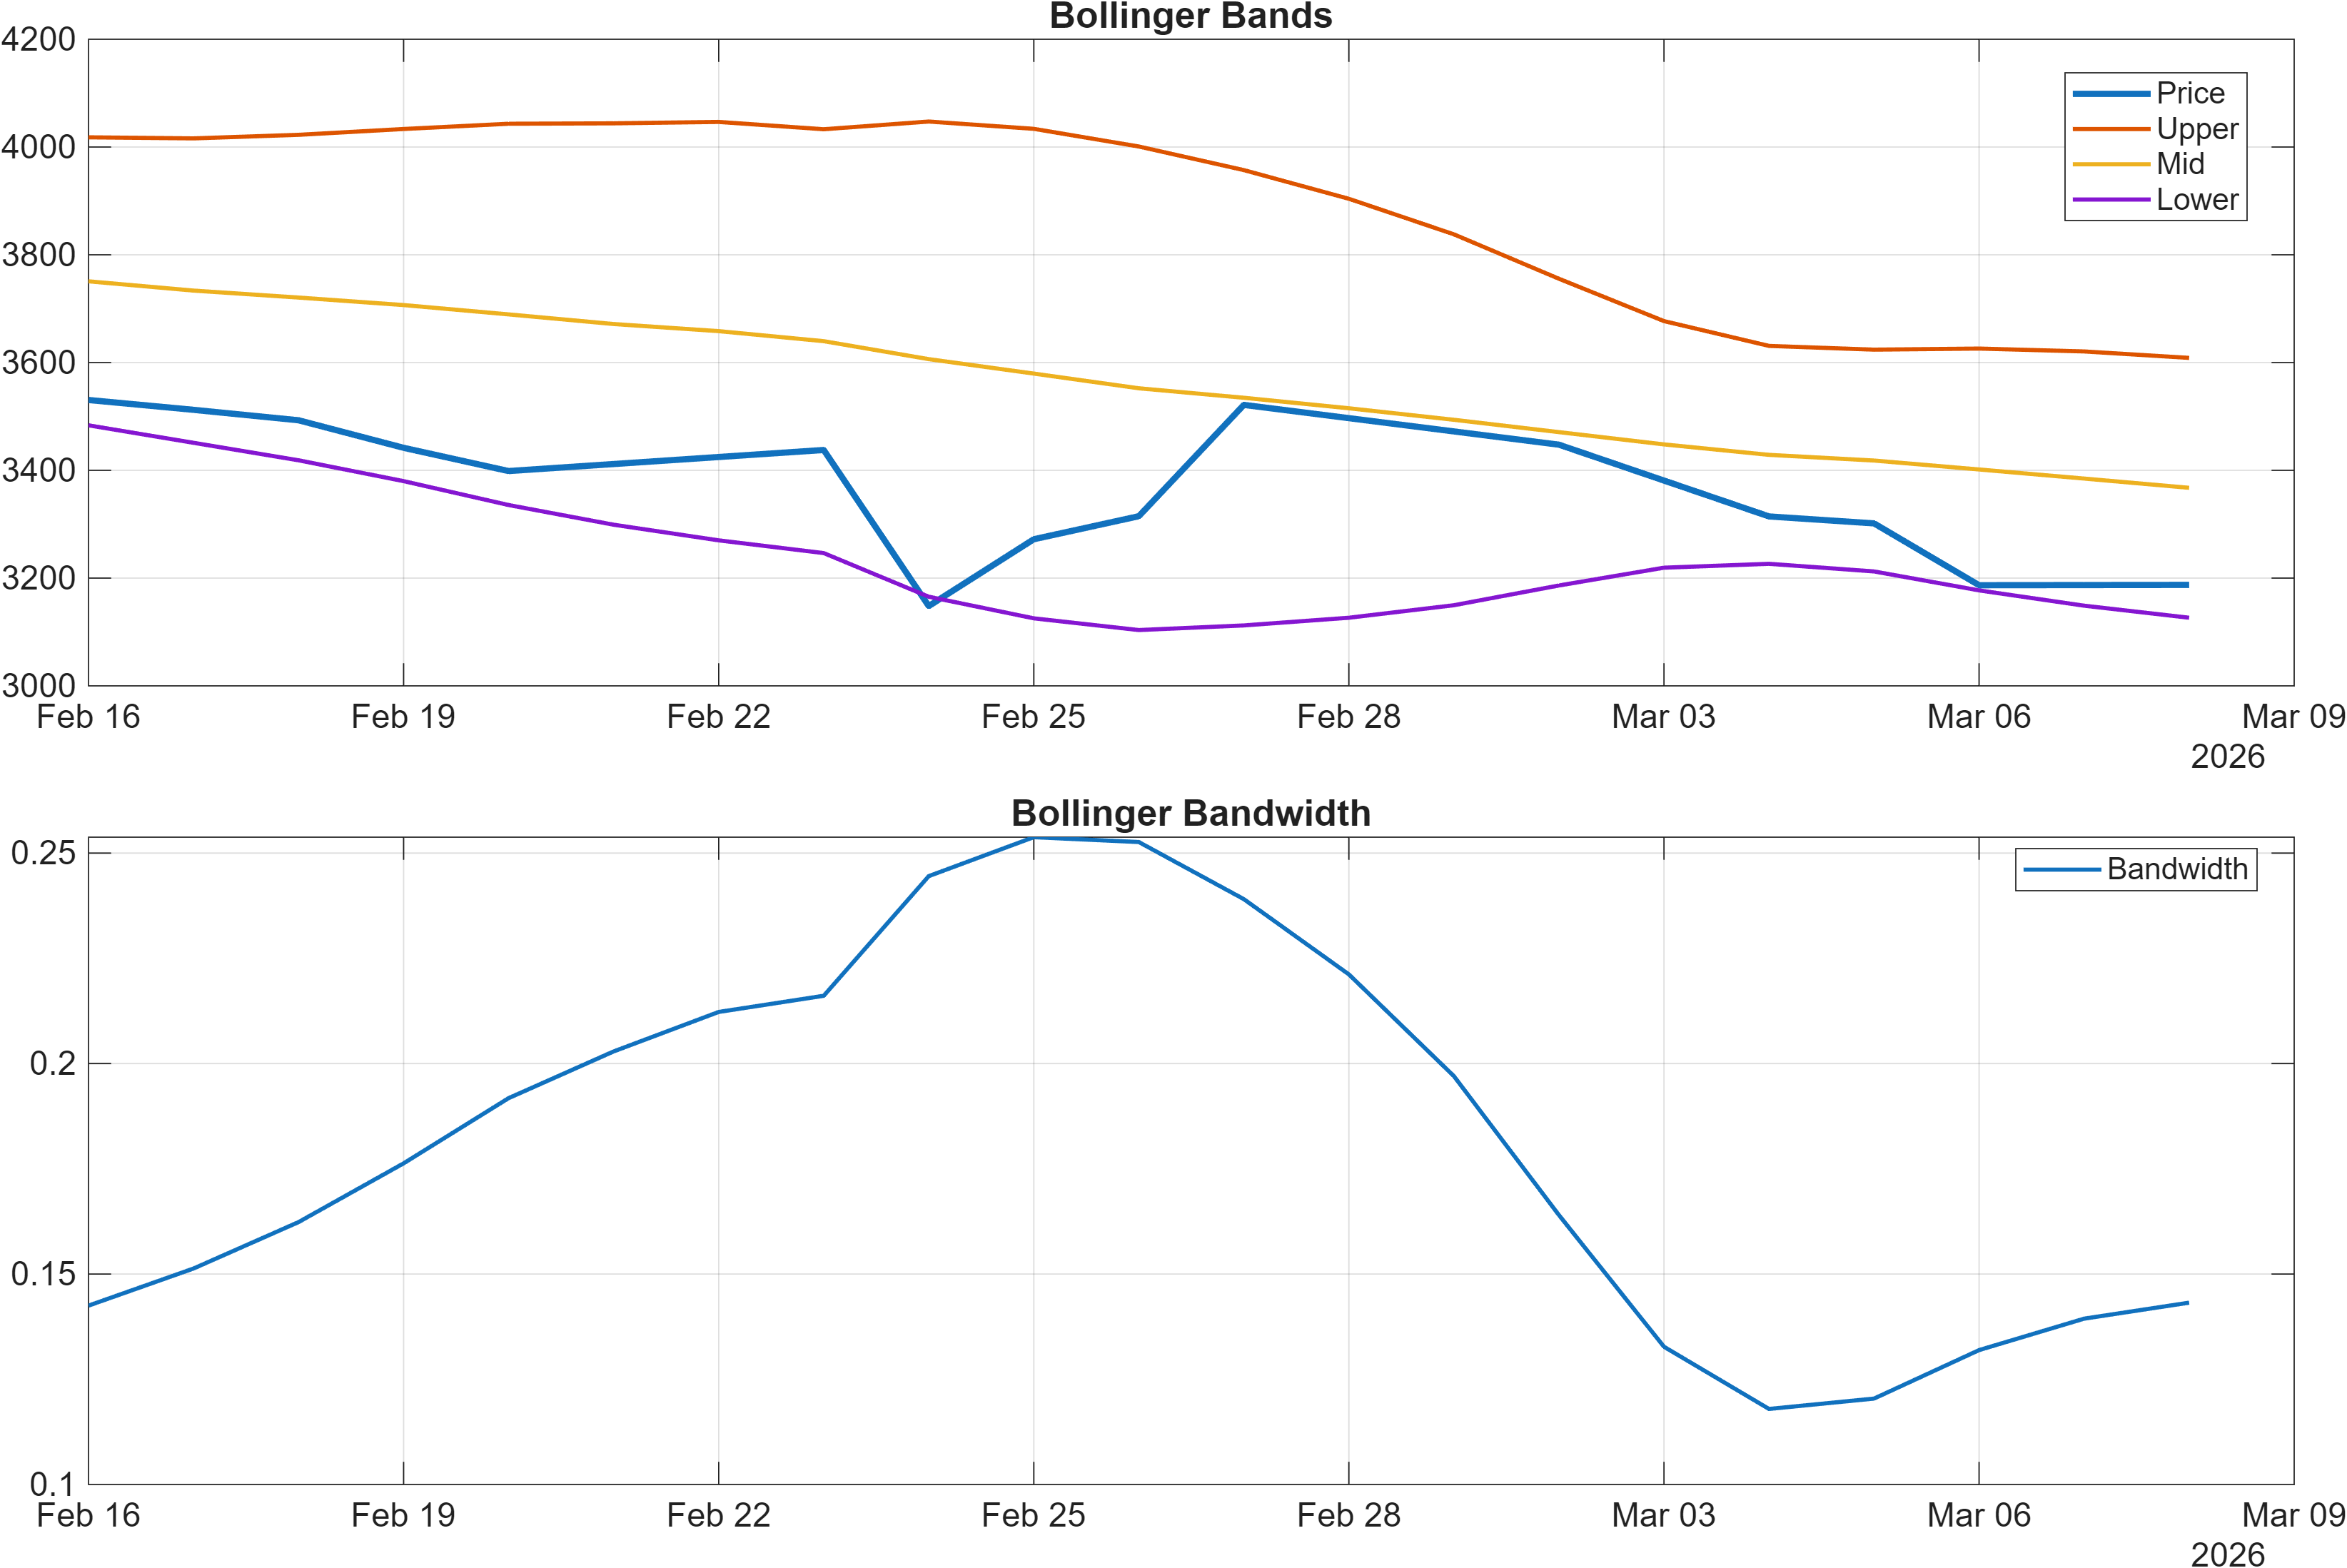
Volatility is better described as contained than extreme: Bollinger bandwidth is 0.1432 (Neutral). A neutral bandwidth regime can coincide with two different market conditions: a base-building process where volatility has contracted after a decline, or a low-energy continuation where downside drift persists without sharp expansion. Discriminating between these usually requires additional confirmation from directional measures and level-based behavior.
Here, the directional evidence leans bearish: the table shows ROC(20) at -9.25 (Bearish) and TS Mom(20) at -325.5 (Bearish), supporting the idea that momentum is still negatively skewed. At the same time, pockets of “snap-back” potential exist in the data: Stoch %K at 6.398 is flagged Bullish, which can occur when price is deeply positioned within its recent range even while broader momentum remains weak. Overall, the dashboard reads as momentum pressure with selective mean-reversion risk, rather than a confirmed momentum reversal.
4) Support / Resistance zones
Support ~ 3276.3250 | Resistance ~ 4352.9502
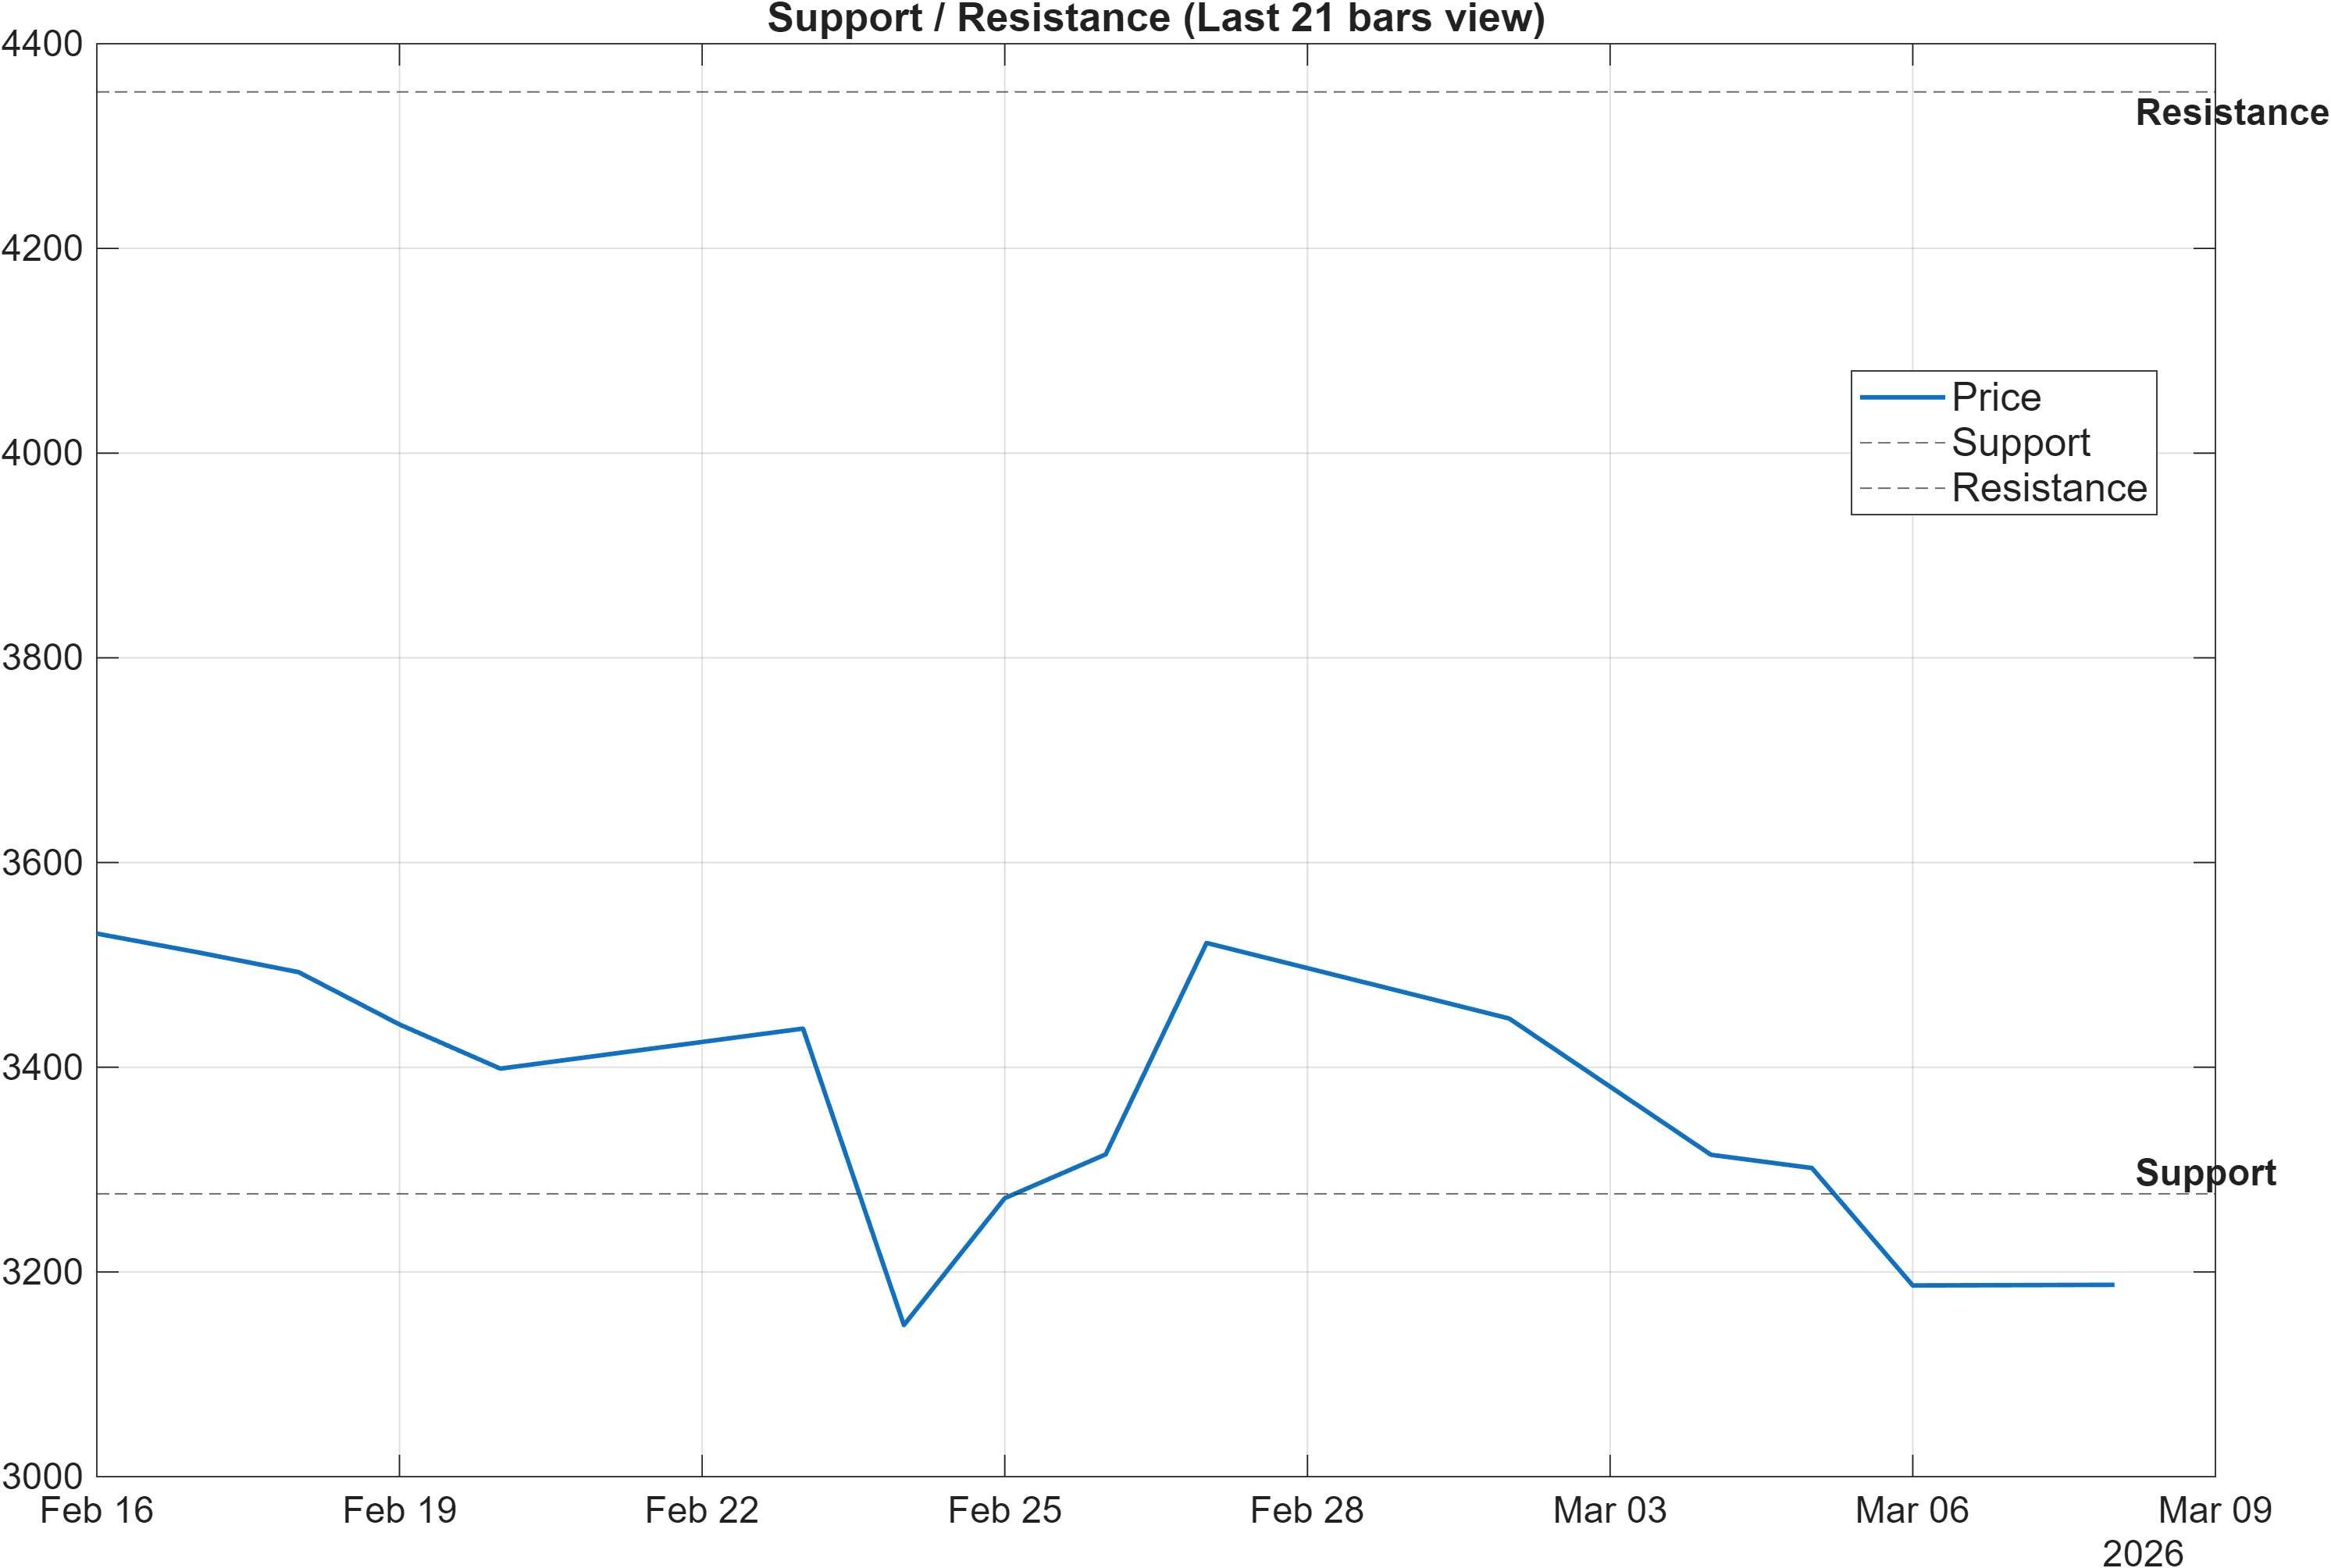
The level map is clean and decision-oriented: 3276.3250 is the primary support reference and 4352.9502 is the primary resistance reference. In a market state where trend signals are bearish (Close vs MA50 bearish; MA50 vs MA200 bearish), resistance often acts as a validation gate—a zone where rallies must prove that demand can absorb supply rather than merely bounce within a downtrend.
The scenario guidance in the dataset is explicit: a break above resistance with volume implies continuation, whereas a close below support implies deterioration risk. With the 18-signal framework leaning bearish (confluence score -0.389 and overall technical score -0.380), the downside invalidation criterion becomes particularly important: level failure would align trend, momentum, and confluence in the same direction.
Conversely, the longer-horizon KGNAI ranks (notably 6-Monthly #14 and Yearly #30) suggest that if price were to reclaim acceptance above the upper zone, the move could represent more than a short-lived bounce. The analysis focus, however, remains on confirmation: the most robust “risk-managed” interpretation is to treat the band between support and resistance as the current probabilistic arena, where direction is not assumed and level interaction dominates the next inference.
5) Quant Technical Dashboard (18 Signals)
KGNAI AI Technical Analysis Score (Deep Reinforcement Learning): Rank #799 out of 1176 (Rank 1 represents the strongest technical positioning and a higher probability of favorable price behavior. As ranks increase toward the maximum, the probability of favorable outcomes weakens and bearish positioning becomes more dominant.) | Label: Neutral | Score: -0.359
18-Signal Technical Confluence Score: -0.389 (Bearish)
Overall Technical Score (18-signal confluence + DRL rank blend): -0.380 (Bearish)
Note: The blended score reflects signal strength weighted against broader AI technical ranking, which may temporarily diverge.
Blended technical score breakdown: -0.380 (Bearish | Bull 4 / Bear 11 / Neutral 3)
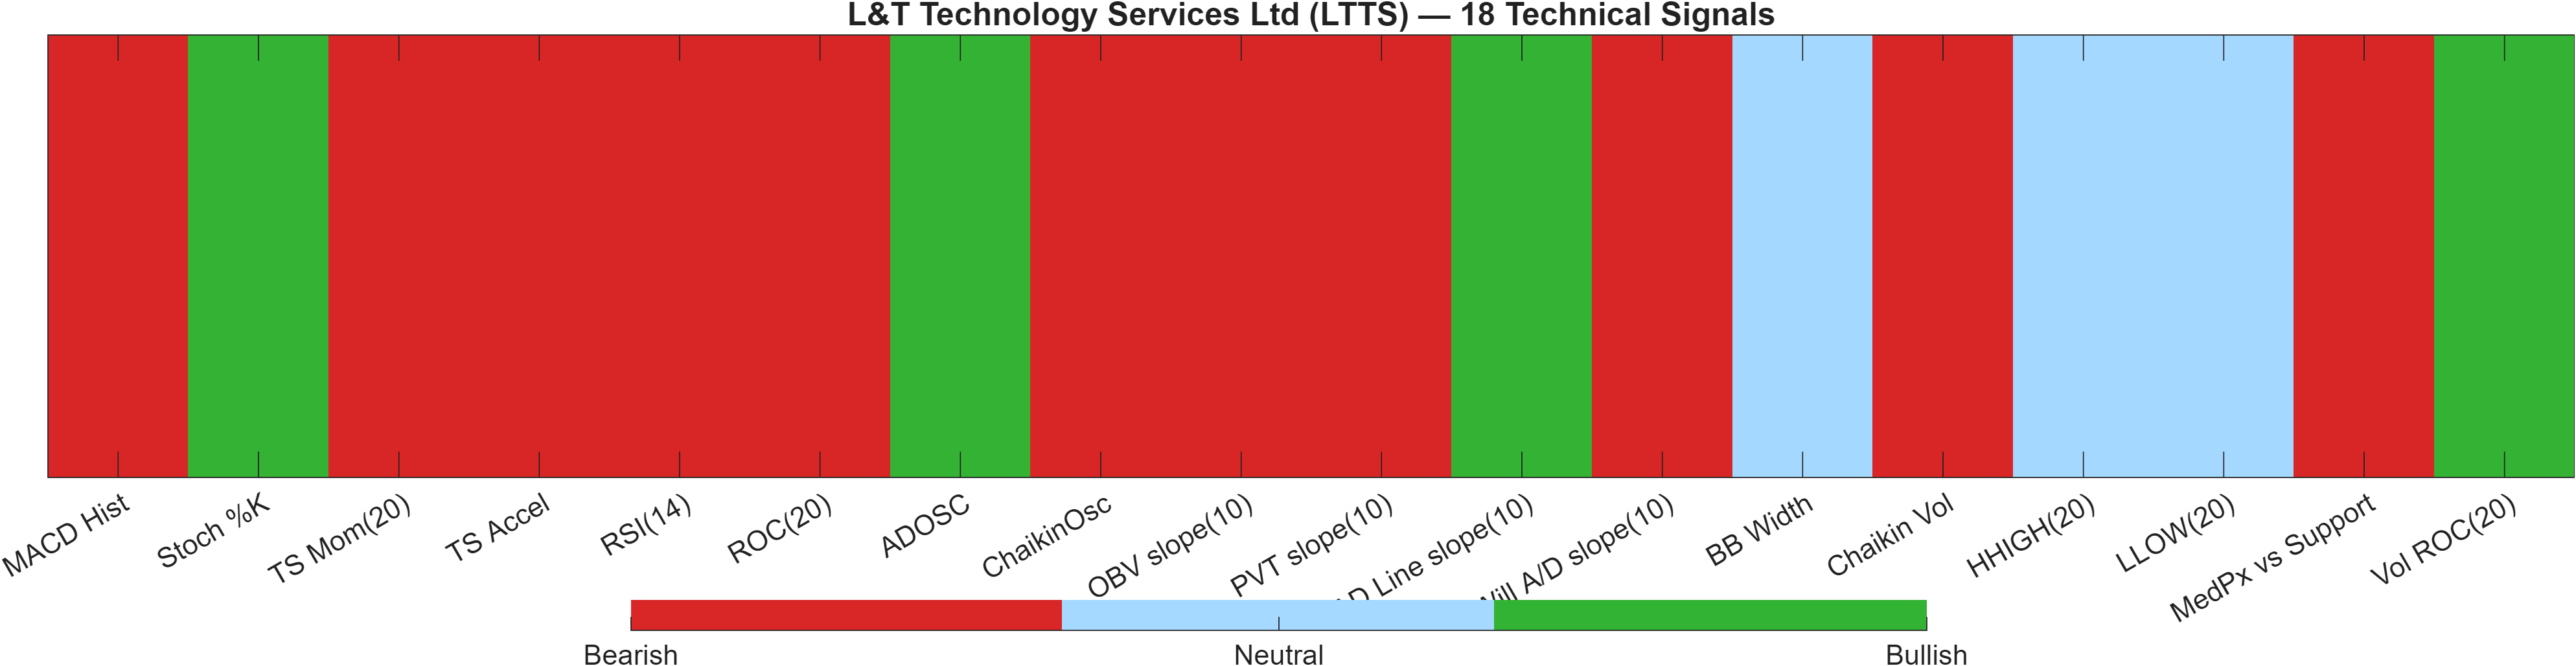
LTTS’ technical state is best described as broad bearish participation with a small cluster of counter-signals. The confluence score is -0.389 (Bearish) and the blended overall technical score is -0.380 (Bearish), with the breakdown showing Bear 11 / Bull 4 / Neutral 3. This distribution matters more than any single indicator: it implies that weakness is not isolated to one corner of the model, and therefore typically needs more than one “good print” to reverse.
The DRL technical rank is #799 (Neutral) with score -0.359, which is directionally consistent with the confluence read but framed as less extreme by the AI ranking layer. That type of mild divergence can occur when the broader pattern library is not fully aligned with current indicator pressure, or when the model interprets the structure as a potentially late-stage move rather than early-stage weakness.
Signal table (Bull/Bear/Neutral)
| Indicator | Value | Signal |
|---|---|---|
| MACD Hist | -6.378 | Bearish |
| Stoch %K | 6.398 | Bullish |
| TS Mom(20) | -325.5 | Bearish |
| TS Accel | -86.25 | Bearish |
| RSI(14) | 38.27 | Bearish |
| ROC(20) | -9.25 | Bearish |
| ADOSC | 8.399 | Bullish |
| ChaikinOsc | -6808 | Bearish |
| OBV slope(10) | -6.861e+04 | Bearish |
| PVT slope(10) | -251.5 | Bearish |
| AD Line slope(10) | 6352 | Bullish |
| Will A/D slope(10) | -353.3 | Bearish |
| BB Width | 0.1432 | Neutral |
| Chaikin Vol | 6.697 | Bearish |
| HHIGH(20) | 3568 | Neutral |
| LLOW(20) | 3140 | Neutral |
| MedPx vs Support | -33.55 | Bearish |
| Vol ROC(20) | 56.26 | Bullish |
Within the signal set, the bearish side is reinforced by negative rate-of-change (-9.25), weak RSI (38.27), and negative volume/flow slopes such as OBV slope(10) at -6.861e+04. The bullish signals (e.g., ADOSC 8.399, AD Line slope(10) 6352, Vol ROC(20) 56.26) suggest intermittent demand or activity bursts, but they remain outnumbered in the confluence. Net: bearish structure with localized counter-pressure, consistent with a market that can bounce but has not yet proven a durable shift.
6) News sentiment + extractive gist
Note: Instrument-specific news matches were not found, so the digest includes broader market/sector headlines. Links are provided for verification.
Sentiment score (avg): 0.085 | Positive: 25% | Neutral: 75% | Negative: 0%
KGNAI AI News Sentiment Score (normalized -1 to +1): 0.90 (as of 2026-01-15) | Label: Bullish | Overall news score: 0.93
Positive Developments
Recent coverage across major financial outlets indicates a mildly constructive tone in parts of the broader market narrative, even where LTTS-specific items are not present in the provided dataset. The quantified distribution is skewed toward neutral coverage (75%), but with a meaningful positive component (25%) and 0% negative in the captured set, which can reduce the probability of headline-driven downside gaps. In addition, the dataset’s normalized sentiment reading is elevated (0.90) with an overall news score of 0.93, implying that the systematic text-processing layer is interpreting the information backdrop as supportive rather than stress-oriented. This constructive bias does not override the bearish technical confluence (-0.380), but it can matter at key levels—particularly if price tests resistance at 4352.9502 and requires incremental demand to convert a rally into acceptance rather than rejection.
Neutral / Mixed Developments
The dominant news classification remains neutral, consistent with a regime where macro/sector commentary is informational and not uniformly directional. In that environment, market participants often place more weight on technical confirmation—such as whether bearish trend conditions (Close vs MA50 and MA50 vs MA200 both bearish) improve—than on narrative momentum. Neutral-heavy coverage can also coincide with dispersion: some segments show relative strength while others remain pressured, which aligns with LTTS’ own horizon split where longer-term ranks are bullish (e.g., 6-Monthly #14) but daily/weekly ranks are neutral and weaker (e.g., Daily #753). As a result, the practical interpretation is not “no impact,” but rather a backdrop that is unlikely to resolve the current technical debate without level-based confirmation.
Negative / Risk Signals
Even with 0% negative in the captured sentiment distribution, risk signals are present in the broader contextual coverage, particularly around volatility episodes, defensive positioning, and drawdowns concentrated in technology-linked names. That matters for LTTS because its current technical profile already reflects fragility: RSI(14) at 38.27 and MACD histogram at -6.3779 point to negative momentum persistence, while the overall 18-signal blend remains bearish (-0.380). In such conditions, external “risk-off” narratives can amplify downside sensitivity near support at 3276.3250, even if volatility is not extreme (bandwidth 0.1432). The key risk framing is therefore conditional: if price action deteriorates below the stated support, broader negative tone may become more market-moving than it appears in the current neutral-heavy sentiment split.
What to monitor next
- Whether price can sustain trade above 4352.9502 alongside improving momentum (MACD histogram moving toward zero).
- Whether downside probes hold 3276.3250 or convert into closes below support.
- Whether volatility expands meaningfully from 0.1432, which may change the range-to-trend balance.
Sources referenced: Reuters, Bloomberg, Yahoo Finance, MarketWatch, Investing.com
7) Sources
Not available in the provided data.
Snapshot: AI Rank (Short–Mid–Long): Mixed (Neutral–Neutral–Bullish) · Technical Confluence: Bearish · Key Levels: Support ~3276.32 | Resistance ~4352.95 · News Sentiment: Neutral
You may also like: How KGNAI AI ranks instruments across global markets
Disclaimer: KGNAI provides AI-generated analytics and educational market commentary only. This is not financial advice. Markets involve risk. Always do your own research.